“placeless power and powerless places” examining the local impact of global supply chains....
TRANSCRIPT

“placeless power and powerless places”
examining the local impact of global supply chains. `insecurity’ in the context of globalisaton and the
ever expanding radii of capital’s organisational control
Anuradha Kalhan

the central proposition
• of the ‘Insecurity Hypothesis’ (IH) is that the economic risk of increased global competition and deregulation is being progressively passed on from the employer to the employee.
• through shortened job tenure, erratic remuneration, variable work, contingent employment and
• institutional changes that remove or reduce the protection and bargaining power of employee in the work place.

the corollary
• Is that widespread Insecurity is damaging- • In the short run, it promotes an employment relationship
based on opportunism, distrust, and low commitment. • The medium to long-term consequence is that the
employers under-invest in skill formation and training because of shortening tenures of work.
• Weakens institutions of collective action bargaining like trade unions that act as networks of trust and cooperation. The feeble trade unions become both a cause and a consequence of mounting insecurity.

the corollary …
•In the long-term, it undermines productivity and economic performance because in times of rapid economic and technological change insufficient management of social and human capital can become the limiting factor to growth. •This last facet has implications for developing countries like India where the impact of global competition may be increasingly passed on to the workers without regard to the medium to long-term consequences of heightened insecurity.• Specially training and upgrading skills which is critical to sustaining competitive advantage.

the corollary …
• For the workers there is a rapidly growing trend of flexibilities-
• organisational, technological and functional, numerical, and wage.
• There is a direct correspondence between flexibility and insecurity .

Export of Indian RMG ( US$)
Year % Growth Rate
1990-1991 to 1996-1997 18.7
1996-1997 to 2001-2002 13.2
2001-2002 to 2006-2007 10.9
2004-2005 to 2009-2010 9.3
2009-2010 to 2014-2015 8.0
Year (US $ millions) Relative % Increase
1987-88 1,403 -1990-91 2,236 59% 1995-96 3,676 64% 2000-01 5,569 51%2004-05 6,561 17% 2005-06 8,504 30%2008-9* 10,300 21%2009-10* 11,300 12%2011-12* 13,700 21%
*Source: Ministry of Commerce and Industry, GOI •Source: Centre for Industrial and Economic Research, Industrial Techno Economic services Pvt. Ltd. New Delhi.•Grown over 6 times in 20 years since 1991

Supply Chain
• Bangalore accounts for 30% of this export
• Contract Manufacturers mostly provide labour and expertise in tailoring, packaging and ready-for-retail services..
– Sometimes get material and technical support• Buyers via their merchandisers Specify Quality, Delivery, Price and
Acceptance criteria. – Organized retail – directly deals with Manufacturers – Eliminates all wholesalers and intermediaries – All the risk of fluctuating demand is placed on the manufacturer and
shifted to the worker.• Management of the global vending and supply chain systems
is the core competence. – Manufacturing and labour are vulnerable to relocation and JIT
supply requirements of global retailers • start up a new large scale garment producing unit only three
months.

survey of firms & workers in Bangalore, 2007
•The goal was -•to empirically evaluate the impact of the export oriented growth of the garment industry of Bangalore on the firm.•And impact on its workers in terms of the conditions of their employment - wages, cost of living and expenditure patterns, working hours, non wage benefits, working conditions, and the state of their unions - so as to evaluate how the gains from trade are distributed.•To determine how labour is controlled in the new international division of labour. •Further very large sourcing of RMG is done by global retail giants like Wal-Mart and others known for their special price tactics with local producers. The sample therefore specially sought to identify workers in factories supplying to Wal-Mart so as to comment on the effects of monopoly capital in retail on the workers in the supply chain.

sampled workers : control mechanisms
• Randomly sampled outside factory gates. 134 workers.
• Average age 28 years • Modal age has two peaks at age 20 and 32 • 85 percent workforce is less than 35 years old • 0.75 million workers in the Bangalore RMG
industry • More than 30 year old industry

control…
• Majority (75 percent) are women . • The younger workers have higher entry level education /
skill then their older counterparts .• A closer gendered analysis shows that even the young
female workforce entering these factories is better educated than their older counterparts.
• 78 percent in the age group of 18-25 years were class ten graduates (matriculates) and above in terms of basic education.
• On the whole, however, the female worker is likely to be lesser educated than her male counterpart, respective ratio of matriculates being 38 percent and 58 percent.
• Men are in supervisory posts , floor in charge most often.

migrant labour : by linguistic group
Linguistic Group Count Percentage
Kanada 92 68.7
Tamil 22 16.4
Telugu 14 10.4
Malayalam 2 1.5
Marathi 2 1.5
Hindi 0 0.0
Other 2 1.5

social control…
Caste Group Count %
OBC 98 73.1
SC 21 15.7
ST 6 4.5
Other 9 6.7

job description-hierarchy of control
Job Description Number Percentage
1- Helper 22 16.4
2- Tailor 73 54.4
3- Feed Helper 13 9.7
4- Packer 3 2.2
5- Batch Master 1 0.7
6- Supervisor 3 2.2
7- Floor in charge 2 1.5
8- Quality Control 2 1.5
9- Mechanic 4 3.0
10-Misc 11 8.2

job status
Status Count %
Permanent 6 4.5
Temporary 128 95.5
Contract 0 0
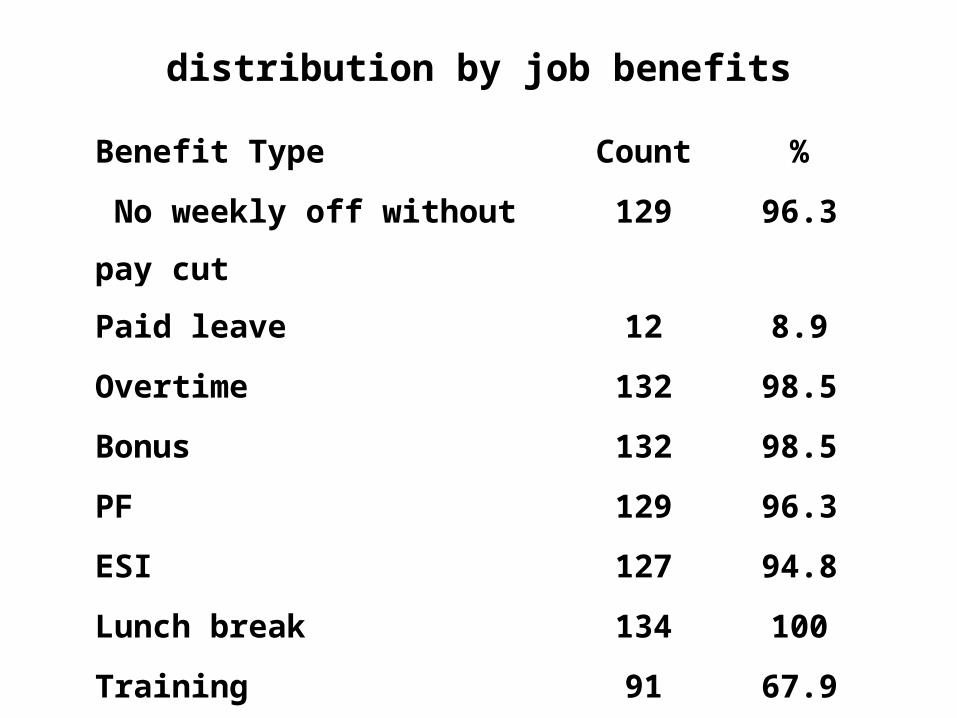
distribution by job benefits
Benefit Type Count %
No weekly off without pay cut 129 96.3
Paid leave 12 8.9
Overtime 132 98.5
Bonus 132 98.5
PF 129 96.3
ESI 127 94.8
Lunch break 134 100
Training 91 67.9

distribution by years in current employment Vs. status
Job Status / Years
of service
1 2 3 4 5 6
Permanent 4 2 - - - -
Temporary 57 41 20 4 3 3

human resource management: control mechanisms
• In all these factories HRM practices are such that there is an unwritten understanding that dismissal without notice is a permanent reality.
• Work intensification and longer work hours.• Nearly all the workers are permanently
temporary. • There are no strong unions to create a distinction
between permanent and temporary workers. • There is such a poor rate of unionisation among
the workers that dismissed workers can only hope to recover their Provident fund dues from one employer to join another factory if they do not resist the dismissal.

resistance....• Workers also respond by high rates of
absenteeism, turnover and frequent revisits to their villages only to return in search of reemployment in the same or another factory.
• Since there is no paid leave what so ever, seasonal journeys to the native village or illness are likely to result in a change of employer or break in service.
• Worker suicides• Therefore, average years of current
employment were 1.9 for the sampled workers.

hrm: control mechanisms
• Hardly any rules are enforced in respect of paid leave, site-accident, overtime etc. and there are no industry norms.
• Most workers are dismissed at will and are obliged to submit a resignation letter to claim their PF dues.
• Most critically, attempts at Trade union formation in the factories are aggressively eliminated so that less than 10% of the workers are unionised in the true sense according to union leaders.
• The rest (90%) are members of various factory level workers welfare committees made by the management to meet statutory requirements and with an eye to international export requirements, or welfare associations floated by NGOs

distribution by wage level
Wage Level: less than equal to
Female % offemales
Male % ofmales
I - Rs.1500 7 7 1 2.9II - Rs 2000 23 23 2 5.9III - Rs 2500 11 11 2 5.9IV - Rs 3000 11 11 5 14.7V - Rs 3500 6 6 1 2.9VI - Rs 4500 40 40 14 41.1VII - Rs 5000 0 0 1 2.9VIII - Rs 6000 2 2 6 17.6IX - >Rs 6000 0 0 2 5.9Total 100 34
Distribution by Wage Level vs. Gender
• Average Monthly Income Rs.3284 . • At higher levels of wages males dominated.

control mechanisms in the supply chain
• The third party audits are a means for the importing firms to ensure reliability, quality, and delivery standards.
• Auditors very superficially ensure that their suppliers do not seriously violate the laws of the land for short term gains and while doing so control them.
• The minimal benefits of these audits seem to be the enforcement of minimum legal standards of the exporting countries whatever they may be.
• The state on the other hand is obliged to keep these standards low and breech able to help manufacturers; so much so that statutory minimum wages fixed by the state (Rs90/day in 2007) for example, do not even routinely keep up with inflation in essential food prices.

living in the metro - cost of living (April 2007)
• Sample size 33 worker families• Average family size 4.3 members• Average Earners per family 2.2• Average non-earning dependents per family 2.1• Families with school going children 18• Average school going for such families 1.8• Average school going for the sample 1.0• Average income of other family members Rs. 3961/ pm• Average own income of worker Rs. 3284/
month• Total average family income Rs, 7245/ month

living in the metro - family expenditure
•Average per family Rs. Cumulative / month•Transport 1412 1412•Rent (26 families) 1311 2723•Medical 667 3390•School fees 229 3619•Electricity 100 3719•Water 89 3808•Total average family income 7245 / month• As can be seen from the figure above just the average monthly non-food overhead expenses of the workers family at Rs. 3808 are greater than the workers average monthly wage of Rs 3284. This less than living wage cannot sustain the family unit. •The compulsion for these women to work at the low wage rate is in turn a result of their general dispossession, the high cost of urban living and the less than living wages of their partners as well. •The average family has 2.2 wage earners and the other wage earner on an average have a similar low wages situation. The number of school going children per family at 1.8 is also low for such a young workforce indicating perhaps the inability of the family unit to afford to keep all their children in city schools.

not far from the poverty line
• The combined family income minus metro overhead expenditures, leaves only Rs800 for food per head/ month.
• That is Rs26.66 per person per day in 2007.• Given the rapid rise in food prices in the last few
years alone and the collapse of the PDS the RMG workers could well be hovering close to the poverty line. There is hardly any scope for saving and much for indebtedness.
• These conclusions are similar to those found in other surveys of the urban poor in India (Kundu Amitabh, 1993). Indeed it is increasingly true of the urban working poor globally (Davis Mike, 2005)

the manufacturer: in the supply chain
Three Levels of RG sector firms•The very large scale: vertically integrated - yarn to retail Produce own or licensed foreign brands, e g, Raymond, Arvind and Century.• Large and medium size: suppliers to every well known Indian and foreign brands like Nike, Reebok, Adidas, Columbia, Wal-Mart, Marks and Spencer, Gap, Levis, and Polo.
– Many can augment workforce to 2-3 times the normal and also operating multiple shifts.
• Small: subcontract for large firms or manufacture for the local unbranded garment market.


managing firm’s power
• All large and medium firms diversify clients to reduce risk; sell to WMT, OCR and local markets.
• Selling price to WMT was under continuous pressure, so were profit margins. But volumes grew . Compensate profit margins by selling to OCR.
• Upgrade technology and scale.• Controlling workforce and labour costs.• Lobby for subsidy, tax breaks and flexible labour
laws and state support to fill skill gap.

skill gap
• To cope with the post MFA world The National Textile Policy 2000 was framed, which laid down an ambitious export target of $50 billion for the year 2010.
• Generating 12 million jobs of which six million will be skilled.
• The policy also introduced a series of measures like dereserving garments (except knitting and knit wear) from the list of industries reserved for SSI, permitting 100 percent FDI in garment units.
• State support-Later Central Budgets a) reduced import duty on textile and garment making machinery and other raw materials used in the industry cheaper, b) introduced a Technology Up gradation Fund, c) Capital Subsidy scheme and other measures in an attempt to induce the sector’s expansion to capture the global market.

skill gap
• The Textile Commissioner, Government of India, J.N. Singh was quoted as saying that “labour plays a significant role in labour intensive industries like garment. The training gap is the widest in the garment industry to the extent of 30-40 percent between demand and supply. The gap is likely to widen with the increase in investment” (Business India, 2007).
• The Union textile ministry had formulated a major plan to set up an Rs three billion facility to moderanise and expand training facilities in the 11th five-year plan.
• Production managers describe high turnover as a significant problem.
• So why have the wages and lock in incentives like attractive wage increments, pension funds not been introduced? Instead there are reports of industry representations demanding more flexibility in the labour laws and a longer work week (Business Standard, 2006).

skill gap continues….. June 2012
• The AEPC lead compliance project DISHA – Driving Industry towards Sustainable Human Capital Advancement is being slammed by Industry
• It is floundering for lack of direction from the council and support by the industry. Industry want help with their audits instead !!
• Is it a case of coordination failure and sub-optimal-equilibrium that can only be corrected by a more powerful state intervention?