placement stability study - children and family research ...placement stability study executive...
TRANSCRIPT

PLACEMENT STABILITY STUDY
Mary Ann Hartnett, Ph.D. School of Social Service Administration
University of Chicago
Lydia Falconnier, MSW, LCSW School of Social Service Administration
University of Chicago
Sonya Leathers, MA School of Social Service Administration
University of Chicago
Mark Testa, Ph.D. School of Social Service Administration
University of Chicago
This research was supported by the Children and Family Research Center, School of Social Work, University of Illinois at Urbana-Champaign, which is funded in part by the Illinois Department of Children and Family Services.


PLACEMENT STABILITY STUDY
Executive Summary
Unmet Child Behavioral Needs: The most compelling finding of this study is
that there is a gap between children’s behavioral needs and the foster care system’s
performance in meeting those needs. Both foster parents and caseworkers reported that
unmet child behavioral need was by far the most important reason for placement changes.
Forty-five percent (45%) of foster parents and 39% of caseworkers reported that
the inability to meet the child’s special behavioral needs within the foster placement was
the first or second most important reason for the placement’s ending.
With no change in the current system of services, over 1,550 children (67% of all
children who experience 3 or more moves in family foster care in a six month period)
will continue to experience an escalating cycle of unmet need and unstable care, never
staying in a placement for a year or longer.
Correlates of Stabilized Care: Foster children, who had earlier experienced
multiple placements but who had since stabilized in a foster home, profile differently than
children who continue to experience multiple placements. Controlling for age and length
of time in the current placement, stabilized children were:
1. More likely to receive therapy;
2. Rated as less delinquent and oppositional/aggressive;
3. Viewed as less attached to their birth mother; and
4. More likely to be placed with foster parents who are rated by caseworkers as competent and caring.
Individualized Care vs. Specialized Homes: The study found that children are
more likely to be in the stabilized group, particularly delinquent and

PLACEMENT STABILITY STUDY HARTNETT, FALCONNIER, LEATHERS, TESTA
UNIVERSITY OF ILLINOIS AT URBANA-CHAMPAIGN 2
oppositional/aggressive youth, if they are in specialized foster care rather than regular
foster homes. Additionally, stability is enhanced for children who are “stepped down”
and remain in the same home. Among all children who were in specialized foster care on
March 30, 1996, the study found:
Children who were physically moved from a specialized foster home to a regular foster home experienced three times as many subsequent moves than children who remained in the same home.
Children who were “stepped down” to regular foster care within the same home experienced more stable care than other children.
Quality Foster Parenting: Caseworkers report that children in stable homes
receive more attention, acceptance, affection, and overall better care from their foster
parents. The skill and ability of foster parents to accept and manage
oppositional/aggressive behavior were especially important. The training of foster
parents in basic knowledge of child development and the reasons children exhibit
oppositional/aggressive behaviors seems to be warranted.
Policy-Related Moves: Many placement changes are made for policy reasons. A
high level of movement is built into the system.
Emergency Placements: Nineteen per cent (19%) of sampled children moved
because the placement was intended only as an emergency placement; 32% of emergency
placements lasted more than 90 days. This finding suggests that many foster homes are
accepting children who need longer-term placements, believing that the placement is for
emergency purposes only. This arrangement may reduce the commitment of a foster
parent to deal with difficult behavior problems. These temporary placements may be
necessary because of foster home shortages, however, they contribute to high levels of
movement.
Family-integrity Moves: Thirty-two percent (32%) of placement changes are
made to maintain the integrity of the family, e.g., placements with siblings, transfers to
relatives, and movements closer to the birth home. Twenty-four percent (24%) of these

JUNE 1999 PLACEMENT STABILITY STUDY
CHILDREN AND FAMILY RESEARCH CENTER 3
moves occurred after the child had been in the foster home for a year or more, which
means that these children were removed from stable living arrangements. Even though
this pattern of disrupting stable living arrangements to promote family integrity involves
only 4 percent of all children with multiple moves, the benefits of this policy should be
carefully weighed against the costs of terminating stable placements with non-kin.
Evaluation of Need: Based on the results of this study, the Office of the
Research Director recommends the creation of a structured system of individualized
needs-assessment, service planning, and routine evaluation for all children with
behavioral needs, regardless of placement type. The evaluation of need system would
provide:
1. Structured clinical assessment of child need;
2. Systematic collection and analysis of clinical data;
3. Individualized service planning: If needed services could not be provided within the home (e.g. therapy, transportation, behavioral management), a service plan would be tailored to the placement.
4. Enhanced care provisions: If needed services can best be provided within the home, individualized care plans with the provider will be developed.
5. Routine evaluation of the status of high-need children, the services they are receiving, and the services they need.
6. Predictive models of children who are at risk of experiencing unstable care, so needs can be identified early and appropriate plans can be made to minimize placement instability.


PLACEMENT STABILITY STUDY
I. Introduction
There is consensus among DCFS staff that too many children experience too
many different placements in foster care. Multiple placement moves disrupt the
continuity of children’s relationships with care givers and community, their education,
and their medical care. The Department has responded to this concern by conducting the
current study of placement movement.
Among all children in placement on June 30, 1998, 37.5 percent have experienced
three or more placement moves (i.e., four or more placements).1 While this cross-
sectional sample under-represents children with short placement histories (who have less
opportunity for movement than children in longer-term placement), the 38 percent
nonetheless constitutes over 19,000 children who are currently in care. Between 1984
and 1998, 41% of children whose cases were closed after they had been in care between 4
and 5 years experienced three or more moves.2 Regardless of the ways in which we count
placement moves, there is a significant stability problem affecting large numbers of
DCFS wards.
The Placement Stability Study builds upon the DCFS Office of Quality
Assurance’s tracking of children with three or more moves within a six-month period and
determines the reasons why one placement ended and develops a profile of children who
are at risk of experiencing multiple moves. The two main research questions answered
by the study are:
1Throughout this report, runaways, hospitalizations, returning home, “paper” moves, and adoption by the foster family were not counted as moves. When children returned to the same foster home they were in just prior to a hospitalization, runaway, etc., placement in the foster home was counted just once.
2Appendix A contains an analysis of stability in Cook and downstate regions, and in different types of placements.

PLACEMENT STABILITY STUDY HARTNETT, FALCONNIER, LEATHERS, TESTA
UNIVERSITY OF ILLINOIS AT URBANA-CHAMPAIGN 6
1. Why do some children experience multiple moves in foster care?
2. What accounts for the stability achieved by children who previously experienced multiple moves in foster care?
The study also analyzes complete cohorts of children using the Integrated
Database to report on movement trends over time and present day patterns of movement.
A special analysis of children in specialized foster care is also provided. There are a total
of four different samples that are analyzed in the report:
Sample 1: A random sample of 300 children with histories of unstable care for whom caseworkers and foster parents were interviewed and information from case records was gathered;
Sample 2: All children in placement on June 30, 1998;
Sample 3: Children placed in specialized foster care on 3/30/96 who were “stepped down” to traditional care (N = 919); and,
Sample 4: Children who were included in the 3/30/96 Levels of Care Review (N = 4,852) or who received in-person assessments in 1997–98 (N = 89).
The report is organized into eight sections: I. Introduction; II. Literature Review;
III. Stability Survey Data Analyses; IV. Differences Between Stable and Disrupted
Foster Care Placements; V. Follow-up of Stable Children; VI. Secondary Data Analysis
of Movement within Specialized Foster Care; and VII. Conclusions and
Recommendations.
II. Literature Review: What is Known about the Causes and Consequences of Placement Instability?
A search for all studies published between 1975 and 1998 on the topic of
placement instability was conducted. Practice and theoretical articles were not reviewed

JUNE 1999 PLACEMENT STABILITY STUDY
CHILDREN AND FAMILY RESEARCH CENTER 7
unless original, empirical research findings were presented. A total of 25 studies were
reviewed. As described below, many of these studies have methodological problems that
limit the value of the findings presented. However, support for the role of child
characteristics and child welfare system determined factors in explaining the placement
stability is indicated. In this section, the findings of these studies are briefly summarized.
Child Characteristics: Behavior Problems, Age and Race
Several studies have identified children’s behavioral problems as a contributor to
placement instability. Studies examining the relationship of behavior problems to
subsequent moves have found a strong association in both bivariate and multivariate
analyses. In a longitudinal study conducted by Fanshel and Shinn (1978), behavior
problems as measured at entry into care were predictive of greater movement over a five
year period after controlling for demographic characteristics of the child. This study
provides the best test of the role of behavioral problems in leading to placement
disruption, as a large cohort of children (N = 624) was followed prospectively over time.
Results from two other multivariate studies also indicate that behavior problems present
increased risk for placement disruption (Pardeck, 1984; Stone and Stone, 1983), and
several other studies that did not use random samples and multivariate analyses also
support the potential importance of behavior problems in determining placement
disruption (Campbell et al., 1979; Cooper et al., 1987; Palmer, 1996; Proch and Taber,
1987; Widom, 1991).
Several studies have indicated that older children are more likely to experience
placement disruptions than younger children (Pardeck, 1984; Walsh and Walsh, 1990).
As older children are more likely to have serious behavior problems, this association may
be due to differences in the types of behavior problems among children of different ages.
Alternatively, this association could be due to lower tolerances among foster parents to
deal with the developmental needs of an adolescent as compared to a younger child.

PLACEMENT STABILITY STUDY HARTNETT, FALCONNIER, LEATHERS, TESTA
UNIVERSITY OF ILLINOIS AT URBANA-CHAMPAIGN 8
Multivariate analyses will be needed to sort out these relationships. It may also be that
white children are more likely to experience disruptions (Olsen,1982; Pardeck, 1984).
Again, multivariate analyses will be needed to assess whether racial differences are due
to race or another variable. These differences may be related to the types of placement
experienced by white and African American children; African American children are
more likely to reside in home of relative placements, which provide more stability in care
than non-relative care.
Children’s Service Needs and Foster Parent Training and Support
There is some evidence that the child welfare system can prevent placement
disruption by providing more services and foster parent training. Stone and Stone (1983)
found that greater case worker contacts and rapport building with foster parents was
associated with increased placement stability. After controlling for child behavior
problems, foster parent rapport with the supervising agency continued to be predictive of
stability. Pardeck’s finding that caseworker turnover is negatively associated with
placement stability potentially supports Stone and Stone’s findings; high caseworker
turnover would prohibit the development of strong relationships between foster families
and agencies. However, this association might be due to child behavior problems, which
could not be controlled in Pardeck’s analysis; children with greater behavioral
disturbance may be both more likely to experience caseworker turnover and placement
movement (Pardeck, 1984).
The potential for enhanced foster parent services and stipends to increase
placement stability is suggested by a study that included 72 children in foster care
between 1988 and 1990 (Chamberlain, Moreland, and Reid, 1992). Foster parents were
randomly assigned to one of three groups: first, those who were provided weekly group
training sessions focusing on handling child behavior problems, telephone calls three
times a week, and an additional $70 a month stipend; second, those who received only

JUNE 1999 PLACEMENT STABILITY STUDY
CHILDREN AND FAMILY RESEARCH CENTER 9
the enhanced stipend; and third, a “services as usual” control group that received only
$25 each time they participated in one of four assessments. Children in the group that
received enhanced stipends and services had significantly longer placements and fewer
placement disruptions (p < .1) than children in the stipend only or the control group: 29%
of those in the intervention groups as compared to 53% of those in the control group
experienced a disrupted placement. Children in the intervention groups also exhibited
fewer behavior problems over time, suggesting that differences in placement stability
may have been the result of changes in behavior problems during the course of the
placement (Ibid, 1992).
Boyd and Remy (1978) provide additional support for the importance of foster
parent training in a study including 167 foster parents who were licensed in 1973.
Particularly for inexperienced foster parents, training appeared to significantly reduce
placement disruption, even after controlling for child behavior problems and number of
previous placements.
Programs providing assessments and intensive service planning to children with
special behavioral needs have also been shown to have a positive effect on placement
stability. Taber and Proch (1987) report that the Chicago Services Project significantly
decreased the number of moves among a sample of 51 adolescents with histories of
previous placement disruptions. The Chicago Services Project provided a comprehensive
assessment, service planning prior to placement, and a signed agreement with provider
agencies to assure that services were provided as specified by the service plan. The
number of moves that the adolescents experienced after receiving the program’s services
was less than half the number that they experienced in the same time period prior to
receiving services (Proch and Taber, 1987).
PLACEMENT STABILITY STUDY HARTNETT, FALCONNIER, LEATHERS, TESTA
UNIVERSITY OF ILLINOIS AT URBANA-CHAMPAIGN 10
Characteristics of the Foster Family and the Placement Experience
A study conducted by Walsh and Walsh (1990) of 51 children placed in a highly
specialized foster care program suggests that characteristics of foster families may
influence placement stability among children placed in specialized programs. These
types of homes were more likely to provide stable placements: homes with foster parents
who had been married a longer period of time, with foster fathers who were emotionally
involved with the child, and in which case notes indicated that the atmosphere was over-
nurturing or smothering. These results are limited by not including behavior problems as
a control variable and by measuring all variables using only case records.
The potential importance of foster family characteristics is also supported by
research suggesting that the foster parent’s years of experience (Boyd and Remy, 1978)
and the “goodness of fit” between foster family and child (Doelling and Johnson, 1990)
may predict placement success. Specifically, placements with foster mothers with rigid
temperaments who cared for children with negative moods have been rated as less
successful by caseworkers than other placements. Assuming that placements rated as less
successful are those that are more likely to disrupt, this finding may indicate that finding
foster parents with certain personality characteristics is particularly important when
placing difficult children.
It is unclear how birth children and other foster children in the home affect
placement stability, as mixed effects have been reported (Caultley and Aldridge, 1973;
Kraus, 1971; Merrithew, 1996): some studies have found that the presence of birth or
foster children appeared to stabilize placements, while other studies have found no effects
or that the presence of birth or foster children was associated with higher rates of
disruption. However, foster families that choose to foster children in order to meet the
needs of their own children may be less likely to provide stable care (Kraus, 1971).

JUNE 1999 PLACEMENT STABILITY STUDY
CHILDREN AND FAMILY RESEARCH CENTER 11
Sibling Separation
Separation of siblings who are placed in foster care may also be related to
placement instability (Berridge and Cleaver, 1987; Staff and Fein, 1992). Unfortunately,
neither of the studies conducted controlled for factors which might explain the apparent
relationship between separations and placement disruptions. Siblings who are initially
placed separately or who are separated from their siblings after an initial joint placement
are likely to be more disturbed than siblings who are placed together (Aldridge and
Cautley, 1976; Staff et al, 1993). This selection bias may be responsible for the
association between separating siblings and placement disruption.
Parental Alcoholism and Visitation
Alcoholism of biological parents may also influence placement stability (Cooper
et al., 1987; Pardeck, 1984). Again, however, these studies did not control for children’s
behavioral disturbance, which might be responsible for this association. Alternatively,
alcoholic parents might present more problems for foster parents during visits or other
contacts, leading to a request for the child to be removed.
Changes in patterns of parental visiting may lead to placement instability
(Blackwell, 1987; Millham et al., 1986). Again, an obvious limitation of these studies is
their bivariate analyses; although it may be that children whose parents’ visiting
decreased became more behaviorally disturbed and had to be moved after the decrease in
visiting, children whose parents visited less frequently over time may have been more
disturbed before entering care.
Parental involvement in preparing children for out-of-home placement has also
been linked to placement stability. In a study of 184 children, Palmer (1996) reports that
children who were prepared for placement by their parents were significantly less likely
to experience multiple placements in their first 18 months of care, after controlling for
child behavior problems. It is possible that those parents who were able to participate in

PLACEMENT STABILITY STUDY HARTNETT, FALCONNIER, LEATHERS, TESTA
UNIVERSITY OF ILLINOIS AT URBANA-CHAMPAIGN 12
pre-placement preparation were less likely to be abusive or substance abusing, factors
which might explain this relationship; or, it may be that children who are prepared for
placement are less likely to sabotage their placements, leading to greater stability in care.
Consequences of Moves for Children
Unfortunately, little research on the consequences of placement movement has
been conducted in the past twenty years. Fanshel and Shinn’s study involving the cohort
of children entering care in 1966 is one of the few studies that attempted to assess the
effects of placement movement on children after controlling for behavioral disturbance at
entry into care. In this study, number of placements did not significantly predict
behavioral disturbance after five years in care (Fanshel and Shinn, 1978). Fanshel’s later
study (1980) also did not detect serious negative effects of placement movement on
behavioral adjustment after controlling for behavior at entry into care.
There is some evidence that placement movement may affect foster children’s
attachments to their foster parents (Leathers, unpublished data). Among a sample of 57
young adolescent boys, number of previous moves was found to significantly contribute
to weaker attachments to foster families, after controlling for behavioral disturbance at
entry into care. As this study involved retrospective measurement of behavioral
disturbance at entry, however, these results may be unreliable. A prospective,
longitudinal study is needed to assess the effects of placement disruption on child- level
outcomes. Research addressing the potential effects on foster and biological families is
also needed, in order to understand how placement disruptions may affect others in the
child’s life.
Summary
Child behavior problems have been consistently shown to contribute to placement
instability. Interventions that reduce behavior problems such as foster parent training in

JUNE 1999 PLACEMENT STABILITY STUDY
CHILDREN AND FAMILY RESEARCH CENTER 13
behavioral modification and programs providing structured assessment and service
planning have been shown to reduce placement movement among high-risk children.
These findings suggest that the child welfare system could influence placement stability
by providing services and training programs focused on reducing behavioral disturbance.
Child characteristics other than behavioral disturbance have not been consistently
shown to influence placement stability. Only the child’s age may have some relationship
to placement movement, with older children having a greater risk for movement.
Parental characteristics may have some relationship to movement; the children of parents
who abuse alcohol may be more likely to experience disruptions than other foster
children, and decreases in parental visitation are also associated with placement
disruption. Foster family characteristics have also been associated with movement.
Matching certain foster mother temperament characteristics with child characteristics
may decrease risk for disruption. To understand whether these relationships are causal,
however, requires that more comprehensive research be completed.
III. Stability Survey Data Analyses
This section of the report focuses on why children move and how stability is
achieved for children with histories of multiple moves. Data were collected from both
primary and secondary sources. A random sample of 302 children was drawn from the
Integrated Database for which case studies were conducted. Two samples of children
were drawn:
1. The Movement Group: Children who had experienced one or more moves in the six months preceding June 30, 1998 and;
2. The Stabilized Group: Children who had experienced one or more moves in the six-month period between 1/1/97 and 6/30/97and who were currently residing in a placement that had lasted at least one year.

PLACEMENT STABILITY STUDY HARTNETT, FALCONNIER, LEATHERS, TESTA
UNIVERSITY OF ILLINOIS AT URBANA-CHAMPAIGN 14
Including a comparison group of cases in which instability was followed by a
period of stability enabled us to compare children who share a history of placement
instability, but who differ in terms of whether placement stability had been achieved.
Thus, our two samples of children belong to the same population, but have different
stability outcomes. By including children who experienced only one move, the study
findings may be generalized to a broad group of children in foster care. A final sample
selection criterion was that children’s most recent move was from a regular or specialized
foster home. We excluded cases in which the current or most recent placement was in
the home of a relative (which tends to be more stable care) or in a group or institutional
setting (which is typically short-term care). Considering all of our sampling criteria, the
Stability Study sample represents approximately 12.3 percent (6,640 out of 54,095)
children in placement on June 30, 1998 (see Table 1).3 Data were weighted in our
analyses to reflect the actual prevalence of children in foster care who met our sampling
criteria.
We interviewed foster parents and caseworkers who were either currently
involved with the case (fo r stabilized children) or who were involved during the last
placement from which the child exited (the movement group). Interviews were
completed with 260 foster parents (an 86% response rate), and 274 caseworkers (a 91%
response rate). Both foster parent and caseworker interest in and cooperation with the
study were commendable. Interviews were completed by telephone by Masters level
social work students at the School of Social Service Administration at The University of
Chicago and by one professional interviewer. Interviews with foster parents took on
average one hour to complete, while the shorter caseworker interviews took on average
15 minutes.
3Children on runaway, returned home, or in a hospital were not included in the count of children in placement.

JUNE 1999 PLACEMENT STABILITY STUDY
CHILDREN AND FAMILY RESEARCH CENTER 15
Table 1. Frequency of Children in Care on 6/30/98 Experiencing Different Numbers of Placements
Number of Placements
Frequency Percent Cumulative Percent
1 15,297 28.3 28.3
2 10,646 19.7 48.0
3 7,854 14.5 62.5
4 5,331 9.9 72.3
5 3,729 6.9 79.2
6 2,810 5.2 84.4
7 1,949 3.6 88.0
8 or more 6,479 12.0 100
Total 54,095 100 100
Record abstractions were completed for 53% of the sample: all current and prior
placements (within the past 5 years) were included. Record abstractions were completed
by the social work students in Cook County and by DCFS Office of Quality Assurance
staff in downstate regions. Abstractions required 3–7 hours to complete. The collection
of data from the case records of sampled children provided historical data on children’s
placement experiences. These data were analyzed to determine the nature of differences
between children in the stable and the movement groups. Sampling probability weights
were applied for all analyses. The findings of the record abstraction analyses support the
findings from the interview analysis and allow further sights into why children move and
the nature of unmet needs among children in the movement group.

PLACEMENT STABILITY STUDY HARTNETT, FALCONNIER, LEATHERS, TESTA
UNIVERSITY OF ILLINOIS AT URBANA-CHAMPAIGN 16
FIGURE 1First or Second Most Important Reasons for Placement Termination:
Reported by Foster Parents
0
5
10
15
20
25
30
35
40
45
50
Unmet C
hild Beha
vioral
Need
Other U
nmet C
hild Need
s
Other R
easons
Foster
Parent
Issues
Moved to
Join R
elative
s/Sibli
ngs
Emerg
ency P
lacement
Agency
Proble
ms
Adoptive
Home w
as Foun
d
Reasons
Per
cent
age
2nd Most Important Reason
Most Important Reason

JUNE 1999 PLACEMENT STABILITY STUDY
CHILDREN AND FAMILY RESEARCH CENTER 17
FIGURE 2First or Second Most Important Reasons for Placement Termination:
Reported by Caseworkers
0
5
10
15
20
25
30
35
40
45
Unmet C
hild Beha
vioral
Need
Other U
nmet C
hild Need
s
Other R
easons
Foster
Parent
Issues
Moved to
Join R
elative
s/Sibli
ngs
Emerg
ency P
lacement
Agency
Problem
s
Adoptive
Home w
as Foun
d
Reasons
Perc
enta
ge
2nd Most Important ReasonMost Important Reason

PLACEMENT STABILITY STUDY HARTNETT, FALCONNIER, LEATHERS, TESTA
UNIVERSITY OF ILLINOIS AT URBANA-CHAMPAIGN 18
Reasons for Placement Terminations
Foster parents of children whose placements had recently ended (N=141) were
asked to choose all the reasons that contributed to the placement termination. Foster
parents chose the following reasons as one of the reasons for placement moves: child’s
behavior problems (59%), other child problems (32%), emergency placement only
(40%), moved to be with a relative or sibling (36%), problems with the agency (23%), an
adoptive home was found (15%), foster parent problems (13%) and, other reasons
(14%).4
Foster parents, as well as caseworkers, were then asked to specify the first and
second most important reasons for the move. Figures 1 and 2 below illustrate the
frequency with which foster parent and caseworkers identified each reason as the first or
second most important reason for the placement ending. 5
Foster parent and caseworker responses regarding child behavio r problems, other
child problems, and emergency placement were similar.6 They differed somewhat on
their perceptions regarding problems with the agency (with caseworkers reporting
virtually none) and regarding foster parent problems (with caseworkers reporting more
than foster parents). Foster parents and caseworkers, respectively, reported the following
reasons as first or second most important: child’s behavior problems (45%, 39%), other
child problems (11%, 17%), moved to be with a relative or sibling (24%, 32%),
placement intended to be emergency placement only (19%, 13%), foster parent had
problems with the agency (11%, <1%), an adoptive home was found (6%, 15%), foster
4These reasons add up to more than 100% because a foster parent could choose many reasons which contributed to the disruption.
5If the same category of reason was given as the first and second most important reason, it was excluded from the count of second most important reasons.
6The caseworker data in Figure 2 represent 147 children in the movement group as opposed to 141 children in the foster parent movement group. This is because six more interviews were completed with caseworkers than with foster parents.

JUNE 1999 PLACEMENT STABILITY STUDY
CHILDREN AND FAMILY RESEARCH CENTER 19
parent had personal problems (5%, 20%), some other reason (14%, 3%). An explanation
of the meaning of each placement termination reason follows:
Child’s Behavioral Problems: (foster parent 45%, caseworkers 39%) The reported reason for the move was that the child displayed behavioral problems which the foster parent could not tolerate. By far, the most frequently reported first and second reason for the placement ending was due to the child’s special behavioral needs. Items coded as behavioral problems and included in this category are listed in Table 2.
Other Child Problems: (foster parent 11%, caseworkers 17%) The reported reason for the move was that the child had problems other than behavioral problems, including emotional and medical problems, which the foster parent could not tolerate. Types of problems which are included in this category are listed in Table 3.
Moved to be with a Relative or Sibling: (foster parent 24%, caseworkers 32%) The reported reason for the move was that the child was moved to a home of relative placement or was moved to a placement with a sibling. These moves should not necessarily be thought of as negative outcomes, especially when a short, temporary placement precedes these moves. However, since 24 percent of these moves to be with relatives or siblings were from placements that lasted longer than a year, a disruption from a stable home occurred. The benefits of reuniting foster children with relative or siblings at the cost of terminating a stable placement should be carefully considered.7
Emergency Placement Only: (foster parent 19%, caseworkers 13%) The reported reason for the move was that the child was placed in the home on an emergency basis only, with no intention that the home would be a long-term placement for the child. Thirty-two percent (32%) of these moves were from emergency placements which lasted less more than 90 days. While19% of foster parents reported that the first or second reason for the move was that the placement was an emergency placement, a percentage which seems appropriate, 40% of foster parents reported that one of the reasons for the move was emergency placement, a percentage that seems surprising and problematic. For most of this 40% of cases, other reasons were reported as the primary reasons for the move. This finding suggests the possibility that many foster parents are
7As discussed further below, cases where the first or second reason listed was a move for these family integrity reasons were not included in further analyses of disruption, as they were determined to be planned moves.

PLACEMENT STABILITY STUDY HARTNETT, FALCONNIER, LEATHERS, TESTA
UNIVERSITY OF ILLINOIS AT URBANA-CHAMPAIGN 20
accepting children for placement who need longer term placements, believing that the placement is for emergency purposes. It seems likely that this kind of arrangement would reduce the commitment of a foster parent to dealing with difficult situations which arose. It also seems plausible that a system trying to cope with a shortage of foster parents, and needing an available placement for a particular child, might persuade a foster parent to take a child on an emergency basis when that child was in need of a longer term placement. While this sort of placement may be inevitable, due to foster parent shortages, it is likely to contribute to increased numbers of disruptions.
Table 2. Reasons for Moves Coded as Behavioral Problems
Behavioral Problems
Excessive crying or irritability
Didn’t listen to adults in the home
Destroyed property
Didn’t get along with other children in the home
Physically aggressive with adult in the home
Physically aggressive with children in the home
Sexually acting out
Ran away
Extremely needy of time or attention
Had problems at school
Had problems with the police
Had other behavioral problems

JUNE 1999 PLACEMENT STABILITY STUDY
CHILDREN AND FAMILY RESEARCH CENTER 21
Table 3. Reasons for Moves Coded as Other Child Problems
Other Child Problems
Had medical needs which required more intensive care
Had needs due to mental retardation which needed more intensive care
Was pregnant
Was depressed or anxious
Had other mental health problems
Adoptive Home Found: (foster parent 6%, caseworkers 15%) The reported reason for the move was that the child was moved to an adoptive placement. Cases where the first or second reason listed was adoptive home found were not included in further analyses of disruption, as they were determined to be planned moves.
Problems with the Agency: (foster parent 11%, caseworkers <1%) The reported reason for the move was that the foster parents had difficulties with the agency or with the caseworker that they could not tolerate. Types of problems which are included in this category include problems with licensing status, conflict between caseworker and foster parent, inability to get the services the child needed, or foster parent perception that payment for the child’s care was inadequate.
Foster Parent Problems: (foster parent 5%, caseworkers 20%) The reported reason for the move was that the foster parent had personal difficulties which made it impossible for them to continue being a foster parent. Types of problems which are included in this category include the foster parent deciding not to be a foster parent any more or illness or death of the foster parent or other family member.
Other Reason: (foster parent 14%, caseworkers 3%) The reported reason for the move was some other reason. Types of problems reported by foster parents which are in this category include child aging out of care, child needing independent living services, child’s biological parents threatening foster parents, abuse or neglect allegations, or language or cultural differences.

PLACEMENT STABILITY STUDY HARTNETT, FALCONNIER, LEATHERS, TESTA
UNIVERSITY OF ILLINOIS AT URBANA-CHAMPAIGN 22
We compared the reasons why all children (both stabilized and movers) moved
from their most recent prior placement. We compared stabilized children to all children
in the movement group and compared stabilized children to those children in the
movement group whose placements disrupted. We found significant differences between
the reasons why each of the three groups of children moved. In some respects, the
children in the movement group whose placement changes were planned are more similar
to the stabilized children.
There were only two significant differences between stabilized children and all
children in the movement group (see the tables on the following 2 pages). First, it was
highly unlikely (p = .000) for children in the stabilized group to have experienced a
move abruptly initiated by the foster parent without any prior notification that there was a
problem.
Second, children in the stabilized group were more likely (p=.001) to have been
removed from their prior placement due to abuse or neglect in that home. Perhaps greater
surveillance and provision of services by DCFS had a stabilizing effect on the current
placement. In addition, it is possible that highly trained and/or experienced foster parents
were chosen for re-victimized children.
It is interesting to note that there were not significant differences between the two
groups in three categories indicative of higher child need. These categories included:
1. a move up in restrictiveness;
2. provider-requested moves due to child behavioral or health issues;
3. child ran away.
This finding suggests that both groups of children entered their next placement
with some degree of unmet need.

JUNE 1999 PLACEMENT STABILITY STUDY
CHILDREN AND FAMILY RESEARCH CENTER 23
It was highly unlikely (p = .000) for children in the stabilized group to have
experienced a move abruptly initiated by the foster parent without any prior notification
that there was a problem.
Interestingly, children in the stabilized group were more likely (p = .001) to have
been removed from their prior placement due to abuse or neglect in that home. Perhaps
greater surveillance and provision of services by DCFS had a stabilizing effect on the
current placement. In addition, it is possible that highly trained and/or experienced foster
parents were chosen for re-victimized children.
It is interesting to note that there were not significant differences between the two
groups in three categories indicative of higher child need. These categories included:
1. a move up in restrictiveness;
2. provider-requested moves due to child behavioral or health issues;
3. child ran away.
This finding suggests that both groups of children entered their next placement
with some degree of unmet need. The next section of the report discusses children
behavior needs.
Child Behavior Problems Characteristic of Children in the Movement Group
Because such a high percentage of both foster parents (45%) and caseworkers
(39%) reported that a child's behavior was the primary reason for the move, these
children's behavioral problems were examined in more detail. Foster parent interviews
included a 112- item parent report checklist8 which evaluates clinical symptoms in
children, the Child Behavior Checklist (CBCL). The CBCL is the most widely used
8The CBCL for children older than 3 years has 112 items; for children 2–3 years old, the checklist has only 100 items, which are somewhat different due to age differences in symptoms.

PLACEMENT STABILITY STUDY HARTNETT, FALCONNIER, LEATHERS, TESTA
UNIVERSITY OF ILLINOIS AT URBANA-CHAMPAIGN 24
continuous 9 system for child evaluation in the United States; it is frequently employed in
both research and clinical settings. It has well-established reliability and validity. It can
be scored as two sub-scales, an “externalizing behavior” sub-scale, made up of delinquent
and aggressive behaviors10, and an “internalizing behavior” sub-scale made up of
withdrawn behaviors and symptoms of anxiety and depression. It also contains sub-
scales measuring attention problems, social problems, and somatic complaints.11 The
percentage of the general US population falling into the normal range and into the clinical
range is shown in Table 4.
Table 4. Clinical Ranges for CBCL Scores in the General Population
Clinical Category % of the General Population Standardized Score
Normal Range 98% < 64
Clinical Range 2% > 64
An analysis of the clinical status of children's externalizing behaviors reveals the
severity of behavioral problems of the children whose placements are disrupting for
behavioral reasons. The percentage of each group falling into each clinical range is
presented in Table 5. Seventy-seven percent (77%) of children whose foster parents
reported that behavioral reasons were the primary reasons for the move have
9There are two primary traditions in child evaluation, and ardent advocates and dissenters for each type. One tradition uses a categorical-diagnostic system to evaluate children. The best known of the categorical systems is the DSM-IV typology, which assigns a “clinical diagnosis” to a child displaying a pre-determined set of symptoms. This was the method used in the LOC study. This type of system requires an evaluation by a clinician. The other tradition in child evaluation is the continuous-empirical tradition. It uses a system which measures clinical status as a function of the number of symptoms a child presents. In this type of system, symptoms are not grouped into categories; instead, severity is determined by whether a child displays more or less symptoms than a given percentage of the population. This type of system does not require a professional clinical evaluation. It is often based on parent or teacher report. The CBCL is the best known of this type of evaluation method.
10For 2–3 year old children, destructive behaviors rather than delinquent behaviors, are measured. 11In addition, a scale measures sleep problems for 2–3 year old children.

JUNE 1999 PLACEMENT STABILITY STUDY
CHILDREN AND FAMILY RESEARCH CENTER 25
externalizing behavioral scores in the clinical range. This suggests that this is a very
difficult group of children. There is no significant difference between the internalizing
behavior groups.
Table 5. Percentage of Children in the Movement Sample in Clinical Ranges by Reasons for Move
Reason for Move Externalizing Behaviors Internalizing Behaviors
Behavior Problems Primary Reason for Move
77%**
N=41 38% N=20
Behavior Problems NOT Primary Reason for Move
36% N=58
25% N=40
** p<.01 These findings indicate that a high degree of unmet child need is a major
factor associated with placement disruption. In Section V, we further assess the role of
children’s behavioral needs by conducting a multivariate analysis of other variables
which may also be associated with placement disruption.
IV. Differences Between Stable and Disrupted Foster Care Placements
We now turn our attention to examining the differences between two groups of
children. Based on the placement termination reasons, we partitioned cases in the
movement group into two categories:
1. Planned moves: Moved to be with relatives or adoptive home found, and
2. Disrupted placement: All other reasons.

PLACEMENT STABILITY STUDY HARTNETT, FALCONNIER, LEATHERS, TESTA
UNIVERSITY OF ILLINOIS AT URBANA-CHAMPAIGN 26
This enabled us to distinguish between planned and unplanned moves in our
analysis and to focus on disruptions.12 Table 6 shows the number of children in each of
the three types of cases. The remainder of our analysis focuses on explaining the
differences between the stable group and the disrupted group; cases with “planned
moves” are not included in the analyses.
Table 6. Number of Completed Cases by Case Type
Case Type Number Percentage
Stable 127 46%
Moved to be with Relatives/ Adopted 66 24%
Placement Disrupted 81 30%
Total 274 100%
There were no significant differences between types of cases regarding children’s
race or gender. Furthermore, there were no significant differences in the reasons for case
openings (abuse, neglect, all other reasons) by case type.
Children in the disrupted group were significantly (p > .02) older than children in
the stable group with mean ages of 9.08 years and 7.46 years respectively. There was no
significant difference in the mean age of children in the planned move group (= 7.16) and
the mean age of children in the stable group. We control for age (and other variables as
discussed below) in our analysis of factors that predict stability.
Placements that had lasted less than a week were also excluded from the analysis,
due to doubts about the validity of information about a child who was known for only a
week. In a strict sense, the model described is post- indicative, since information was
12A comparison of the foster parents’ and the caseworkers’ reasons for placement termination identified only 15 cases (out of 147) where there was a discrepancy between the classification of planned and

JUNE 1999 PLACEMENT STABILITY STUDY
CHILDREN AND FAMILY RESEARCH CENTER 27
obtained regarding placement disruptions that had already occurred. Its predictive use,
then, applies to factors that are associated with stabilizing children who have histories of
previously moved.
Variables That Predict Stability
The two samples, the stabilized group and the disrupted group, were compared in
a logistic regression, to determine what factors predicted the stability of the stabilized
group. Variables that were included in the analysis had been shown to be associated with
placement disruption in at least one prior study, showed a bivariate relationship to
stability, and had adequate variance. In addition, length of time in the current placement
was included as a control variable so that the results obtained would not reflect
differences between the two groups merely due to varying placement lengths.
Insignificant predictors that did not add to the model’s ability to correctly identify
stabilized children were removed from the model. In the final model, 81% of the
children were correctly identified as being in the disrupted or the stabilized sample. The
findings from the final model suggest that after controlling for all the other variables
listed, six variables were found to predict stability. These included: younger age, less
delinquent and aggressive behavior, receiving therapy, a weaker attachment to
biological mother, a more positive evaluation of the foster parent by the caseworker,
and, for children with more severe behavior problems, placement in specialized
care. Regression results are presented in Appendix C. More detail regarding these
variables follows.
Age: The younger a child is, the more likely his/her placement is to be stabilized.
disrupted placement. The 15 cases were reconciled and coded the same in both the foster parent and caseworker databases.

PLACEMENT STABILITY STUDY HARTNETT, FALCONNIER, LEATHERS, TESTA
UNIVERSITY OF ILLINOIS AT URBANA-CHAMPAIGN 28
Delinquent and Aggressive Behaviors 13: The fewer delinquent and aggressive behaviors a child displays, the less likely his/her placement is to disrupt. Table 7 below lists examples of aggressive and delinquent behaviors.
Receipt of Therapy: Children who were receiving therapy were more likely to be stabilized than children who were not receiving therapy. This effect remains even after controlling for length of time in placement, so it is not merely an artifact of children in stable placements having a longer time to get connected with therapy.
Table 7. Delinquent and Aggressive Behaviors
Delinquent Behaviors Aggressive Behaviors
Stealing
Lying
Cheating
Running away
Swearing
Truancy
Using alcohol or drugs
Hanging out with “bad companions”
Vandalizing property
Arguing or threatening people
Having a hot temper
Talking or yelling a lot or being loud
Demanding a lot of attention
Being stubborn or disobedient
Fighting
Teasing others a lot
Being mean or cruel
Bragging or showing off a lot
Attachment to Biological Mother: Children with less attachment to their biological mothers were more likely to be stabilized. As with the receipt of therapy above, this effect remains even after controlling for length of time in placement. This result is not due to children in stable placements having a longer time to become detached from their biological mothers.
Evaluation of Foster Home: Children placed in foster homes which received higher evaluation scores by caseworkers were more likely to be stabilized. (See the following section, Differences in Caseworker Perceptions of Foster Parent Qualifications, for a detailed description of this evaluation.) The caseworker’s
13Delinquent and aggressive behaviors were measured by the delinquent subscale and the aggressive subscale of the Child Behavior Checklist (CBCL).

JUNE 1999 PLACEMENT STABILITY STUDY
CHILDREN AND FAMILY RESEARCH CENTER 29
evaluation of the foster parent appears to have a complex relationship with both a child’s aggressive and delinquent behaviors and a foster parent’s perception of how much of a burden the care of the child presents. The caseworker’s evaluation of a foster parent is negatively correlated with both the foster parent’s perceived level of burden of caring for the child R = –.29, p < .01) and with the child’s CBCL externalizing behavior score R = –.33, p < .01). Thus, the greater the perceived burden of caring for the child was, the lower the foster parent evaluation score. Likewise, the higher a child scored on aggressive and delinquent behaviors, the lower the foster parent evaluation score. Suggested explanations for this finding include the possibility that, given a child of the same level of difficulty, a less competent foster parent will perceive the burden of caring for that child as higher than a more competent foster parent. The other possibility is that caseworkers perceive foster parents who are dealing with more difficult children to be less competent, since it is more difficult to be successful with aggressive and delinquent children.
Placement in Specialized Foster Care for Children with More Oppositional/Aggressive and Delinquent Behaviors: Children with behavioral problems were more likely to be stabilized if they were placed in specialized foster care.
There is a strong correlation between stable placement and a child’s participation
in after-school programs and day care. However, after closer analysis, we observed a
“seasonal effect,” that may explain the relationship. One of our sampling criteria for the
movement group was that they had to have moved at least once in the past six months.
Since the study sample was drawn during the summer, children selected into the
movement sample had less opportunity to be involved in after-school programs and day
care. While involvement in extra-curricular programs may have a stabilizing effect, it
was impossible to rule out the competing hypothesis that the difference was due to the
children in the movement sample having a reduced opportunity to enroll in such
programs. Nonetheless, controlling for our core predictive variables, stabilized children
were found to have significantly more involvement in such community programs
(p > .001). It is possible that the movement from home to home interferes with a child’s
chances to enroll in and remain involved in extra-curricular programs. Further research,

PLACEMENT STABILITY STUDY HARTNETT, FALCONNIER, LEATHERS, TESTA
UNIVERSITY OF ILLINOIS AT URBANA-CHAMPAIGN 30
which controls for seasonal effects, needs to be conducted to investigate out this
important possibility.
An inventory of children’s behavioral, emotional, physical, and social needs was
also administered using the case records. When comparing stabilized children to all
children in the movement group, there are significant differences in the problems and
needs that the children have (see tables on next 2 pages). Stabilized children were more
likely that children in the movement group to have a developmental delay (p = .000)
Children in the stabilized group were less likely to have:
1. run away (p = .007)
2. been engaged in delinquent behavior (p = .003)
3. been engaged in gang-related activities (p = .02)
4. had a truancy problem (p = .01)
Of those children who ran away, were truant, and engaged in delinquent or gang
activities, virtually all of then (91%) were in the group of children who disrupted from
placement. In this regard, the children in the movement group who had planned moves
look much more similar to stabilized children than disrupted children.
It is interesting to note that significant differences were not found between
stabilized and non-stabilized children regarding: child behavior disorders, attention
deficit disorders, physical aggression, destroying property, sexual behavior, and
oppositional behavior. Thus, there is a group of stabilized children who were moved into
different placements who had unmet needs, but were subsequently able to remain in their
new placements for over 12 months.
Variables That Do Not Predict Stability
Other variables of interest that did not differentiate between the disrupted and the
stabilized samples include: the foster parent’s perception of how much of a burden the

JUNE 1999 PLACEMENT STABILITY STUDY
CHILDREN AND FAMILY RESEARCH CENTER 31
care of the child presents; a child’s internalized emotional problems including being
withdrawn, depressed, anxious, or having attention problems; some types of services; and
other foster parent characteristics.
Burden of Care 14: While burden is correlated (R2 = .40, p < .01) with stability status, the foster parent’s perceived burden of care did not remain significant in the regression equation once CBCL externalizing behaviors or the foster parent evaluation score was entered. This means it does not contribute any independent information about placement stability that is not also contributed by either the CBCL score or the foster parent evaluation score. Interestingly, perceived burden of care can be predicted by a regression equation containing the CBCL externalizing behaviors score, the foster parent evaluation score, and an interaction between these two variables (R2 = .43). A possible explanation for this finding is that the mechanism by which externalizing behaviors impact placement stability is by increasing a foster parent’s perceived burden of caring for a child. In addition, these results suggest that foster parents given higher evaluations are less burdened by more behaviorally disturbed children than foster parents given lower evaluations.
Other Emotional and Behavioral Problems: These included symptoms of anxiety or depression, 15 attention problems, and symptoms of withdrawal.
Receipt of Other Services: These included receipt of respite services, receipt of psychotropic medications, receipt of wraparound services, and frequency of contact with caseworkers. It is important to note that wraparound services were received by too few children for an effect to be detected unless the effect were very large.
Amount of Money Received to Care for the Child: It should be highlighted that in a system in which a child can be rapidly replaced by another child for whom the foster parent will be paid the same rate, the amount of money received to care for a child should not have an impact on stability. Removal of a child will not lead to the loss of income by the foster parent.
14The Burden of Care is an 11 item standardized scale with well-established validity and reliability criteria. It is used to measure a caregiver’s perceived burden of caring for a child.
15Symptoms of anxiety and depression were measured by the anxious/depressed subscale of the Child Behavior Checklist (CBCL). Attention problems were measured by the attention problems subscale of the Child Behavior Checklist (CBCL). Symptoms of withdrawal were measured by the withdrawn subscale of the Child Behavior Checklist (CBCL).

PLACEMENT STABILITY STUDY HARTNETT, FALCONNIER, LEATHERS, TESTA
UNIVERSITY OF ILLINOIS AT URBANA-CHAMPAIGN 32
Other Foster Parent Characteristics: These included the foster parents’ age, race, education, religious preference, years of experience being a foster parent, whether a foster parent works or not, and the extent of the family’s support system.
Differences in Caseworker Perceptions of Foster Parent Qualifications
In this section, we discuss findings regarding caseworkers’ perceptions of foster
parents’ skills, experience, and the quality of care they provide(d) to sample children.
The Foster Placement Evaluation Scale was administered as part of the Caseworker
Interview. 16 The scale compiles 14 items that rate the quality of individual foster care
placements. There are items about the foster parent’s approach to the child as well as
items about the child’s behavior and experience in the placement. The scale includes
measures of the quality and amount of time the foster parent spends with the child; the
foster parent’s performance in meeting the child’s physical, behavioral and emotional
needs; how affectionate the foster parents are with the child; how well the foster parent
handles visits between the biological parents; and, whether the child’s well-being has
improved, deteriorated, or stayed the same while in the foster home.
The mean scores obtained for foster parents of children in the stabilized group vs.
foster parent of children in the disrupted group, shown in Table 8, are significantly
different (p>.001). Foster parents of stabilized children received higher scores on the
care they provide to the foster child as well as on the child’s experience in the home.
16Jenny L Doelling and James H Johnson, “Foster Placement Evaluation Scale: Preliminary Findings,” Social Casework: The Journal of Contemporary Social Work , (February, 1989): 96-101. Measures of internal consistency indicated very high reliability of the scale with a split-half correlation coefficient of .90, and a mean item-to-total correlation (Cronbach’s alpha) of .88. Inter-rater reliability of 29 cases was .65 indicating moderate agreement.

JUNE 1999 PLACEMENT STABILITY STUDY
CHILDREN AND FAMILY RESEARCH CENTER 33
Table 8. Mean Foster Parent Evaluation Scores
Case Type Mean Foster Parent Score
t-score Logistic Regression R Value
Foster Parents of Children in the Stabilized Group 4.62 –6.74*** .2118***
Foster Parents of Children in the Disrupted Group 3.84
***p<.001
To test whether only certain items differentiated the two groups of children, the
individual item means obtained for the stabilized group and the disrupted group were
assessed using t-scores and as individual variables in a logistic regression equation (See
Table 9 below). After controlling for the effects of our core predictive variables17 all but
one item (Foster Parent Handled Visits Well) significantly predicted stable care. These
findings indicate the importance of providing attentive, nurturing care and, particularly,
the ability to accept and handle difficult behavior. The most significant items that
distinguish stable foster parents from disrupted foster parents are treating the child well,
the ability to effectively deal with difficult behaviors , and accepting the child
regardless of his/her behaviors . Foster parents with these qualities are able to maintain
stable placements for children in their homes.
Several policy implications would be to: 1) actively recruit foster parents with
these qualities; 2) train foster parents on behavior management techniques and the
importance of accepting children regardless of their behavior, and; 3) enhance foster
parent training curriculum to emphasize the importance of the foster parents’ support and
involvement with the child’s schoolwork.18
17Child’s age, whether child received therapy, CBCL scores on aggressive and delinquent behaviors, placement in specialized foster care, and greater attachment to biological mothers.
18Whether foster parents are more inclined to work with children who excel in school or whether foster parent support actually has an impact upon school performance is not discernable from the current data.

PLACEMENT STABILITY STUDY HARTNETT, FALCONNIER, LEATHERS, TESTA
UNIVERSITY OF ILLINOIS AT URBANA-CHAMPAIGN 34
Another item, not part of the Foster Placement Evaluation Scale, that we
administered was a rating by the caseworker of the amount of insight and understanding
of the children shown by the foster parent, with a score of “1” being “highly insightful
about the child” and a score of “5” being “completely failed to see the child’s viewpoint,
capacities and limitations.” Again, controlling for the effects of our core predictive
variables, significant differences (p > .004) were found between the foster parents of
stable and disrupted placement groups Therefore, the foster parents of stable children
showed greater understanding and insight of the child and his/her needs .
Table 9. Foster Parent Mean Evaluation Scores on Individual Items
Evaluation Item Stable Mean Disrupted Mean
Logistic Regression Significance
Level
Foster Mother was Affectionate 4.59 3.85 .03
Foster Parent Treated Child Well 4.85 4.13 .000
Provided for Basic Needs 4.94 4.60 .003
Provided for Special Needs 4.70 4.0 .003
Handled Difficult Behavior Well 4.60 3.23 .000
Accepted Child Regardless of Behavior 4.70 3.65 .000
Handled Visits Well3 4.56 3.74 .93
Child Adapted to Family Structure 4.72 3.64 .001
Child Enjoyed Other Children in Home 4.68 4.08 .07
Child’s Academic Performance Maintained or Improved2 4.40 3.70 .002
Child’s Behavior in School Maintained or Improved 4.20 3.67 .001
Provided Fun Activities 4.60 3.86 .001
1 Note: 38% of responses were missing on this item. 2 Note: 39% of responses were missing on this item. 3 Note: 53% of responses were missing on this item.

JUNE 1999 PLACEMENT STABILITY STUDY
CHILDREN AND FAMILY RESEARCH CENTER 35
Other characteristics of the foster parent, not necessarily related to the specific
child in the sample, were rated by caseworkers as either “yes” (= 1) or “no” (= 0). After
controlling for the effects of our core predictive variables, we found significant
differences between stable and disrupted placements on foster parents’ ability to tolerate
emotionally disturbed and aggressive children, foster parent training and experience, and
“how religious” foster parents were as perceived by caseworkers (See Table 10). Foster
parents of stabilized children were also more often reported as having training and/or
experience in an area in which the sample child had a need. Stable and disrupted homes
were not significantly different in their likelihood of having a pre-placement visit or in
terms of caseworker perception of foster parents’ experience and ability to work with
children similar to the sample child.
Table 10. Characteristics of the Foster Parents
Characteristic Stable Mean
Disrupted Mean Logistic Regression Significance Level
Tolerates emotionally disturbed children .85 .58 .003
Tolerates aggressive children .84 .65 .009
Has training/experience with child’s specific need .58 .31 .001
Religious1 .68 .53 .05
1 Note: 26% of responses were missing due to “don’t know” answers.
V. Follow-up of Stable Children: What are the factors contributing to moves that occurred among the stable children during the four months after caseworkers were interviewed?
Thirteen children (11.5%) who were included in the stable sample experienced a
move during the four to five month period after their caseworkers and foster parents were

PLACEMENT STABILITY STUDY HARTNETT, FALCONNIER, LEATHERS, TESTA
UNIVERSITY OF ILLINOIS AT URBANA-CHAMPAIGN 36
interviewed. Examining the predictors of these moves allowed us to test the significance
of the factors identified as stabilizing or disruptive when comparing the stabilized and
disrupted samples. Although the number of children who experienced a move is small,
and so weaker effects may not be detected, the findings from this sample are not limited
by the retrospective bias introduced by comparing placements that have already disrupted
with current, stable placements.
For instance, the protective effect of a positive foster parent evaluation may be an
artifact of retrospective reporting biases. Caseworkers who reported on performance for
a foster parent in a disrupted home may have viewed performance negatively due to the
disruption, rather than judging performance in an unbiased manner. In the prospective
analyses, this bias is not a factor, as the evaluations were made prior to the child’s move.
Predictors of moves among the stable sample were analyzed by conducting
logistic regression analyses. The final regression analyses used to analyze differences
between the stable and disrupted samples were replicated. Insignificant predictors that
reduced the model’s ability to correctly identify those children who moved were removed
from the model. In the final model, 96% of the stable sample was correctly identified as
having experienced a move or as having stayed in the same home. Ten (74.8%) of the 13
children who experienced moves were correctly identified as having moved. The
findings from the final model suggest that after controlling for all other variables listed,
the moves among the stable sample were explained by the following factors:
1. The caseworker’s evaluation of the foster parent prior to the move, with lower evaluations predictive of a move;
2. The sex of the child, with girls more likely to move;
3. The number of prior moves experienced by the child;
4. The age of the child, with older children less likely to have been moved.

JUNE 1999 PLACEMENT STABILITY STUDY
CHILDREN AND FAMILY RESEARCH CENTER 37
Receiving therapy did not predict moves. Behavior problems did influence
moves, but only indirectly, through their effect on burden of care as reported by foster
parents.
These findings support the findings resulting from the comparison of the stable
and disrupted samples that suggest that the caseworker’s evaluation of the foster parent
differentiated between children who were stabilized and those who were not. These
findings also support the role of behavior problems in determining movement. While the
follow-up results do not support the finding that receiving therapy contributed to
children’s stability, the effects of receiving therapy may be apparent if the stable children
were followed for a longer period of time; this would give the sample a greater
opportunity for movement. Unexpectedly, these findings also indicate that after
controlling for all other factors, children who were older were less likely to have moved
than younger children. This may be due to greater movement among younger children in
attempts to find adoptive homes for younger children. Further follow-up of these
placements will indicate if different permanency goals have led to this apparent
difference.
VI. Secondary Data Analysis of Movement within Specialized Foster Care
In this section, we further analyze the movement patterns of three groups of
children who were included in the Levels of Care Project conducted by the Office of the
Research Director.19 Using a prospective design, these analyses provide cross-validation
of the findings reported in earlier sections. The three samples analyzed are as follows:
Sample 1 4,852 children placed in FHS who were assessed using the March, 1996 Levels of Care Assessment form;
19Sonya Leathers, Mark Testa, Lydia Falconnier, The Levels of Care Project: Final Report, Office of the DCFS Research Director, Illinois Department of Children and Family Services, April 1998.

PLACEMENT STABILITY STUDY HARTNETT, FALCONNIER, LEATHERS, TESTA
UNIVERSITY OF ILLINOIS AT URBANA-CHAMPAIGN 38
Sample 2 89 children placed in FHS in Cook County given in-person assessments by Grant Hospital clinical staff during the summer of 1997;
Sample 3 183 children in Cook County who were assessed using the revised Levels of Care materials during the fall and winter of 1997.
Moves which involved physical movement to a new placement were computed between 3/30/96 – 3/30/98 for children assessed using the old LOC form, and between the date of the assessment and 6/30/98 for children given in-person assessments or revised LOC assessments.
Further Support for the Significance of Behavioral Problems, Severe Mental Health Needs, and Unmet Service Needs in Predicting Disruption
Sample 1 Analyzing moves among this sample of children provided us with the
ability to test whether special needs other than behavioral needs were associated with
disruption. Our results support the significance of behavioral needs in determining
placement movement. Medical needs were not found to predict movement ; to the
contrary, severity of medical needs was associated with less movement among children in
specialized foster care.
Overall, 40.6% of children in specialized care on 3/30/96 were in the same home
on 3/30/98 and have not been adopted or returned home. On average, children with the
most severe emotional or behavioral needs experienced more than twice the number of
placements than children with no special behavioral needs, as shown in Table 11 below.

JUNE 1999 PLACEMENT STABILITY STUDY
CHILDREN AND FAMILY RESEARCH CENTER 39
Table 11. Number of Different Placements by Child’s Level of Behavioral Need
Level of Behavioral Need Number of Children
Average Number of Placements after 3/30/96
Percentage in Only One Home 3/30/96–
3/30/98
Average Number of INS/GRH
Placements after 3/30/96
1: No Special Needs 1,703 .53 68.2% .03
2: Mild to Moderate Needs 1,650 .71 61.6% .08
3: Medium Needs 1,015 1.04 53.1% .19
4: Severe Needs 484 1.35 49.0% .32
Missing 2,176 .79 58.7% .13
As shown in Table 12, unlike children with behavioral needs, children with more
severe medical needs were actually less likely to experience moves than children with
less severe medical needs. The association between severity of medical need and moves
does not appear to be due to the inverse relationship between medical needs and
behavioral needs. As shown above, even after deleting all children with a behavioral
score over 0 from the analysis, children with more severe medical needs were less likely
to move than children with less severe needs.
Sample 2 This section analyzes the moves of 89 children placed in specialized
foster care who received in-person assessments by Grant Hospital staff during the
summer of 1997. As found with the 1996 LOC assessments, mental health needs were
found to be significantly associated with movement. Although the in-person assessments
were conducted less than a year earlier than 6/30/98, the correlation between moves as of
6/30/98 and severity of mental health need was found to be stronger than the correlation
between moves and severity as assessed by the old LOC form, confirming that the new
assessment has higher validity than the old assessment. The correlation between moves
and the old behavioral needs score was .16; the correlation between the in-person
assessment of severity and moves was .24.

PLACEMENT STABILITY STUDY HARTNETT, FALCONNIER, LEATHERS, TESTA
UNIVERSITY OF ILLINOIS AT URBANA-CHAMPAIGN 40
Table 12. Number of Different Placements by Child’s Level of Medical Need
Level of Medical Need Number of Children
Average Number of Placements after 3/30/96
Average Number of Placements after 3/30/96, only those with no behavioral needs
(N = 1703)
1: No Special Needs 2,755 .8 .58
2: Mild to Moderate Needs 1,563 .86 .47
3: Medium Needs 332 .61 .42
4: Severe Needs 202 .28 .17
Missing 2,172 .79 –
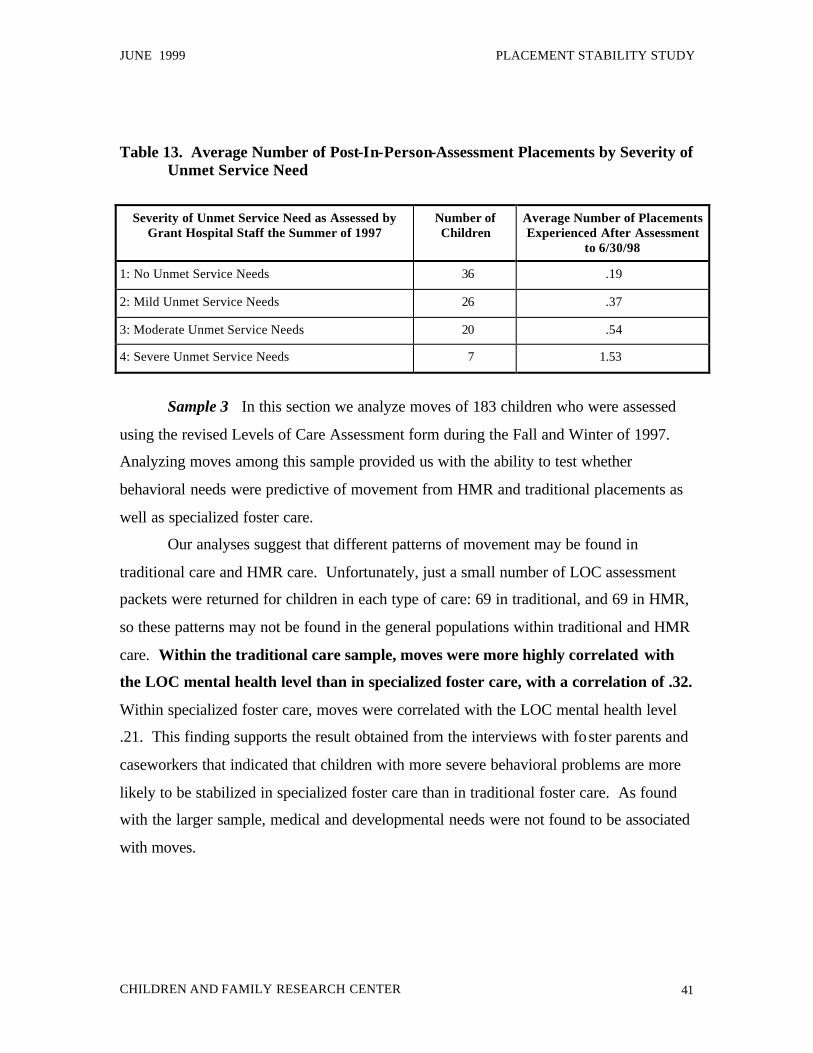
Severity of unmet service need was also found to significantly predict movement,
both in bivariate analyses and in multivariate regression analyses. Biva riate means are
shown below in Table 13.
The association between unmet service need and moves is even stronger than
the association between severity of mental health need and moves, supporting that
stable placements can be provided to children with severe mental health needs as long as
their service needs are met. In multivariate analyses, this was also found to be the case.
Even after controlling for the child’s age, severity of mental health needs, and number of
placements experienced prior to the child ’s placement when assessed, severity of unmet
service need was most highly predictive of moves, accounting for 7.5% of the
variation in number of moves after the assessments. When moves such as running
away and detention stays are included, the proportion of variation in moves accounted for
by unmet service need is increased to 9.4%.
JUNE 1999 PLACEMENT STABILITY STUDY
CHILDREN AND FAMILY RESEARCH CENTER 41
Table 13. Average Number of Post-In-Person-Assessment Placements by Severity of Unmet Service Need
Severity of Unmet Service Need as Assessed by Grant Hospital Staff the Summer of 1997
Number of Children
Average Number of Placements Experienced After Assessment
to 6/30/98
1: No Unmet Service Needs 36 .19
2: Mild Unmet Service Needs 26 .37
3: Moderate Unmet Service Needs 20 .54
4: Severe Unmet Service Needs 7 1.53
Sample 3 In this section we analyze moves of 183 children who were assessed
using the revised Levels of Care Assessment form during the Fall and Winter of 1997.
Analyzing moves among this sample provided us with the ability to test whether
behavioral needs were predictive of movement from HMR and traditional placements as
well as specialized foster care.
Our analyses suggest that different patterns of movement may be found in
traditional care and HMR care. Unfortunately, just a small number of LOC assessment
packets were returned for children in each type of care: 69 in traditional, and 69 in HMR,
so these patterns may not be found in the general populations within traditional and HMR
care. Within the traditional care sample, moves were more highly correlated with
the LOC mental health level than in specialized foster care, with a correlation of .32.
Within specialized foster care, moves were correlated with the LOC mental health level
.21. This finding supports the result obtained from the interviews with foster parents and
caseworkers that indicated that children with more severe behavioral problems are more
likely to be stabilized in specialized foster care than in traditional foster care. As found
with the larger sample, medical and developmental needs were not found to be associated
with moves.

PLACEMENT STABILITY STUDY HARTNETT, FALCONNIER, LEATHERS, TESTA
UNIVERSITY OF ILLINOIS AT URBANA-CHAMPAIGN 42
In HMR care, 12 (17.9%) of the 69 children had moved. For children in HMR
homes, level of mental health need was not found to be as strong a predictor of
moves: moves and the LOC mental health level was correlated .21, and was only
marginally significant at p = .1. For teens in HMR placements, however, pregnancy
and parenting needs were found to be significantly associated with moves
(correlation = .28).
How Does Rate Conversion and Movement to Traditional Care Affect Stability?
In order to determine whether stepdown to traditional care would lead to an
increase in disruption rates, we examined the number of moves which occurred among
the children placed in specialized foster care on 3/30/96 who were stepped down to
traditional foster care at some point after 3/30/96 (N = 919).20
Two groups of children, each of which were stepped down, were analyzed
separately. The first includes children who experienced a “rate conversion,” meaning
that the payment was changed from a specialized rate to a traditional rate. For this group,
stepdown did not involve a physical move (N = 349). For these children, it can be
assumed that the rate conversion involved a planned stepdown to traditional care. The
second group experienced an actual move to a new home that received a traditional rate
(N = 570). These step-downs may or may not have been planned. For example, a child
might have been placed in traditional care after a placement disruption or interruption in
the substitute care spell due to a return home or a hospitalization.
Children in homes which were converted were very stable between the time
that they converted and 6/30/98. Only 8.9% experienced a move during this period,
and placement movement rates were lower than among children whose homes did not
convert.

JUNE 1999 PLACEMENT STABILITY STUDY
CHILDREN AND FAMILY RESEARCH CENTER 43
For the 570 children who were physically moved to a new home, however, a
high level of instability was associated with the move to traditional care. Among
those who moved to a traditional home, 56.7% experienced a subsequent move after the
initial move to traditional care. The average number of moves among these children
was three times higher than among children who remained in specialized foster care
or moved to relative or institutional care. An average of 1.2 subsequent placements
were experienced among these children. Moves were associated with level of behavioral
disturbance as measured by the 3/96 Levels of Care Assessment Review, but even for
children with an apparently low level of behavioral disturbance, a greater number of
moves followed the physical move to traditional care than among children placed in
traditional or specialized foster care.
VII. Conclusions and Recommendations
For a large number of DCFS children, there is a serious placement instability
problem that is most prevalent among children in regular and in specialized foster care
and somewhat more prevalent in downstate regions than in Cook County regions. The
special behavioral and emotional needs of children who experience greater instability are
significantly more pronounced than the needs of children whose care has been stabilized.
Conclusions
The findings from this study support earlier studies regarding variables that
predict placement stability; identify several new factors predicting stable care; and show
that some of the variables previously identified as being associated with placement
stability in bivariate analyses are in fact not predictive of placement stability. The current
20For these analyses, the same definition of a move as in earlier analyses is used.

PLACEMENT STABILITY STUDY HARTNETT, FALCONNIER, LEATHERS, TESTA
UNIVERSITY OF ILLINOIS AT URBANA-CHAMPAIGN 44
study compares children from the same population – those with histories of placement
movements. The design of this study, which compares children who moved and then
stabilized with children who moved and did not stabilize, allowed us to identify factors
that resulted in the stabilization of children with a history of placement movement. The
identification of stabilizing factors has policy implications for children who are currently
experiencing unstable care.
Regarding child characteristics, this study replicated earlier findings that both
fewer behavioral problems and younger age are predictive of placement stability. It also
clarifies earlier confusion in the literature about the association between age and
behavioral problems. It is clear from this study that both younger age and less behavioral
problems predict stability. Race, which has been found to be associated with stability in
some prior bivariate studies, had no effect on placement stability in traditional or
specialized foster care. This study was also the first study to evaluate behavioral and
emotional problems systematically in a study of placement stability. It becomes clear
from this systematic evaluation that it is the aggressive, destructive, and delinquent
behaviors that are the specific types of behaviors that drive placement disruption. In
addition, the percentage of children in the sample who had behavioral problems in the
clinical range (64% of children in the disrupted sample, and 33% of children in the stable
sample) highlights the need for increased attention to the needs of these children.
Regarding services, this study found that provision of some types of service., but
not others, predicted stability. A limitation of the study was the inability to determine the
appropriateness of the services provided to the children. Earlier research has indicated
that comprehensive assessments, adequate service provision, and foster parent training
can prevent further placement disruptions among children at high risk for disruptions. In
this study, receipt of therapy predicted stability. Other services were not found to be
significant predictors of placement stability. These included respite care, receipt of
psychotropic medications, frequency of caseworker contact, and enhanced foster parent
payments. However, as the appropriateness of these services and the need for these

JUNE 1999 PLACEMENT STABILITY STUDY
CHILDREN AND FAMILY RESEARCH CENTER 45
services among children who were not receiving these services could not be assessed, the
stabilizing effects of adequate service provision could not be tested. The effect of
wraparound services also could not be tested, as too few children in the sample were
receiving wraparound to be able to include it in the analyses. Interestingly, there was a
stabilizing effect of being in specialized care for children with behavioral problems that
was not explained by higher reimbursement rates, greater frequency of caseworker visits,
or provision of services.
Most foster parent characteristics that have been reported in the literature as being
associated with stability did not predict placement stability in out multivariate analyses.
These variables included years of experience being a foster parent, number of other
children in the home, race, age, education, religious preference, whether the foster parent
worked or not, and foster parent temperament. The foster parent variable that did predict
stability was a standardized evaluation of foster parents completed by the caseworker.
Foster parents with high scores on the scale were more likely to maintain stable
placements, and were more likely to perceive difficult children as being less burdensome
than foster parents who received lower scores. This result has not been reported
previously in the literature, as no previous studies have systematically evaluated foster
parent-child placement combinations in a study of placement stability.
Regarding the use of emergency homes, two findings from this study point to the
need to consider carefully policies. Both the large number of foster parents (40%) who
reported that one of the reasons for the move was that the placement was an emergency
placement only, and the large percentage of true emergency placements21 (32%) that
lasted longer than 90 days, point to the possibility that emergency homes are being used
in an unplanned manner to accommodate crises that arise, rather than being part of a
planned system to use short-term emergency placements to facilitate matching a child
21We determined that a placement was an emergency placement if the foster parent reported that the first or second most important reason for the move was that the placement was an emergency placement.
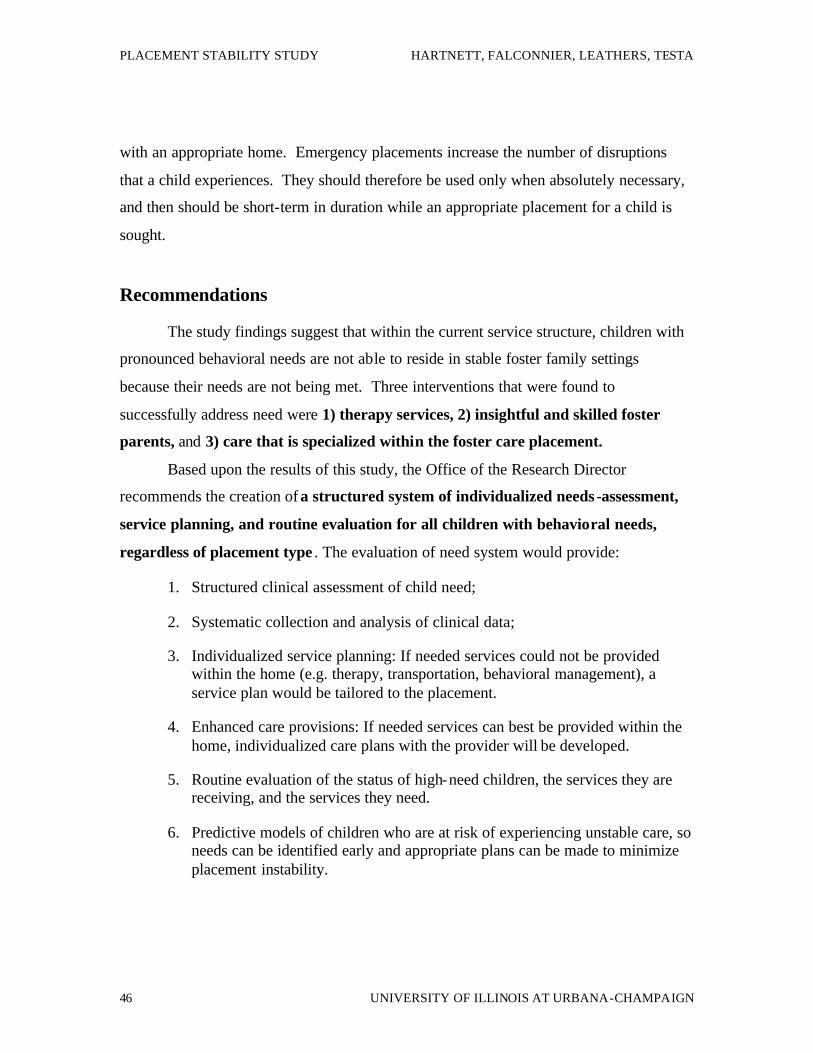
PLACEMENT STABILITY STUDY HARTNETT, FALCONNIER, LEATHERS, TESTA
UNIVERSITY OF ILLINOIS AT URBANA-CHAMPAIGN 46
with an appropriate home. Emergency placements increase the number of disruptions
that a child experiences. They should therefore be used only when absolutely necessary,
and then should be short-term in duration while an appropriate placement for a child is
sought.
Recommendations
The study findings suggest that within the current service structure, children with
pronounced behavioral needs are not able to reside in stable foster family settings
because their needs are not being met. Three interventions that were found to
successfully address need were 1) therapy services, 2) insightful and skilled foster
parents, and 3) care that is specialized within the foster care placement.
Based upon the results of this study, the Office of the Research Director
recommends the creation of a structured system of individualized needs -assessment,
service planning, and routine evaluation for all children with behavioral needs,
regardless of placement type . The evaluation of need system would provide:
1. Structured clinical assessment of child need;
2. Systematic collection and analysis of clinical data;
3. Individualized service planning: If needed services could not be provided within the home (e.g. therapy, transportation, behavioral management), a service plan would be tailored to the placement.
4. Enhanced care provisions: If needed services can best be provided within the home, individualized care plans with the provider will be developed.
5. Routine evaluation of the status of high-need children, the services they are receiving, and the services they need.
6. Predictive models of children who are at risk of experiencing unstable care, so needs can be identified early and appropriate plans can be made to minimize placement instability.

JUNE 1999 PLACEMENT STABILITY STUDY
CHILDREN AND FAMILY RESEARCH CENTER 47
Because we now have an empirical profile of children who are at risk of
experiencing unstable care, they can be identified early in their placement careers and
unstable care can be minimized. If needed services are lacking in a given area of the state
(e.g., child therapy or skilled foster parents), a plan would be devised to develop such
resources. Adequate funding would need to follow. The sub-system would also provide
on-going training for foster parents who have high-risk children in their homes.
There is evidence in the literature that an intensive approach is promising. In our
literature review, we cite Taber and Proch’s (1987) evaluation of the Chicago Services
Project which significantly decreased the number of moves among a sample of 51
adolescents with histories of previous placement disruptions. The program provided
comprehensive assessment, service planning prior to placement assessments, and
intensive service planning to children with special behavioral needs. Perhaps most
important, the program employed a signed agreement with provider agencies to assure
that services were provided as specified by the service plan.
The high-need sub-system would be comprised of the following components:
1. Conduct Comprehensive Evaluation of Children’s Needs. Early and thorough evaluation of child risk groups is clearly an essential front-end component of any initiative designed to reduce instability. The Department has developed a sophisticated, reliable and valid method of evaluating need22 and should implement it statewide to systematically identify the needs of children who are most at risk of unstable care. The Department also needs to incorporate into its management information system, a core set of clinical information on all children in foster care.
2. Identify and Implement Service Technologies that Directly Meet Diagnosed Needs. Provide the services received by the stabilized group of children (e.g., therapy, after-school programs, day care). Expanded access to a broader array of services available through WRAP programs and through
22See the revised instruments in Sonya Leathers, Mark Testa, Lydia Falconnier, The Levels of Care Project: Final Report, Office of the DCFS Research Director, Illinois Department of Children and Family Services, April 1998.

PLACEMENT STABILITY STUDY HARTNETT, FALCONNIER, LEATHERS, TESTA
UNIVERSITY OF ILLINOIS AT URBANA-CHAMPAIGN 48
the use of individual care plans is also needed.23 WRAP services could be redesigned to emphasize services shown to be effective in meeting the specific unmet needs identified in the evaluation of need. The process of redesigning WRAP could incorporate the “needs- led” (Dartington) approach to service planning at the LAN level. This process would identify, epidemiologically, the incidence and prevalence of specific categories of need for children, families and foster caretakers in the locality. Following this process, service planning can proceed based upon the number and type of needs present in communities.
Individual care plans could be designed to establish a clear linkage between a child’s physical, psychological, social and educational needs and the means by which each need will be met. The care plan should specify an enhanced boarding payment in cases where the premium would result in an increased willingness and ability of caretakers to provide the greater level of care required to meet the greater needs of children they accept into their homes.
3. Ensure that POS Agencies are Performing Well in Achieving Stability. The performance of private agencies in meeting the goal of stability should be monitored in five areas. First, agency performance as per their performance contracts should be carefully monitored. Second, in addition to monitoring moves to more restrictive settings and moves to another agency, the Department should monitor lateral moves (moves to same type of placement within the agency). Third, the Department should ensure that POS agencies are performing well in the area of foster parent recruiting. Fourth, private agencies need to have well-conceived philosophies and operationalized programs for meeting the needs of seriously emotionally disturbed and other high-need children – in particular those that exhibit aggressive and delinquent behavior. Fifth, if DCFS incorporates a core clinical data component into its management information system, private agencies should be required to provide clinical data for the cases they manage.
4. Rethink and Revitalize the Ways in which Foster Parents are Recruited and Screened. Specific foster parent skills and abilities – particularly the ability to accept and manage aggressive behavior – were significant predictors of stability. It follows that DCFS and POS agencies need to recruit foster parents who have a basic understanding of why children exhibit aggressive and delinquent behaviors and knowledge of ways to manage such behavior.
23Only 19 of the 260 foster parents of children in the sample reported that their foster child received WRAP services.

JUNE 1999 PLACEMENT STABILITY STUDY
CHILDREN AND FAMILY RESEARCH CENTER 49
The Department needs to provide an effective training program to assist foster parents in the practical application of behavior management techniques, for example, methods of providing logical consequences for children’s behavior.
5. Support the Capacity of Care Givers . It is foster parents who, by far, spend the greatest amount of time with DCFS foster children. We recommend the implementation of a package of foster parent supports that effectively promotes the 1) satisfaction, 2) endurance, 3) the willingness, and 4) ability of foster parents to care for high-need children for extended periods of time. Since demographics, culture, and needs of foster parents may vary on a regional or neighborhood basis, systems of support ought to be developed locally, perhaps using the needs- led approach referenced above. Community-based supports (at the LAN level, for example) could then be provided for local foster parents.


APPENDICES


JUNE 1999 APPENDIX A
CHILDREN AND FAMILY RESEARCH CENTER 53
APPENDIX A
Analysis of Stability in Cook and Downstate Regions and in Different Type of Placements
A regional analysis of stability rates found differences between Cook County and
the balance of the state regarding the number of moves children can expect to have in a
two-year period.24 Table A below illustrates greater placement stability in the Cook
County regions than in the balance-of-state regions. The greatest stability is achieved in
Cook Central and the least is achieved in the Southern Region. There is little variation
within the Cook/Balance-of-State areas. Stability rates among Cook County regions are
tightly clustered while balance-of-state regions are more loosely clustered. As illustrated
in column #3 of Table A, the differences between Cook and the Balance-of-the-State are
largely explained by the greater use of home of relative placements in Cook County.
Analysis conducted on variations in stability within different placement types
shows that, as noted above, the most stable care was provided in home of relative
placements. Specialized foster care was less stable than HMR, but more stable that
regular foster care. Among regular foster care placements, FHB placements were more
stable than FHP placements. ILO and GRP/INS placements are the most unstable of all
placement types.
Figure A, on the next page, shows trends over time in the stability among the
different types of placements. Overall, placement stability within different types of care
has remained fairly stable over time. The only changes in stability are found in
24To compute these figures, the numbers of moves each child experienced was divided by the number of years the child was in placement and then multiplied by two. For example, a child in placement for four years who experienced one move would average .5 moves in a two year period. This method controls for regional differences in children’s average length of stay in foster care. NOTE: Placements lasting 7 days or less were excluded from this analysis.

PLACEMENT STABILITY STUDY HARTNETT, FALCONNIER, LEATHERS, TESTA
UNIVERSITY OF ILLINOIS AT URBANA-CHAMPAIGN 54
Appendix Table A. Regional Differences in Stability Rates25
Region Moves per 2-year period for all types of cases
Moves per 2-year period controlling for HMR
Cook Central .86 1.07
Cook North .98 1.26
Cook South .98 1.22
Northern 1.26 1.26
Central 1.39 1.29
Southern 1.44 1.39
residential care, which became more stable between 1993 and 1995, but then reversed
this trend and became more unstable between the second half of 1995 and 1998. In HMR
placements, stability decreased slightly in the first 18 months (mid-1993–1994), but
increased steadily until the second half of 1997. Initial gains in the stability in FHS were
offset by rising instability in the last three years. Movement within traditional foster care
has remained virtually constant, yet overall is less stable than FHS. Stability has
increased slightly over the last five years, due to the slight increase in stability in HMR
and the decrease in the utilization of institutional care. However, while overall stability
has slightly increased over time, we continue to have a stability problem in regular and
specialized foster care as well as institutional care.
25To compute these figures, the numbers of moves each child experienced was divided by the number of years the child was in placement and then multiplied by two. For example, a child in placement for four years who experienced one move would average .5 moves in a two year period. This method controls for regional differences in children’s average length of stay in foster care. NOTE: Placements lasting 7 days or less were excluded from this analysis.

JUNE 1999 APPENDIX B
CHILDREN AND FAMILY RESEARCH CENTER 55
APPENDIX B
Number of Placements Experienced by 6 Month Periods within Different Types of Care
1
1.1
1.2
1.3
1.4
1.5
FHS FHT HMR ILO INS TOT
93 Second Half94 First Half94 Second Half95 First Half95 Second Half96 First Half96 Second Half97 First Half97 Second Half


JUNE 1999 APPENDIX C
CHILDREN AND FAMILY RESEARCH CENTER 57
APPENDIX C
Logistic Regression of Factors Likely to Influence Placement Stability
Variable B S.E. Wald Significance Exp (B)
Age –.2161 .0589 13.4831 .0002 .8056
Receipt of therapy –2.0631 .6644 9.6436 .0019 .1271
CBCL externalizing behaviors –.0847 .0289 8.6063 .0033 .9188
Foster Parent Evaluation Score 1.1430 .3338 11.7287 .0006 3.1362
Type of placement (specialized vs. traditional placement)
–5.0411 2.4612 4.1951 .0405 .0065
Time in Placement .0022 .0008 7.2051 .0073 1.0022
Attachment to Bio Mother –.3818 .1653 5.3307 .0210 .6827
Interaction CBCL externalized behavior and type of placement
.0894 .0369 5.8691 .0154 1.0936
Constant 3.5487 2.7503 1.6649 .1969
–2 Log Likelihood = 213.4285 (constant)
–2 Log Likelihood = 129.132
Model Chi-Square = 84.296, df=8, p < .01
Percentage of cases predicted accurately: 81.42%
N = 155 (cases with both a foster parent and a caseworker interview, excluding children with planned moves)


JUNE 1999 REFERENCES
CHILDREN AND FAMILY RESEARCH CENTER 59
REFERENCES
Aldridge, M.J. & Cautley, P.W. (1976). Placing siblings in the same foster home. Child
Welfare, 14, 85–93.
Berridge, D. & Cleaver, H. (1987). Foster home breakdown. New York: Basil Blackwell.
Boyd, L.H. and Remy, L.L. (1978). Is foster parent training worthwhile? Social Service
Review, 6, 275–296.
Campbell, S.B., Simon, R., Weithorn, L, Krikston, D., and Connolly, K. (1979). Journal
of Social Welfare, Fall/Winter, 49–60.
Cautley, P.W. and Aldridge, M.J. (1973). Predicting success for new foster parents.
Social Work, January, 48–53.
Chamberlain, P., Moreland, S., Reid, K. (1992). Enhanced services and stipends for
foster parents: Effects on retention rates and outcomes for children. Child
Welfare, 71, 5, 387–401.
Cooper, C.S., Peterson, N.L. & Meier, J.H. (1987). Variables associated with disrupted
placement in a select sample of abused and neglected children. Child Abuse and
Neglect, 11, 75–86.
Doelling, J.L. and Johnson, J.H. (1990). Predicting success in foster placement: The
contribution of parent-child temperament characteristics. American Journal of
Orthopsychiatry, 60, 4, 585–593.

PLACEMENT STABILITY STUDY HARTNETT, FALCONNIER, LEATHERS, TESTA
UNIVERSITY OF ILLINOIS AT URBANA-CHAMPAIGN 60
Fanshel, D. & Shinn, E. B. (1978). Children in foster care: A longitudinal investigation.
New York: Columbia University Press.
Fanshel, D., Finch, S. J. & Grundy, J. F. (1990). Foster children in a life course
perspective. New York: Columbia University Press.
Kraus, J. (1971). Predicting success of foster placements for school-age children. Social
Work, January, 63–72.
Merrithew, J. (1996). Foster care delivery and the needs of birth children of foster
parents. EDRS, 1–23.
Millham, S., Bullock, R., Hosie, K., & Haak, M. (1986). Lost in care: The problem of
maintaining links between children in care and their families. Aldershot, England:
Gower Publishing Company.
Milner, J. (1987). An ecological perspective on duration of foster care. Child Welfare, 66,
2, 113–123.
Olsen, L.J. (1982). Predicting the permanency status of children in foster care. Social
Work Research and Abstracts, 18, 9–20.
Palmer, S.E. (1996). Placement stability and inclusive practice in foster care: An
empirical study. Children and Youth Services Review, 18, 7, 589–601.
Pardeck, J.T. (1984). Multiple placement of children in foster family care: An empirical
analysis. Social Work, 29, 6, 506–509.

JUNE 1999 REFERENCES
CHILDREN AND FAMILY RESEARCH CENTER 61
Pardeck, J.T. (1983). An empirical analysis of behavioral and emotional problems of
foster children as related to re-placement in care. Child Abuse and Neglect, 7, 75–
78.
Proch, K. & Taber, M. A. (1987). Alienated adolescents in foster care. Social Work
Research and Abstracts, Summer, 9–13.
Staff, I. & Fein, E. (1992). Together or separate: a study of siblings in foster care. Child
Welfare, 71, 257–270.
Staff, I., Fein, E. & Johnson, D.B (1993). Methodological issues in studying sibling
placement. Social Work Research and Abstracts, 29, 35–36.
Stone, N.M. and Stone, S.F. (1983). The prediction of successful foster placement. Social
Casework: The Journal of Contemporary Social Work, 11–17.
Taber, M.A. and Proch, K. (1987). Placement stability for adolescents in foster care.
Child Welfare, 66, 5, 433–445.
Walsh, J. A. & Walsh R. A. (1990). Quality care for tough kids. Washington, D.C.: Child
Welfare League of America.
Widom, C. S. (1991). The role of placement experiences in mediating the criminal
consequences of early childhood victimization. American Journal of
Orthopsychiatry, 61, 195–209.