plan business city of mississauga 2014
TRANSCRIPT
2011
-201
4
Info
rmat
ion
Tec
hn
olog
y B
usi
nes
s P
lan
City
of M
issi
ssau
ga
THE PAGE INTENTIONALLY LEFT BLANK
O-2 Business Plan and Budget 2011-2014
Table of Contents
Existing Core Services ................................................................................................................................. 3 1.0 Vision and Mission ................................................................................................................................ 3 2.0 Service Delivery Model .......................................................................................................................... 4 3.0 Past Achievements ................................................................................................................................ 5 4.0 Opportunities and Challenges ............................................................................................................... 6 5.0 Current Service Levels .......................................................................................................................... 8 5.1 Maintaining Our Infrastructure ............................................................................................................... 9 6.0 Looking Ahead: Goals for the next 4 years .......................................................................................... 10 7.0 Engaging our Customers ..................................................................................................................... 11 Proposed Changes ...................................................................................................................................... 12 8.0 Base Changes ..................................................................................................................................... 13 9.0 Continuous Improvement .................................................................................................................... 14 10.0 Proposed Changes .............................................................................................................................. 16 Required Resources ................................................................................................................................... 20 11.0 Human Resources ............................................................................................................................... 20 12.0 Technology .......................................................................................................................................... 21 13.0 Facilities .............................................................................................................................................. 21 14.0 Budget ................................................................................................................................................. 22 Performance Measures ............................................................................................................................... 24 15.0 Balanced Scorecard ............................................................................................................................ 24
Business Plan and Budget 2011-2014 O-3
Information Technology
IT Director & Administration
Planning & Integration
Departmental Systems
Enterprise Systems
Client Services
Departmental IT Groups (4)
Existing Core Services
1.0 Vision and Mission The Vision of the Corporate Services Department, which is fully embraced by the Information Technology Division, is “Partnering for Success”. This vision captures the basic philosophy of the Department that of working in partnership with all of the City Departments to provide excellent service to our taxpayers.
The Information Technology (IT) Mission Statement is: “We are committed to providing our clients with innovative, reliable and secure solutions that align business, process and technology”.
O-4 Business Plan and Budget 2011-2014
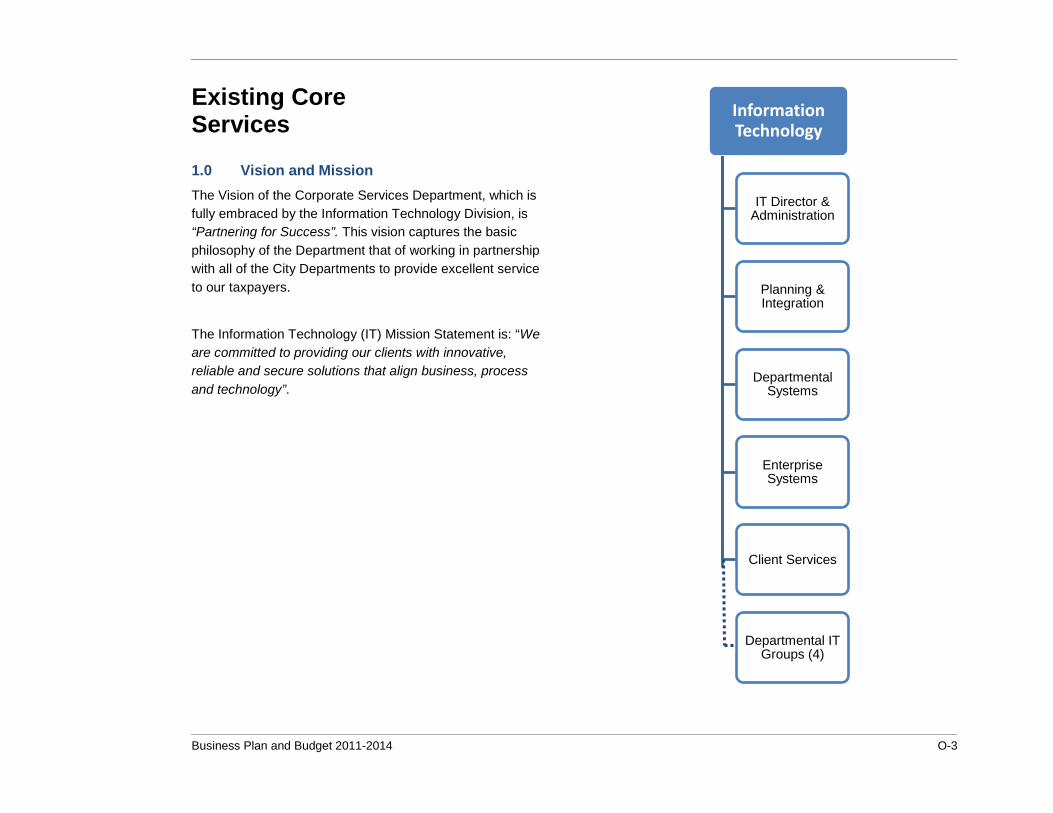
2.0 Service Delivery Model The Information Technology Division is comprised of five service areas with over 100 staff. There are four departmental IT groups providing departments with desktop and business specific application support & service. IT support is primarily available during the city’s core working hours with on call after hours service.
Services provided by each of the service groups include: IT Director and Administration - The IT Director and Administration group provide IT Strategic & Operational Direction to the IT division, IT administrative support, and are responsible for the Corporate IT Policies & Procedures.
Client Services
The Client Services group in IT run the IT Help Desk, support the City’s IT infrastructure, provide 24 X 7 IT, email, and telephone support, and conduct corporate IT training.
Departmental Systems
The Departmental Systems group provide development, implementation and support of both in house developed (MAX (Planning & Building), TXM (Tax)) and vendor (SAP, CLASS, Hastus) systems and applications across all departments
Enterprise Systems
Enterprise Systems provide development, implementation and support for the Hansen system, the eCity portal, and the Intranet.
Planning & Integration
The Planning & Integration group provide database administration, IT architecture support, and manage IT assets through their lifecycle.
Departmental IT Groups (4)
Within the City departments there are 4 Departmental IT Groups that provide front line desktop and application support services on a 24/7 basis.
Business Plan and Budget 2011-2014 O-5
3.0 Past Achievements The achievements by IT are linked to the successes of the city service areas in meeting the needs of the citizens and businesses of Mississauga. Much of IT’s work happens behind the scenes in providing ongoing maintenance and support of the systems, infrastructure, and applications.
Some recent past successes related to new applications and infrastructure include:
• 311 Call Centre Launch: In partnership with the Region of Peel, the city launched it’s 311 Call Centre providing three digit telephone access to residents and businesses for all city non-emergency matters/inquiries;
• Wi-Fi Access in city facilities and Outdoor Wi-Fi Pilot: Free Wi-Fi internet access is currently available to the public and staff in all city facilities. IT in conjunction with Transportation and Works division, completed the outdoor Wi-Fi pilot along the Hurontario St. corridor. In order to expand the city’s Wi-Fi presence, additional financial resources will be needed. These have been identified throughout the 2011 to 2014 business plan and budget process;
• ActiveAssist Program Application: IT in conjunction with Recreation & Parks implemented the ActiveAssist application. ActiveAssist is a fee assistance program designed to help low-income families and individuals in Mississauga participate in Recreation and Parks programs;
• Live Streaming of Council Meetings: Working with Rogers Cable 10, implementation of live streaming of Council meetings via the City’s web portal and online access to archived Council meetings;
• SAPPHYR (SAP Human Capital Management – implement HCM modules): A major initiative of the IT Strategy, the migration of all of PeopleSoft functions (HR Information System, Payroll, Time & Labour functions) to SAP. This initiative implemented the SAP Human Capital Management modules integrating existing SAP functionality (financials, materiel management, accounts payable) with the HCM module with Manager Self-Service and Employee Self-Service into one system;
• Recently Information Technology introduced several new projects with a positive impact on efficiency and budget savings: A new IT Help Desk Application with self-service options, the implementation of new Multi-Function Devices (Copiers/Printers), and a web version of the MAX application (Planning & Building Permits, Fire Training) with the ability for the inspectors to access the application in the field;
• Payment Card Industry (PCI) Compliance – Audit and Implementation: The city’s eStore application (on the city’s website portal), Recreation & Parks CLASS Registration application, and Meadowvale Theatre new ticketing system is compliant with the Payment Card Industry Guidelines; and
• Our server infrastructure has now been consolidated: Over 70% of our servers now use virtualization technology. Benefits include: greening of IT infrastructure by lower power consumption, server consolidation, space requirement reduction, and cost reductions in hardware maintenance and support. This consolidation of server hardware supports the IT Simplification initiative.
O-6 Business Plan and Budget 2011-2014
4.0 Opportunities and Challenges The Information Technology Management Team completed a SWOT (Strengths, Weaknesses, Opportunities, & Threats) exercise as part of this year’s business planning process.
Over the last couple of years one of the key focus areas in IT has been Business Application Simplification. This has proven to be very successful by reducing the number of similar applications, maintaining current versions of applications, implementing new applications, supporting existing applications, implementing server virtualization, and cost savings have resulted from simplification. As IT looks towards the future we will continue to reinforce the Business Application Simplification strategy as new departmental requirements come forward through the business planning process. Some of the key opportunities include integrating new technologies, mobile applications, field computing, and the ability to provide service delivery across multiple channels (web, mobile, phone and in person).
With opportunities, come challenges. Aging infrastructure, an increasing demand for internet bandwidth, and departmental technology needs presenting significant challenges to the department.
The level of sophistication and expectations of clients and stakeholders have increased exponentially over the last few years. As technology continues to penetrate deeper into society, capacity planning, prioritization, business analysis, and an understanding of our clients expectations are keys to our success.
The new IT Strategic Plan, currently being developed with completion targeted for the end of 2010, will address these challenges. Flexibility will be necessary to accommodate new standards, legislation, and rapid changes in the service
channel expectations of our citizens and businesses when dealing with the city.
Some of the opportunities being addressed by Information Technology as part of the 2011-2014 Business Plan include:
• Migrating all of the City’s staff PCs to Windows 7 and Office 2010;
• Improving the wireless Infrastructure and eCity Portal for improved service delivery and network access; and
• Implementing Enterprise Level Decision Support System and Management Reporting, project prioritization and project management tools resulting in a better return on investment on IT projects and consistent project management tools.
Business Plan and Budget 2011-2014 O-7
A continual challenge for IT is the capacity to deliver on new priorities. Additional IT systems require a varying degree of maintenance, and support for upgrading and maintaining existing system and applications. Whether they are custom written in-house applications or those commercial applications ‘purchased off the shelf’, support resources are still necessary.
In order to mitigate risks, Information Technology performs regular maintenance and updates as per upgrade schedules. With respect to projects, future major projects will be staged into three phases to better define the methodology, timeline, and budget:
• Phase 1 : Design / Blueprint / Business Process Review (introduce efficiencies in the business);
• Phase 2: Development and Implementation; and
• Phase 3: Ongoing Support, Enhancements and Metrics.
Over the last several years, it has become increasingly challenging to fill information technology positions. Human Resources and IT together will continue to explore opportunities and options to attract new candidates.
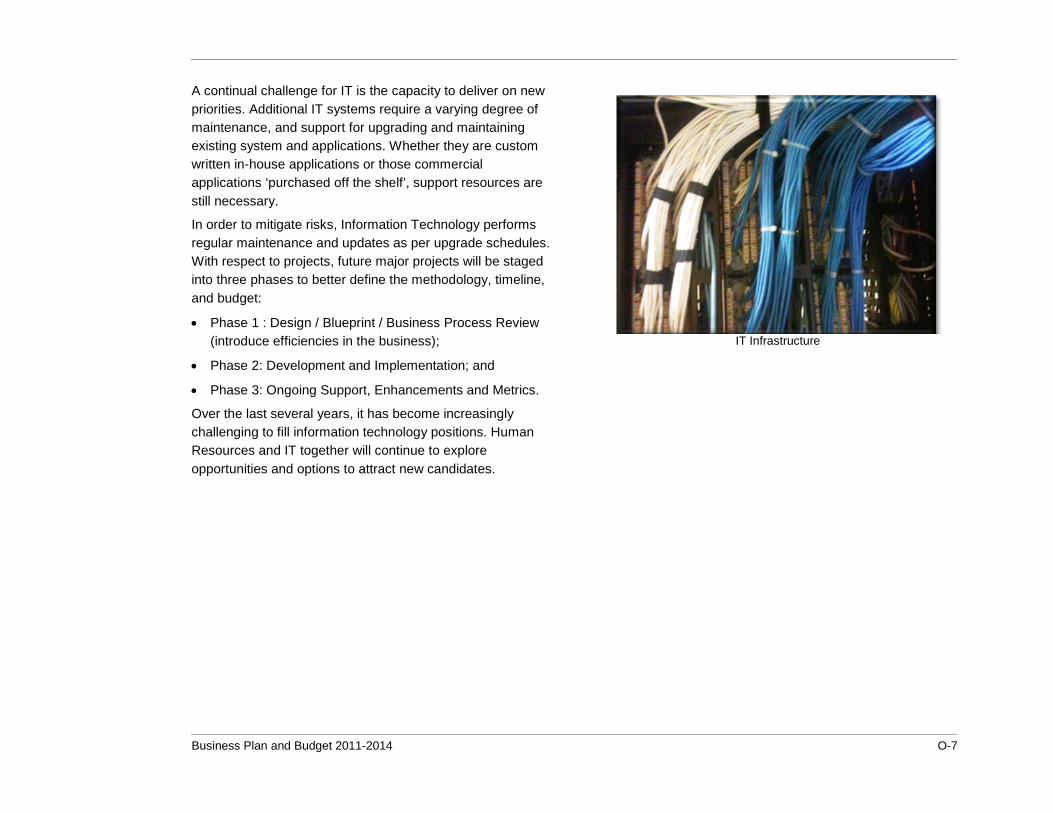
IT Infrastructure
O-8 Business Plan and Budget 2011-2014
5.0 Current Service Levels The services that Information Technology delivers are a balance between deploying new business solutions and technologies to meet the business needs of the city. They provide ongoing maintenance, daily support and enhancement opportunities for existing business systems. On average, IT Staff spend 80% of their time on day-to-day support (operations, support, administration, enhancements, upgrades, and maintenance) of existing applications and systems with the remaining 20% on new projects.
Software applications, systems, and hardware are upgraded / replaced on the following cycle:
• Minor applications - three years;
• Major applications - 10 years;
• Hardware (Desktops / Notebooks) - four years; and
• Hardware (Servers/ Appliances) - five years
Currently the IT Help Desk receives on average 30,000 calls per year with a first contact call resolution rate of 25%.
From a technology perspective, the primary service channel that Mississauga residents and businesses use is the eCity internet portal/websites. The demand for this channel has increased year over year since its inception in 2002. eCity websites had 6.7 million visits in 2009, which was an increase of 10% over 2008. It is anticipated that as more city business areas use this channel for service delivery growth will continue.
The public expects that all city services that can be delivered through a technology channel such as the web or via mobile
applications (smartphone) will be made available on a 24 hours a day and 7 days a week basis.
The infrastructure (servers, networks, etc.) is a foundation component for City service delivery with IT providing server and application uptimes of 99%.
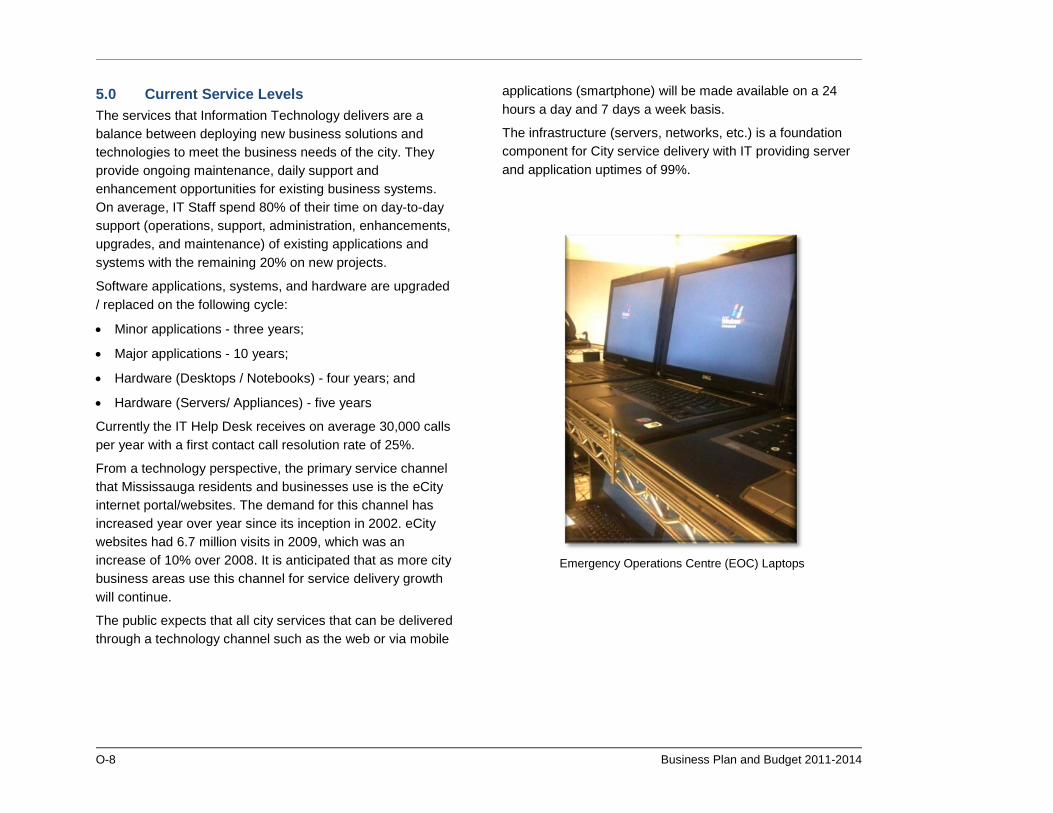
Emergency Operations Centre (EOC) Laptops
Business Plan and Budget 2011-2014 O-9
5.1 Maintaining Our Infrastructure The City owns and operates a portfolio of 2,585 staff desktops/notebooks, and 450 public walk-up PC’s in the library branches, with over 390 desktop and server business applications available to city staff. Currently there are 86 City facilities with networked and wireless Wi-Fi access including the Civic Centre, community centres, arenas, pools, yards for Works and Parks, Transit complexes, and Transit Terminals.
Where feasible, and offered by the vendor, some applications have been out-sourced to application service providers (ASP). Examples include, the eCity web portal, eStore Payment Processing, Provincial Offences Act (POA) Ticket Payment, Parking Ticket Payments by telephone, Public Sector Accounting Board (PSAB) Tangible Capital Assets Inventory/Reporting, and Pay ‘n Display Parking Meters.
In addition, Information Technology is responsible for the IT data and voice (VoIP) network infrastructure that connects 86 city facilities, including the Civic Centre data centre and all local area networks supporting connectivity to each desktop. In all, there are about 200 production servers, with 70% of these servers running multiple virtualized servers.
All of the city locations are connected through the region-wide Public Sector Network of which Mississauga is a founding partner with other members such as Peel Region Police, and the Region of Peel.
The current estimated replacement value of IT assets owned by the city is $70 million. These assets make it possible for the City Departments to deliver the services to the residents and businesses of the City having a profound impact on quality of life, prosperity and sustainability within the
community.There is an IT Capital Program in place to support all of the infrastructure and applications beyond their initial implementation. The IT Capital Program is responsible for upgrades to systems in addition to the implementation of new applications. Minor applications are expected to have a five year lifecycle and major applications are expected to have a 10 year lifecycle. Throughout an applications lifecycle there are numerous service packs and major versions. The industry standard for software applications is a new major version release every 12 to 18 months. Significant resources in IT are responsible for the operational support and maintenance (service packs, minor/major upgrades, preventative maintenance program, and hardware replacement), currently consuming 80% of our resource capacity.
As we expand our reach to the community through wireless initiatives, critical consideration must be given to the ongoing support of all of the new applications that are implemented. Business Planning is looking at the implementation of technology initiatives through to 2014. IT must consider the support aspects well beyond the scope of the current business plan, up to 10 years with respect to major applications.
O-10 Business Plan and Budget 2011-2014
6.0 Looking Ahead: Goals for the next 4 years The primary goal in Information Technology is to provide a stable and secure technology environment that delivers and supports high quality, effective business solutions and tools that meets the needs of our clients. Service excellence will be provided within clearly defined service levels that are agreed upon by clients, to meet their business needs. It is important to focus on keeping staff abreast and skilled in the use of new technologies enabling them to be innovative in their methodologies. This is important as clients and citizens continually demand new services thereby forging into new technological areas that push the limits of expertise.
IT will continue to be innovative across the corporation, addressing future trends, opportunities, issues, and challenges. As more services are made available on the eCity Portal, the city’s objective is for the portal/web to become the channel of preference for all services that have the technical ability to use this channel such as Connect2Rec, Library, Permits, among many others. This will enable citizens and businesses to interact with the city at any time of day, from where ever they want, and on a city supported infrastructure. IT will continue to operate and support a stable, secure and vendor supported IT environment with a focus on enterprise level business solutions and an increased utilization across the city, e.g.: SAP, Hansen, Class, etc.
Information Technology by 2013 will ensure that Service Level Agreements are in place to support major applications (e.g. SAP, CLASS, Hansen, MAX, and TXM) with clearly defined and agreed upon expectations.
Within the next two years one of the opportunities within IT is to setup an intelligent monitoring and self-healing IT environment that will provide IT staff with advance notice of hardware and application issues, and an improved customer
experience by resolving issues without them even being aware there is one. IT will continue to focus on the privacy and the security of information and systems to ensure that they are current and meet all of the standards and regulations required.
Other goals for IT over the next four years will be to increase first call resolution, the implementation of self service applications (password reset, SAP self-service), and to increase server uptime to 99.999%.
Business Plan and Budget 2011-2014 O-11
7.0 Engaging our Customers Through engagements with clients (projects, support, & planning) we review suggestions and project outcomes. One area of opportunity for IT is to conduct an Annual Internal IT Survey starting in 2011 to solicit feedback from a broader range of clients across city departments. The first survey in 2011 will serve as a baseline for future year surveys and provide. direction for improved customer service, better alignment of IT resources, enable IT to address customer concerns, and improved delivery of IT services. The survey will evaluate the following service areas:
• Help Request / Service Desk Performance;
• Project Delivery and Implementation;
• Operations and Support;
• New emerging technologies;
• IT Infrastructure; and
• IT Client Services.
Other customer engagement opportunities that IT utilizes include:
• The Information Technology Committee (ITC) which reviews the business cases for new IT initiatives and approves new application priorities;
• Involvement in the City’s and Departmental planning processes;
• Google Analytics for City web sites will be used to tune the City web sites to improve the user experience. Refinements will be made to the websites and our search appliance to enable more precise searching, getting the public to the information in just one click;
• Clients are engaged on a daily basis through support and partnering in project teams. This results in the regular review and up-date of services provided by IT. All sections of the Division are active in various external partners / associations and feedback is important in planning IT service delivery; and
• Relationship building fostered by a customer service orientation in all Sections provides a firm foundation for input and decision making regarding all services.
Sources of IT best practices:
• The InfoTech Research Group annual survey for year over year comparator;
• IT will be making better use of our involvement with MISA (Municipal Information Systems Association) and other professional associations when researching best practices, performing benchmarking, and identifying best of breed solutions; and
• Other professional associations and user groups e.g. SAP, Bentley, Oracle, Microsoft.
O-12 Business Plan and Budget 2011-2014
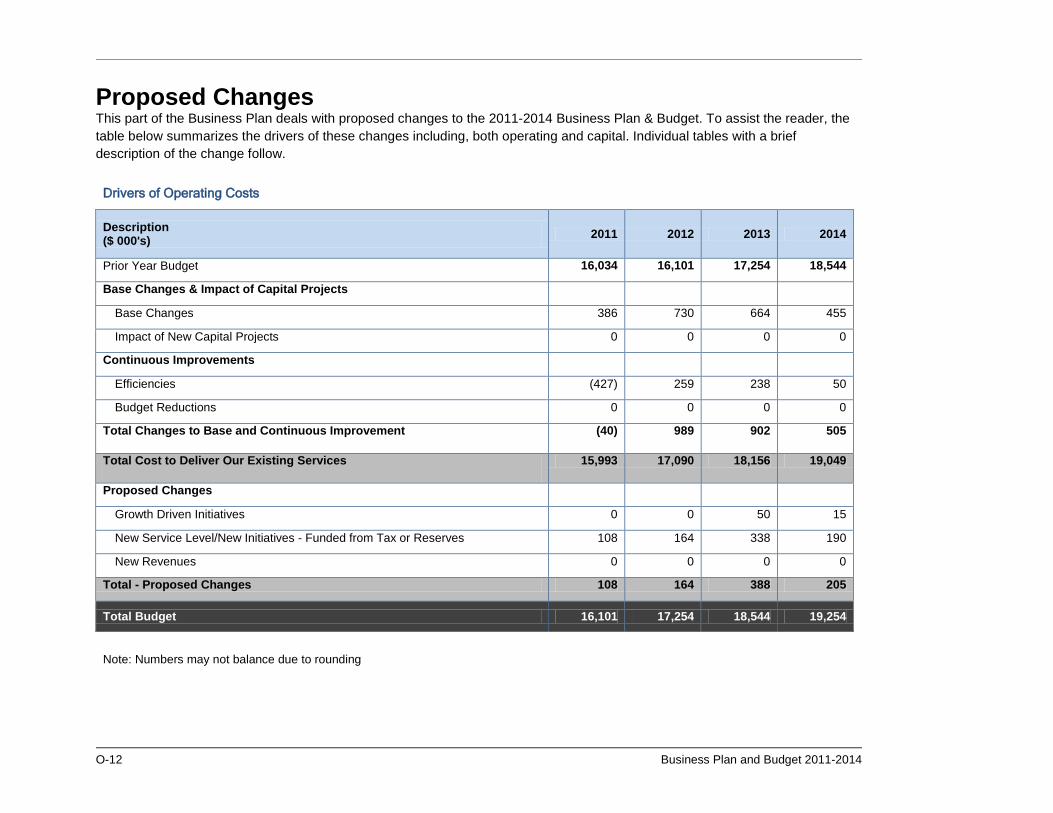
Proposed Changes This part of the Business Plan deals with proposed changes to the 2011-2014 Business Plan & Budget. To assist the reader, the table below summarizes the drivers of these changes including, both operating and capital. Individual tables with a brief description of the change follow.
Drivers of Operating Costs
Description ($ 000's) 2011 2012 2013 2014
Prior Year Budget 16,034 16,101 17,254 18,544
Base Changes & Impact of Capital Projects
Base Changes 386 730 664 455
Impact of New Capital Projects 0 0 0 0
Continuous Improvements
Efficiencies (427) 259 238 50
Budget Reductions 0 0 0 0
Total Changes to Base and Continuous Improvement (40) 989 902 505
Total Cost to Deliver Our Existing Services 15,993 17,090 18,156 19,049
Proposed Changes
Growth Driven Initiatives 0 0 50 15
New Service Level/New Initiatives - Funded from Tax or Reserves 108 164 338 190
New Revenues 0 0 0 0
Total - Proposed Changes 108 164 388 205
Total Budget 16,101 17,254 18,544 19,254
Note: Numbers may not balance due to rounding
Business Plan and Budget 2011-2014 O-13
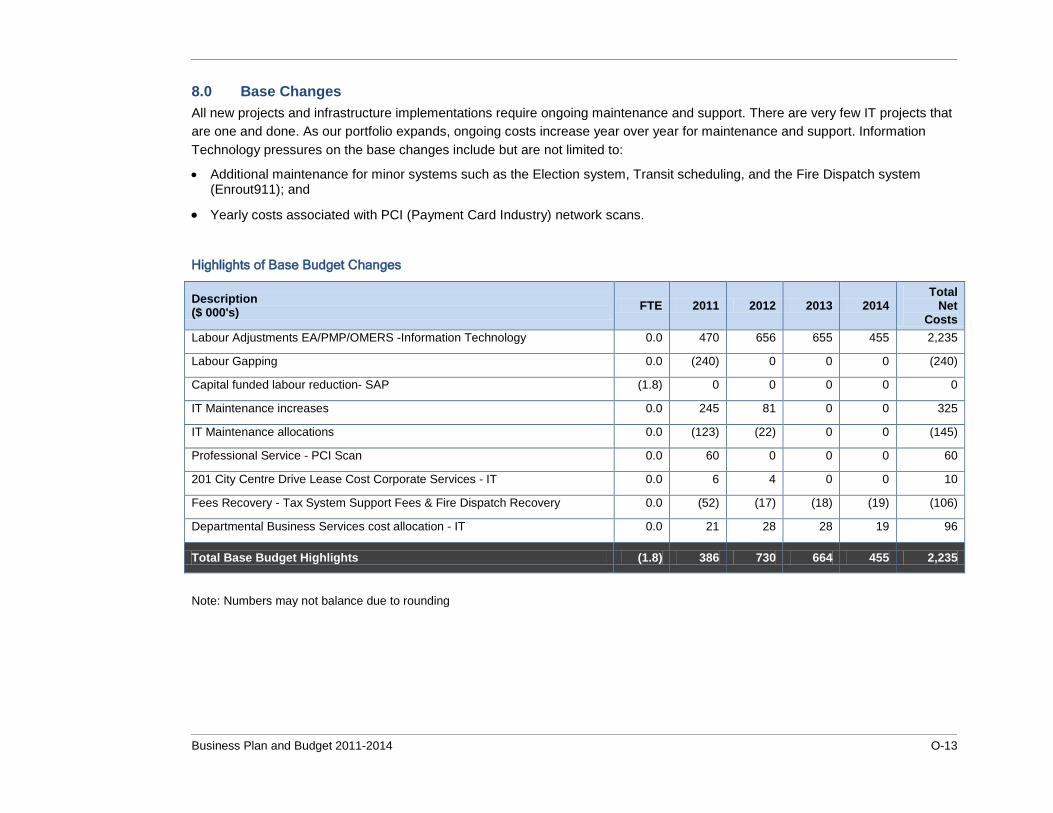
8.0 Base Changes All new projects and infrastructure implementations require ongoing maintenance and support. There are very few IT projects that are one and done. As our portfolio expands, ongoing costs increase year over year for maintenance and support. Information Technology pressures on the base changes include but are not limited to:
• Additional maintenance for minor systems such as the Election system, Transit scheduling, and the Fire Dispatch system (Enrout911); and
• Yearly costs associated with PCI (Payment Card Industry) network scans.
Highlights of Base Budget Changes
Description ($ 000's) FTE 2011 2012 2013 2014
Total Net
Costs Labour Adjustments EA/PMP/OMERS -Information Technology 0.0 470 656 655 455 2,235
Labour Gapping 0.0 (240) 0 0 0 (240)
Capital funded labour reduction- SAP (1.8) 0 0 0 0 0
IT Maintenance increases 0.0 245 81 0 0 325
IT Maintenance allocations 0.0 (123) (22) 0 0 (145)
Professional Service - PCI Scan 0.0 60 0 0 0 60
201 City Centre Drive Lease Cost Corporate Services - IT 0.0 6 4 0 0 10
Fees Recovery - Tax System Support Fees & Fire Dispatch Recovery 0.0 (52) (17) (18) (19) (106)
Departmental Business Services cost allocation - IT 0.0 21 28 28 19 96
Total Base Budget Highlights (1.8) 386 730 664 455 2,235
Note: Numbers may not balance due to rounding
O-14 Business Plan and Budget 2011-2014
9.0 Continuous Improvement One of the key opportunities for continuous improvement for IT is improving the alignment of IT resources by balancing ongoing support with the implementation of new technologies. The requirement to be responsive for operational issues has a direct bearing on the ability to deliver “new” projects and enhancement requests on time and on budget. Currently 20% of IT staff time is dedicated to new projects; the objective by 2014 is to raise this to at least 25% across the division. Resulting efficiencies will allow IT the ability to complete more new projects with the existing staff complement.
The second opportunity will be to incorporate Business Process Review and the Staging of Projects by the end of 2012.
Having a Business Analyst complete the Design \ Blueprint \ Business Process Review phase will result in a higher degree of accuracy of the business process, success for finishing projects on time and on budget, less scope creep and change orders to the projects.
(BR 293) Project Prioritization will be implemented to prioritize projects and IT resources based upon IT resource capacity and the ability to align with strategic priorities.
Agreed upon Service Level Agreements (SLAs) will be in place by 2013 for the ongoing support of major applications with the expectations clearly defined and understood by the client. The IT Division has spent considerable time and effort to identify areas where process changes as well as efficiencies can result in improvements in service delivery such as moving towards more self-service, single sign on, an improved help desk system, and consistent versioning of applications across the city, new application implementation, and ongoing IT support services.
A number of the Budget Requests present opportunities for IT to reduce costs:
(BR 557) Information Technology Reduction to Maintenance and Support Operating Budget
• Toad Software $ 13,000 • eCity eForms $ 18,200 • CISCO reduce by $100,000 • Tax Payment Processor $ 15,000 TOTAL Reductions $146,200
Through continued IT Simplification and improved purchasing power, IT is able to reduce our annual operating costs by just under $146,000 annually. (BR 630) The city’s contract (five year contract) for Multifunction Devices expired and the bid award was made to Ricoh Canada based on the requirement of 60 million monochrome impressions over a period of five years. This new five year contract replaced all 170+ existing multifunction devices deployed throughout the City with up-to-date units. This will result in an annual savings of $137,000.
(BR 631) Utilizing the contract negotiated between the Region of Peel and Rogers Wireless in 2010, the new pricing structure allows for cost savings with the pooling of minutes for a large number of staff. The new pricing structure includes significant saving opportunities. Previously chargeable items are now included in the base cost reducing the administrative efforts required for reconciliation of the user accounts. The system access fee (SAF) has been removed resulting in a savings of $ 60,000 per year. Migrating staff to the new pooling rate plans would reduce the total current annual usage charges by $84,000. Total annual savings is estimated to be $144,000.
Business Plan and Budget 2011-2014 O-15
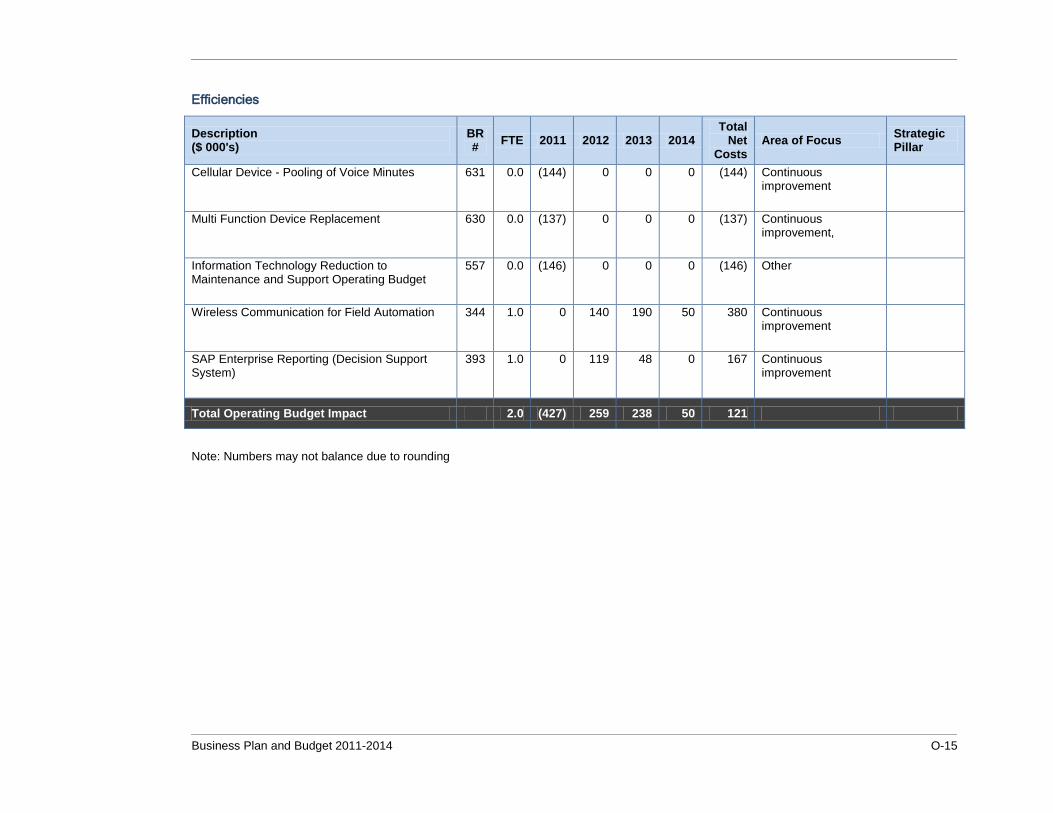
Efficiencies
Description ($ 000's)
BR # FTE 2011 2012 2013 2014
Total Net
Costs Area of Focus Strategic
Pillar
Cellular Device - Pooling of Voice Minutes 631 0.0 (144) 0 0 0 (144) Continuous improvement
Multi Function Device Replacement 630 0.0 (137) 0 0 0 (137) Continuous improvement,
Information Technology Reduction to Maintenance and Support Operating Budget
557 0.0 (146) 0 0 0 (146) Other
Wireless Communication for Field Automation 344 1.0 0 140 190 50 380 Continuous improvement
SAP Enterprise Reporting (Decision Support System)
393 1.0 0 119 48 0 167 Continuous improvement
Total Operating Budget Impact 2.0 (427) 259 238 50 121
Note: Numbers may not balance due to rounding
O-16 Business Plan and Budget 2011-2014
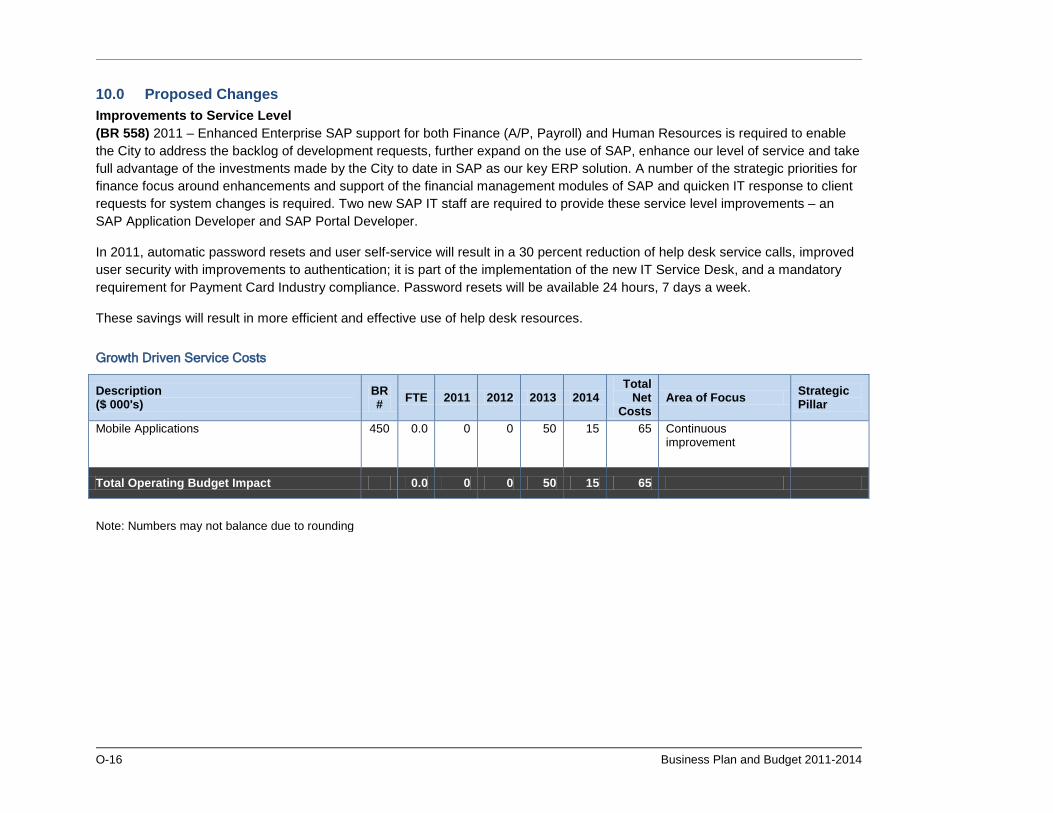
10.0 Proposed Changes Improvements to Service Level (BR 558) 2011 – Enhanced Enterprise SAP support for both Finance (A/P, Payroll) and Human Resources is required to enable the City to address the backlog of development requests, further expand on the use of SAP, enhance our level of service and take full advantage of the investments made by the City to date in SAP as our key ERP solution. A number of the strategic priorities for finance focus around enhancements and support of the financial management modules of SAP and quicken IT response to client requests for system changes is required. Two new SAP IT staff are required to provide these service level improvements – an SAP Application Developer and SAP Portal Developer.
In 2011, automatic password resets and user self-service will result in a 30 percent reduction of help desk service calls, improved user security with improvements to authentication; it is part of the implementation of the new IT Service Desk, and a mandatory requirement for Payment Card Industry compliance. Password resets will be available 24 hours, 7 days a week.
These savings will result in more efficient and effective use of help desk resources.
Growth Driven Service Costs
Description ($ 000's)
BR # FTE 2011 2012 2013 2014
Total Net
Costs Area of Focus Strategic
Pillar
Mobile Applications 450 0.0 0 0 50 15 65 Continuous improvement
Total Operating Budget Impact 0.0 0 0 50 15 65
Note: Numbers may not balance due to rounding
Business Plan and Budget 2011-2014 O-17
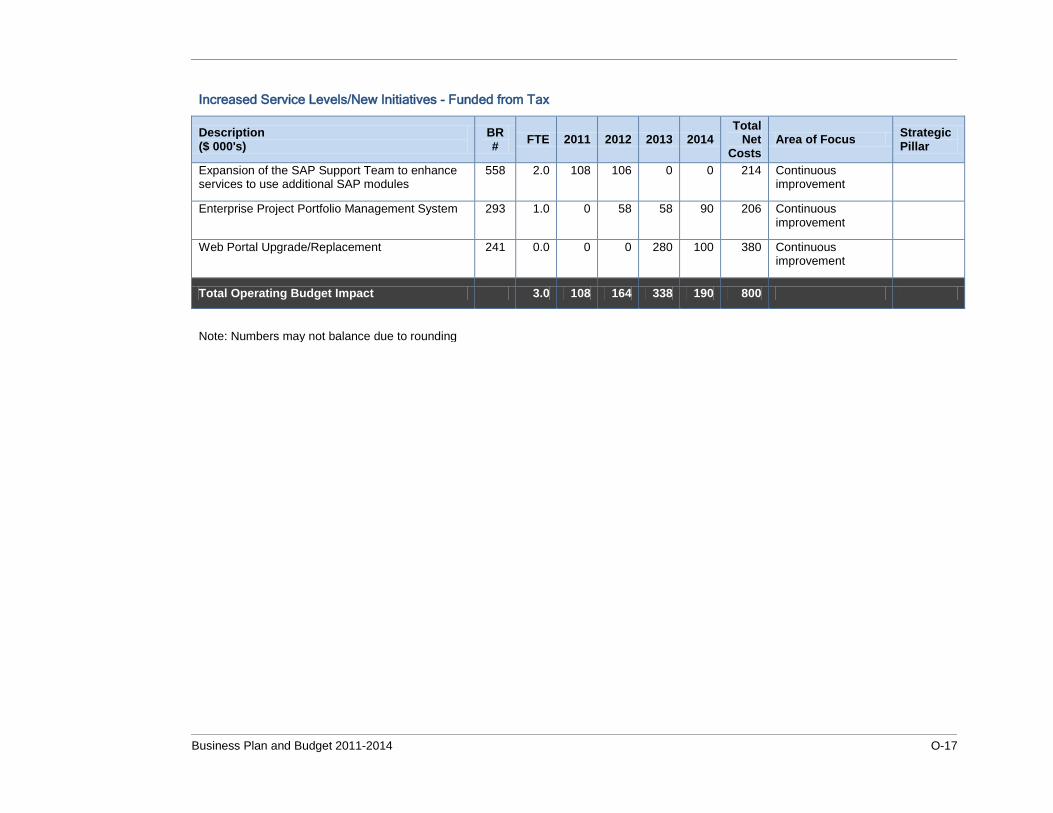
Increased Service Levels/New Initiatives - Funded from Tax
Description ($ 000's)
BR # FTE 2011 2012 2013 2014
Total Net
Costs Area of Focus Strategic
Pillar
Expansion of the SAP Support Team to enhance services to use additional SAP modules
558 2.0 108 106 0 0 214 Continuous improvement
Enterprise Project Portfolio Management System 293 1.0 0 58 58 90 206 Continuous improvement
Web Portal Upgrade/Replacement 241 0.0 0 0 280 100 380 Continuous improvement
Total Operating Budget Impact 3.0 108 164 338 190 800
Note: Numbers may not balance due to rounding
O-18 Business Plan and Budget 2011-2014
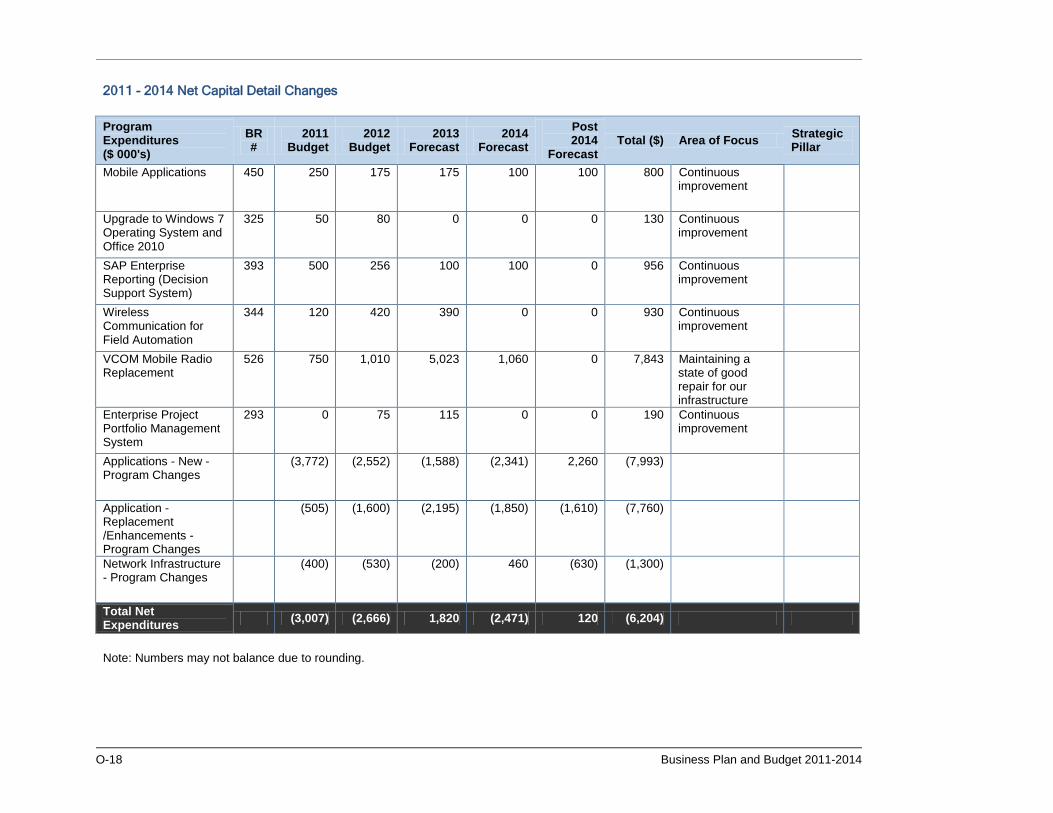
2011 - 2014 Net Capital Detail Changes
Program Expenditures ($ 000's)
BR #
2011 Budget
2012 Budget
2013 Forecast
2014 Forecast
Post 2014
Forecast Total ($) Area of Focus Strategic
Pillar
Mobile Applications 450 250 175 175 100 100 800 Continuous improvement
Upgrade to Windows 7 Operating System and Office 2010
325 50 80 0 0 0 130 Continuous improvement
SAP Enterprise Reporting (Decision Support System)
393 500 256 100 100 0 956 Continuous improvement
Wireless Communication for Field Automation
344 120 420 390 0 0 930 Continuous improvement
VCOM Mobile Radio Replacement
526 750 1,010 5,023 1,060 0 7,843 Maintaining a state of good repair for our infrastructure
Enterprise Project Portfolio Management System
293 0 75 115 0 0 190 Continuous improvement
Applications - New -Program Changes
(3,772) (2,552) (1,588) (2,341) 2,260 (7,993)
Application -Replacement /Enhancements -Program Changes
(505) (1,600) (2,195) (1,850) (1,610) (7,760)
Network Infrastructure - Program Changes
(400) (530) (200) 460 (630) (1,300)
Total Net Expenditures (3,007) (2,666) 1,820 (2,471) 120 (6,204)
Note: Numbers may not balance due to rounding.
Business Plan and Budget 2011-2014 O-19
(BR526) One of the key Budget Requests for IT is the upgrade of the VCOM (Voice Communications System) mobile radio system. The City has been one of ten agencies to subscribe to the VCOM mobile radio system, a Motorola 800 MHz trunked radio system, for the past 13 years. The VCOM system has reached capacity and end of life support from the manufacturer. In 2008, Peel Regional Police, hosted a stakeholder meeting identifying the need to replace this system in a multi-year project spanning 2010 to 2014. The VCOM replacement system will be based on a Project 25 technology platform which is a digital radio public safety agency standard in North America. The new system will enable public safety agency interoperability and ensure future flexibility for growth for emergency and non-emergency use. The VCOM replacement system will require the entire city radio infrastructure to be replaced as well as the end-user subscriber radio equipment.
O-20 Business Plan and Budget 2011-2014
Required Resources
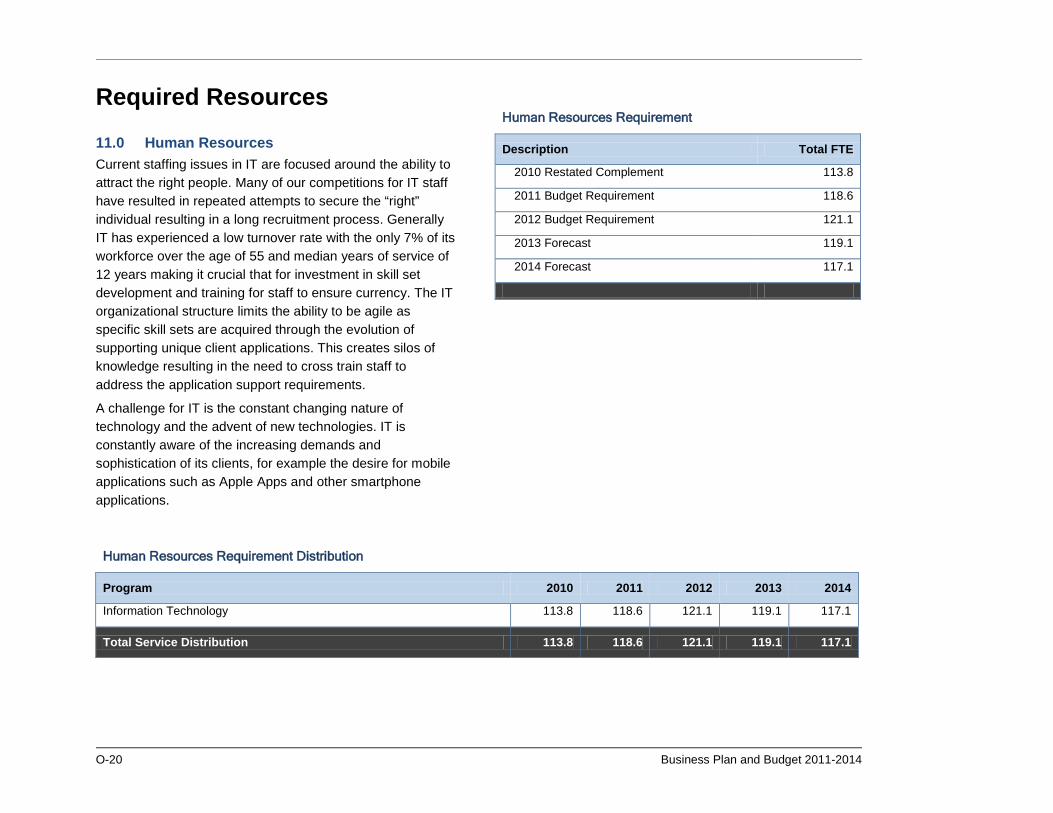
11.0 Human Resources Current staffing issues in IT are focused around the ability to attract the right people. Many of our competitions for IT staff have resulted in repeated attempts to secure the “right” individual resulting in a long recruitment process. Generally IT has experienced a low turnover rate with the only 7% of its workforce over the age of 55 and median years of service of 12 years making it crucial that for investment in skill set development and training for staff to ensure currency. The IT organizational structure limits the ability to be agile as specific skill sets are acquired through the evolution of supporting unique client applications. This creates silos of knowledge resulting in the need to cross train staff to address the application support requirements.
A challenge for IT is the constant changing nature of technology and the advent of new technologies. IT is constantly aware of the increasing demands and sophistication of its clients, for example the desire for mobile applications such as Apple Apps and other smartphone applications.
Human Resources Requirement
Description Total FTE
2010 Restated Complement 113.8
2011 Budget Requirement 118.6
2012 Budget Requirement 121.1
2013 Forecast 119.1
2014 Forecast 117.1
Human Resources Requirement Distribution
Program 2010 2011 2012 2013 2014
Information Technology 113.8 118.6 121.1 119.1 117.1
Total Service Distribution 113.8 118.6 121.1 119.1 117.1
Business Plan and Budget 2011-2014 O-21
12.0 Technology Current The current technologies, tools, and skills allow IT to support more than 390 business and server applications at the city. IT support extends 24/7 with afterhours support provided on an on-call basis as per service level agreements with clients. Gap One of the more immediate gaps that IT will be addressing is to ensure that major projects incorporate a business analysis component and complete a business process review before any development or implementation occurs. There are other technology gaps that will be addressed by IT including: • Reviewing of data backup options as the data backup
window is decreasing as amount of online data is increasing;
• Data storage requirements are growing due to the limited archiving of data; and
• Enterprise Document Management and collaboration tools will be facilitated across the corporation.
Future A future objective for IT is to maintain sustainable programs, current service levels for support and maintenance and to increase the percentage of the IT Capital Budget on new business solutions and IT initiatives. Currently 84% of the IT Capital budget is in place for sustainable programs, 16% is for new business solutions. The objective is to move this to 65% for sustainable programs and 35% of the annual IT Capital Budget for new business solutions through the course of the business plan implementation period, 2011-2014.
13.0 Facilities During the summer of 2010 IT Administration, Planning and Integration & Departmental Systems moved to the 5th Floor in the tower from their two ground floor locations. The space on the 5th floor is sufficient for a very small amount of the growth. Anything more significant will impact the ability to accommodate new staff. Options for consideration may include a mobile workforce, alternate work arrangements, having IT staff reside in the departments they support, shared workspaces, and shifts. The 7th floor Client Services staff will be relocated to B1 once renovations are complete. The Disaster Recovery and Backup Site and IT training room will move upon completion of Fire Training Centre in late 2011.
O-22 Business Plan and Budget 2011-2014
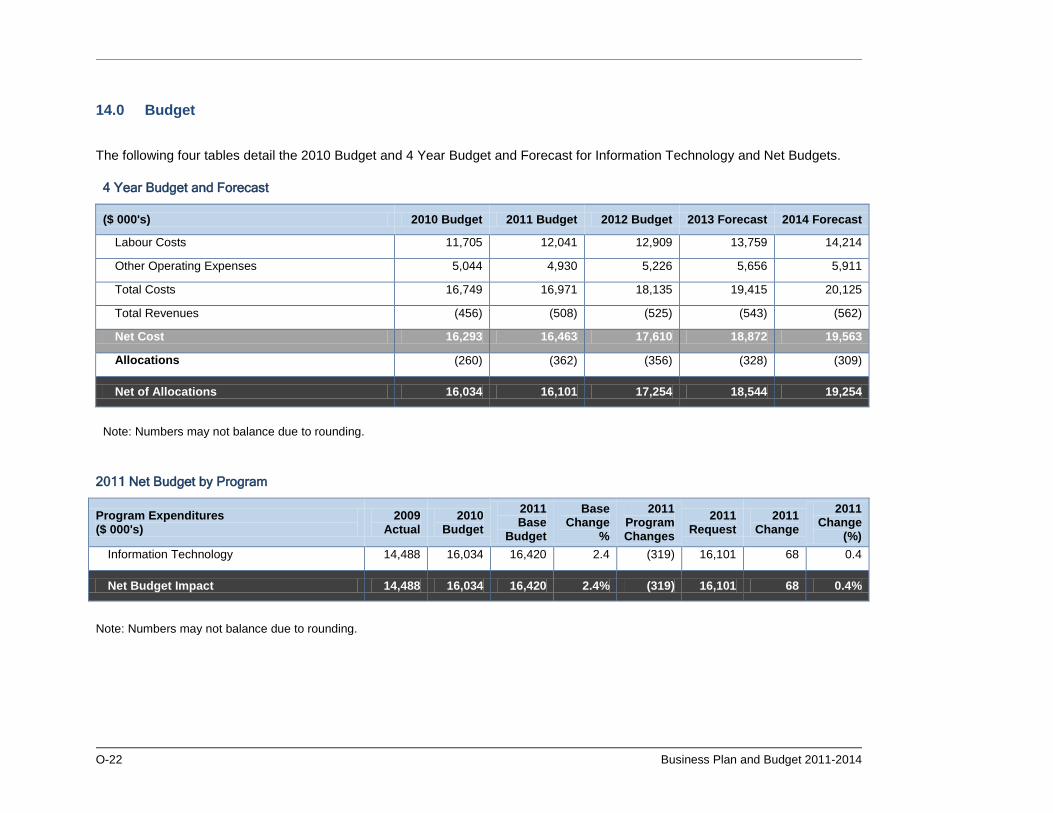
14.0 Budget
The following four tables detail the 2010 Budget and 4 Year Budget and Forecast for Information Technology and Net Budgets.
4 Year Budget and Forecast
($ 000's) 2010 Budget 2011 Budget 2012 Budget 2013 Forecast 2014 Forecast
Labour Costs 11,705 12,041 12,909 13,759 14,214
Other Operating Expenses 5,044 4,930 5,226 5,656 5,911
Total Costs 16,749 16,971 18,135 19,415 20,125
Total Revenues (456) (508) (525) (543) (562)
Net Cost 16,293 16,463 17,610 18,872 19,563
Allocations (260) (362) (356) (328) (309)
Net of Allocations 16,034 16,101 17,254 18,544 19,254
Note: Numbers may not balance due to rounding.
2011 Net Budget by Program
Program Expenditures ($ 000's)
2009 Actual
2010 Budget
2011 Base
Budget
Base Change
%
2011 Program Changes
2011 Request
2011 Change
2011 Change
(%) Information Technology 14,488 16,034 16,420 2.4 (319) 16,101 68 0.4
Net Budget Impact 14,488 16,034 16,420 2.4% (319) 16,101 68 0.4%
Note: Numbers may not balance due to rounding.
Business Plan and Budget 2011-2014 O-23
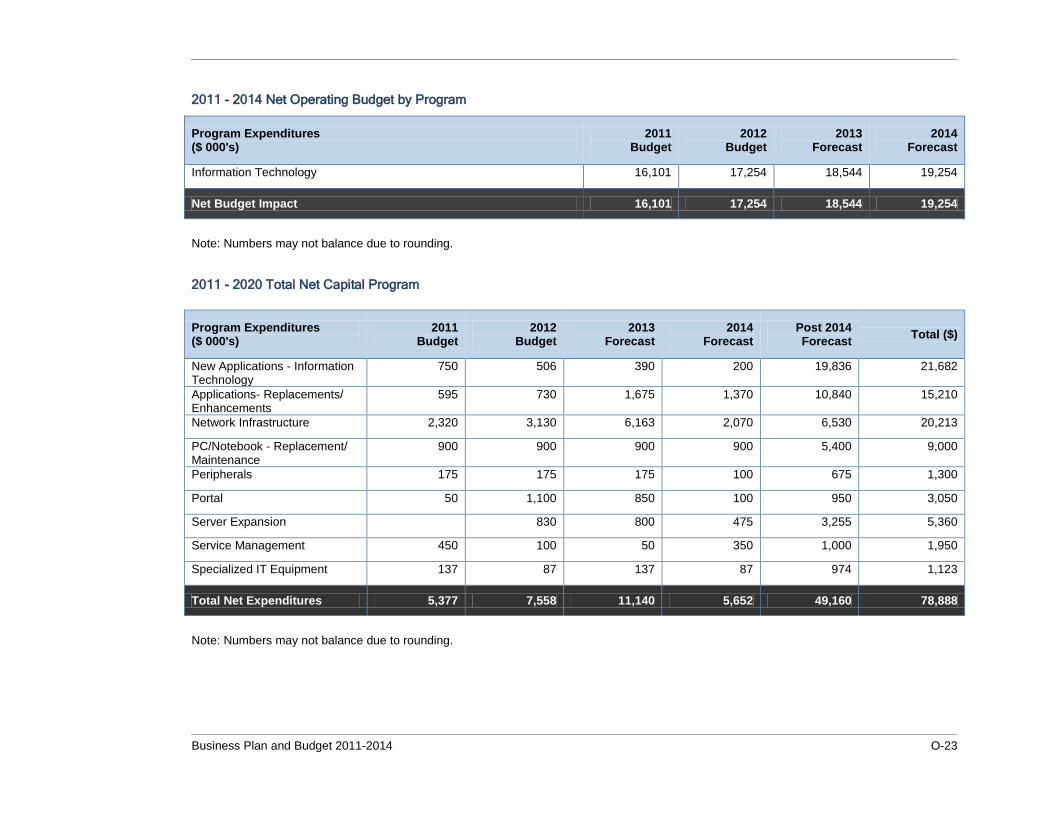
2011 - 2014 Net Operating Budget by Program
Program Expenditures ($ 000's)
2011 Budget
2012 Budget
2013 Forecast
2014 Forecast
Information Technology 16,101 17,254 18,544 19,254
Net Budget Impact 16,101 17,254 18,544 19,254
Note: Numbers may not balance due to rounding.
2011 - 2020 Total Net Capital Program
Program Expenditures ($ 000's)
2011 Budget
2012 Budget
2013 Forecast
2014 Forecast
Post 2014 Forecast Total ($)
New Applications - Information Technology
750 506 390 200 19,836 21,682
Applications- Replacements/ Enhancements
595 730 1,675 1,370 10,840 15,210
Network Infrastructure 2,320 3,130 6,163 2,070 6,530 20,213
PC/Notebook - Replacement/ Maintenance
900 900 900 900 5,400 9,000
Peripherals 175 175 175 100 675 1,300
Portal 50 1,100 850 100 950 3,050
Server Expansion 830 800 475 3,255 5,360
Service Management 450 100 50 350 1,000 1,950
Specialized IT Equipment 137 87 137 87 974 1,123
Total Net Expenditures 5,377 7,558 11,140 5,652 49,160 78,888
Note: Numbers may not balance due to rounding.
O-24 Business Plan and Budget 2011-2014
Performance Measures
15.0 Balanced Scorecard A Balanced Scorecard identifies measures for four key areas for an organization’s performance: Financial; Customers; Employees; and Business Processes.
By paying attention to all four areas an organization can retain balance to its performance and know that it is moving towards the attainment of its goals.
About the Measures for Information Technology
Financial Measures
Total Cost of Ownership (Operating + Capital / #Users) gives an overall cost of providing IT services on a per user basis for year over year comparisons.
% of Operational Budget Spent on Outsourcing - gives a marker both on the ability to provide service internally (expertise) and the ability to use hosted vendor solutions to ease client support.
Customer Measures
% First Call Resolution Help Desk Calls measures the overall ability of the IT Help Desk to resolve help requests on first point of contact.
Employee Measures
% IT Budget spent on IT training will measure the ability of IT to keep current in the technology used at the City, both current and new.
Employee Job Satisfaction Value (IT Division) conducted an Engagement Survey (2006 value 79.4%). Job satisfaction
is a key overall component of the bi-annual Employee Engagement Survey conducted by Metrics@Work.
Business Process Measures
% System Uptime/Availability is the foundation for IT and system uptime is the key measure.
% of Enterprise Applications with a Road Map are major applications at the City are expected to have a 10 year life span, as such to ensure that proper support and direction are in place each application should have a Road Map detailing this information.
Business Plan and Budget 2011-2014 O-25
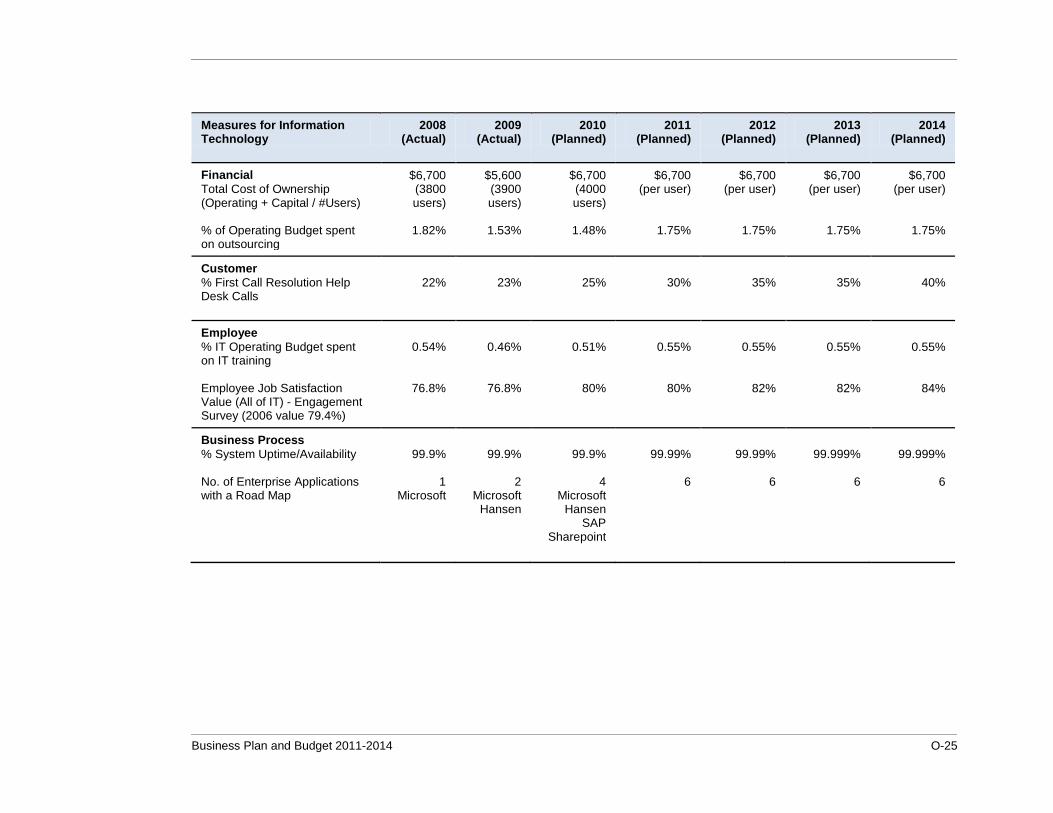
Measures for Information Technology
2008 (Actual)
2009 (Actual)
2010 (Planned)
2011 (Planned)
2012 (Planned)
2013 (Planned)
2014 (Planned)
Financial Total Cost of Ownership (Operating + Capital / #Users) % of Operating Budget spent on outsourcing
$6,700 (3800 users)
1.82%
$5,600 (3900 users)
1.53%
$6,700 (4000 users)
1.48%
$6,700 (per user)
1.75%
$6,700 (per user)
1.75%
$6,700 (per user)
1.75%
$6,700 (per user)
1.75%
Customer % First Call Resolution Help Desk Calls
22%
23%
25%
30%
35%
35%
40%
Employee % IT Operating Budget spent on IT training Employee Job Satisfaction Value (All of IT) - Engagement Survey (2006 value 79.4%)
0.54%
76.8%
0.46%
76.8%
0.51%
80%
0.55%
80%
0.55%
82%
0.55%
82%
0.55%
84%
Business Process % System Uptime/Availability No. of Enterprise Applications with a Road Map
99.9%
1
Microsoft
99.9%
2
Microsoft Hansen
99.9%
4
Microsoft Hansen
SAP Sharepoint
99.99%
6
99.99%
6
99.999%
6
99.999%
6
O-26 Business Plan and Budget 2011-2014