plan – technical report for senior whole health york state department of health office of quality...
TRANSCRIPT

NEW YORK STATE DEPARTMENT OF HEALTH Office of Quality and Patient Safety
Plan – Technical Report For
Senior Whole Health
Reporting Years 2013 and 2014
February 2017
Table of Contents Section One: About This Report ................................................................................................................... 1
Section Two: Plan Profile ............................................................................................................................. 3
Section Three: Enrollment ........................................................................................................................... 4
Section Four: Member Satisfaction .............................................................................................................. 5
Section Five: SAAM and UAS ........................................................................................................................ 8
Section Six: Performance Improvement Projects ...................................................................................... 17
Section Seven: Overall Strengths and Opportunities .................................................................................. 20

1
Section One: About This Report New York State (NYS) is dedicated to providing and maintaining the highest quality of care for enrollees in managed long term care (MLTC) plans. MLTC enrollees are generally chronically ill, often elderly enrollees and are among the most vulnerable New Yorkers. The New York State Department of Health’s (NYSDOH) Office of Quality and Patient Safety (OQPS) employs an ongoing strategy to improve the quality of care provided to plan enrollees, to ensure the accountability of these plans and to maintain the continuity of care to the public. The MLTC Plan‐Technical Reports are individualized reports on the MLTC plans certified to provide Medicaid coverage in NYS. The reports are organized into the following domains: Plan Profile, Enrollment, Member Satisfaction, SAAM and UAS Clinical Assessment Data, and Performance Improvement Projects (PIPs). When available and appropriate, the plans’ data in these domains are compared to statewide benchmarks. The final section of the report provides an assessment of the MLTC plan’s strengths and opportunities for improvement in the areas of service quality, accessibility, and timeliness. For areas in which the plan has opportunities for improvement, recommendations for improving the quality of the MLTC plan’s services are provided. During the review period of this report (2013‐14), there were three (3) MLTC plan types:
a) Partially Capitated b) Program of All‐inclusive Care for the Elderly (PACE) c) Medicaid Advantage Plus (MAP)
A description of each of the plan types follows: Partially Capitated ‐ A Medicaid capitation payment is provided to the plan to cover the costs of long term care and selected ancillary services. The member’s ambulatory care and inpatient services are paid by Medicare if they are dually eligible for both Medicare and Medicaid, or by Medicaid if they are not Medicare eligible. For the most part, those who are only eligible for Medicaid receive non‐MLTC services through Medicaid fee for service, as members in partially capitated MLTC plans are ineligible to join a traditional Medicaid managed care plan. The minimum age requirement is 18 years. PACE ‐ A PACE plan provides a comprehensive system of health care services for members 55 and older, who are otherwise eligible for nursing home admission. Both Medicaid and Medicare pay for PACE services on a capitated basis. Members are required to use PACE physicians. An interdisciplinary team develops a care plan and provides ongoing care management. The PACE plan is responsible for directly providing or arranging all primary, inpatient hospital and long term care services required by a PACE member. The PACE is approved by the Centers for Medicare and Medicaid Services (CMS). Medicaid Advantage Plus (MAP) ‐ MAP plans must be certified by the NYSDOH as MLTC plans and by CMS as a Medicare Advantage plan. As with the PACE model, the plan receives a capitation payment from both Medicaid and Medicare. The Medicaid benefit package includes the long term care services and the Medicare benefit package includes the ambulatory care and inpatient services.
2
An MLTC plan can service more than one of the above products and, where applicable, the report will present data for each product. In an effort to provide the most consistent presentation of this varied information, the report is prepared based upon data for the most current calendar year available. Where trending is desirable, data for prior calendar years may also be included. This report includes data for reporting years 2013 and 2014.

3
Section Two: Plan Profile Senior Whole Health (SWH) is a regional Managed Long‐Term Care (MLTC) plan with a Medicaid Advantage Plus (MAP) and a partially capitated product line. The following report presents plan‐specific information.
Partially Capitated Plan ID: 03459881
MAP Plan ID: 02932896
Managed Long‐Term Care Start Date: 2008 (MAP) 2012 (Part Cap)
Product Line(s): MAP and Partially Capitated
MLTC Age Requirement: 65 and older (MAP) 21 and older (Part Cap)
Contact Information: 111 Broadway Suite 1505 New York, NY 10006 (877) 353‐0185
Participating Counties and Programs
New York (not including Staten Island) Part Cap MAP
4
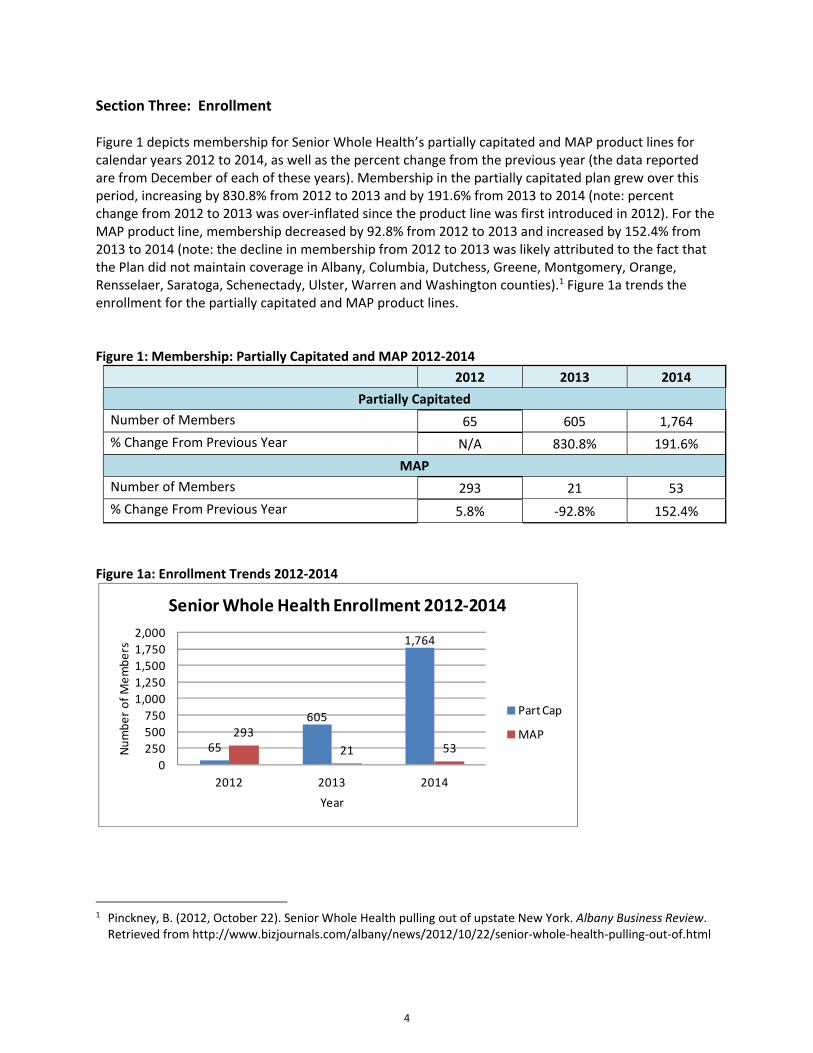
Section Three: Enrollment Figure 1 depicts membership for Senior Whole Health’s partially capitated and MAP product lines for calendar years 2012 to 2014, as well as the percent change from the previous year (the data reported are from December of each of these years). Membership in the partially capitated plan grew over this period, increasing by 830.8% from 2012 to 2013 and by 191.6% from 2013 to 2014 (note: percent change from 2012 to 2013 was over‐inflated since the product line was first introduced in 2012). For the MAP product line, membership decreased by 92.8% from 2012 to 2013 and increased by 152.4% from 2013 to 2014 (note: the decline in membership from 2012 to 2013 was likely attributed to the fact that the Plan did not maintain coverage in Albany, Columbia, Dutchess, Greene, Montgomery, Orange, Rensselaer, Saratoga, Schenectady, Ulster, Warren and Washington counties).1 Figure 1a trends the enrollment for the partially capitated and MAP product lines. Figure 1: Membership: Partially Capitated and MAP 2012‐2014
2012 2013 2014
Partially Capitated
Number of Members 65 605 1,764
% Change From Previous Year N/A 830.8% 191.6%
MAP
Number of Members 293 21 53
% Change From Previous Year 5.8% ‐92.8% 152.4%
Figure 1a: Enrollment Trends 2012‐2014
1 Pinckney, B. (2012, October 22). Senior Whole Health pulling out of upstate New York. Albany Business Review. Retrieved from http://www.bizjournals.com/albany/news/2012/10/22/senior‐whole‐health‐pulling‐out‐of.html
65
605
1,764
293
21 53
0
250
500
750
1,000
1,250
1,500
1,750
2,000
2012 2013 2014
Number of Members
Year
Senior Whole Health Enrollment 2012‐2014
Part Cap
MAP
5
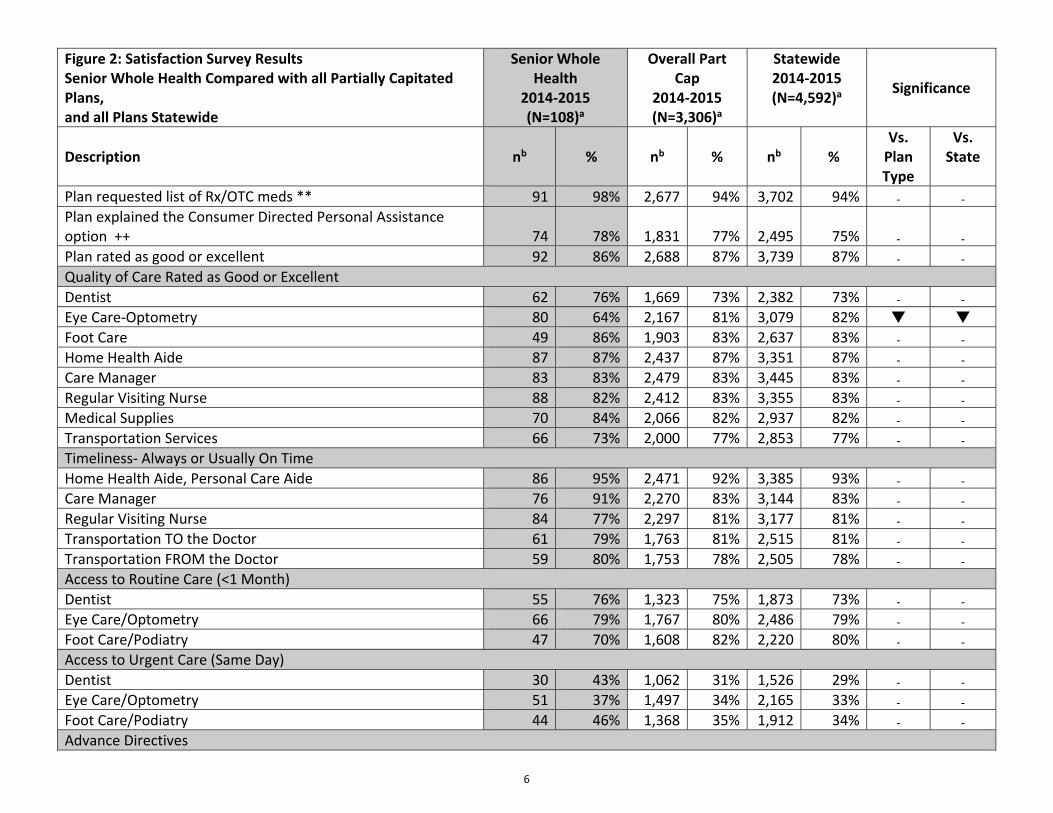
Section Four: Member Satisfaction IPRO, in conjunction with the NYSDOH, conducted a member satisfaction survey mailed between December 2014 and May 2015. The NYSDOH provided the member sample frame for the survey, which included the primary language for the majority of members. From this file, a sample of 600 members from each plan was selected, or the entire membership if the plan’s enrollment was less than 600. Of the 18,909 surveys that were mailed, 1,109 were returned as undeliverable due to either mailing address issues or the member being deceased. This yielded an adjusted population of 17,800. A total of 4,592 surveys were completed, yielding an overall response rate of 25.8%. The response rate for Senior Whole Health’s partially capitated product line was 19.3% (108 respondents out of 559 members in the sample). The response rate for Senior Whole Health’s MAP product line was 12.5% (2 respondents out of 16 members in the sample). Figure 2 represents the 2014‐2015 satisfaction survey results from Senior Whole Health’s partially capitated product line, compared with all other partially capitated plans throughout the state, as well as all MLTC plans statewide, in the areas of plan rating, quality ratings for key services, timeliness of critical services, access to critical services, and advance directives. It should be noted that 2012‐2013 partially capitated and 2012‐2013 and 2014‐2015 MAP survey results are not provided, as the sample size was too small to yield any meaningful comparisons.
6
Figure 2: Satisfaction Survey Results Senior Whole Health Compared with all Partially Capitated Plans, and all Plans Statewide
Senior Whole Health
2014‐2015 (N=108)a
Overall Part Cap
2014‐2015 (N=3,306)a
Statewide 2014‐2015 (N=4,592)a
Significance
Description nb % nb % nb % Vs. Plan Type
Vs. State
Plan requested list of Rx/OTC meds ** 91 98% 2,677 94% 3,702 94% - -
Plan explained the Consumer Directed Personal Assistance option ++ 74 78% 1,831 77% 2,495 75% - -
Plan rated as good or excellent 92 86% 2,688 87% 3,739 87% - -
Quality of Care Rated as Good or Excellent
Dentist 62 76% 1,669 73% 2,382 73% - -
Eye Care‐Optometry 80 64% 2,167 81% 3,079 82% Foot Care 49 86% 1,903 83% 2,637 83% - -
Home Health Aide 87 87% 2,437 87% 3,351 87% - -
Care Manager 83 83% 2,479 83% 3,445 83% - -
Regular Visiting Nurse 88 82% 2,412 83% 3,355 83% - -
Medical Supplies 70 84% 2,066 82% 2,937 82% - -
Transportation Services 66 73% 2,000 77% 2,853 77% - -
Timeliness‐ Always or Usually On Time
Home Health Aide, Personal Care Aide 86 95% 2,471 92% 3,385 93% - -
Care Manager 76 91% 2,270 83% 3,144 83% - -
Regular Visiting Nurse 84 77% 2,297 81% 3,177 81% - -
Transportation TO the Doctor 61 79% 1,763 81% 2,515 81% - -
Transportation FROM the Doctor 59 80% 1,753 78% 2,505 78% - -
Access to Routine Care (<1 Month)
Dentist 55 76% 1,323 75% 1,873 73% - -
Eye Care/Optometry 66 79% 1,767 80% 2,486 79% - -
Foot Care/Podiatry 47 70% 1,608 82% 2,220 80% - -
Access to Urgent Care (Same Day)
Dentist 30 43% 1,062 31% 1,526 29% - -
Eye Care/Optometry 51 37% 1,497 34% 2,165 33% - -
Foot Care/Podiatry 44 46% 1,368 35% 1,912 34% - -
Advance Directives

7
Plan has discussed appointing someone to make decisions 87 59% 2,660 64% 3,757 67% - -
Member has legal document appointing someone to make decisions 84 45% 2,645 53% 3,722 58% - -
Health plan has a copy of this document ◊ 26 73% 913 75% 1,506 79% NA NA
LEGEND
Symbol Description a N reflects the total number of members who completed the survey b n reflects the total number of members who responded to each survey item
** Represents question that has been added to the 2013‐2014 technical report
++ Represents new question in 2014‐2015 survey
Represents a significantly lower rate versus the Partially Capitated/statewide rate (p < .001)
◊ Item based on a skip pattern
N/A Significance testing could not be performed due to small sample size (n<30)
Satisfaction survey results demonstrated that Senior Whole Health’s partially capitated members rated the majority of their services and care similarly to members enrolled in other partially capitated plans, and in all plans statewide. There are, however, a few notable differences. A lower percentage of members indicated the quality of their eye care was good or excellent, compared with other partially capitated members and members statewide (64% vs. 81% and 82%, respectively). In contrast, a higher percentage of members indicated they had same‐day access to a dentist, podiatrist, or optometrist for urgent care.

8
Section Five: SAAM and UAS The Semi Annual Assessment of Members (SAAM) was the assessment tool utilized by the MLTC plans to conduct clinical assessments of members, at start of enrollment and at six month intervals thereafter, through 2013. There are fifteen (15) care categories, or domains, in SAAM, as follows: Diagnosis/Prognosis/Surgeries Living arrangements Supportive assistance Sensory status Integumentary status Respiratory status Elimination status Nursing Home Admissions
Falls Neuro/Emotional Behavioral Status ADL/IADLs Medications Equipment Management Emergent Care Hospitalizations
SAAM data were submitted to the NYSDOH twice annually, in January and July, through July 2013. The January submission consisted of assessments conducted between July and December of the prior year; the July submission consisted of assessments conducted between January and June of the same year. Twice annually, following submissions, the NYSDOH issued plan‐specific reports containing plan mean results and comparison to statewide averages. In 2007, the SAAM was expanded beyond its role as a clinical assessment tool, to determine MLTC plan eligibility. An eligibility scoring index was created; the scoring index consisted of 13 items/questions, as follows: Urinary Incontinence Bowel incontinence frequency Cognitive functioning Confusion Anxiety Depression Ability to dress upper body
Ability to dress lower body Bathing Toileting Transferring Ambulation/Locomotion Feeding/Eating
Each item had a point value; a combined total score of 5 or greater constituted MLTC eligibility. Effective October 2013, the SAAM tool was replaced by the Uniform Assessment System for NY (UAS‐NY). The UAS‐NY is a web based clinical assessment tool based on a uniform data set, which standardizes and automates needs assessments for home and community based programs in New York2. Data are immediately available to users during and upon completion of the assessment. Figure 3a contains Senior Whole Health’s July 2013 SAAM results for their partially capitated line, and Figure 3b contains Senior Whole Health’s January‐June and July‐December 2014 UAS results. Figure 4a contains Senior Whole Health’s July 2013 SAAM results for their MAP line, and Figure 4b contains Senior Whole Health’s January‐June and July‐December 2014 UAS results.
Figure 3a: Senior Whole Health Partially Capitated and Statewide SAAM Data 2013
2 NYS Department of Health, 2014 Managed Long Term Care Report. http://health.ny.gov

9
SAAM Items
July 2013
Plan SAAM N=268
Statewide SAAM
N=111,444
Activities of Daily Living (ADL)
Ambulation/Locomotion – % of members who could perform task independently, with setup help/device, or with supervision
88% 92%
Bathing – % of members who could perform task independently, with setup help/device, or with supervision
85% 89%
Upper Body Dressing – % of members able to perform task independently, with setup help, or with supervision
86% 87%
Lower Body Dressing – % of members able to perform task independently, with setup help, or with supervision
84% 79%
Toileting – % of members able to perform task independently, with setup help, or with supervision
87% 91%
Transferring‐ % of members able to transfer independently, with use of an assistive device, or with supervision/minimal assistance
83% 88%
Feeding/Eating – % of members able to eat/drink independently, with setup help, or with supervision
98% 99%
Continence
Urinary Continence – % who are continent, have control with catheter/ostomy, or were infrequently incontinent
46% 27%
Bowel Continence – % who are continent, have control with ostomy, or were infrequently incontinent
72% 79%
Cognition
Cognitive Impairment – % members with no cognitive impairment
34% 40%
When Confused – % with no confusion
25% 34%
Mood and Behavior
Anxiety – % with no feelings of anxiety
25% 38%
Depressed – % with no feelings of depression
42% 74%
Health Conditions

10
SAAM Items
July 2013
Plan SAAM N=268
Statewide SAAM
N=111,444
Frequency of Pain – % experiencing no pain, or pain less than daily
32% 44%
Falls Resulting in Medical Intervention – % of members experiencing no falls requiring medical intervention
53% 55%
Prevention
Influenza Vaccine – % who had influenza vaccine in last year
60% 73%
Senior Whole Health Partially Capitated SAAM July 2013 A lower percentage of Senior Whole Health demonstrated no confusion, no feelings of anxiety or depression, and no pain compared to members statewide. Additionally, a lower percentage of members received the influenza vaccine (60% vs. 73% statewide). In contrast, a higher percentage of Senior Whole Health members demonstrated urinary continence when compared to members statewide (46% vs. 27% respectively).

11
Figure 3b: Senior Whole Health Partially Capitated and Statewide UAS Data 2014
UAS Items
Jan‐June 2014 July‐Dec 2014
Plan UAS N=799
Statewide UAS
N=125,702
Plan UAS
N=1,517
StatewideUAS
N=132,429
Activities of Daily Living (ADL)
Ambulation/Locomotion – % of members who could perform task independently, with setup help/device, or with supervision
61% 56% 65% 53%
Bathing – % of members who could perform task independently, with setup help/device, or with supervision
22% 19% 20% 16%
Upper Body Dressing – % of members able to perform task independently, with setup help, or with supervision
42% 33% 41% 30%
Lower Body Dressing – % of members able to perform task independently, with setup help, or with supervision
16% 19% 18% 16%
Toileting – % of members able to perform task independently, with setup help, or with supervision
71% 63% 73% 57%
Feeding/Eating – % of members able to eat/drink independently, with setup help, or with supervision
90% 87% 92% 86%
Continence
Urinary Continence – % who are continent, have control with catheter/ostomy, or were infrequently incontinent
47% 36% 48% 36%
Bowel Continence – % who are continent, have control with ostomy, or were infrequently incontinent
88% 83% 88% 83%
Cognition
Cognitive functioning – % with intact functioning
43% 39% 43% 34%
Mood and Behavior
Anxiety – % with no feelings of anxiety
71% 76% 70% 75%
Depressed – % with no feelings of depression
56% 71% 57% 69%
Health Conditions
Frequency of Pain – 16% 26% 13% 22%

12
UAS Items
Jan‐June 2014 July‐Dec 2014
Plan UAS N=799
Statewide UAS
N=125,702
Plan UAS
N=1,517
StatewideUAS
N=132,429
% experiencing no severe daily pain
Falls Resulting in Medical Intervention – % of members experiencing no falls requiring medical intervention
86% 88% 89% 91%
Prevention
Dental Exam – % who had dental exam in last year
52% 49% 54% 50%
Eye Exam – % who had eye exam in last year
73% 71% 76% 73%
Hearing Exam – % who had hearing exam in last 2 years
32% 33% 33% 33%
Influenza Vaccine – % who had influenza vaccine in last year
71% 75% 73% 76%
Senior Whole Health Partially Capitated UAS January‐June 2014 Compared with members statewide, a higher percentage of Senior Whole Health members could perform upper body dressing and toileting independently, with set up help, or with supervision compared with members statewide. In contrast, Senior Whole Health had a lower percentage of members with no feelings of depression and no severe daily pain compared to plans statewide. Senior Whole Health Partially Capitated UAS July‐December 2014 Similar to the UAS outcomes for the first half of the year, a higher percentage of Senior Whole Health members could perform upper body dressing and toileting. Additionally, in both reporting periods, a higher percentage of Senior Whole Health members were able to ambulate, and had intact cognitive functioning compared to members statewide. In contrast, a lower percentage of Senior Whole Health members demonstrated no feelings of depression and no severe daily pain compared with members statewide throughout both reporting periods in 2014.

13
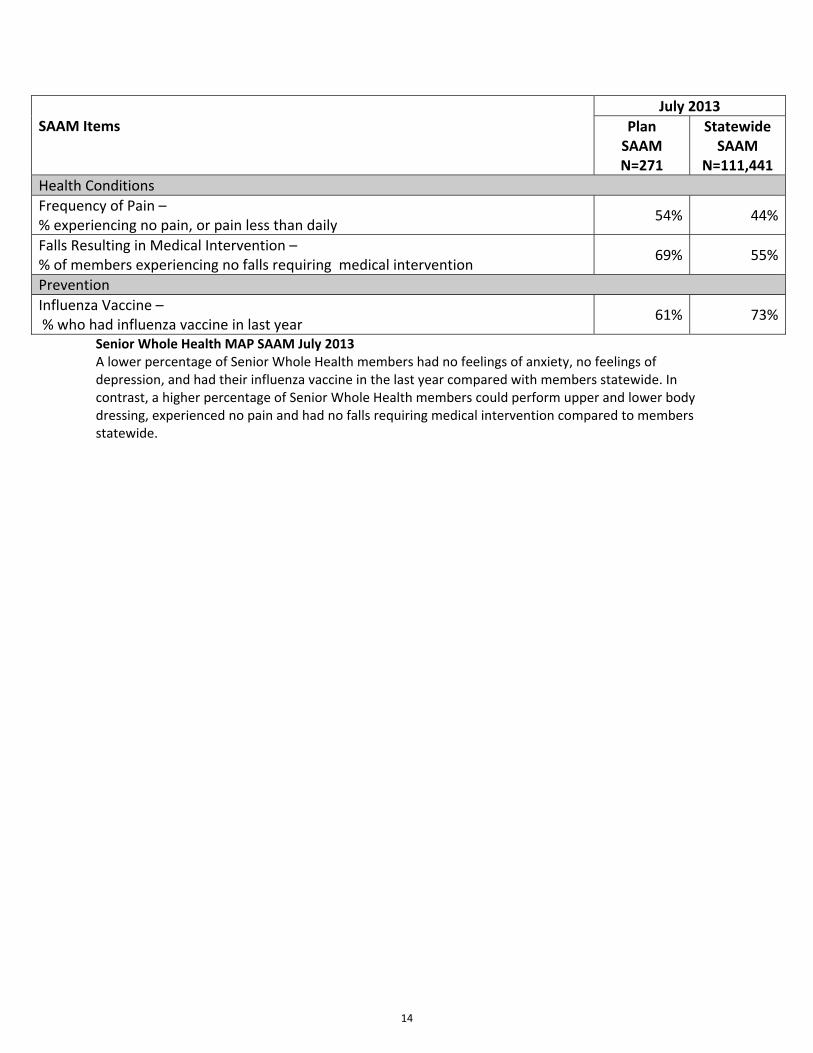
Figure 4a: Senior Whole Health MAP and Statewide SAAM Data 2013
SAAM Items
July 2013
Plan SAAM N=271
Statewide SAAM
N=111,441
Activities of Daily Living (ADL)
Ambulation/Locomotion – % of members who could perform task independently, with setup help/device, or with supervision
95% 92%
Bathing – % of members who could perform task independently, with setup help/device, or with supervision
88% 89%
Upper Body Dressing – % of members able to perform task independently, with setup help, or with supervision
95% 87%
Lower Body Dressing – % of members able to perform task independently, with setup help, or with supervision
91% 79%
Toileting – % of members able to perform task independently, with setup help, or with supervision
98% 91%
Transferring‐ % of members able to transfer independently, with use of an assistive device, or with supervision/minimal assistance
95% 88%
Feeding/Eating – % of members able to eat/drink independently, with setup help, or with supervision
100% 99%
Continence
Urinary Continence – % who are continent, have control with catheter/ostomy, or were infrequently incontinent
42% 27%
Bowel Continence – % who are continent, have control with ostomy, or were infrequently incontinent
79% 79%
Cognition
Cognitive Impairment – % members with no cognitive impairment
37% 40%
When Confused – % with no confusion
28% 34%
Mood and Behavior
Anxiety – % with no feelings of anxiety
19% 38%
Depressed – % with no feelings of depression
35% 74%
14
SAAM Items
July 2013
Plan SAAM N=271
Statewide SAAM
N=111,441
Health Conditions
Frequency of Pain – % experiencing no pain, or pain less than daily
54% 44%
Falls Resulting in Medical Intervention – % of members experiencing no falls requiring medical intervention
69% 55%
Prevention
Influenza Vaccine – % who had influenza vaccine in last year
61% 73%
Senior Whole Health MAP SAAM July 2013 A lower percentage of Senior Whole Health members had no feelings of anxiety, no feelings of depression, and had their influenza vaccine in the last year compared with members statewide. In contrast, a higher percentage of Senior Whole Health members could perform upper and lower body dressing, experienced no pain and had no falls requiring medical intervention compared to members statewide.
15
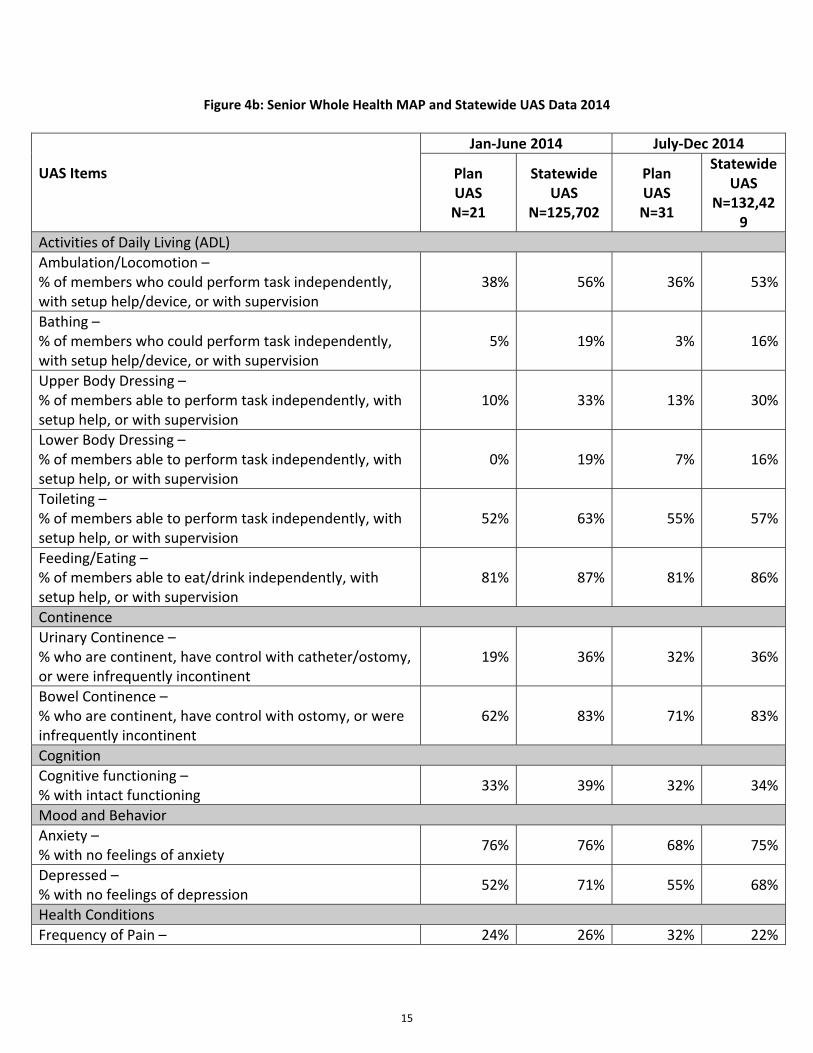
Figure 4b: Senior Whole Health MAP and Statewide UAS Data 2014
UAS Items
Jan‐June 2014 July‐Dec 2014
Plan UAS N=21
Statewide UAS
N=125,702
Plan UAS N=31
StatewideUAS
N=132,429
Activities of Daily Living (ADL)
Ambulation/Locomotion – % of members who could perform task independently, with setup help/device, or with supervision
38% 56% 36% 53%
Bathing – % of members who could perform task independently, with setup help/device, or with supervision
5% 19% 3% 16%
Upper Body Dressing – % of members able to perform task independently, with setup help, or with supervision
10% 33% 13% 30%
Lower Body Dressing – % of members able to perform task independently, with setup help, or with supervision
0% 19% 7% 16%
Toileting – % of members able to perform task independently, with setup help, or with supervision
52% 63% 55% 57%
Feeding/Eating – % of members able to eat/drink independently, with setup help, or with supervision
81% 87% 81% 86%
Continence
Urinary Continence – % who are continent, have control with catheter/ostomy, or were infrequently incontinent
19% 36% 32% 36%
Bowel Continence – % who are continent, have control with ostomy, or were infrequently incontinent
62% 83% 71% 83%
Cognition
Cognitive functioning – % with intact functioning
33% 39% 32% 34%
Mood and Behavior
Anxiety – % with no feelings of anxiety
76% 76% 68% 75%
Depressed – % with no feelings of depression
52% 71% 55% 68%
Health Conditions
Frequency of Pain – 24% 26% 32% 22%

16
UAS Items
Jan‐June 2014 July‐Dec 2014
Plan UAS N=21
Statewide UAS
N=125,702
Plan UAS N=31
StatewideUAS
N=132,429
% experiencing no severe daily pain
Falls Resulting in Medical Intervention – % of members experiencing no falls requiring medical intervention
95% 88% 97% 91%
Prevention
Dental Exam – % who had dental exam in last year
43% 49% 48% 50%
Eye Exam – % who had eye exam in last year
57% 71% 71% 73%
Hearing Exam – % who had hearing exam in last 2 years
29% 33% 23% 33%
Influenza Vaccine – % who had influenza vaccine in last year
76% 75% 68% 76%
Senior Whole Health MAP UAS January‐June 2014 Compared with members statewide, a lower percentage of Senior Whole Health members were able to perform the various ADLs represented above in Figure 4b. In contrast, a higher percentage of Senior Whole Health members experienced no falls requiring medical intervention compared with members statewide (95% vs. 88%, respectively). It should be noted that results should be interpreted with caution, due to the small sample size of Senior Whole Health’s MAP population (n=21). Senior Whole Health MAP UAS July‐December 2014 Similar to the UAS outcomes for ADLs in the first half of the year, there were a lower percentage of Senior Whole Health members who could perform these activities, when compared with members statewide. Also consistent with UAS results in the first reporting period, a higher percentage of Senior Whole Health members exhibited no falls requiring medical intervention.

17
Section Six: Performance Improvement Projects MLTC plans conduct performance improvement projects (PIPs) on an annual basis. Proposed project topics are presented to IPRO and to the NYSDOH prior to the PIP period, for approval. Periodic conference calls are conducted during the PIP period to monitor progress. Senior Whole Health did not perform a PIP in 2013, since the plan was new and did not yet have sufficient membership. The following represents a summary of the Plan’s PIP for 2014: As members in Senior Whole Health are permitted to enroll and disenroll at will, many elements of dissatisfaction can play a role in members’ decisions to terminate with the Plan at any time. Senior Whole Health developed a multifaceted intervention for both MLTC and MAP members to support the establishment and maintenance of health partnerships and promote improved continuity of care, trusting relationships, confidence in the Plan, and true care management. Some of these strategies include both required and additional member focused interventions. By designing planned intervention strategies of increased in‐touch phone calls to members completed by SWH Client Resource Coordinators (CRC) will positively impact membership retention, satisfaction and subsequently improved care coordination between the member and a SWH Nurse Care Manager. The Plan’s focus and emphasis was on the CRC in‐touch call, increasing their success, and the actions taken as a result offer a high likelihood of improving member retention. The goals of this project were as follows: 1) Decrease total disenrollment to a level of 5% or less quarterly. 2) Maintain 85% in‐touch contact (phone calls) to all members monthly. 3) Decrease the rate of highest driver of voluntary disenrollments using the 2014 SWH Member
disenrollement survey. 4) Decrease the number of disenrolled members due to loss of Medicaid benefit.
Interventions include the following: Welcome calls by the CRC for all new members within the first week of membership to inform them
about SWH, their benefits, assure continuation of services, and whether there might be other concerns or needs that need to be addressed. The CRC uses a carefully designed script which will also help identify any members at risk for immediate clinical problems and referral to a nurse care manager –Target 85%.
Calls by the Nurse Care Manager (NCM) assigned to the new members to introduce themselves, review clinical issues, risk stratify so they can determine who needs to be seen immediately, and discuss with the member when the next home visit is planned – Target 85%.
Every month the CRC will attempt to make a scripted in‐touch call to inquire how the member is doing, talk with the caregiver and PCA, and identify any clinical issues that might be developing so that the NCM can call and follow up. – Target 85 %.
Develop more focus on members who have indicators which suggest higher risk for changing plans and disenrollment: o Auto enrolled confusion about plan and benefits; o Any unsatisfactory experience calling requesting more PCA hours; and, o High risk members considering transfer to another plan (UAS).
Integrating retention efforts between CRCs, nurses and sales by: o Ensuring touch points (sales call, nurse visit, welcome call, etc.) have consistent and cohesive
communication about the plans;

18
o Ensuring all teams can explain benefits and services effectively; and o Training all teams on how to handle potential disenrollment and disenrollment requests.
Strengthen welcome calls by CRCs to include questions on their current state and why they are/are not content with coverage.
Add script to triage disenrollment reasons for CRCs. Monthly in‐touch calls for members. Develop and implement a Retention Committee – with monthly meetings. Conduct additional training for staff on potential disenrollments. Conduct new benefit year education on existing members. Results are summarized as follows:
Decrease total disenrollment rate to a level of 5 % or less quarterly.
RY: 2013 Benchmark: 2013 Q1 Q2 Q3 Q4 Findings/Trends
MLTC: % disenrolled membership
6% 6% 4% 4% Baseline
MAP: % disenrolled membership
7% 7% 6% 4% Baseline
RY: 2014 2014 Q1 Q2 Q3 Q4 Findings/Trends
MLTC: % disenrolled membership
4% 3% 2% 2% Decrease in % of members who disenrolled from Q1 to Q4
MAP: % disenrolled membership
7% 9% 3% 7% Due to small population, findings varied from Q1 to Q4
Goal 1: Maintain 85% in‐touch contact (phone calls) to all members (MLTC and MAP) monthly
Goal 2: Decrease rate of highest driver of voluntary disenrollment using the 2014 SWH Member disenrollment survey
Highest Driver Q1 Q2 Q3 Q4
Home Care /PCA Service Hours N/A N/A 3% 4%
Jan‐13 Feb‐13 Mar‐13 Apr‐13 May‐13 Jun‐13 Jul‐13 Aug‐13 Sep‐13 Oct‐13 Nov‐13 Dec‐13
Membership 141 166 229 313 346 356 409 422 440 487 540 609
# Attempted 132 138 227 268 251 253 262 300 378 441 332 397
% of Membership 94% 83% 99% 86% 73% 71% 64% 71% 86% 91% 61% 65%
# Successful 113 127 186 236 230 208 246 260 335 399 300 356
% of Membership 80% 77% 81% 75% 66% 58% 60% 62% 76% 82% 56% 58%
Jan‐14 Feb‐14 Mar‐14 Apr‐14 May‐14 Jun‐14 Jul‐14 Aug‐14 Sep‐14 Oct‐14 Nov‐14 Dec‐14
Membership 670 691 771 824 882 923 1,063 1,159 1,316 1,489 1,658 1,810
# Attempted 416 458 414 448 512 520 672 936 1,152 1,541 1,301 1,320
% of Membership 62% 66% 54% 54% 58% 56% 63% 81% 88% 103% 78% 73%
# Successful 388 407 382 410 466 490 640 823 1,043 1,416 1,110 1,058
% of Membership 58% 59% 50% 50% 53% 53% 60% 71% 79% 95% 67% 58%
In Touch Calls

19
Goal 3: Decrease number of disenrolled members [MLTC/MAP] due to loss of Medicaid benefit
Q1 Q2 Q3 Q4
Loss of Medicaid 3% 3% 2% 2%Conclusions: Successfully demonstrated reduction in disenrollment of MLTC members in calendar year 2014. Identified driver with most impact on disenrollment in 2014 was Home Care/PCA services. Successfully reduced disenrollment due to loss of Medicaid Unsuccessful, did not achieve ≥ 85% (internal target) of in‐touch contact with membership Upon final review of data and interventions implemented for the project, this initiative was meaningful and successful in achieving the established project goals. Senior Whole Health successfully demonstrated a modest trend in the disenrollment reduction in the MLTC program through the implementation of well‐established interventions. Focusing on continuation of monitoring and re‐training of SWH Member Service Representatives to improve their skills to complete in‐touch calls to members, identify the highest driver impacting disenrollment and working with members to retain Medicaid status will positively impact member satisfaction, retention to the plan and maintain member health/wellness status.
20
Section Seven: Overall Strengths and Opportunities
Strengths Partially Capitated Access to Urgent Care (Same Day) A high percentage of Senior Whole Health members indicated they were able to access a dentist and podiatrist for same‐day urgent care. Forty‐three percent (43%) of Senior Whole Health members reported having urgent access to a dentist, compared with members in other partially capitated plans, and members statewide (31% and 29%, respectively). Additionally, forty‐six percent (46%) of Senior Whole Health members reported having urgent access to podiatry care, compared with members in other partially capitated plans, and members statewide (35% and 34%, respectively). Cognition A higher percentage of those enrolled in Senior Whole Health demonstrated intact cognitive functioning compared with members enrolled in other plans statewide throughout both reporting periods in 2014. Continence A higher percentage of SWH’s partially capitated members demonstrated urinary continence, compared with members statewide throughout both reporting periods in 2014. 2014 PIP Senior Whole Health successfully demonstrated a disenrollment reduction in the MLTC program through the implementation of well‐established interventions. Focusing on continued monitoring and re‐training SWH member service representatives, identifying the most common reasons impacting disenrollment and working with members to retain Medicaid status, positively impacted member satisfaction, retention to the plan, and the overall health and wellbeing of the member. MAP Falls A higher percentage of Senior Whole Health members experienced no falls requiring medical intervention compared to members statewide (97% vs. 91%, respectively).
Opportunities Partially Capitated Quality of Care Senior Whole Health members did not rate the quality of care they received from optometry providers as favorably as members enrolled in similar plans and all plans statewide; 64% of SWH members indicated excellent or good quality of care, compared with 81% of other partially capitated members and 82% of all members statewide. Senior Whole Health should consider conducting additional focused surveys to a subset of members, to determine if quality issues do in fact exist with these providers.

21
Depression A lower percentage of Senior Whole Health members indicated they had no feelings of depression, compared with members statewide throughout both UAS reporting periods in 2014. UAS questions pertaining to mood and behavior are prone to a high level of subjectivity at the time of the assessment, and thus it is recommended that Senior Whole Health consider conducting an inter‐rater reliability study, to aid in determining whether these members do in fact have higher levels of impairment. In addition, SWH may consider distributing a focused survey among a subset of members, to determine if these rates are reflective of their members’ behavioral health statuses, and if so, what might be contributing to their depression.
Frequency of Pain A higher percentage of Senior Whole Health members experienced some level of pain on a daily basis, compared with members statewide for both UAS submission periods in 2014. It is recommended that Senior Whole Health consider conducting a Performance Improvement Project, to determine if:
a) The members are prescribed pain medication b) The members are compliant with pain medication
Study results may warrant recommendations to PCPs, to prescribe medication or change existing medication.
MAP Activities of Daily Living A lower percentage of SWH members were able to perform the six activities of daily living (ADLs) compared with members statewide for each of these activities in both UAS assessment periods in 2014. With regard to the most recent UAS reporting period in 2014 (July‐December), the largest difference was in ambulation/locomotion (36% vs. 53% for SWH members and members statewide, respectively) and upper body dressing (13% vs. 30%). The smallest difference was in toileting (55% vs. 57%).
It is recommended that SWH evaluate members’ care plans to determine if any modifications to care are appropriate.