plan601 e session 1 demo 20150413
TRANSCRIPT
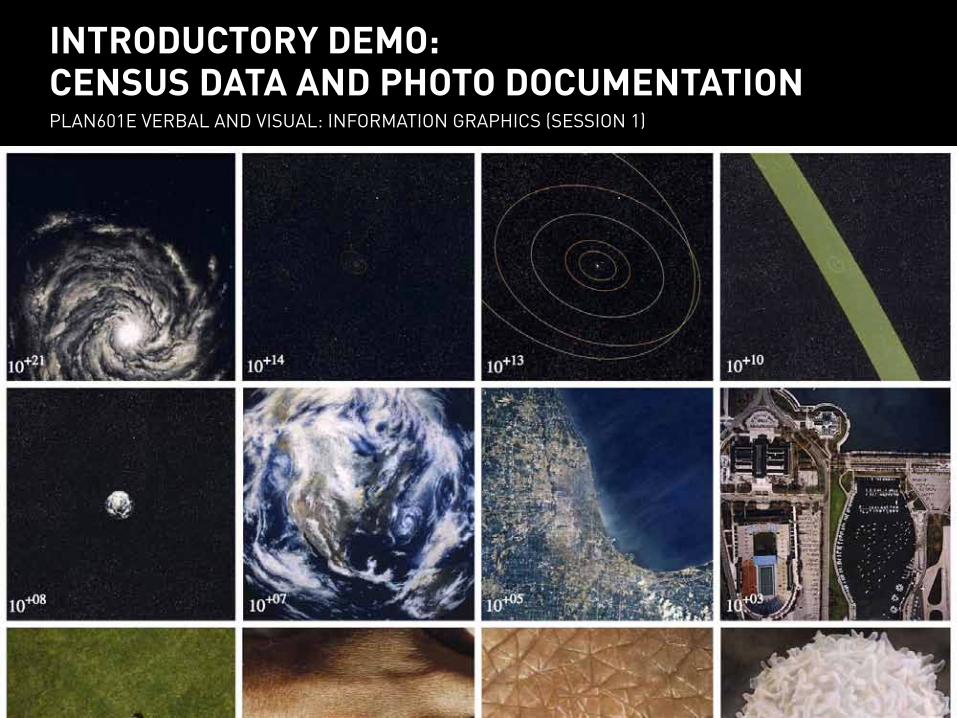
introductory demo:census data and photo documentationPLAN601E VErbAL ANd VisuAL: iNformAtioN GrAPhics (sEssioN 1)

copy exercise filescoPy from PubLic shArE foLdEr to A LocAL foLdEr

retrieving census datausiNG AmEricAN fActfiNdEr

http://factfinder2.census.gov/u.s. censusamerican factfinder

factfinder utilizes ‘selections’ and ‘filters’ in order to call up the census data you’re looking for.
overall structure of american factfinder
filters
selections

factfinder displays the search results of the selections you make as a list of accessible data sets.
overall structure of american factfinder

1) select ‘Geographies’ filter.2) select ‘state>Place’ in ‘geographic type’ options.
searching for data for new york city
we are searching for new york city population data at three scales: city, community district, and census tract.
2
1

3) choose ‘New york’ and ‘New york city’ from the options. 4) click ‘Add to your selections.’
searching for data for new york city
we are searching for new york city population data at three scales: city, community district, and census tract.
34

5) select ‘year’ under the ‘topics’ filter and click on ‘2010’ (the most recent year for which there is population data).
searching for data for new york city
the new york city data set is now in ‘your selections,’ but we have to apply another filter and narrow down the data.
5

6) you can make it easier to scroll through data sets by adding more sets per page.
searching for data for new york city
fact-finder displays all of the data categories for your selection (new york city, 2010) with an id and title.
6
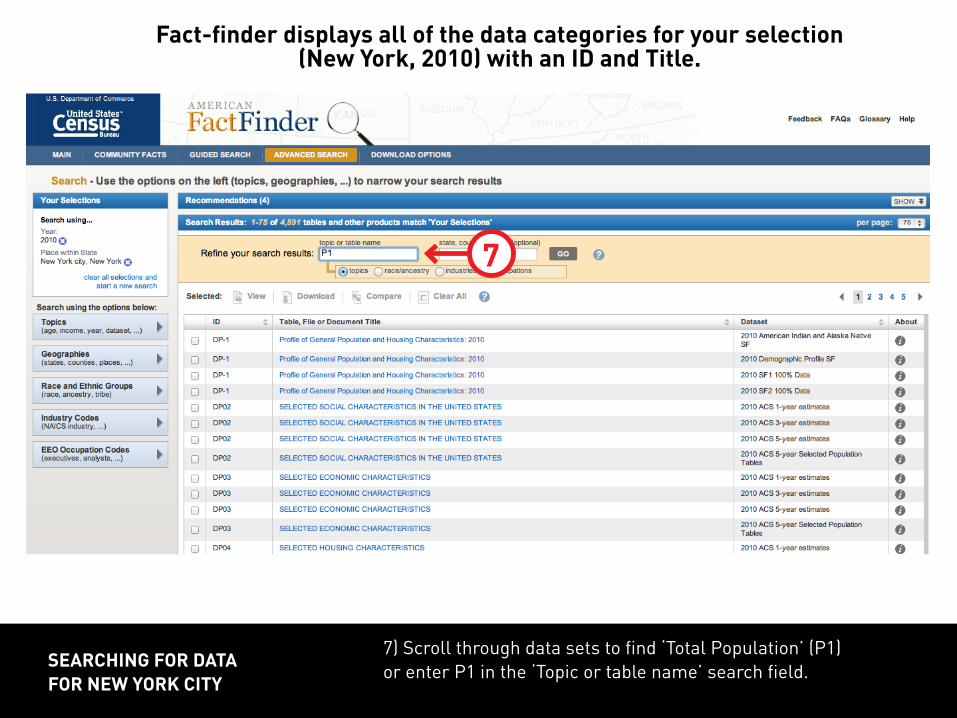
7) scroll through data sets to find ‘total Population’ (P1) or enter P1 in the ‘topic or table name’ search field.
searching for data for new york city
fact-finder displays all of the data categories for your selection (new york, 2010) with an id and title.
7

8) check the box next to ‘total Population.’ 9) click download. the data is in a zipped .csv file.
searching for data for new york city
fact-finder displays all of the data categories for your selection (new york, 2010) with an id and title.
8
9

now we will search for data for the Brownsville study area
there are 29 census tracts in the community district. they are displayed here in ascending order.
searching for data for the study area
study area
301303
365.01 365.02
361363367369 371373 890892894896898
900 902906908 910912916918 920922924 928
10981132
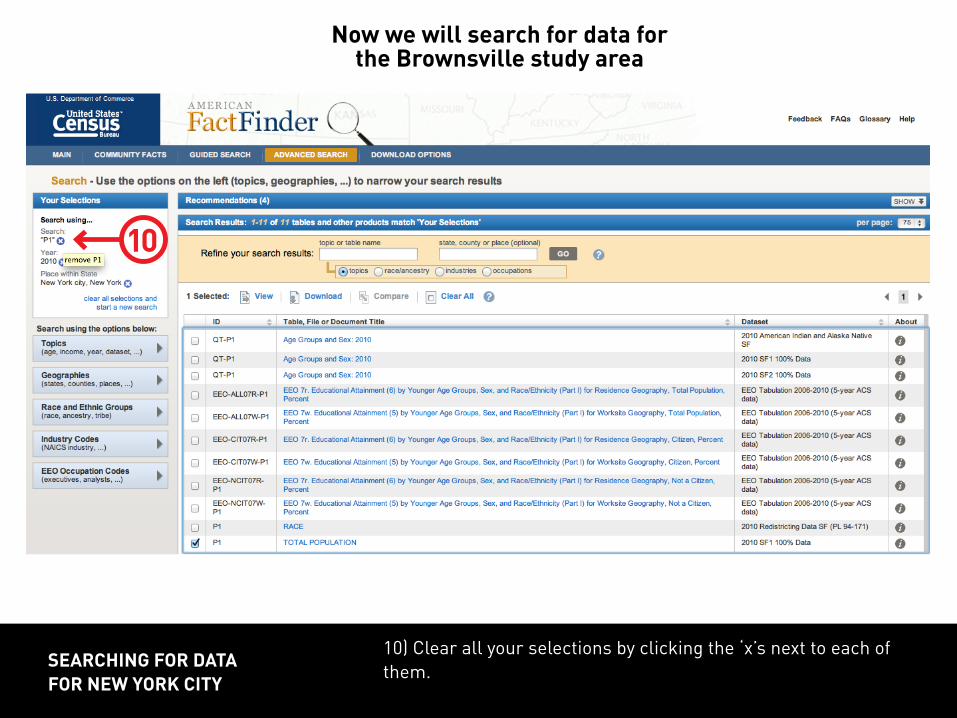
10) clear all your selections by clicking the ‘x’s next to each of them.
searching for data for new york city
now we will search for data for the Brownsville study area
10

11) select geographies filter. 12) select ‘census tract’. 13) select ‘New york’. 14) select ‘New york’. 15) select each tract. 16) click on ‘Add to your selections.’
searching for data for the study area
to create a selection for a community district, you have to filter all of the census tracts in that district.
11
1213
14
15
16

17) click on map to verify you have selected all of the census tracts.
searching for data for the study area
to create a selection for a community district, you have to filter all of the census tracts in that district.
17

18) Enter P1 in the search field. 19) check the box next to P1. 20) click download.
searching for data for the study area
factfinder displays all of the data categories for your selection (7 census tracts) with an id and title.
18
19
20

21) make sure to separate fields by commas. using data from american factfinder
to use the data, open the first .csv file in a spreadsheet program.
21

A quick way to clean up data so it can be sorted: 21) use find/replace to remove extraneous text.
cleaning up data from american factfinder
21
open the second .csv file.

22) sum the population column to get the population for the study area.
cleaning up data from american factfinder
now we can compare population data across three scales: nyc, study area, and census tract
22

introduction to adoBe photoshopoVErViEw of tooLs ANd PANELs
AdjustiNG PhotoGrAPhs
chANGiNG Photo comPositioN ANd Add trANsPArENcy
crEAtiNG A coLLAGE PANorAmA

introduction to photoshop
rgB = red/green/Blue; cmyk = cyan/magenta/yellow/Black
menus
Photoshop is used to edit raster images.

Photoshop is used to edit raster images.introduction to photoshop
photoshop utilizes ‘layers’ to sequence the display of images. double clicking ‘Background’ will make it an active layer.
layers

Photoshop is used to edit raster images.introduction to photoshop
the move tool moves images around the artboard.
move

Photoshop is used to edit raster images.introduction to photoshop
the select tool selects an area of pixels in the image.
select

Photoshop is used to edit raster images.introduction to photoshop
there are several settings under image > adjustments to change the brightness and contrast of images.
levels

Photoshop is used to edit raster images.introduction to photoshop
the crop tool crops a particular area of the image.
crop

Photoshop is used to edit raster images.cleaning up photographs
we’re going to utilize this photograph of rivington place in london to illustrate the idea of ground floor transparency.

1) make the background layer an active layer (double click ‘background’, then click ‘oK’. 2) resize the image to 8’ x 6’.cleaning up photographs
we’re going to utilize this photograph of rivington place in london to illustrate the idea of ground floor transparency.
1
2
layers

3) click and drag from the ruler to create a 3 x 3 grid of guides.cleaning up photographs
we’re going to utilize this photograph of rivington place in london to emphasize the presence of ground floor storefronts.
ruler
ruler
3

4) right-click the image and select ‘scale’, then while holding-shift, drag the image handles to resize the photo, aligning the window with the left vertical line.
cleaning up photographs
let’s utilize the ‘rule of thirds’ to crop the image and focus the viewer’s eye on the important features of the picture.
4
4

6) Apply a combination of ‘Auto tone’/’Auto contrast’/’Auto color’ in order to quickly balance out colors and brightness. 6) duplicate your layer.
cleaning up photographs
now adjust the color levels and brightness.
4
4
5
6

6) Enter ‘Quick-mask mode.’ 7) select a brush with a large diameter and make ‘hardness’ 0%.
cleaning up photographs
now adjust the color levels and brightness.
6
7

8) use the brush to select a highlight area over the ground floor window.
cleaning up photographs
now adjust the color levels and brightness.
8

9) return to ‘standard mode.’ 10) invert selection (selection > inverse; 11) Adjust levels (image > Adjustments > Levels) to slightly add brightness to the window.
cleaning up photographs
now adjust the color levels and brightness.
9
11 10
11

cleaning up photographs
now the photo emphasizes the ground floor storefront: the area of focus occupies more space in the composition (per the rule of thirds), and our
increased contrast draws the eye to the storefront.

12) use the ‘Lasso’ tool to create a selection over the window.cleaning up photographs
adding a color transparency to a photograph is an easy technique for creating further focus.
12
12

13) select a highlight color. 14) select ‘fill’ from the ‘Edit’ menu.cleaning up photographs
adding a color transparency to a photograph is an easy technique for creating further focus.
14
13

15) set the layer transparency to ‘multiply’ and adjust the opacity.
cleaning up photographs
adding a color transparency to a photograph is an easy technique for creating further focus.
15

cleaning up photographs
adding a color transparency to a photograph is an easy technique for creating further focus.

1) open several photos and then paste them into a single photoshop file, creating a layer for each one.
collaging photos
let’s make a collage of some photos to create a panorama of downtown los angeles.
1

2) select a layer; adjust opacity. 3) move it using the move tool. 4) rotate to align with other photos (Edit > transform > rotate)
collaging photos
let’s make a collage of some photos to create a panorama of downtown los angeles.
2
2
3 4

5) return opacity to 100% and repeat for other photos.collaging photos
let’s make a collage of some photos to create a panorama of downtown los angeles.
5

6) select your top layer, then merge the photo layers together using Layer > merge down.
collaging photos
let’s make a collage of some photos to create a panorama of downtown los angeles.
6

7) Pull a horizontal guide line down from the ruler. 8) rotate image (Edit > transform > rotate) and align horizon line with the guide.
collaging photos
let’s make a collage of some photos to create a panorama of downtown los angeles.
8
7

9) crop the image.collaging photos
let’s make a collage of some photos to create a panorama of downtown los angeles.
9

10) use Auto tone/Auto contrast/Auto color tools to balance colors. 11) flatten image (Layer > flatten image).
collaging photos
let’s make a collage of some photos to create a panorama of downtown los angeles.
10
11

collaging photos
let’s make a collage of some photos to create a panorama of downtown los angeles.

introduction to adoBe indesignoVErViEw of tooLs ANd PANELs
comPosiNG sEVErAL Photos iN A siNGLE PrEsENtAtioN
ExPortiNG

the difference between illustrator and Photoshop is a difference between vector and raster graphics.
introduction to adoBe creative suite
illustrator = vector photoshop = raster

indesign is used to format layouts of both vector and raster graphics, plus text.
introduction to adoBe creative suite
suitenon cus nah receptio is re
indesign = vector + raster + text
commodiam harci re con net rehendi quo te nos.Faciatiam ipsusa doloreptatis cuptam sinime nullanda nimus, cullorrovid qui aut officto di arum, unt volupta ectatio endae. Nam et expliti ut unto totam, conecte cum, et essunti
Faciatiam ipsusa doloreptatis cuptam sinime nullanda nimus, cullorrovid qui aut officto di arum, unt volupta ectatio endae. Nam et expliti ut unto totam, conecte cum, et essunti scitam il molupid ipsapic iistium volorae reperitati cuptas Oviti blabore, andae si doluptam, conest inum volupta tiamus.Omnim vellor simil ma acepudios dic temperum harum illest, simusanti
scitam il molupid ipsapic iistium volorae reperitati cuptas Oviti blabore, andae si doluptam, conest inum volupta tiamus.Omnim vellor simil ma acepudios dic temperum harum illest, simusanti commodiam harci re con net rehendi.

indesign is used to format layouts of both vector and raster graphics, plus text.
the basic menus and tool palettes in indesign are similar to those of illustrator and photoshop.
text
selection
introduction to indesign
menus

indesign is used to format layouts of both vector and raster graphics, plus text.
use the selection tools tool to adjust the size and shape of polygons.
rectangle
introduction to indesign
selection tools

indesign is used to format layouts of both vector and raster graphics, plus text.
indesign displays images by referencing jpeg, tiff, or other files on your desktop.
introduction to indesign
place

indesign is used to format layouts of both vector and raster graphics, plus text.
the pen tools allows you to draw new polygons by placing anchor points.
introduction to indesign
pen

indesign is used to format layouts of both vector and raster graphics, plus text.
introduction to indesign
panels provide options for the modification and management of your indesign document.
pages
colors

formatting photographs
let’s utilize indesign to arrange some screenshots from google maps.
1) Place an image in indesign.
1

formatting photographs 1) Place an image in indesign.
let’s utilize indesign to arrange some screenshots from google maps.
1

formatting photographs2) Adjust the ‘frame’ (in blue) of the image: click the image with the direct selection tool, then move the handles to make the frame a square.
let’s utilize indesign to arrange some screenshots from google maps.
2
2

let’s utilize indesign to arrange some screenshots from google maps.
formatting photographs3) center the image in the frame by selecting it with the indirect selection tool (the bounds of the image defined in brown).
3

let’s utilize indesign to arrange some screenshots from google maps.
4) repeat steps 1 to 3 for additional photos and arrange them on the page using the direct selection tool.
formatting photographs
4
4

let’s utilize indesign to arrange some screenshots from google maps.
formatting photographs

formatting photographs
there are many ways to format photos in order to tell a story.
clockwise from top left: david hockney, ‘yosemite Valley’; charles and ray Eames, ‘Powers of ten’; teddy cruz, ‘border Postcards.’

let’s walk through exporting from indesign.
exporting pdf
1
1) Go to file > Adobe Pdf Presets and choose either ‘smallest file size’ (for items like weekly assignments) or ‘Press Quality’ (for Presentation Printing).

let’s walk through exporting from indesign.
exporting jpegs1) Go to file > Export and choose jPEG from the file type drop-down menu.
1

let’s walk through exporting from indesign.
exporting jpegs2) Enter the page number or page range you want to export as jPEGs before clicking Export.
2

assignment 1
title of yourpresentation
title; 1-4 slides of photo documentation
pdf, 7.5”x10”
intertitle; sketches, notes, precedents and revisions
including your raw data collection if that data is not fully accounted in your photo documentation
sketches, notes, precedents
and revisions
message of this slide/ category of data documented on this page
from some part of your Pdf
jpeg
message of this slide/ category of data documented on this page

scored out of 10 points
clarity and coherence of narrative constructed? (/4)
thoughtfulness, suitability and/or creativity in representation? (/3)
Engagement with and evaluation of different representational strategies (as evidenced in the slide deck by sketches, precedents, notes and finished work)? (/2)
deployment of tools demonstrated in class? (/1)
assignment 1
1 pt for each day late
timely second week resubmissions can be
regraded
Blog comments due by thursday night

use the weBsite as a referenceExAmPLEs of PrEVious worK
LibrAriEs of coLors, icoNs ANd stocK imAGEry
frEEwArE AdobE ALtErNAtiVEs