planetary atmospheres - judith...
TRANSCRIPT

PLANETARY ATMOSPHERES
Contents
Jupiter and the Outer Planets
Mars
Venus
Jupiter and the Outer Planets
AP Showman, University of Arizona, Tucson, AZ, USA
Copyright 2003 Elsevier Science Ltd. All Rights Reserved.
Introduction
The planets and satellites in the outer solar systemexhibit a diverse range of atmospheres. The giantplanets F Jupiter, Saturn, Uranus, and Neptune Fare fluid objects whose atmospheres have composi-tions similar to that of the solar nebula fromwhich oursolar system formed. They are dynamically active,exhibiting behavior on time scales from hours tocenturies, and have multiple zonal (east–west) jetswith speeds that exceed those of Earth’s atmosphere.Titan, the largest moon of Saturn, has a nitrogenatmosphere with a surface density four times that ofEarth’s, a global smog layer that hides the surface fromview, and perhaps a surface or subsurface reservoir ofliquid methane and ethane. Triton (Neptune’s largestsatellite) andPluto have tenuousnitrogen atmospheresthought to be in vapor pressure equilibriumwith solidnitrogen ice on their surfaces. And the Galileansatellites of Jupiter F Io, Europa, Ganymede, andCallisto F have tenuous atmospheres resulting fromvolcanic processes and interaction of their surfaceswith energetic particles from Jupiter’s magnetosphere.These atmospheres embody the same physicaland chemical processes as Earth’s atmospherebut, because of differing compositions, gravities,lower boundary conditions, incident solar energyfluxes, and histories, the phenomena observed thereare unique. The study of these planets enrichesatmospheric science by placing Earth in a broaderperspective.
Jupiter, Saturn, Uranus, and Neptune
Jupiter, Saturn, Uranus, and Neptune, which respec-tively have diameters of 11, 9, 4, and 4 times that of
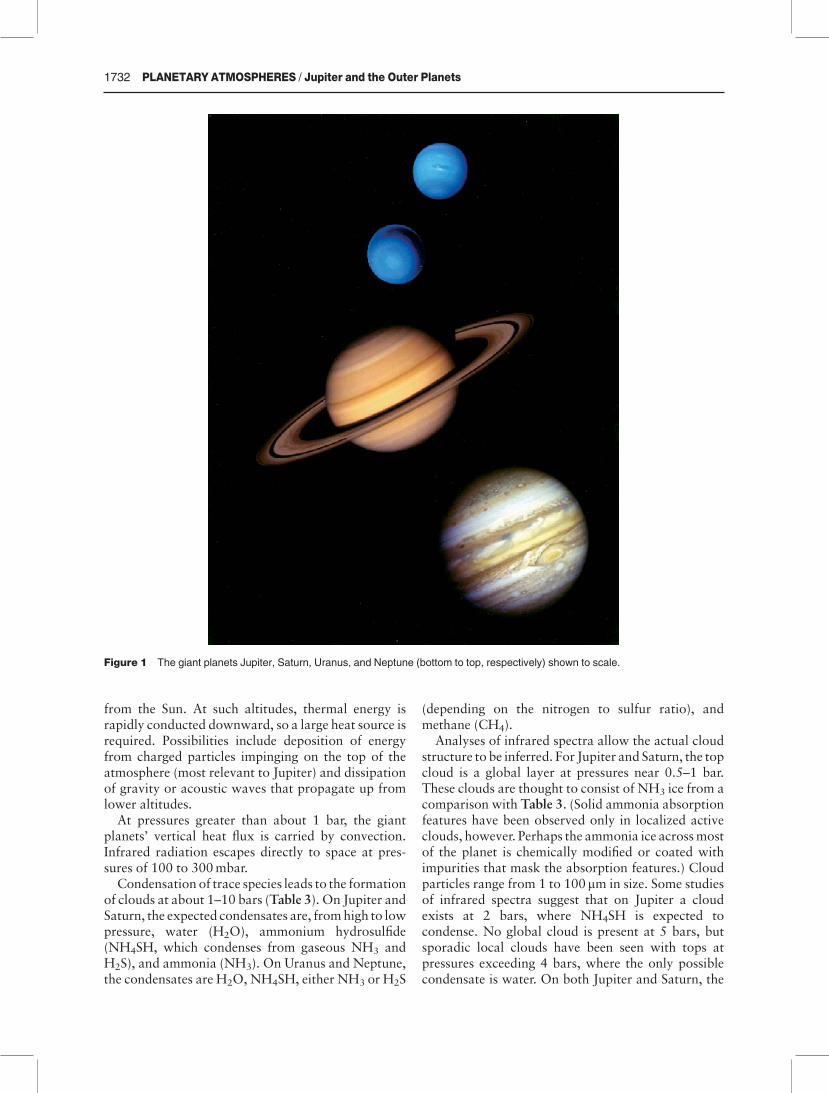
Earth, greatly exceed the terrestrial planets inmass. At318 Earth masses, Jupiter contains more mass than allthe other planets in our solar system combined.Nevertheless, their internal densities are modest, andJupiter is the only planet with a gravity substantiallyexceeding Earth’s (Table 1). The dominant atmos-pheric constituent of all four giant planets ismolecularhydrogen (H2), followed by helium (He) and tracespecies composed of carbon, oxygen, nitrogen, sulfur,and other elements. The interiors are fluid, and thetransition between atmosphere and interior occursgradually. All features visible in images of the giantplanets are clouds (Figure 1). The clouds organize intolatitudinal bands that are obvious on Jupiter andSaturn and weaker, yet still persistent, on Uranus andNeptune.
Systematic observations of Jupiter beganin the nineteenth century and continue to the pre-sent day, providing a �150-year record of theplanet’s visual appearance. Inferences aboutJupiter’s composition began in the 1930s with theidentification of methane (CH4) and ammonia(NH3) absorption features in spectra of sunlightreflected from the planet. The space age allowed arevolution in giant-planet studies. Pioneer 10 andPioneer 11 flew past Jupiter in 1973 and 1974,respectively, followed by Voyager 1 and Voyager 2 in1979; the latter three of these reached Saturn in 1979,1980, and 1981, respectively. Voyager 2 continued onto Uranus in 1986 and Neptune in 1989. The Galileomission consisted of a Jupiter orbiter and a probe thatentered Jupiter’s atmosphere in 1995.Cassini flewpastJupiter in December 2000 and will enter Saturn orbitin 2004, starting a three-year mission of the ringedplanet.
Composition
Unlike the terrestrial planets, the giant planets formedunder conditions that allowed them to retain gas fromthe solar nebula (the gaseous disk from which the Sunand planets formed). The abundances of elementsin the jovian atmospheres therefore resemble a
1730 PLANETARY ATMOSPHERES / Jupiter and the Outer Planets
cooled-down parcel of the Sun. In such a parcel, thedominant constituents are hydrogen (H2) and helium(He), which together comprise 98% of the mass,followed by neon (Ne), oxygen (O), carbon (C),nitrogen (N), and sulfur (S). The chemical equilibriumforms of oxygen, carbon, nitrogen, and sulfur in thegiant-planet atmospheres are H2O, CH4, NH3,and H2S.
Analysis of infrared spectra of the giant planetsindicate that the C:H ratio is 2.9 times the solar valuefor Jupiter, about 6 times solar for Saturn, and 30–40times solar for Uranus and Neptune. These enrich-ments suggest that the giant planets received solids inaddition to nebular gas during their formation. TheGalileo probe, which directly sampled Jupiter’s at-mosphere in 1995, confirmed the spectral estimate ofC:H and demonstrated that the abundances of NH3,H2S, Ar, Kr, and Xe are all between 2.5 and 3.5 timessolar (Table 2).
Vertical Structure and Clouds
The temperature profiles at pressures less than a fewbars (1 bar5 105 Pa) have been measured for all fourgiant planets by radio occultations from the Voyagerspacecraft and, in the case of Jupiter, by the Galileoprobe to 22 bars (Figure 2). Each planet exhibits atemperature minimum (tropopause) near 100mbar,with a troposphere below and a stratosphere above.The temperature gradient (lapse rate) in the tropo-sphere approaches the dry adiabatic value at pressuresexceeding about 1 bar. Galileo probe measurementsindicate that Jupiter’s atmosphere is close to a dryadiabat from 1 to 22 bars. All four planets also havehot thermospheres, with temperatures ranging from�600 to 1000K at pressures of 10�3 mbar or less. Thethermospheric temperatures are greater than can beachieved with solar energy absorption and, interest-ingly, do not show a systematic decrease with distance
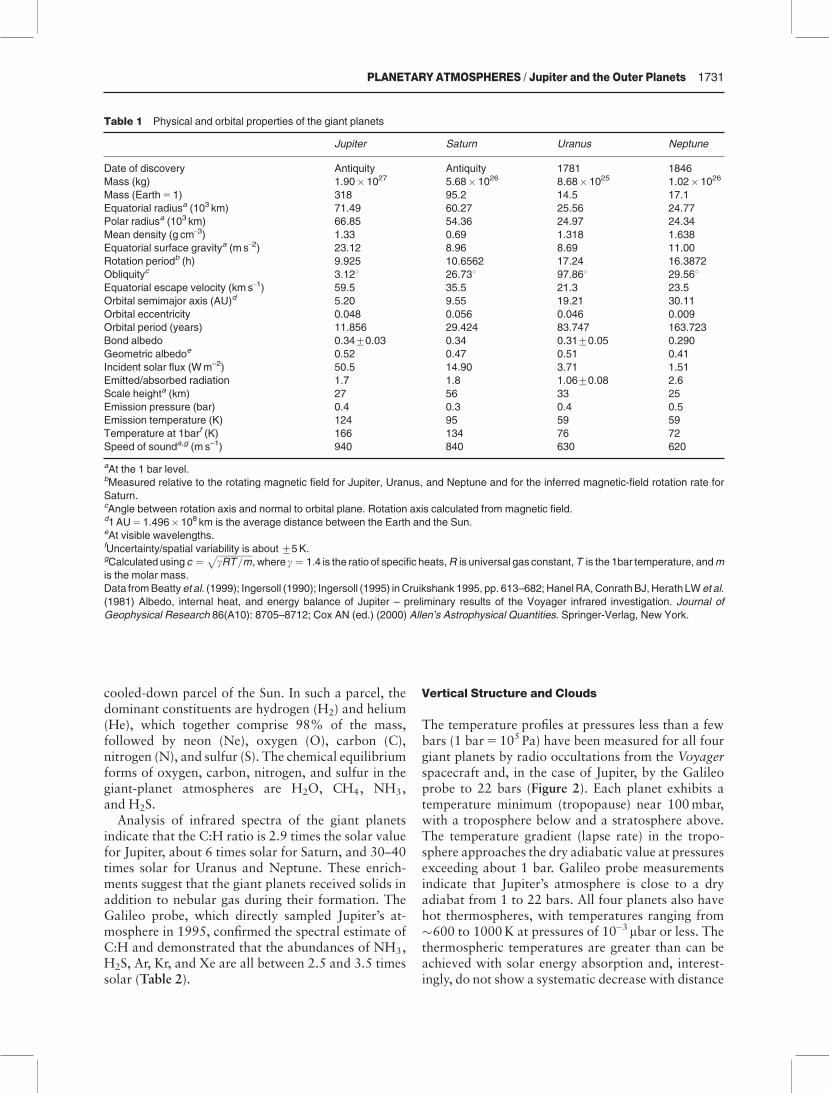
Table 1 Physical and orbital properties of the giant planets
Jupiter Saturn Uranus Neptune
Date of discovery Antiquity Antiquity 1781 1846
Mass (kg) 1.90� 1027 5.68�1026 8.68�1025 1.02�1026
Mass (Earth51) 318 95.2 14.5 17.1
Equatorial radiusa (103 km) 71.49 60.27 25.56 24.77
Polar radiusa (103 km) 66.85 54.36 24.97 24.34
Mean density (g cm�3) 1.33 0.69 1.318 1.638
Equatorial surface gravitya (m s�2) 23.12 8.96 8.69 11.00
Rotation periodb (h) 9.925 10.6562 17.24 16.3872
Obliquityc 3.121 26.731 97.861 29.561Equatorial escape velocity (kms�1) 59.5 35.5 21.3 23.5
Orbital semimajor axis (AU)d 5.20 9.55 19.21 30.11
Orbital eccentricity 0.048 0.056 0.046 0.009
Orbital period (years) 11.856 29.424 83.747 163.723
Bond albedo 0.3470.03 0.34 0.3170.05 0.290
Geometric albedoe 0.52 0.47 0.51 0.41
Incident solar flux (Wm–2) 50.5 14.90 3.71 1.51
Emitted/absorbed radiation 1.7 1.8 1.0670.08 2.6
Scale heighta (km) 27 56 33 25
Emission pressure (bar) 0.4 0.3 0.4 0.5
Emission temperature (K) 124 95 59 59
Temperature at 1barf (K) 166 134 76 72
Speed of sounda,g (m s–1) 940 840 630 620
aAt the 1 bar level.bMeasured relative to the rotating magnetic field for Jupiter, Uranus, and Neptune and for the inferred magnetic-field rotation rate for
Saturn.cAngle between rotation axis and normal to orbital plane. Rotation axis calculated from magnetic field.d1AU51.496�108 km is the average distance between the Earth and the Sun.eAt visible wavelengths.fUncertainty/spatial variability is about75K.gCalculatedusing c ¼ ffiffiffiffiffiffiffiffiffiffiffiffiffiffiffiffi
gRT=mp
, where g ¼ 1:4 is the ratio of specific heats,R is universal gas constant,T is the 1bar temperature, andm
is the molar mass.
Data fromBeattyet al. (1999); Ingersoll (1990); Ingersoll (1995) inCruikshank 1995, pp. 613–682; HanelRA,ConrathBJ,Herath LWet al.
(1981) Albedo, internal heat, and energy balance of Jupiter – preliminary results of the Voyager infrared investigation. Journal of
Geophysical Research 86(A10): 8705–8712; Cox AN (ed.) (2000) Allen’s Astrophysical Quantities. Springer-Verlag, New York.
PLANETARY ATMOSPHERES / Jupiter and the Outer Planets 1731
from the Sun. At such altitudes, thermal energy israpidly conducted downward, so a large heat source isrequired. Possibilities include deposition of energyfrom charged particles impinging on the top of theatmosphere (most relevant to Jupiter) and dissipationof gravity or acoustic waves that propagate up fromlower altitudes.
At pressures greater than about 1 bar, the giantplanets’ vertical heat flux is carried by convection.Infrared radiation escapes directly to space at pres-sures of 100 to 300mbar.
Condensation of trace species leads to the formationof clouds at about 1–10 bars (Table 3). On Jupiter andSaturn, the expected condensates are, fromhigh to lowpressure, water (H2O), ammonium hydrosulfide(NH4SH, which condenses from gaseous NH3 andH2S), and ammonia (NH3). On Uranus and Neptune,the condensates are H2O, NH4SH, either NH3 or H2S
(depending on the nitrogen to sulfur ratio), andmethane (CH4).
Analyses of infrared spectra allow the actual cloudstructure to be inferred. For Jupiter and Saturn, the topcloud is a global layer at pressures near 0.5–1 bar.These clouds are thought to consist of NH3 ice from acomparison with Table 3. (Solid ammonia absorptionfeatures have been observed only in localized activeclouds, however. Perhaps the ammonia ice acrossmostof the planet is chemically modified or coated withimpurities that mask the absorption features.) Cloudparticles range from 1 to 100 mm in size. Some studiesof infrared spectra suggest that on Jupiter a cloudexists at 2 bars, where NH4SH is expected tocondense. No global cloud is present at 5 bars, butsporadic local clouds have been seen with tops atpressures exceeding 4 bars, where the only possiblecondensate is water. On both Jupiter and Saturn, the
Figure 1 The giant planets Jupiter, Saturn, Uranus, and Neptune (bottom to top, respectively) shown to scale.
1732 PLANETARY ATMOSPHERES / Jupiter and the Outer Planets
0.5–1 bar cloud is overlaid by an optically thin,homogeneous haze from 0.1–0.5 bar.
On Uranus and Neptune, two tropospheric cloudlayers havebeenobserved.The lowermost cloud formsan opaque global layer with tops at 2.870.5 and3.870.6 bars on Uranus and Neptune, respectively.The composition may be H2S on the basis of acomparison with Table 3 and observations showingthat gaseous NH3 is extremely depleted. At pressuresof 1.2 and 1.5 bars on Uranus and Neptune, respec-tively, a patchy, methane-ice cloud with optical depthsof 0.1–1 exists.
Thin haze layers are also present in the stratospheresof all four giant planets; these result from condensa-tion of methane photolysis products such as ethane
(C2H6), acetylene (C2H2), and higher-order organics.Vaporization (and subsequent condensation) ofmaterial from incoming interplanetary dust particlesalso provides a small source of upper-atmosphericaerosols.
The colors of the giant planets remain poorlyunderstood. Ammonia ice is colorless; the earth tonesexhibited by Jupiter and Saturn result from tracequantities of solid organic, sulfur, or phosphoruscompounds (‘chromophores’) mixed in with the am-monia ice. The blue-green colors of Uranus andNeptune result fromabsorption of red light by gaseousmethane and perhaps by particles in the global cloudnear 3 bars.
Table 2 Composition of Jupiter’s atmosphere
Species Mole fraction Comments
H2 0.86
He 0.136 0.8 times solar
Ne 2.0� 10�5 0.1 times solar
Ar 1.6� 10–5 2.570.5 times solar
Kr 8.0� 10–9 2.770.5 times solar
Xe 7.7� 10–10 2.670.5 times solar
CH4 2�10–3 2.9 times solar
H2O (19 bars) o6�10–4 o0.35 times solara,b
H2S (16 bars) 7�10–5 2.5 times solara
NH3 (8 bars) 7�10–4 3.5 times solara
CH3D 2�10–7
C2H6 (stratosphere) 10–6–10–5 c
C2H4 (stratosphere) 10–9–10–8 c
C2H2 (stratosphere) 10–8–10–7 c
CO 1�10–9 d
PH3 1�10–6 d
AsH3 2�10–10 d
GeH4 7�10–10 d
aDecreases with height and varies horizontally owing to conden-
sation and dynamics.bGalileo probe measurement in a dry spot. Other studies suggest
that Jupiter’s deep, global-averaged water abundance is 3–10
times solar.cProduced by photolysis of methane. Variable with location.dA disequilibrium species in the atmosphere, but stable at great
depths, so its presence provides evidence of convective transport
from the deep interior.
Sources: Mahaffy PR, Niemann HB, Alpert A et al. (2000) Noble
gas abundances and isotope ratios in the atmosphere of Jupiter
from theGalileoProbemass spectrometer. Journal ofGeophysical
Research 105: 15061–15071; Encrenaz T, Drossart P, Feucht-
gruber H, et al. (1999) The atmospheric composition and structure
of Jupiter and Saturn from ISO observations: a preliminary review.
Planetary Space Science 47: 1225–1242; Fegley B and Lodders K
(1994) Chemical models of the deep atmospheres of Jupiter and
Saturn. Icarus 110: 117–154; Niemann HB, Atreya SK, Carignan
GR, et al. (1998) The composition of the Jovian atmosphere as
determined by the Galileo probe mass spectrometer. Journal of
Geophysical Research 103: 22831–22845; Gladstone GR, Allen
M, Yung YL (1996) Hydrocarbon photochemistry in the upper
atmosphere of Jupiter. Icarus 119: 1–52.
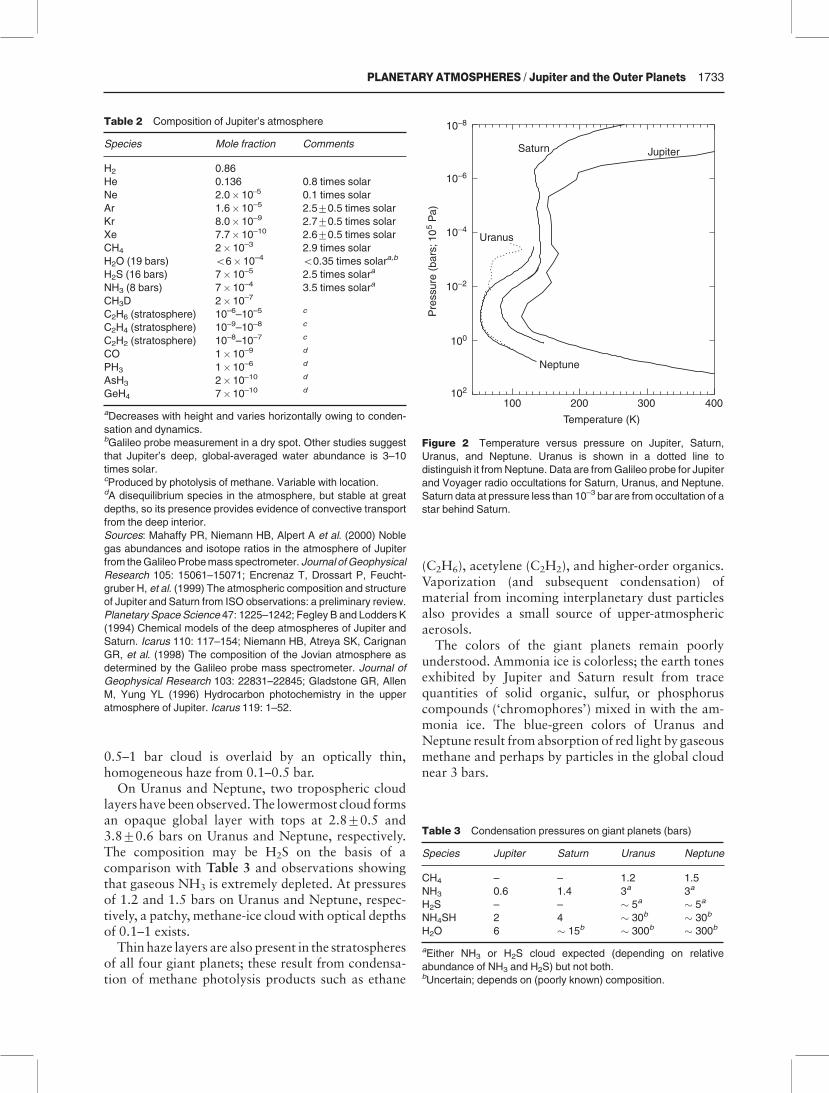
400300200100102
10−2
10−4
10−6
10−8
100
Neptune
Uranus
Saturn Jupiter
Temperature (K)P
ress
ure
(bar
s; 1
05
Pa)
Figure 2 Temperature versus pressure on Jupiter, Saturn,
Uranus, and Neptune. Uranus is shown in a dotted line to
distinguish it fromNeptune. Data are fromGalileo probe for Jupiter
and Voyager radio occultations for Saturn, Uranus, and Neptune.
Saturn data at pressure less than 10–3 bar are from occultation of a
star behind Saturn.
Table 3 Condensation pressures on giant planets (bars)
Species Jupiter Saturn Uranus Neptune
CH4 – – 1.2 1.5
NH3 0.6 1.4 3a 3a
H2S – – � 5a � 5a
NH4SH 2 4 � 30b � 30b
H2O 6 � 15b � 300b � 300b
aEither NH3 or H2S cloud expected (depending on relative
abundance of NH3 and H2S) but not both.bUncertain; depends on (poorly known) composition.
PLANETARY ATMOSPHERES / Jupiter and the Outer Planets 1733

Dynamics
All four giant planets exhibit persistent east–west(zonal) jets at the height of the visible clouds.These winds have been measured by trackingthe motion of small clouds over periods of hours(Figure 3). The measurements show that Jupiterand Saturn each have over ten jets, with peakspeeds of 180m s–1 on Jupiter and470m s–1 on Saturn.The equatorial winds are eastward. Uranus andNeptune have westward jets at the equator and broadeastward jets at high northern and southern latitudes,with peak speeds of 200 and 400m s–1, respectively.Interestingly, wind speeds do not decrease withdistance from the Sun. Observations of Jupiter ex-
tending over a century reveal that significant changesin the mean jet speeds have occurred at only a fewlatitudes. Even Uranus and Neptune show littlevariation in the 15 years over which such observationshave been available. Nevertheless, Voyager observa-tions and ground-based telescope images show thatenormous small-scale variability occurs over periodsof hours to days.
The rapid rotation rates and large sizes of the giantplanets ensure that the large-scale winds are ingeostrophic balance (a balance between horizontalpressure gradient and Coriolis accelerations).
Althoughdiscrete clouds are not normally present inthe stratospheres of the giant planets,measurements oftemperature at pressures less than400mbar imply thatthe jetsweakenwith height above the cloud deck on allfour giant planets. The depth of the jets below theclouds is a major unknown. Galileo probe measure-ments indicate that, on Jupiter, the winds at 71Nlatitude continue to at least 20bars, 150 km below thevisible cloud deck (Figure 4). For Neptune, analysis ofVoyager gravity data indicates that the strong windsseen in Figure 3 are confined to the outermost fewpercent of the planet’s mass.
Jupiter, Saturn, and Neptune receive more sunlightat the equator than the poles; but the spin axis ofUranus is tipped over, so that averaged over a Uranianyear, Uranus receives more sunlight at the poles thanthe equator. DuringUranus’ northern summer, the Sunis overhead at the north pole and the southernhemisphere is in darkness. The reverse is true duringsouthern summer.
Jupiter, Saturn, and Neptune radiate 1.7, 1.8, and2.7 times more energy, respectively, than they absorbfrom the Sun. Unlike Earth, these planets thereforeundergo net radiative cooling at all latitudes. Noexcess radiation has been detected from Uranus.
Measurements of temperatures above the cloud topsindicate that, although small-scale temperature vari-ations are present, little global equator-to-pole tem-perature difference exists. Efficient energy transporttherefore occurs within the giant planets. For Jupiterand Saturn, atmospheric transport alone is insufficienttomute the equator-to-pole temperature gradient, andthe homogeneous temperatures may result from pref-erential escape of the internal heat at the poles. OnUranus, theminuscule internal heat flux precludes thismechanism from occurring, and atmospheric trans-port (e.g., by baroclinic eddies) may be sufficient.
Jupiter and Saturn exhibit a wealth of small-scalevortices, cloud streaks, and turbulent regions thatevolve on time scales of days or less. On Jupiter, theVoyager, Galileo, and Cassini spacecraft imagedthousands of atmospheric vortices ranging from theGreat Red Spot (spanning 20 000 km by 10 000 km in
−50
−100 −50 0 50 100 150 200
0
50
Latit
ude
(deg
)
−50
−100 0 100 200 300 400 500
0
50
Latit
ude
(deg
)
−50
−100
0
50
Latit
ude
(deg
)
−50
−400 −200
0
50
Latit
ude
(deg
)
0 100 200 300
0 200 400
Eastward wind speed (m s−1)
(A)
(B)
(C)
(D)
Figure3 Longitudinally averaged eastwardwinds on (A) Jupiter,
(B) Saturn, (C) Uranus, and (D) Neptune, obtained by tracking
cloud features in Voyager and ground based telescope images.
Thewiggles are not noise but represent long-livedatmospheric jets
analogous to the jet stream on Earth.
1734 PLANETARY ATMOSPHERES / Jupiter and the Outer Planets

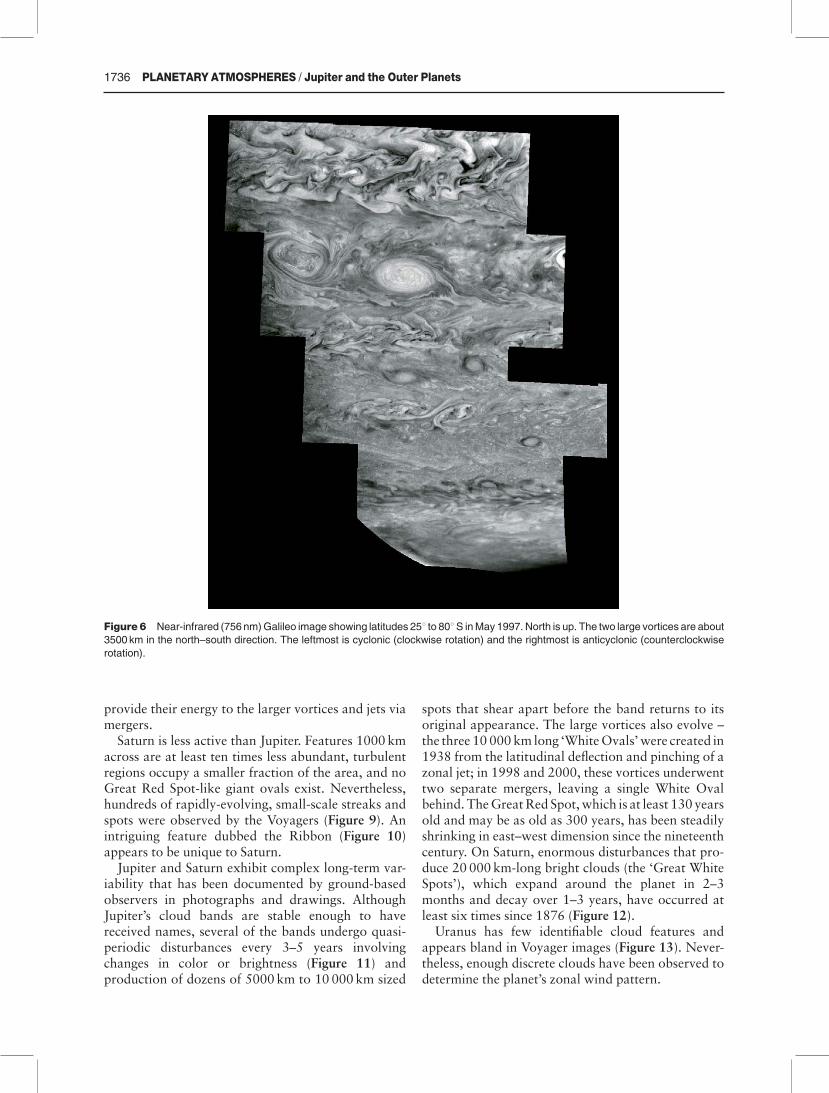
longitude and latitude, respectively) to spots hundredsof kilometers across (Figures 5 and 6). On average,vortices smaller than 2000 km are circular, whilelarger vortices are elongated in the east–west direc-tion. Ninety percent of the observed vortices areanticyclones and reside in anticyclonic shear zones.Cyclones, which reside in cyclonic shear zones, tend to
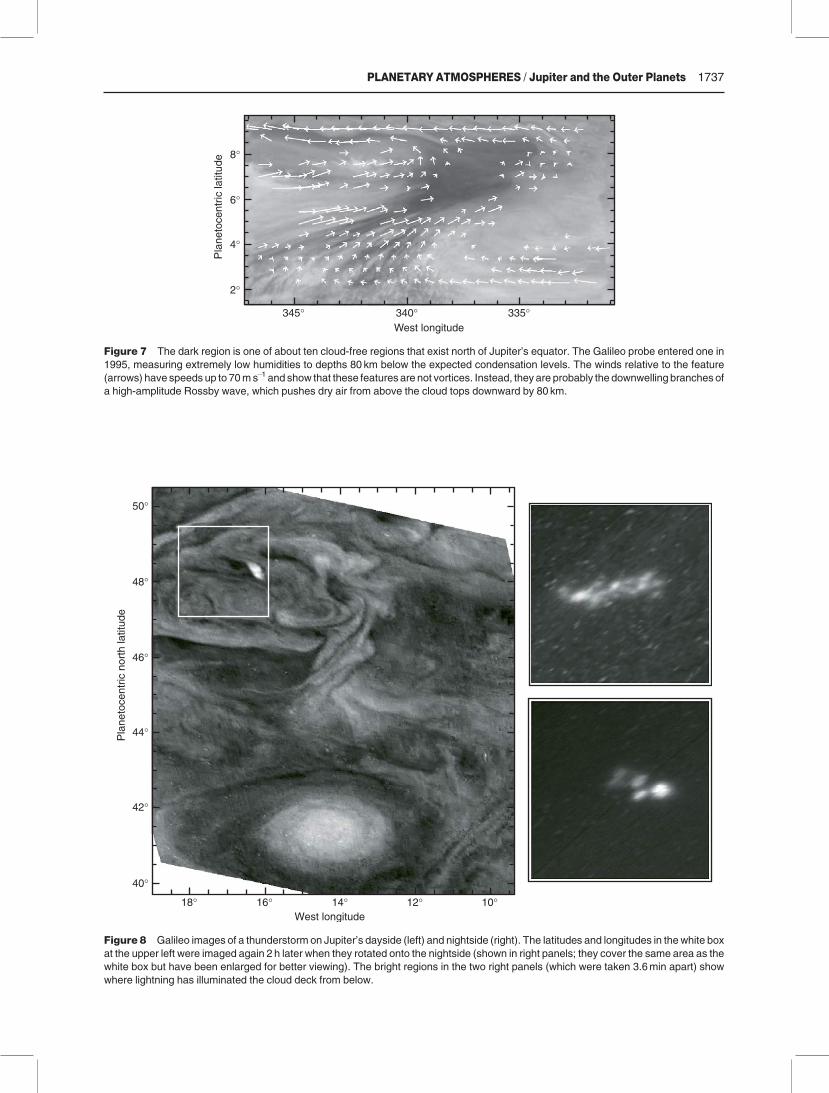
be more turbulent and short-lived than anticyclones.When vortices collide, they merge irreversiblyand sometimes eject a filament. Coherent vorticesdo not produce other spots F instead, small vorticesare produced in turbulent ‘filamentary regions’that reside in cyclonic shear zones. The bandwithin 81 latitude of the equator contains, ratherthan vortices, a set of bright and dark features that areprobably the upwelling (cloudy) and downwelling(cloud-free) branches, respectively, of a large-ampli-tude, equatorially trapped wave. The Galileo probeentered such a dark region (Figure 7), where itmeasured humidities and cloud abundances muchlower than expected.
Moist convection occurs on Jupiter and may beimportant in driving the jets. Lightningwas imaged onJupiter’s nightside by Voyager and Galileo, and Gal-ileo showed that the lightning occurred within bright,rapidly-expanding clouds that can reach diameters of2000 km in a few days (Figure 8; the small whiteclouds north-west of theGreatRed Spot inFigure 5 aretypical of lightning-producing clouds). The buoyancycaused by latent heat release is dominated by conden-sation ofwater and can reach� 10K (similar to that interrestrial thunderstorms) for likely water abundanceson Jupiter. Theoretical calculations suggest that thissupplies energy to small-scale eddies that in turn
0
5
10
15
20
Pre
ssur
e (b
ars;
105
Pa)
50 100 150 200
Eastward wind (m s−1)
Figure 4 Eastward winds versus pressure obtained by Doppler-
tracking of the Galileo probe’s radio signal during its descent into
Jupiter’s atmosphere in December 1995.
Figure 5 False-color visible-wavelength Voyager image of Jupiter’s Great Red spot (GRS) (upper right) taken in 1979. The GRS is an
anticyclonic vortex that rotates counterclockwise once per week. The white vortex below the GRS is also an anticyclone. The turbulent
region north-west of the GRS and west of the smaller vortex have cyclonic vorticity. North is to upper left.
PLANETARY ATMOSPHERES / Jupiter and the Outer Planets 1735
provide their energy to the larger vortices and jets viamergers.
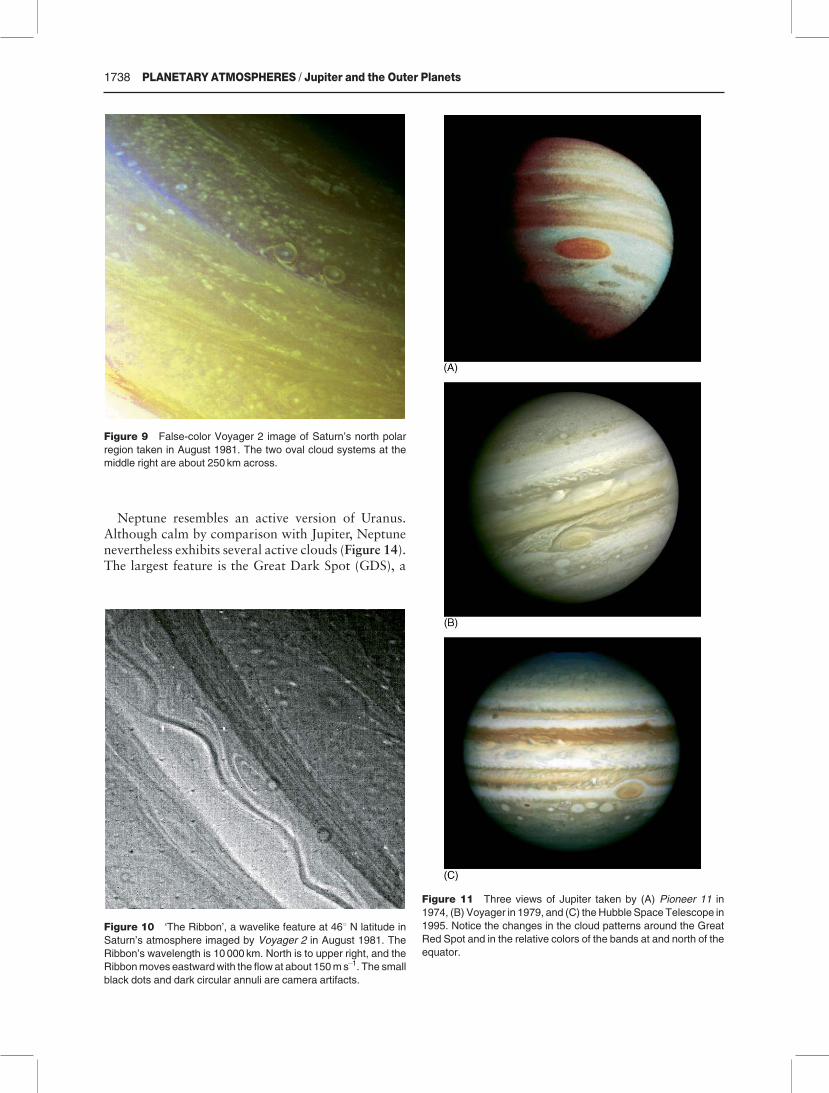
Saturn is less active than Jupiter. Features 1000 kmacross are at least ten times less abundant, turbulentregions occupy a smaller fraction of the area, and noGreat Red Spot-like giant ovals exist. Nevertheless,hundreds of rapidly-evolving, small-scale streaks andspots were observed by the Voyagers (Figure 9). Anintriguing feature dubbed the Ribbon (Figure 10)appears to be unique to Saturn.
Jupiter and Saturn exhibit complex long-term var-iability that has been documented by ground-basedobservers in photographs and drawings. AlthoughJupiter’s cloud bands are stable enough to havereceived names, several of the bands undergo quasi-periodic disturbances every 3–5 years involvingchanges in color or brightness (Figure 11) andproduction of dozens of 5000 km to 10 000 km sized
spots that shear apart before the band returns to itsoriginal appearance. The large vortices also evolve –the three 10 000 km long ‘WhiteOvals’were created in1938 from the latitudinal deflection and pinching of azonal jet; in 1998 and 2000, these vortices underwenttwo separate mergers, leaving a single White Ovalbehind. TheGreatRed Spot,which is at least 130 yearsold and may be as old as 300 years, has been steadilyshrinking in east–west dimension since the nineteenthcentury. On Saturn, enormous disturbances that pro-duce 20 000 km-long bright clouds (the ‘Great WhiteSpots’), which expand around the planet in 2–3months and decay over 1–3 years, have occurred atleast six times since 1876 (Figure 12).
Uranus has few identifiable cloud features andappears bland in Voyager images (Figure 13). Never-theless, enough discrete clouds have been observed todetermine the planet’s zonal wind pattern.
Figure6 Near-infrared (756nm)Galileo image showing latitudes 251 to 801S inMay 1997. North is up. The two large vortices are about
3500 km in the north–south direction. The leftmost is cyclonic (clockwise rotation) and the rightmost is anticyclonic (counterclockwise
rotation).
1736 PLANETARY ATMOSPHERES / Jupiter and the Outer Planets
8°
6°
4°
2°
Pla
neto
cent
ric la
titud
e
345° 340° 335°West longitude
Figure 7 The dark region is one of about ten cloud-free regions that exist north of Jupiter’s equator. The Galileo probe entered one in
1995, measuring extremely low humidities to depths 80 km below the expected condensation levels. The winds relative to the feature
(arrows) have speeds up to 70ms�1 and show that these features are not vortices. Instead, they are probably the downwelling branchesof
a high-amplitude Rossby wave, which pushes dry air from above the cloud tops downward by 80 km.
40°
42°
44°
46°
48°
50°
Pla
neto
cent
ric n
orth
latit
ude
18° 16° 14° 12° 10°West longitude
Figure 8 Galileo images of a thunderstorm on Jupiter’s dayside (left) and nightside (right). The latitudes and longitudes in the white box
at the upper left were imaged again 2 h later when they rotated onto the nightside (shown in right panels; they cover the same area as the
white box but have been enlarged for better viewing). The bright regions in the two right panels (which were taken 3.6min apart) show
where lightning has illuminated the cloud deck from below.
PLANETARY ATMOSPHERES / Jupiter and the Outer Planets 1737
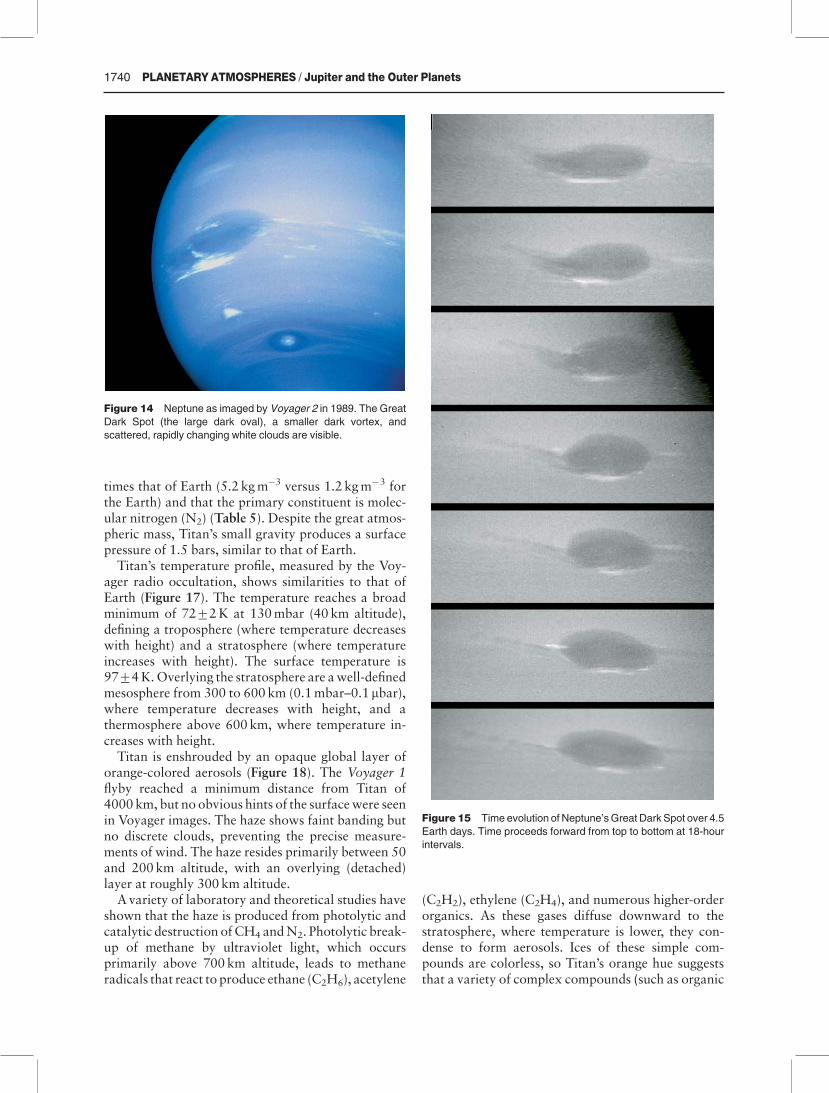
Neptune resembles an active version of Uranus.Although calm by comparison with Jupiter, Neptunenevertheless exhibits several active clouds (Figure 14).The largest feature is the Great Dark Spot (GDS), a
Figure 9 False-color Voyager 2 image of Saturn’s north polar
region taken in August 1981. The two oval cloud systems at the
middle right are about 250 km across.
Figure 10 ‘The Ribbon’, a wavelike feature at 461 N latitude in
Saturn’s atmosphere imaged by Voyager 2 in August 1981. The
Ribbon’s wavelength is 10 000 km. North is to upper right, and the
Ribbonmoves eastwardwith the flow at about 150ms�1. The small
black dots and dark circular annuli are camera artifacts.
Figure 11 Three views of Jupiter taken by (A) Pioneer 11 in
1974, (B) Voyager in 1979, and (C) the Hubble Space Telescope in
1995. Notice the changes in the cloud patterns around the Great
Red Spot and in the relative colors of the bands at and north of the
equator.
1738 PLANETARY ATMOSPHERES / Jupiter and the Outer Planets
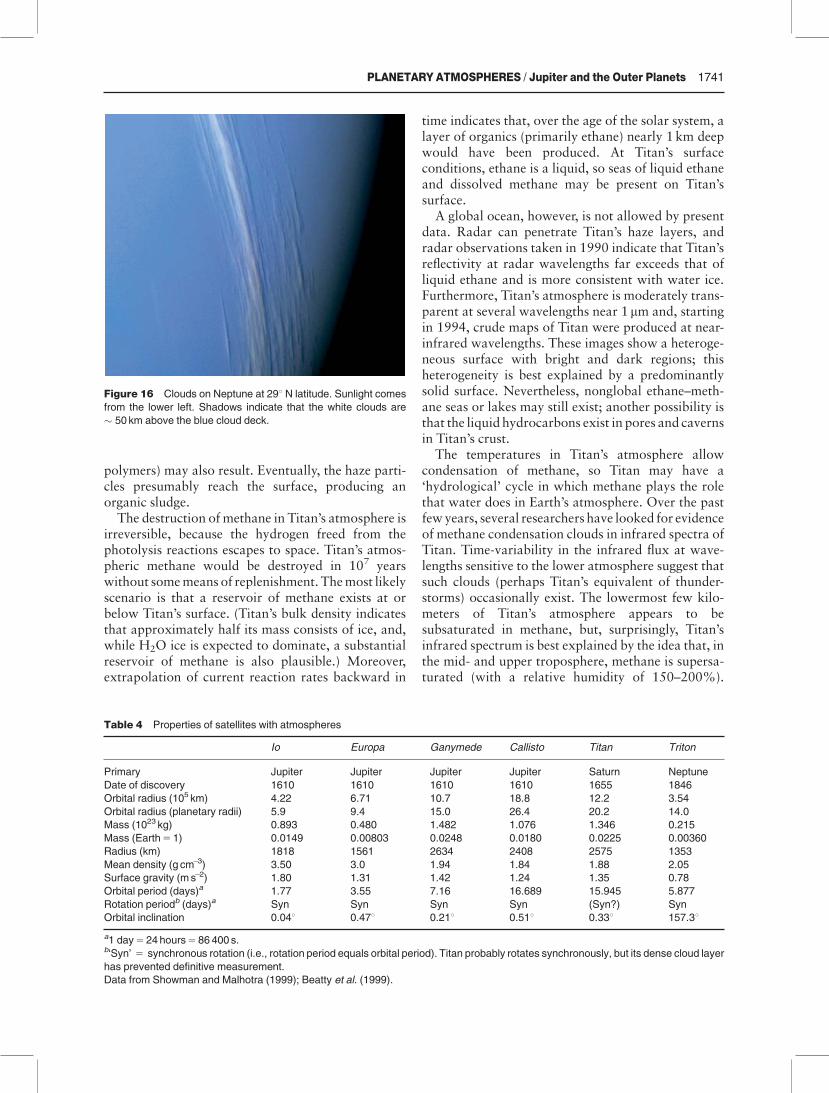
20000 km long anticyclonic vortex observed by Voy-ager in Neptune’s southern hemisphere. The GDS,which underwent large-amplitude week-long oscilla-tions in shape and orientation (Figure 15), driftedtoward the equator at 1.31 latitude per month andsubsequently disappeared. AnewGDSappeared in thenorthern hemisphere in 1994. In addition to the darkspots, bright cloud streaks also exist; some areisolated, while others are associated with featuressuch as the GDS. In some cases they cast shadows onthe blue (3.8 bar) cloud deck, indicating heights of 50–100 km (Figure 16). The streaks often compriserapidly changing smaller clouds that move at speedsup to 200m s�1 relative to the main streak, whichsuggests the presence of atmospheric waves.
Satellites and Pluto
Jupiter, Saturn,Uranus, andNeptunehave4,6,5, and2natural satellites, respectively, with diameters exceed-
ing 400 km. The largest, and the only oneswith knownatmospheres, are Jupiter’s moons Io, Europa, Gany-mede, and Callisto (the Galilean satellites), Saturn’smoon Titan, and Neptune’s moon Triton (Table 4).
Titan
Titan,which exceedsMercury andPluto in diameter, isthe second-largest satellite in the solar system and theonly satellite with a dense atmosphere. Titan wasdiscovered by Huygens in 1655. A controversialobservation that Titan’s disk is brighter at the centerthan at the edge suggested to Comas Sola in 1908 thatTitan has an atmosphere. But the true discovery of anatmosphere around Titan occurred in 1944 whenKuiper discovered gaseous absorption lines of meth-ane in infrared spectra of Titan. Debate existed aboutthe surface density (and even whether methane is thedominant constituent) until the Voyager encounters,when it became clear that the surface density is four
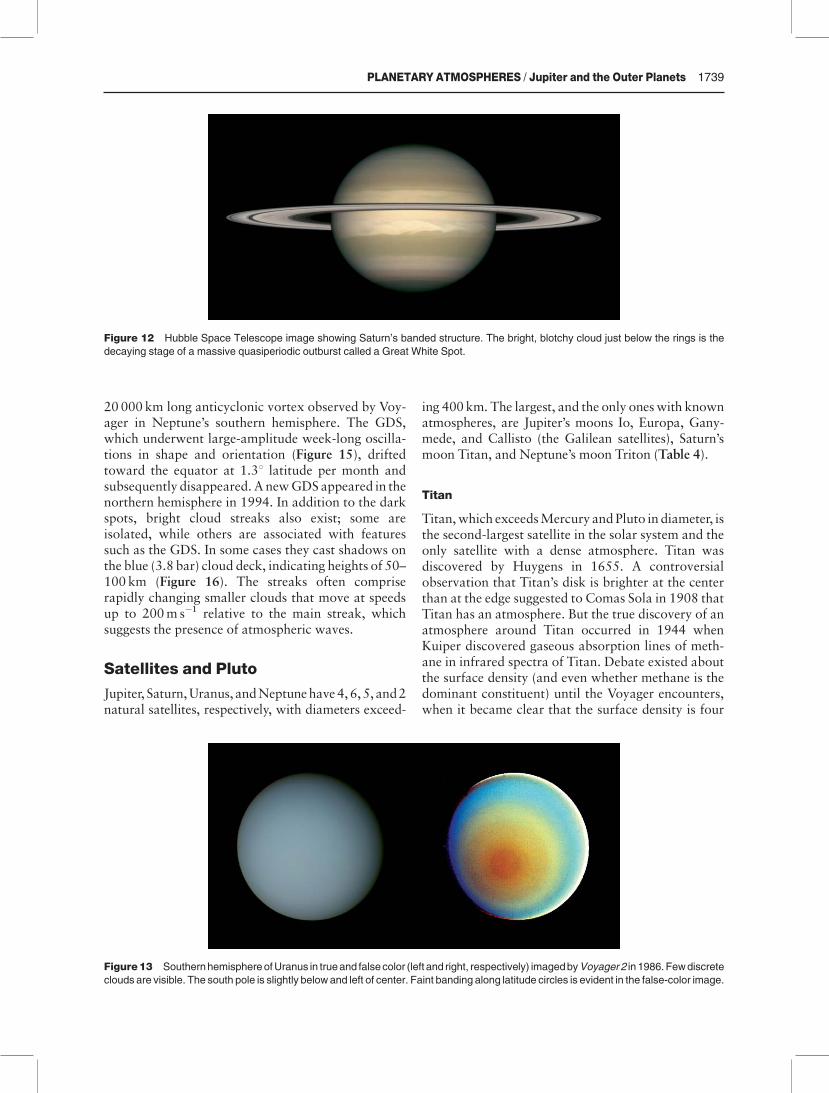
Figure 12 Hubble Space Telescope image showing Saturn’s banded structure. The bright, blotchy cloud just below the rings is the
decaying stage of a massive quasiperiodic outburst called a Great White Spot.
Figure13 SouthernhemisphereofUranus in trueand falsecolor (left and right, respectively) imagedbyVoyager2 in 1986.Fewdiscrete
clouds are visible. The south pole is slightly below and left of center. Faint banding along latitude circles is evident in the false-color image.
PLANETARY ATMOSPHERES / Jupiter and the Outer Planets 1739
times that of Earth (5.2 kgm�3 versus 1.2 kgm�3 forthe Earth) and that the primary constituent is molec-ular nitrogen (N2) (Table 5). Despite the great atmos-pheric mass, Titan’s small gravity produces a surfacepressure of 1.5 bars, similar to that of Earth.
Titan’s temperature profile, measured by the Voy-ager radio occultation, shows similarities to that ofEarth (Figure 17). The temperature reaches a broadminimum of 7272K at 130mbar (40 km altitude),defining a troposphere (where temperature decreaseswith height) and a stratosphere (where temperatureincreases with height). The surface temperature is9774K.Overlying the stratosphere are awell-definedmesosphere from 300 to 600 km (0.1mbar–0.1 mbar),where temperature decreases with height, and athermosphere above 600 km, where temperature in-creases with height.
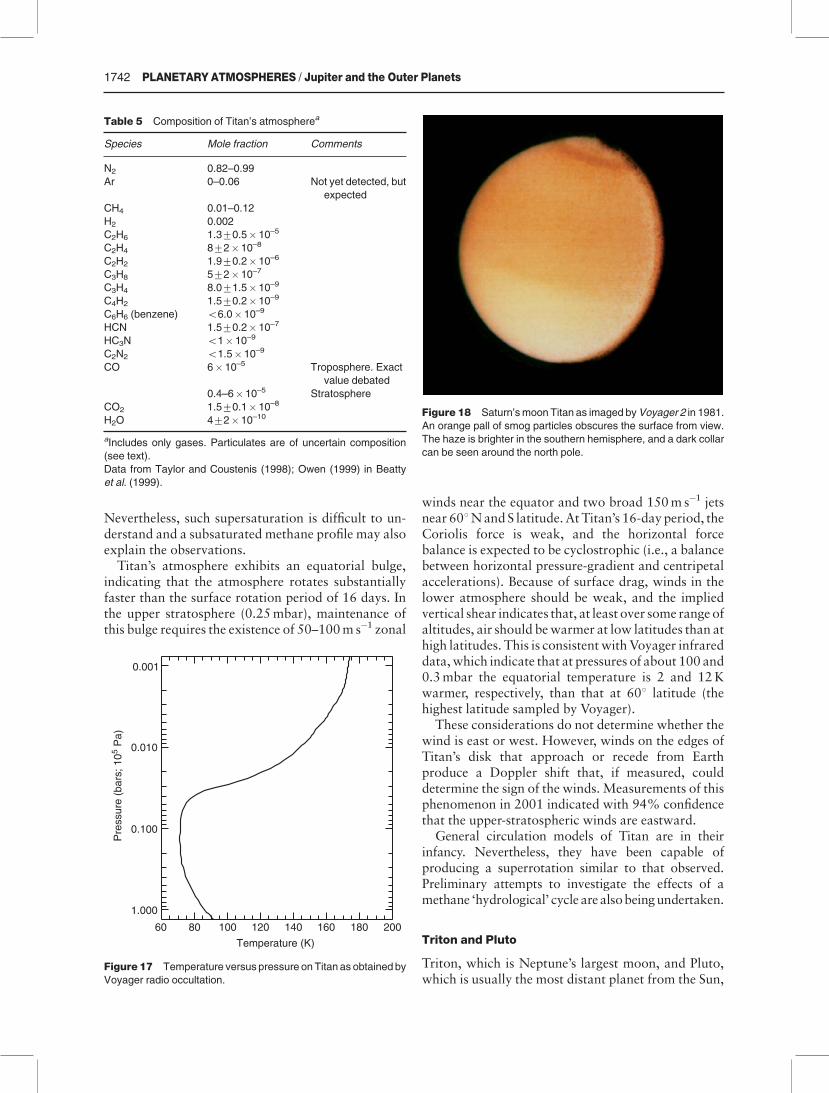
Titan is enshrouded by an opaque global layer oforange-colored aerosols (Figure 18). The Voyager 1flyby reached a minimum distance from Titan of4000 km, but no obvious hints of the surfacewere seenin Voyager images. The haze shows faint banding butno discrete clouds, preventing the precise measure-ments of wind. The haze resides primarily between 50and 200 km altitude, with an overlying (detached)layer at roughly 300 km altitude.
A variety of laboratory and theoretical studies haveshown that the haze is produced from photolytic andcatalytic destruction ofCH4 andN2. Photolytic break-up of methane by ultraviolet light, which occursprimarily above 700 km altitude, leads to methaneradicals that react to produce ethane (C2H6), acetylene
(C2H2), ethylene (C2H4), and numerous higher-orderorganics. As these gases diffuse downward to thestratosphere, where temperature is lower, they con-dense to form aerosols. Ices of these simple com-pounds are colorless, so Titan’s orange hue suggeststhat a variety of complex compounds (such as organic
Figure 14 Neptune as imaged by Voyager 2 in 1989. The Great
Dark Spot (the large dark oval), a smaller dark vortex, and
scattered, rapidly changing white clouds are visible.
Figure 15 Time evolution of Neptune’sGreat Dark Spot over 4.5
Earth days. Time proceeds forward from top to bottom at 18-hour
intervals.
1740 PLANETARY ATMOSPHERES / Jupiter and the Outer Planets
polymers) may also result. Eventually, the haze parti-cles presumably reach the surface, producing anorganic sludge.
The destruction of methane in Titan’s atmosphere isirreversible, because the hydrogen freed from thephotolysis reactions escapes to space. Titan’s atmos-pheric methane would be destroyed in 107 yearswithout somemeans of replenishment. Themost likelyscenario is that a reservoir of methane exists at orbelow Titan’s surface. (Titan’s bulk density indicatesthat approximately half its mass consists of ice, and,while H2O ice is expected to dominate, a substantialreservoir of methane is also plausible.) Moreover,extrapolation of current reaction rates backward in
time indicates that, over the age of the solar system, alayer of organics (primarily ethane) nearly 1 km deepwould have been produced. At Titan’s surfaceconditions, ethane is a liquid, so seas of liquid ethaneand dissolved methane may be present on Titan’ssurface.
A global ocean, however, is not allowed by presentdata. Radar can penetrate Titan’s haze layers, andradar observations taken in 1990 indicate that Titan’sreflectivity at radar wavelengths far exceeds that ofliquid ethane and is more consistent with water ice.Furthermore, Titan’s atmosphere is moderately trans-parent at several wavelengths near 1 mm and, startingin 1994, crude maps of Titan were produced at near-infrared wavelengths. These images show a heteroge-neous surface with bright and dark regions; thisheterogeneity is best explained by a predominantlysolid surface. Nevertheless, nonglobal ethane–meth-ane seas or lakes may still exist; another possibility isthat the liquid hydrocarbons exist in pores and cavernsin Titan’s crust.
The temperatures in Titan’s atmosphere allowcondensation of methane, so Titan may have a‘hydrological’ cycle in which methane plays the rolethat water does in Earth’s atmosphere. Over the pastfewyears, several researchers have looked for evidenceof methane condensation clouds in infrared spectra ofTitan. Time-variability in the infrared flux at wave-lengths sensitive to the lower atmosphere suggest thatsuch clouds (perhaps Titan’s equivalent of thunder-storms) occasionally exist. The lowermost few kilo-meters of Titan’s atmosphere appears to besubsaturated in methane, but, surprisingly, Titan’sinfrared spectrum is best explained by the idea that, inthe mid- and upper troposphere, methane is supersa-turated (with a relative humidity of 150–200%).
Figure 16 Clouds on Neptune at 291 N latitude. Sunlight comes
from the lower left. Shadows indicate that the white clouds are
� 50 km above the blue cloud deck.
Table 4 Properties of satellites with atmospheres
Io Europa Ganymede Callisto Titan Triton
Primary Jupiter Jupiter Jupiter Jupiter Saturn Neptune
Date of discovery 1610 1610 1610 1610 1655 1846
Orbital radius (105 km) 4.22 6.71 10.7 18.8 12.2 3.54
Orbital radius (planetary radii) 5.9 9.4 15.0 26.4 20.2 14.0
Mass (1023 kg) 0.893 0.480 1.482 1.076 1.346 0.215
Mass (Earth51) 0.0149 0.00803 0.0248 0.0180 0.0225 0.00360
Radius (km) 1818 1561 2634 2408 2575 1353
Mean density (g cm�3) 3.50 3.0 1.94 1.84 1.88 2.05
Surface gravity (ms�2) 1.80 1.31 1.42 1.24 1.35 0.78
Orbital period (days)a 1.77 3.55 7.16 16.689 15.945 5.877
Rotation periodb (days)a Syn Syn Syn Syn (Syn?) Syn
Orbital inclination 0.041 0.471 0.211 0.511 0.331 157.31
a1 day524hours586 400 s.b‘Syn’ 5 synchronous rotation (i.e., rotation period equals orbital period). Titan probably rotates synchronously, but its dense cloud layer
has prevented definitive measurement.
Data from Showman and Malhotra (1999); Beatty et al. (1999).
PLANETARY ATMOSPHERES / Jupiter and the Outer Planets 1741
Nevertheless, such supersaturation is difficult to un-derstand and a subsaturated methane profile may alsoexplain the observations.
Titan’s atmosphere exhibits an equatorial bulge,indicating that the atmosphere rotates substantiallyfaster than the surface rotation period of 16 days. Inthe upper stratosphere (0.25mbar), maintenance ofthis bulge requires the existence of 50–100m s�1 zonal
winds near the equator and two broad 150m s�1 jetsnear 601NandS latitude.AtTitan’s 16-dayperiod, theCoriolis force is weak, and the horizontal forcebalance is expected to be cyclostrophic (i.e., a balancebetween horizontal pressure-gradient and centripetalaccelerations). Because of surface drag, winds in thelower atmosphere should be weak, and the impliedvertical shear indicates that, at least over some range ofaltitudes, air should bewarmer at low latitudes than athigh latitudes. This is consistentwithVoyager infrareddata,which indicate that at pressures of about 100 and0.3mbar the equatorial temperature is 2 and 12Kwarmer, respectively, than that at 601 latitude (thehighest latitude sampled by Voyager).
These considerations do not determine whether thewind is east or west. However, winds on the edges ofTitan’s disk that approach or recede from Earthproduce a Doppler shift that, if measured, coulddetermine the sign of the winds. Measurements of thisphenomenon in 2001 indicated with 94% confidencethat the upper-stratospheric winds are eastward.
General circulation models of Titan are in theirinfancy. Nevertheless, they have been capable ofproducing a superrotation similar to that observed.Preliminary attempts to investigate the effects of amethane ‘hydrological’ cycle arealsobeingundertaken.
Triton and Pluto
Triton, which is Neptune’s largest moon, and Pluto,which is usually the most distant planet from the Sun,
Table 5 Composition of Titan’s atmospherea
Species Mole fraction Comments
N2 0.82–0.99
Ar 0–0.06 Not yet detected, but
expected
CH4 0.01–0.12
H2 0.002
C2H6 1.370.5� 10–5
C2H4 872�10–8
C2H2 1.970.2� 10–6
C3H8 572�10–7
C3H4 8.071.5� 10–9
C4H2 1.570.2� 10–9
C6H6 (benzene) o6.0� 10–9
HCN 1.570.2� 10–7
HC3N o1� 10–9
C2N2 o1.5� 10–9
CO 6� 10–5 Troposphere. Exact
value debated
0.4–6�10–5 Stratosphere
CO2 1.570.1� 10–8
H2O 472�10–10
aIncludes only gases. Particulates are of uncertain composition
(see text).
Data from Taylor and Coustenis (1998); Owen (1999) in Beatty
et al. (1999).
0.001
0.010
0.100
1.000
Pre
ssur
e (b
ars;
105
Pa)
60 80 100 120 140 160 180 200
Temperature (K)
Figure17 Temperature versus pressure onTitan as obtained by
Voyager radio occultation.
Figure 18 Saturn’smoon Titan as imaged byVoyager 2 in 1981.
An orange pall of smog particles obscures the surface from view.
The haze is brighter in the southern hemisphere, and a dark collar
can be seen around the north pole.
1742 PLANETARY ATMOSPHERES / Jupiter and the Outer Planets
are mid-sized icy worlds with tenuous atmosphereswhose main constituent, N2, is in vapor pressureequilibrium with solid N2 ice on the surface. Theshapes of infrared spectral features in the solid N2 onthe surface indicate that the N2 ice temperatures are3871K and 4072K on Triton and Pluto, respective-ly. Over the past few decades, solid CH4, CO, andH2O as well as N2 have been discovered on thesurfaces of both bodies; solid CO2 has been detectedonTritonbut not onPluto. ThatN2dominatesTriton’satmosphere is suggested by detection of gaseous N2
absorption and emission features at ultraviolet wave-lengths by the Voyager spacecraft; furthermore, thesurface pressure, 14 mbar, is equal to the vaporpressure of N2 ice at 38K. Analysis of data obtainedwhen a star passed behind Pluto in 1988 indicates thatthe molecular mass of Pluto’s atmosphere is near 28,consistent with either N2 or CO; the low vaporpressure of CO relative to N2 suggests that CO is atmost a minor constituent. Gaseous CH4 has beendetected in the atmospheres of Triton and Pluto, withmole fractions of 2–6� 10� 4 and 0.001–0.1, respec-tively. The low CH4 abundance is consistent with thelower volatility of CH4 relative to N2.
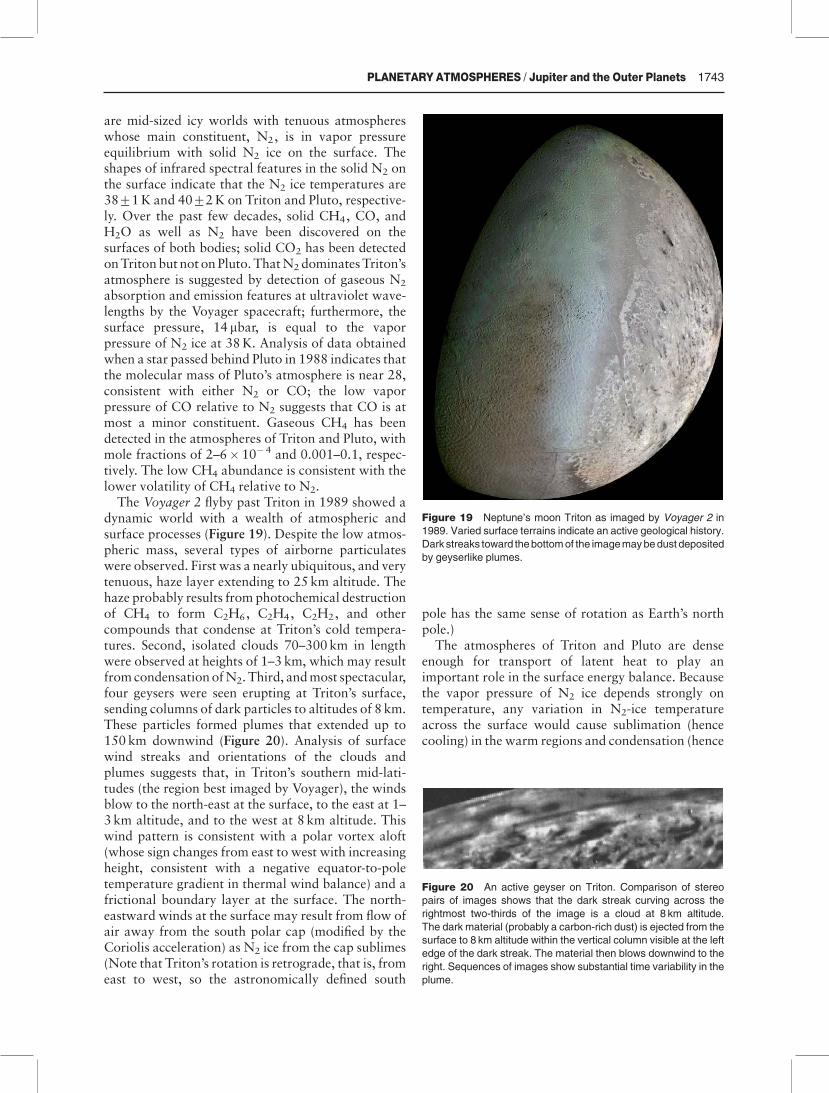
The Voyager 2 flyby past Triton in 1989 showed adynamic world with a wealth of atmospheric andsurface processes (Figure 19). Despite the low atmos-pheric mass, several types of airborne particulateswere observed. First was a nearly ubiquitous, and verytenuous, haze layer extending to 25 km altitude. Thehaze probably results from photochemical destructionof CH4 to form C2H6, C2H4, C2H2, and othercompounds that condense at Triton’s cold tempera-tures. Second, isolated clouds 70–300 km in lengthwere observed at heights of 1–3 km, which may resultfromcondensationofN2.Third, andmost spectacular,four geysers were seen erupting at Triton’s surface,sending columns of dark particles to altitudes of 8 km.These particles formed plumes that extended up to150 km downwind (Figure 20). Analysis of surfacewind streaks and orientations of the clouds andplumes suggests that, in Triton’s southern mid-lati-tudes (the region best imaged by Voyager), the windsblow to the north-east at the surface, to the east at 1–3 km altitude, and to the west at 8 km altitude. Thiswind pattern is consistent with a polar vortex aloft(whose sign changes from east to west with increasingheight, consistent with a negative equator-to-poletemperature gradient in thermal wind balance) and africtional boundary layer at the surface. The north-eastward winds at the surface may result from flow ofair away from the south polar cap (modified by theCoriolis acceleration) as N2 ice from the cap sublimes(Note that Triton’s rotation is retrograde, that is, fromeast to west, so the astronomically defined south
pole has the same sense of rotation as Earth’s northpole.)
The atmospheres of Triton and Pluto are denseenough for transport of latent heat to play animportant role in the surface energy balance. Becausethe vapor pressure of N2 ice depends strongly ontemperature, any variation in N2-ice temperatureacross the surface would cause sublimation (hencecooling) in the warm regions and condensation (hence
Figure 19 Neptune’s moon Triton as imaged by Voyager 2 in
1989. Varied surface terrains indicate an active geological history.
Dark streaks toward thebottomof the imagemaybedust deposited
by geyserlike plumes.
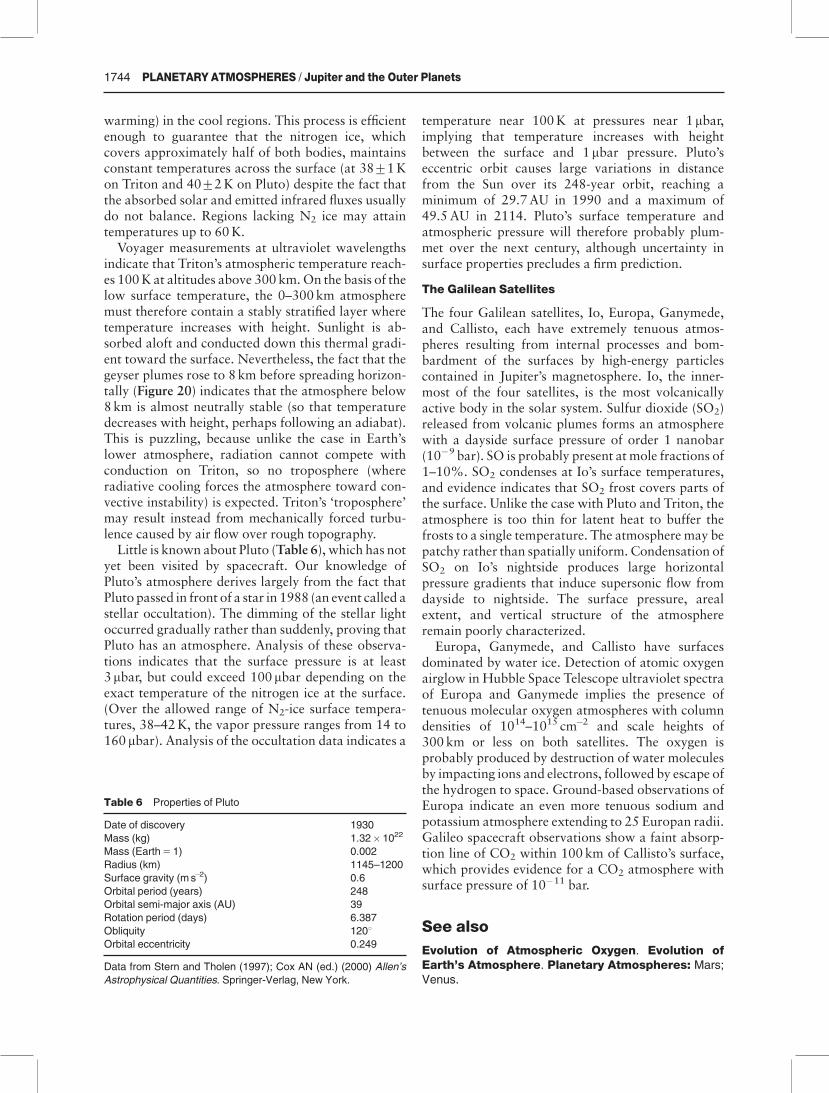
Figure 20 An active geyser on Triton. Comparison of stereo
pairs of images shows that the dark streak curving across the
rightmost two-thirds of the image is a cloud at 8 km altitude.
The dark material (probably a carbon-rich dust) is ejected from the
surface to 8 km altitude within the vertical column visible at the left
edge of the dark streak. The material then blows downwind to the
right. Sequences of images show substantial time variability in the
plume.
PLANETARY ATMOSPHERES / Jupiter and the Outer Planets 1743
warming) in the cool regions. This process is efficientenough to guarantee that the nitrogen ice, whichcovers approximately half of both bodies, maintainsconstant temperatures across the surface (at 3871Kon Triton and 4072K on Pluto) despite the fact thatthe absorbed solar and emitted infrared fluxes usuallydo not balance. Regions lacking N2 ice may attaintemperatures up to 60K.
Voyager measurements at ultraviolet wavelengthsindicate that Triton’s atmospheric temperature reach-es 100K at altitudes above 300 km.On the basis of thelow surface temperature, the 0–300 km atmospheremust therefore contain a stably stratified layer wheretemperature increases with height. Sunlight is ab-sorbed aloft and conducted down this thermal gradi-ent toward the surface. Nevertheless, the fact that thegeyser plumes rose to 8 km before spreading horizon-tally (Figure 20) indicates that the atmosphere below8km is almost neutrally stable (so that temperaturedecreases with height, perhaps following an adiabat).This is puzzling, because unlike the case in Earth’slower atmosphere, radiation cannot compete withconduction on Triton, so no troposphere (whereradiative cooling forces the atmosphere toward con-vective instability) is expected. Triton’s ‘troposphere’may result instead from mechanically forced turbu-lence caused by air flow over rough topography.
Little is known about Pluto (Table 6), which has notyet been visited by spacecraft. Our knowledge ofPluto’s atmosphere derives largely from the fact thatPluto passed in front of a star in 1988 (an event called astellar occultation). The dimming of the stellar lightoccurred gradually rather than suddenly, proving thatPluto has an atmosphere. Analysis of these observa-tions indicates that the surface pressure is at least3mbar, but could exceed 100 mbar depending on theexact temperature of the nitrogen ice at the surface.(Over the allowed range of N2-ice surface tempera-tures, 38–42K, the vapor pressure ranges from 14 to160 mbar). Analysis of the occultation data indicates a
temperature near 100K at pressures near 1mbar,implying that temperature increases with heightbetween the surface and 1mbar pressure. Pluto’seccentric orbit causes large variations in distancefrom the Sun over its 248-year orbit, reaching aminimum of 29.7AU in 1990 and a maximum of49.5AU in 2114. Pluto’s surface temperature andatmospheric pressure will therefore probably plum-met over the next century, although uncertainty insurface properties precludes a firm prediction.
The Galilean Satellites
The four Galilean satellites, Io, Europa, Ganymede,and Callisto, each have extremely tenuous atmos-pheres resulting from internal processes and bom-bardment of the surfaces by high-energy particlescontained in Jupiter’s magnetosphere. Io, the inner-most of the four satellites, is the most volcanicallyactive body in the solar system. Sulfur dioxide (SO2)released from volcanic plumes forms an atmospherewith a dayside surface pressure of order 1 nanobar(10�9 bar). SO is probably present at mole fractions of1–10%. SO2 condenses at Io’s surface temperatures,and evidence indicates that SO2 frost covers parts ofthe surface. Unlike the case with Pluto and Triton, theatmosphere is too thin for latent heat to buffer thefrosts to a single temperature. The atmosphere may bepatchy rather than spatially uniform. Condensation ofSO2 on Io’s nightside produces large horizontalpressure gradients that induce supersonic flow fromdayside to nightside. The surface pressure, arealextent, and vertical structure of the atmosphereremain poorly characterized.
Europa, Ganymede, and Callisto have surfacesdominated by water ice. Detection of atomic oxygenairglow in Hubble Space Telescope ultraviolet spectraof Europa and Ganymede implies the presence oftenuous molecular oxygen atmospheres with columndensities of 1014–1015 cm�2 and scale heights of300 km or less on both satellites. The oxygen isprobably produced by destruction of water moleculesby impacting ions and electrons, followed by escape ofthe hydrogen to space. Ground-based observations ofEuropa indicate an even more tenuous sodium andpotassium atmosphere extending to 25 Europan radii.Galileo spacecraft observations show a faint absorp-tion line of CO2 within 100 km of Callisto’s surface,which provides evidence for a CO2 atmosphere withsurface pressure of 10�11 bar.
See also
Evolution of Atmospheric Oxygen. Evolution ofEarth’s Atmosphere. Planetary Atmospheres: Mars;Venus.
Table 6 Properties of Pluto
Date of discovery 1930
Mass (kg) 1.32� 1022
Mass (Earth51) 0.002
Radius (km) 1145–1200
Surface gravity (ms�2) 0.6
Orbital period (years) 248
Orbital semi-major axis (AU) 39
Rotation period (days) 6.387
Obliquity 1201Orbital eccentricity 0.249
Data from Stern and Tholen (1997); Cox AN (ed.) (2000) Allen’s
Astrophysical Quantities. Springer-Verlag, New York.
1744 PLANETARY ATMOSPHERES / Jupiter and the Outer Planets

Further Reading
Atreya SK, Pollack JB and Matthews MS (eds) (1989)Origin and Evolution of Planetary and SatelliteAtmospheres. Tucson, AZ: University of ArizonaPress.
Beatty JK, Petersen CC andChaikin A (eds) (1999)TheNewSolar System. Cambridge, MA: Sky Publishing andCambridge University Press.
Bergstralh JT, Miner ED and Matthews MS (eds)(1991) Uranus. Tucson, AZ: University of ArizonaPress.
Cruikshank D (1995) Neptune and Triton. Tucson, AZ:University of Arizona Press.
Gehrels T and Matthews MS (eds) (1984) Saturn. Tucson,AZ: University of Arizona Press.
Ingersoll AP (1990) Atmospheric dynamics of the outerplanets. Science 248: 308–315.
Lellouch E (1996) Urey Prize Lecture. Io’s atmosphere: notyet understood. Icarus 124: 1–21.
Rogers JH (1995)TheGiant Planet Jupiter. Cambridge, UK:Cambridge University Press.
ShowmanAPandMalhotraR (1999)TheGalilean satellites.Science 286: 77–84.
Stern SA and Tholen DJ (eds) (1997) Pluto and Charon.Tucson, AZ: University of Arizona Press.
Taylor FWandCoustenis A (1998) Titan in the solar system.Planetary and Space Science 46: 1085–1097.
Mars
RM Haberle, NASA/Ames Research Center, MoffettField, CA, USA
Introduction
The atmosphere of Mars is similar to Earth’s; it is thinand relatively transparent to sunlight. Mars’ spin rateand axial tilt are also Earthlike. Thus, the Martianatmosphere falls into the category of a rapidly rotat-ing, differentially heated atmosphere with a solidlower boundary. However, there are also importantdifferences. The Martian atmosphere is primarilycarbon dioxide with a much lower surface pressurethan Earth’s; and Mars does not have an Earthlikehydrological cycle, so latent heat release is not asimportant as it is for Earth. It does, however, containsuspended dust particles, which provide significantdiabatic heating.
Mars also appears to have experienced significantclimate change. Today, Mars is cold and dry,yet spacecraft images provide tantalizing evidencethat the planet’s climate was different in the past.Layered terrains in the polar regions may havebeen created by climate change associated withastronomical variations in Mars’ orbital parameters.Valley networks and degraded craters in ancientterrains may be the result of a thicker atmosphereearly in Mars’ history. And there is some evidencethat the planet may have had an ocean at sometime in its past, perhaps on several occasions. Thus,Mars is an ideal laboratory for comparative meteo-rological studies and it may provide insights into themechanisms responsible for climate change here onEarth.
Composition and Mass
The composition of the Martian atmosphere wasdetermined in the mid 1970s by the Viking landers.The results of their measurements are given inTable 1.Carbon dioxide is the principal constituent, followedby nitrogen, argon, oxygen, and carbon monoxide.Trace amounts of the noble gases are also present.Additional minor and highly variable constituentsinclude water vapor, ozone, and dust particles. To-gether, these gases exert a global annually averagedsurface pressure of 6:1 hPa, which corresponds to anaverage column mass loading of 164 kgm�2.
Temperatures
Temperatures depend critically on Mars’ orbitalparameters (Table 2). The main points are that (1)Mars receives about half as much annually averaged
Table 1 Composition of the Martian lower atmosphere
ðo120 kmÞConstituent Abundance
CO2 95.32%
N2 2.7%40Ar 1.6%
O2 0.13%
CO 0.07%
H2O 0.03% (variable)
Ne 2.5 ppm
Kr 0.3 ppm
Xe 0.08 ppm
O3 0.04–0.2 ppm (variable)
Dust 0 to� 5 (visible optical depth)
PLANETARY ATMOSPHERES /Mars 1745