planetary-scale views on a large instant-messaging network · pdf fileplanetary-scale views on...
TRANSCRIPT

Planetary-Scale Views on a LargeInstant-Messaging Network
Jure Leskovec∗
Carnegie Mellon [email protected]
Eric HorvitzMicrosoft Research
ABSTRACTWe present a study of anonymized data capturing a monthof high-level communication activities within the whole ofthe Microsoft Messenger instant-messaging system. We ex-amine characteristics and patterns that emerge from the col-lective dynamics of large numbers of people, rather than theactions and characteristics of individuals. The dataset con-tains summary properties of 30 billion conversations among240 million people. From the data, we construct a commu-nication graph with 180 million nodes and 1.3 billion undi-rected edges, creating the largest social network constructedand analyzed to date. We report on multiple aspects ofthe dataset and synthesized graph. We find that the graphis well-connected and robust to node removal. We inves-tigate on a planetary-scale the oft-cited report that peopleare separated by “six degrees of separation” and find thatthe average path length among Messenger users is 6.6. Wealso find that people tend to communicate more with eachother when they have similar age, language, and location,and that cross-gender conversations are both more frequentand of longer duration than conversations with the samegender.
Categories and Subject Descriptors: H.2.8 DatabaseManagement: : Database applications – Data mining
General Terms: Measurement; Experimentation.
Keywords: Social networks; Communication networks; Userdemographics; Large data; Online communication.
1. INTRODUCTIONLarge-scale web services provide unprecedented opportu-
nities to capture and analyze behavioral data on a plan-etary scale. We discuss findings drawn from aggregationsof anonymized data representing one month (June 2006) ofhigh-level communication activities of people using the Mi-crosoft Messenger instant-messaging (IM) network. We didnot have nor seek access to the content of messages. Rather,we consider structural properties of a communication graphand study how structure and communication relate to userdemographic attributes, such as gender, age, and location.The data set provides a unique lens for studying patterns ofhuman behavior on a wide scale.
∗Jure Leskovec performed this research during an internshipat Microsoft Research.
Copyright is held by the International World Wide Web Conference Com-mittee (IW3C2). Distribution of these papers is limited to classroom use,and personal use by others.WWW 2008, April 21–25, 2008, Beijing, China.ACM 978-1-60558-085-2/08/04.
We explore a dataset of 30 billion conversations generatedby 240 million distinct users over one month. We found thatapproximately 90 million distinct Messenger accounts wereaccessed each day and that these users produced about 1 bil-lion conversations, with approximately 7 billion exchangedmessages per day. 180 million of the 240 million active ac-counts had at least one conversation on the observation pe-riod. We found that 99% of the conversations occurred be-tween 2 people, and the rest with greater numbers of partic-ipants. To our knowledge, our investigation represents thelargest and most comprehensive study to date of presenceand communications in an IM system. A recent report [6]estimated that approximately 12 billion instant messages aresent each day. Given the estimate and the growth of IM, weestimate that we captured approximately half of the world’sIM communication during the observation period.
We created an undirected communication network fromthe data where each user is represented by a node and anedge is placed between users if they exchanged at least onemessage during the month of observation. The network rep-resents accounts that were active during June 2006. In sum-mary, the communication graph has 180 million nodes, rep-resenting users who participated in at least one conversation,and 1.3 billion undirected edges among active users, wherean edge indicates that a pair of people communicated. Wenote that this graph should be distinguished from a buddygraph where two people are connected if they appear on eachother’s contact lists. The buddy graph for the data contains240 million nodes and 9.1 billion edges. On average eachaccount has approximately 50 buddies on a contact list.
To highlight several of our key findings, we discovered thatthe communication network is well connected, with 99.9%of the nodes belonging to the largest connected component.We evaluated the oft-cited finding by Travers and Milgramthat any two people are linked to one another on averagevia a chain with “6-degrees-of-separation” [17]. We foundthat the average shortest path length in the Messenger net-work is 6.6 (median 6), which is half a link more than thepath length measured in the classic study. However, wealso found that longer paths exist in the graph, with lengthsup to 29. We observed that the network is well clustered,with a clustering coefficient [19] that decays with exponent−0.37. This decay is significantly lower than the value wehad expected given prior research [11]. We found stronghomophily [9, 12] among users; people have more conversa-tions and converse for longer durations with people who aresimilar to themselves. We find the strongest homophily forthe language used, followed by conversants’ geographic lo-
cations, and then age. We found that homophily does nothold for gender; people tend to converse more frequentlyand with longer durations with the opposite gender. Wealso examined the relation between communication and dis-tance, and found that the number of conversations tends todecrease with increasing geographical distance between con-versants. However, communication links spanning longerdistances tend to carry more and longer conversations.
2. INSTANT MESSAGINGThe use of IM has been become widely adopted in personal
and businesss communications. IM clients allow users fast,near-synchronous communication, placing it between syn-chronous communication mediums, such as real-time voiceinteractions, and asynchronous communication mediums likeemail [18]. IM users exchange short text messages with oneor more users from their list of contacts, who have to be on-line and logged into the IM system at the time of interaction.As conversations and messages exchanged within them areusually very short, it has been observed that users employinformal language, loose grammar, numerous abbreviations,with minimal punctuation [10]. Contact lists are commonlyreferred to as buddy lists and users on the lists are referredto as buddies.
2.1 Research on Instant MessagingSeveral studies on smaller datasets are related to this
work. Avrahami and Hudson [3] explored communicationcharacteristics of 16 IM users. Similarly, Shi et al. [13] ana-lyzed IM contact lists submitted by users to a public websiteand explored a static contact network of 140,000 people. Re-cently, Xiao et al. [20] investigated IM traffic characteristicswithin a large organization with 400 users of Messenger. Ourstudy differs from the latter study in that we analyze the full
Messenger population over a one month period, capturingthe interaction of user demographic attributes, communica-tion patterns, and network structure.
2.2 Data descriptionTo construct the Microsoft Instant Messenger communica-
tion dataset, we combined three different sources of data: (1)user demographic information, (2) time and user stampedevents describing the presence of a particular user, and (3)communication session logs, where, for all participants, thenumber of exchanged messages and the periods of time spentparticipating in sessions is recorded.
We use the terms session and conversation interchange-ably to refer to an IM interaction among two or more people.Although the Messenger system limits the number of peo-ple communicating at the same time to 20, people can enterand leave a conversation over time. We note that, for largesessions, people can come and go over time, so conversationscan be long with many different people participating. Weobserved some very long sessions with more than 50 partic-ipants joining over time.
All of our data was anonymized; we had no access to per-sonally identifiable information. Also, we had no access totext of the messages exchanged or any other informationthat could be used to uniquely identify users. We focused onanalyzing high-level characteristics and patterns that emergefrom the collective dynamics of 240 million people, ratherthan the actions and characteristics of individuals. The an-alyzed data can be split into three parts: presence data,communication data, and user demographic information:
100
102
104
106
100
105
1010
γ = 3.6
number of Login events per user
coun
t
Login every20 minutes
Login every15 seconds
100
102
104
100
105
1010
γ = 2.2
number of AddBuddy events per user
coun
t
(a) Login (b) AddBuddy
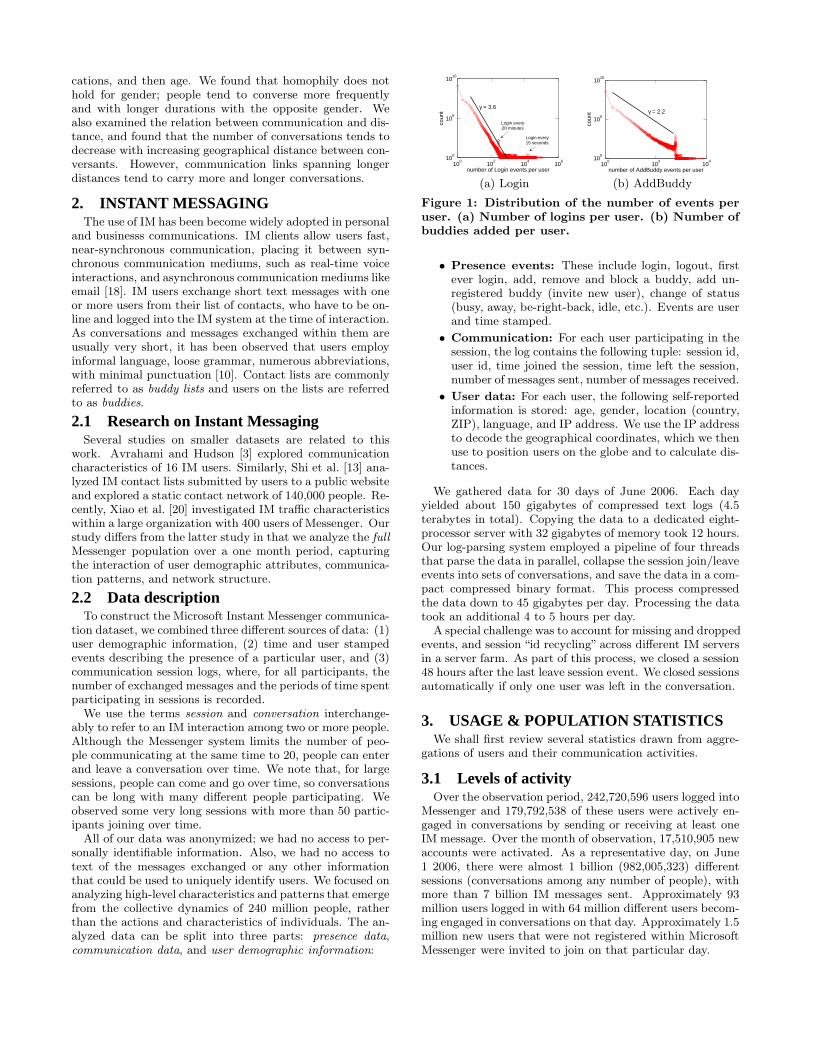
Figure 1: Distribution of the number of events peruser. (a) Number of logins per user. (b) Number ofbuddies added per user.
• Presence events: These include login, logout, firstever login, add, remove and block a buddy, add un-registered buddy (invite new user), change of status(busy, away, be-right-back, idle, etc.). Events are userand time stamped.
• Communication: For each user participating in thesession, the log contains the following tuple: session id,user id, time joined the session, time left the session,number of messages sent, number of messages received.
• User data: For each user, the following self-reportedinformation is stored: age, gender, location (country,ZIP), language, and IP address. We use the IP addressto decode the geographical coordinates, which we thenuse to position users on the globe and to calculate dis-tances.
We gathered data for 30 days of June 2006. Each dayyielded about 150 gigabytes of compressed text logs (4.5terabytes in total). Copying the data to a dedicated eight-processor server with 32 gigabytes of memory took 12 hours.Our log-parsing system employed a pipeline of four threadsthat parse the data in parallel, collapse the session join/leaveevents into sets of conversations, and save the data in a com-pact compressed binary format. This process compressedthe data down to 45 gigabytes per day. Processing the datatook an additional 4 to 5 hours per day.
A special challenge was to account for missing and droppedevents, and session “id recycling” across different IM serversin a server farm. As part of this process, we closed a session48 hours after the last leave session event. We closed sessionsautomatically if only one user was left in the conversation.
3. USAGE & POPULATION STATISTICSWe shall first review several statistics drawn from aggre-
gations of users and their communication activities.
3.1 Levels of activityOver the observation period, 242,720,596 users logged into
Messenger and 179,792,538 of these users were actively en-gaged in conversations by sending or receiving at least oneIM message. Over the month of observation, 17,510,905 newaccounts were activated. As a representative day, on June1 2006, there were almost 1 billion (982,005,323) differentsessions (conversations among any number of people), withmore than 7 billion IM messages sent. Approximately 93million users logged in with 64 million different users becom-ing engaged in conversations on that day. Approximately 1.5million new users that were not registered within MicrosoftMessenger were invited to join on that particular day.
100101102103104105106107108109
100 101 102
Cou
nt
Number of users per session
∝ x-3.5
20102103104105106107108109
10101011
100 101 102
Cou
nt
Conversation duration
∝ x-3.67
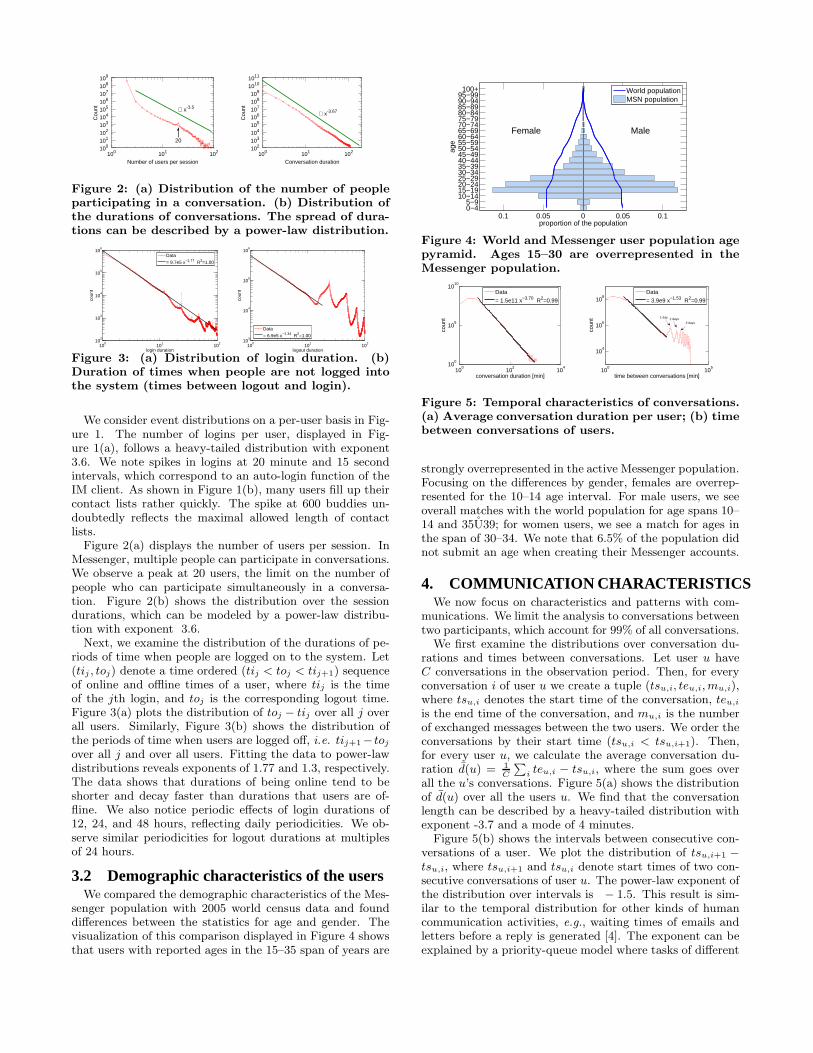
Figure 2: (a) Distribution of the number of peopleparticipating in a conversation. (b) Distribution ofthe durations of conversations. The spread of dura-tions can be described by a power-law distribution.
100
101
102
102
103
104
105
106
login duration
coun
t
Data
= 9.7e5 x−1.77 R2=1.00
100
101
102
103
104
105
106
logout duration
coun
t
Data
= 6.9e5 x−1.34 R2=1.00
Figure 3: (a) Distribution of login duration. (b)Duration of times when people are not logged intothe system (times between logout and login).
We consider event distributions on a per-user basis in Fig-ure 1. The number of logins per user, displayed in Fig-ure 1(a), follows a heavy-tailed distribution with exponent3.6. We note spikes in logins at 20 minute and 15 secondintervals, which correspond to an auto-login function of theIM client. As shown in Figure 1(b), many users fill up theircontact lists rather quickly. The spike at 600 buddies un-doubtedly reflects the maximal allowed length of contactlists.
Figure 2(a) displays the number of users per session. InMessenger, multiple people can participate in conversations.We observe a peak at 20 users, the limit on the number ofpeople who can participate simultaneously in a conversa-tion. Figure 2(b) shows the distribution over the sessiondurations, which can be modeled by a power-law distribu-tion with exponent 3.6.
Next, we examine the distribution of the durations of pe-riods of time when people are logged on to the system. Let(tij , toj) denote a time ordered (tij < toj < tij+1) sequenceof online and offline times of a user, where tij is the timeof the jth login, and toj is the corresponding logout time.Figure 3(a) plots the distribution of toj − tij over all j overall users. Similarly, Figure 3(b) shows the distribution ofthe periods of time when users are logged off, i.e. tij+1− toj
over all j and over all users. Fitting the data to power-lawdistributions reveals exponents of 1.77 and 1.3, respectively.The data shows that durations of being online tend to beshorter and decay faster than durations that users are of-fline. We also notice periodic effects of login durations of12, 24, and 48 hours, reflecting daily periodicities. We ob-serve similar periodicities for logout durations at multiplesof 24 hours.
3.2 Demographic characteristics of the usersWe compared the demographic characteristics of the Mes-
senger population with 2005 world census data and founddifferences between the statistics for age and gender. Thevisualization of this comparison displayed in Figure 4 showsthat users with reported ages in the 15–35 span of years are
0.1 0.05 0 0.05 0.10−45−9
10−1415−1920−2425−2930−3435−3940−4445−4950−5455−5960−6465−6970−7475−7980−8485−8990−9495−99100+
MaleFemale
proportion of the population
age
World populationMSN population
Figure 4: World and Messenger user population agepyramid. Ages 15–30 are overrepresented in theMessenger population.
100
102
104
100
105
1010
conversation duration [min]
coun
t
Data
= 1.5e11 x−3.70 R2=0.99
100
105
104
106
108
time between conversations [min]
coun
t
Data
= 3.9e9 x−1.53 R2=0.99
1 day 2 days3 days
Figure 5: Temporal characteristics of conversations.(a) Average conversation duration per user; (b) timebetween conversations of users.
strongly overrepresented in the active Messenger population.Focusing on the differences by gender, females are overrep-resented for the 10–14 age interval. For male users, we seeoverall matches with the world population for age spans 10–14 and 35U39; for women users, we see a match for ages inthe span of 30–34. We note that 6.5% of the population didnot submit an age when creating their Messenger accounts.
4. COMMUNICATION CHARACTERISTICSWe now focus on characteristics and patterns with com-
munications. We limit the analysis to conversations betweentwo participants, which account for 99% of all conversations.
We first examine the distributions over conversation du-rations and times between conversations. Let user u haveC conversations in the observation period. Then, for everyconversation i of user u we create a tuple (tsu,i, teu,i, mu,i),where tsu,i denotes the start time of the conversation, teu,i
is the end time of the conversation, and mu,i is the numberof exchanged messages between the two users. We order theconversations by their start time (tsu,i < tsu,i+1). Then,for every user u, we calculate the average conversation du-ration d(u) = 1
C
∑iteu,i − tsu,i, where the sum goes over
all the u’s conversations. Figure 5(a) shows the distributionof d(u) over all the users u. We find that the conversationlength can be described by a heavy-tailed distribution withexponent -3.7 and a mode of 4 minutes.
Figure 5(b) shows the intervals between consecutive con-versations of a user. We plot the distribution of tsu,i+1 −tsu,i, where tsu,i+1 and tsu,i denote start times of two con-secutive conversations of user u. The power-law exponent ofthe distribution over intervals is − 1.5. This result is sim-ilar to the temporal distribution for other kinds of humancommunication activities, e.g., waiting times of emails andletters before a reply is generated [4]. The exponent can beexplained by a priority-queue model where tasks of different

10 20 30 40 50 6010
15
20
25
30
35
40
45
50
55
60
10 20 30 40 50 6010
15
20
25
30
35
40
45
50
55
60
(a) Number of conversations (b) Conversation duration
10 20 30 40 50 6010
15
20
25
30
35
40
45
50
55
60
10 20 30 40 50 6010
15
20
25
30
35
40
45
50
55
60
(c) Messages per conversation (d) Messages per unit time
Figure 6: Communication characteristics of users byreported age. We plot age vs. age and the color (z-axis) represents the intensity of communication.
priorities arrive and wait until all tasks with higher priorityare addressed. This model generates a task waiting timedistribution described by a power-law with exponent −1.5.
5. COMMUNICATION DEMOGRAPHICSNext we examine the interplay of communication and user
demographic attributes, i.e., how geography, location, age,and gender influence observed communication patterns.
5.1 Communication by ageWe sought to understand how communication among peo-
ple changes with the reported ages of participating users.Figures 6(a)-(d) use a heat-map visualization to commu-nicate properties for different age–age pairs. The rows andcolumns represent the ages of both parties participating, andthe color at each age–age cell captures the logarithm of thevalue for the pairing. The color spectrum extends from blue(low value) through green, yellow, and onto red (the highestvalue). Because of potential misreporting at very low andhigh ages, we concentrate on users with self-reported agesthat fall between 10 and 60 years.
Let a tuple (ai, bi, di, mi) denote the ith conversation inthe entire dataset that occurred among users of ages ai
and bi. The conversation had a duration of di secondsduring which mi messages were exchanged. Let Ca,b ={(ai, bi, di, mi) : ai = a ∧ bi = b} denote a set of all con-versations between users of ages a and b, respectively.
Figure 6(a) shows the number of conversations among peo-ple of different ages. For every pair of ages (a, b) the colorindicates the size of set Ca,b, i.e., the number of differentconversations between users of ages a and b. We note that,as the notion of a conversation is symmetric, the plots aresymmetric. Most conversations occur between people of ages10 to 20. The diagonal trend indicates that people tend totalk to people of similar age. This is true especially for agegroups between 10 and 30 years. We shall explore this ob-servation in more detail in Section 6.
Figure 6(b) displays a heat map for the average conver-sation duration, computed as 1
|Ca,b|
∑i∈Ca,b
di. We note
that older people tend to have longer conversations. We ob-
(a) U F MU 1.3 3.6 3.7F 21.3 49.9M 20.2
(b) U F MU 277 301 277F 275 304M 252
(c) U F MU 5.7 7.1 6.7F 6.6 7.6M 5.9
(d) U F MU 1.25 1.42 1.38F 1.43 1.50M 1.42
Table 1: Cross-gender communication, based on alltwo-person conversations during June 2006. (a)Percentage of conversations among users of differ-ent self-reported gender; (b) average conversationlength in seconds; (c) number of exchanged messagesper conversation; (d) number of exchanged messagesper minute of conversation.
serve a similar phenomenon when plotting the average num-ber of exchanged messages per conversation, computed as
1
|Ca,b|
∑i∈Ca,b
mi, displayed in Figure 6(c). Again, we find
that older people exchange more messages, and we observea dip for ages 25–45 and a slight peak for ages 15–25. Fig-ure 6(d) displays the number of exchanged messages per unittime; for each age pair, (a, b), we measure 1
|Ca,b|
∑i∈Ca,b
mi
di.
Here, we see that younger people have faster-paced dialogs,while older people exchange messages at a slower pace.
We note that the younger population (ages 10–35) arestrongly biased towards communicating with people of asimilar age (diagonal trend in Figure 6(a)), and that userswho report being of ages 35 years and above tend to com-municate more evenly across ages (rectangular pattern inFig. 6(a)). Moreover, older people have conversations of thelongest durations, with a “valley” in the duration of conver-sations for users of ages 25–35. Such a dip may representshorter, faster-paced and more intensive conversations asso-ciated with work-related communications, versus more ex-tended, slower, and longer interactions associated with socialdiscourse.
5.2 Communication by genderWe report on analyses of properties of pairwise communi-
cations as a function of the self-reported gender of users inconversations in Table 1. Let Cg,h = {(gi, hi, di, mi) : gi =g∧hi = h} denote a set of conversations where the two par-ticipating users are of genders g and h. Note that g takes 3possible values: female, male, and unknown (unreported).
Table 1(a) relays |Cg,h| for combinations of genders g andh. The table shows that approximately 50% of conversationsoccur between male and female and 40% of the conversationsoccur among users of the same gender (20% for each). Asmall number of conversations occur between people whodid not reveal their gender.
Similarly, Table 1(b) shows the average conversation lengthin seconds, broken down by the gender of conversant, com-puted as 1
|Cg,h|
∑i∈Cg,h
di. We find that male–male conver-
sations tend to be shortest, lasting approximately 4 min-utes. Female–female conversations last 4.5 minutes on theaverage. Female–male conversations have the longest du-rations, taking more than 5 minutes on average. Beyondtaking place over longer periods of time, more messages areexchanged in female–male conversations. Table 1(c) lists
values for 1
|Cg,h|
∑i∈Cg,h
mi and shows that, in female–male
conversations, 7.6 messages are exchanged per conversationon the average as opposed to 6.6 and 5.9 for female–femaleand male–male, respectively. Table 1(d) shows the com-munication intensity computed as 1
|Cg,h|
∑i∈Cg,h
mi
di. The
number of messages exchanged per minute of conversationfor male–female conversations is higher at 1.5 messages perminute than for cross-gender conversations, where the rateis 1.43 messages per minute.
We examined the number of communication ties, where atie is established between two people when they exchangeat least one message during the observation period. Wecomputed 300 million male–male ties, 255 million female–female ties, and 640 million cross-gender ties. The Mes-senger population consists of 100 million males and 80 mil-lion females by self report. These findings demonstrate thatties are not heavily gender biased; based on the popula-tion, random chance predicts 31% male–male, 20% female–female, and 49% female–male links. We observe 25% male–male, 21% female–female, and 54% cross-gender links, thusdemonstrating a minor bias of female–male links.
The results reported in Table 1 run counter to prior stud-ies reporting that communication among individuals whoresemble one other (same gender) occurs more often (see [9]and references therein). We identified significant heterophily,where people tend to communicate more with people of theopposite gender. However, we note that link heterogeneitywas very close to the population value [8], i.e., the number ofsame- and cross-gender ties roughly corresponds to randomchance. This shows there is no significant bias in linkingfor gender. However, we observe that cross-gender conver-sations tend to be longer and to include more messages,suggesting that more effort is devoted to conversations withthe opposite sex.
5.3 World geography and communicationWe now focus on the influence of geography and distance
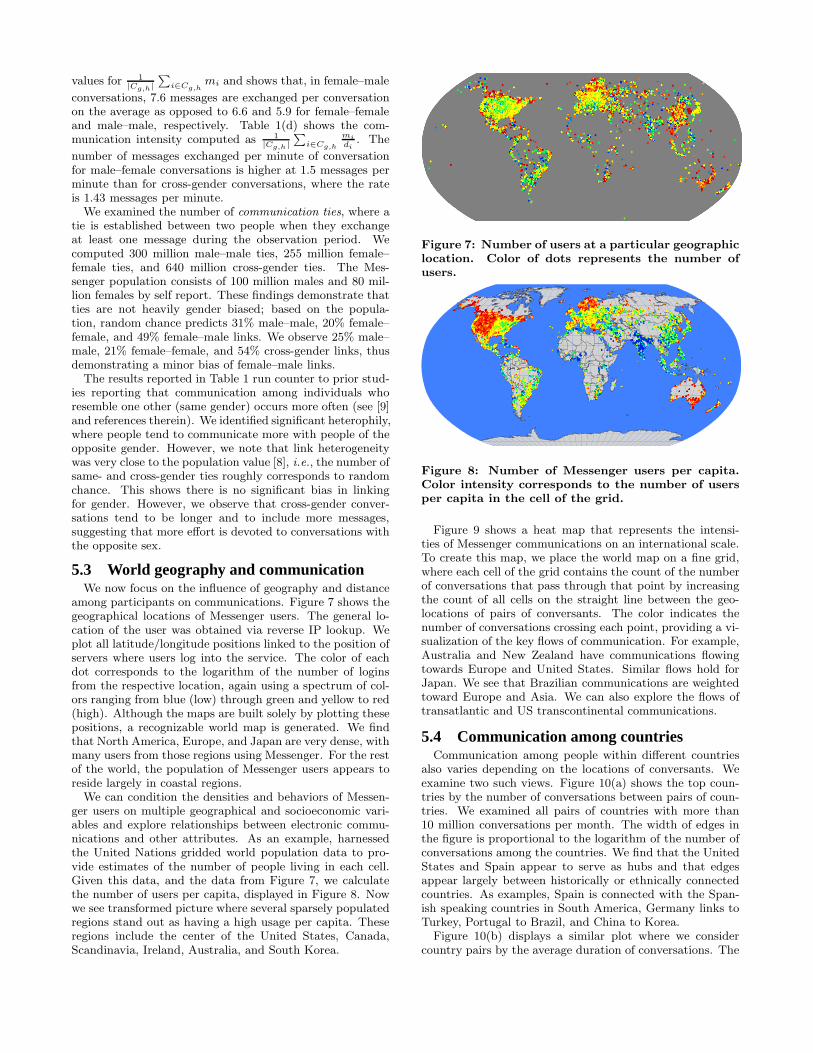
among participants on communications. Figure 7 shows thegeographical locations of Messenger users. The general lo-cation of the user was obtained via reverse IP lookup. Weplot all latitude/longitude positions linked to the position ofservers where users log into the service. The color of eachdot corresponds to the logarithm of the number of loginsfrom the respective location, again using a spectrum of col-ors ranging from blue (low) through green and yellow to red(high). Although the maps are built solely by plotting thesepositions, a recognizable world map is generated. We findthat North America, Europe, and Japan are very dense, withmany users from those regions using Messenger. For the restof the world, the population of Messenger users appears toreside largely in coastal regions.
We can condition the densities and behaviors of Messen-ger users on multiple geographical and socioeconomic vari-ables and explore relationships between electronic commu-nications and other attributes. As an example, harnessedthe United Nations gridded world population data to pro-vide estimates of the number of people living in each cell.Given this data, and the data from Figure 7, we calculatethe number of users per capita, displayed in Figure 8. Nowwe see transformed picture where several sparsely populatedregions stand out as having a high usage per capita. Theseregions include the center of the United States, Canada,Scandinavia, Ireland, Australia, and South Korea.
Figure 7: Number of users at a particular geographiclocation. Color of dots represents the number ofusers.
Figure 8: Number of Messenger users per capita.Color intensity corresponds to the number of usersper capita in the cell of the grid.
Figure 9 shows a heat map that represents the intensi-ties of Messenger communications on an international scale.To create this map, we place the world map on a fine grid,where each cell of the grid contains the count of the numberof conversations that pass through that point by increasingthe count of all cells on the straight line between the geo-locations of pairs of conversants. The color indicates thenumber of conversations crossing each point, providing a vi-sualization of the key flows of communication. For example,Australia and New Zealand have communications flowingtowards Europe and United States. Similar flows hold forJapan. We see that Brazilian communications are weightedtoward Europe and Asia. We can also explore the flows oftransatlantic and US transcontinental communications.
5.4 Communication among countriesCommunication among people within different countries
also varies depending on the locations of conversants. Weexamine two such views. Figure 10(a) shows the top coun-tries by the number of conversations between pairs of coun-tries. We examined all pairs of countries with more than10 million conversations per month. The width of edges inthe figure is proportional to the logarithm of the number ofconversations among the countries. We find that the UnitedStates and Spain appear to serve as hubs and that edgesappear largely between historically or ethnically connectedcountries. As examples, Spain is connected with the Span-ish speaking countries in South America, Germany links toTurkey, Portugal to Brazil, and China to Korea.
Figure 10(b) displays a similar plot where we considercountry pairs by the average duration of conversations. The
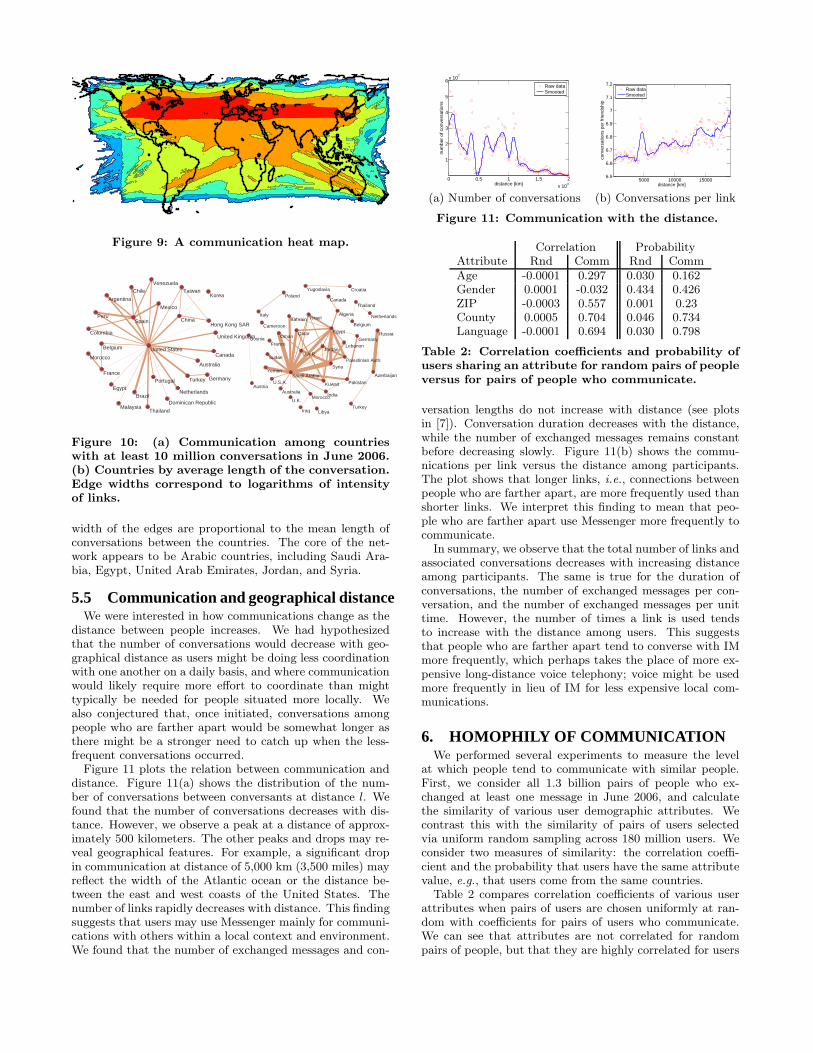
Figure 9: A communication heat map.
CanadaUnited States
United Kingdom
Venezuela
Argentina
Spain
Taiwan
ChinaHong Kong SAR
Brazil
Australia
France
Portugal Turkey
Chile
Dominican RepublicMalaysia
Peru
Belgium
Netherlands
Mexico
Egypt
Colombia
Thailand
Germany
Korea
Morocco
Saudi ArabiaU.S.A.
Egypt
U.A.R
U.K.
Pakistan
Oman
Cameroon
France
CroatiaYugoslavia
Syria
Jordan
Kuwait
India
Lebanon
Netherlands
Thailand
Belgium
Italy
Poland
Germany
Palestinian Auth.
Morocco
Austria
Bosnia
Algeria
Canada
Israel
Qatar
Australia
Sudan
Azerbaijan
Russia
Bahrain
TurkeyLibya
Yemen
Iraq
Figure 10: (a) Communication among countrieswith at least 10 million conversations in June 2006.(b) Countries by average length of the conversation.Edge widths correspond to logarithms of intensityof links.
width of the edges are proportional to the mean length ofconversations between the countries. The core of the net-work appears to be Arabic countries, including Saudi Ara-bia, Egypt, United Arab Emirates, Jordan, and Syria.
5.5 Communication and geographical distanceWe were interested in how communications change as the
distance between people increases. We had hypothesizedthat the number of conversations would decrease with geo-graphical distance as users might be doing less coordinationwith one another on a daily basis, and where communicationwould likely require more effort to coordinate than mighttypically be needed for people situated more locally. Wealso conjectured that, once initiated, conversations amongpeople who are farther apart would be somewhat longer asthere might be a stronger need to catch up when the less-frequent conversations occurred.
Figure 11 plots the relation between communication anddistance. Figure 11(a) shows the distribution of the num-ber of conversations between conversants at distance l. Wefound that the number of conversations decreases with dis-tance. However, we observe a peak at a distance of approx-imately 500 kilometers. The other peaks and drops may re-veal geographical features. For example, a significant dropin communication at distance of 5,000 km (3,500 miles) mayreflect the width of the Atlantic ocean or the distance be-tween the east and west coasts of the United States. Thenumber of links rapidly decreases with distance. This findingsuggests that users may use Messenger mainly for communi-cations with others within a local context and environment.We found that the number of exchanged messages and con-
0 0.5 1 1.5 2
x 104
1
2
3
4
5
6x 10
7
distance [km]
num
ber
of c
onve
rsat
ions
Raw dataSmooted
5000 10000 150006.5
6.6
6.7
6.8
6.9
7
7.1
7.2
distance [km]
conv
ersa
tions
per
frie
ndsh
ip
Raw dataSmooted
(a) Number of conversations (b) Conversations per link
Figure 11: Communication with the distance.
Correlation ProbabilityAttribute Rnd Comm Rnd CommAge -0.0001 0.297 0.030 0.162Gender 0.0001 -0.032 0.434 0.426ZIP -0.0003 0.557 0.001 0.23County 0.0005 0.704 0.046 0.734Language -0.0001 0.694 0.030 0.798
Table 2: Correlation coefficients and probability ofusers sharing an attribute for random pairs of peopleversus for pairs of people who communicate.
versation lengths do not increase with distance (see plotsin [7]). Conversation duration decreases with the distance,while the number of exchanged messages remains constantbefore decreasing slowly. Figure 11(b) shows the commu-nications per link versus the distance among participants.The plot shows that longer links, i.e., connections betweenpeople who are farther apart, are more frequently used thanshorter links. We interpret this finding to mean that peo-ple who are farther apart use Messenger more frequently tocommunicate.
In summary, we observe that the total number of links andassociated conversations decreases with increasing distanceamong participants. The same is true for the duration ofconversations, the number of exchanged messages per con-versation, and the number of exchanged messages per unittime. However, the number of times a link is used tendsto increase with the distance among users. This suggeststhat people who are farther apart tend to converse with IMmore frequently, which perhaps takes the place of more ex-pensive long-distance voice telephony; voice might be usedmore frequently in lieu of IM for less expensive local com-munications.
6. HOMOPHILY OF COMMUNICATIONWe performed several experiments to measure the level
at which people tend to communicate with similar people.First, we consider all 1.3 billion pairs of people who ex-changed at least one message in June 2006, and calculatethe similarity of various user demographic attributes. Wecontrast this with the similarity of pairs of users selectedvia uniform random sampling across 180 million users. Weconsider two measures of similarity: the correlation coeffi-cient and the probability that users have the same attributevalue, e.g., that users come from the same countries.
Table 2 compares correlation coefficients of various userattributes when pairs of users are chosen uniformly at ran-dom with coefficients for pairs of users who communicate.We can see that attributes are not correlated for randompairs of people, but that they are highly correlated for users
10 20 30 40 50 60 70 80
10
20
30
40
50
60
70
80
10 20 30 40 50 60 70 80
10
20
30
40
50
60
70
80
(a) Random (b) Communicate
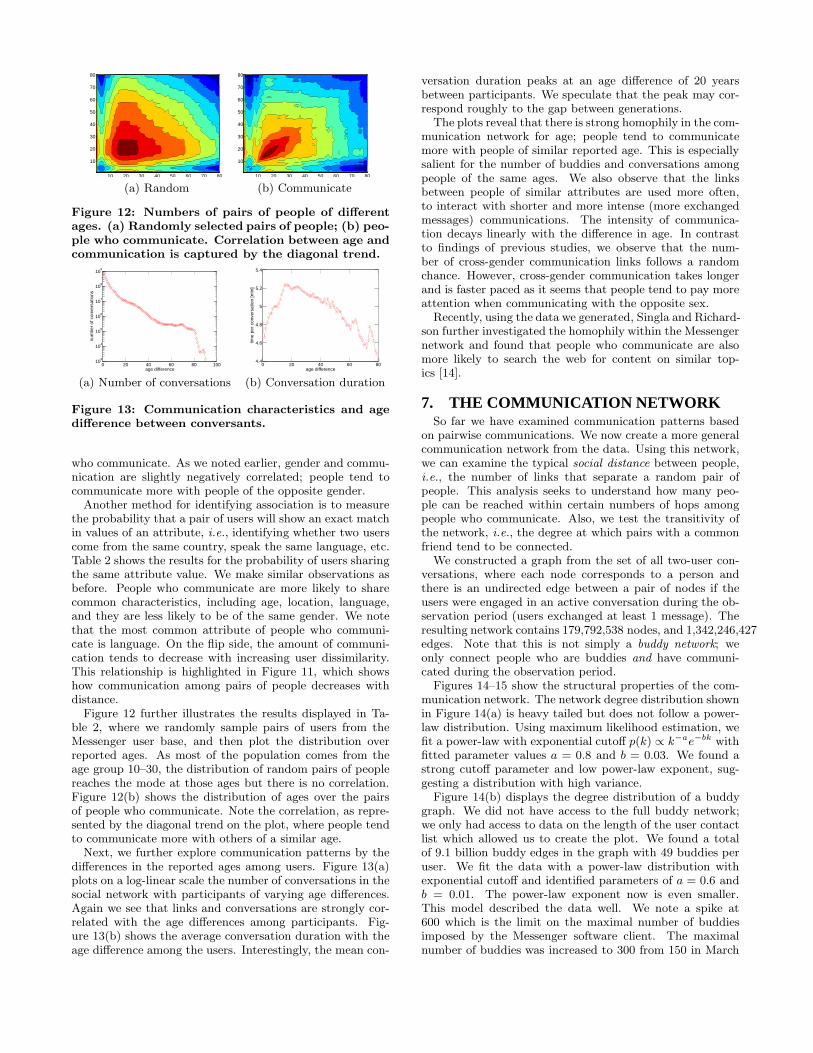
Figure 12: Numbers of pairs of people of differentages. (a) Randomly selected pairs of people; (b) peo-ple who communicate. Correlation between age andcommunication is captured by the diagonal trend.
0 20 40 60 80 10010
3
104
105
106
107
108
109
age difference
num
ber
of c
onve
rsat
ions
0 20 40 60 804.4
4.6
4.8
5
5.2
5.4
age difference
time
per
conv
ersa
tion
[min
]
(a) Number of conversations (b) Conversation duration
Figure 13: Communication characteristics and agedifference between conversants.
who communicate. As we noted earlier, gender and commu-nication are slightly negatively correlated; people tend tocommunicate more with people of the opposite gender.
Another method for identifying association is to measurethe probability that a pair of users will show an exact matchin values of an attribute, i.e., identifying whether two userscome from the same country, speak the same language, etc.Table 2 shows the results for the probability of users sharingthe same attribute value. We make similar observations asbefore. People who communicate are more likely to sharecommon characteristics, including age, location, language,and they are less likely to be of the same gender. We notethat the most common attribute of people who communi-cate is language. On the flip side, the amount of communi-cation tends to decrease with increasing user dissimilarity.This relationship is highlighted in Figure 11, which showshow communication among pairs of people decreases withdistance.
Figure 12 further illustrates the results displayed in Ta-ble 2, where we randomly sample pairs of users from theMessenger user base, and then plot the distribution overreported ages. As most of the population comes from theage group 10–30, the distribution of random pairs of peoplereaches the mode at those ages but there is no correlation.Figure 12(b) shows the distribution of ages over the pairsof people who communicate. Note the correlation, as repre-sented by the diagonal trend on the plot, where people tendto communicate more with others of a similar age.
Next, we further explore communication patterns by thedifferences in the reported ages among users. Figure 13(a)plots on a log-linear scale the number of conversations in thesocial network with participants of varying age differences.Again we see that links and conversations are strongly cor-related with the age differences among participants. Fig-ure 13(b) shows the average conversation duration with theage difference among the users. Interestingly, the mean con-
versation duration peaks at an age difference of 20 yearsbetween participants. We speculate that the peak may cor-respond roughly to the gap between generations.
The plots reveal that there is strong homophily in the com-munication network for age; people tend to communicatemore with people of similar reported age. This is especiallysalient for the number of buddies and conversations amongpeople of the same ages. We also observe that the linksbetween people of similar attributes are used more often,to interact with shorter and more intense (more exchangedmessages) communications. The intensity of communica-tion decays linearly with the difference in age. In contrastto findings of previous studies, we observe that the num-ber of cross-gender communication links follows a randomchance. However, cross-gender communication takes longerand is faster paced as it seems that people tend to pay moreattention when communicating with the opposite sex.
Recently, using the data we generated, Singla and Richard-son further investigated the homophily within the Messengernetwork and found that people who communicate are alsomore likely to search the web for content on similar top-ics [14].
7. THE COMMUNICATION NETWORKSo far we have examined communication patterns based
on pairwise communications. We now create a more generalcommunication network from the data. Using this network,we can examine the typical social distance between people,i.e., the number of links that separate a random pair ofpeople. This analysis seeks to understand how many peo-ple can be reached within certain numbers of hops amongpeople who communicate. Also, we test the transitivity ofthe network, i.e., the degree at which pairs with a commonfriend tend to be connected.
We constructed a graph from the set of all two-user con-versations, where each node corresponds to a person andthere is an undirected edge between a pair of nodes if theusers were engaged in an active conversation during the ob-servation period (users exchanged at least 1 message). Theresulting network contains 179,792,538 nodes, and 1,342,246,427edges. Note that this is not simply a buddy network; weonly connect people who are buddies and have communi-cated during the observation period.
Figures 14–15 show the structural properties of the com-munication network. The network degree distribution shownin Figure 14(a) is heavy tailed but does not follow a power-law distribution. Using maximum likelihood estimation, wefit a power-law with exponential cutoff p(k) ∝ k−ae−bk withfitted parameter values a = 0.8 and b = 0.03. We found astrong cutoff parameter and low power-law exponent, sug-gesting a distribution with high variance.
Figure 14(b) displays the degree distribution of a buddygraph. We did not have access to the full buddy network;we only had access to data on the length of the user contactlist which allowed us to create the plot. We found a totalof 9.1 billion buddy edges in the graph with 49 buddies peruser. We fit the data with a power-law distribution withexponential cutoff and identified parameters of a = 0.6 andb = 0.01. The power-law exponent now is even smaller.This model described the data well. We note a spike at600 which is the limit on the maximal number of buddiesimposed by the Messenger software client. The maximalnumber of buddies was increased to 300 from 150 in March

10-810-710-610-510-410-310-210-1100
100 101 102 103 104
p(k)
(pr
obab
ility
)
k (number of conversants)
∝ k-0.8 exp(-0.03⋅k)
10-8
10-7
10-6
10-5
10-4
10-3
10-2
10-1
100 101 102 103
p(b)
(P
roba
bilit
y)
b (Number of buddies)
∝ b-0.6 exp(-0.01⋅b)
(a) Communication (b) Buddies
Figure 14: (a) Degree distribution of communica-tion network (number of people with whom a per-son communicates). (b) Degree distribution of thebuddy network (length of the contact list).
10-3
10-2
10-1
100
101 102
c (C
lust
erin
g co
effic
ient
)
k (Degree)
c ∝ k-0.37
100
101
102
103
104
105
106
107
100 101 102 103 104 105 106 107 108 109
Cou
nt
Weakly connected component size
largest component(99.9% of the nodes)
(a) Clustering (b) Components
Figure 15: (a) Clustering coefficient; (b) distribu-tion of connected components. 99.9% of the nodesbelong to the largest connected component.
2005, and was later raised to 600. With the data from June2006, we see only the peak at 600, and could not identifybumps at the earlier constraints.
Social networks have been found to be highly transitive,i.e., people with common friends tend to be friends them-selves. The clustering coefficient [19] has been used as ameasure of transitivity in the network. The measure is de-fined as the fraction of triangles around a node of degreek [19]. Figure 15(a) displays the clustering coefficient ver-sus the degree of a node for Messenger. Previous resultson measuring the web graph as well as theoretical analysesshow that the clustering coefficient decays as k−1 (exponent−1) with node degree k [11]. For the Messenger network,the clustering coefficient decays very slowly with exponent−0.37 with the degree of a node and the average clusteringcoefficient is 0.137. This result suggests that clustering inthe Messenger network is much higher than expected—thatpeople with common friends also tend to be connected. Fig-ure 15(b) displays the distribution of the connected compo-nents in the network. The giant component contains 99.9%of the nodes in the network against a background of smallcomponents, and the distribution follows a power law.
7.1 How small is the small world?Messenger data gives us a unique opportunity to study
distances in the social network. To our knowledge, this is thefirst time a planetary-scale social network has been availableto validate the well-known “6 degrees of separation” findingby Travers and Milgram [17]. The earlier work employeda sample of 64 people and found that the average numberof hops for a letter to travel from Nebraska to Boston was6.2 (mode 5, median 5), which is popularly known as the “6degrees of separation” among people. We used a populationsample that is more than two million times larger than thegroup studied earlier and confirmed the classic finding.
10-12
10-10
10-8
10-6
10-4
10-2
100
0 5 10 15 20 25 30
p(l)
(Pro
babi
lity)
l, (Path length in hops)
101102103104105106107108109
100 101 102
Num
ber
of n
odes
Core of order K
k=20
k=60-68, n=79
(a) Diameter (b) k-cores
Figure 16: (a) Distribution over the shortest pathlengths. Average shortest path has length 6.6, thedistribution reaches the mode at 6 hops, and the90% effective diameter is 7.8; (b) distribution ofsizes of cores of order k.
Figure 16(a) displays the distribution over the shortestpath lengths. To approximate the distribution of the dis-tances, we randomly sampled 1000 nodes and calculated foreach node the shortest paths to all other nodes. We foundthat the distribution of path lengths reaches the mode at6 hops and has a median at 7. The average path length is6.6. This result means that a random pair of nodes in theMessenger network is 6.6 hops apart on the average, which ishalf a link longer than the length measured by Travers andMilgram. The 90th percentile (effective diameter [16]) of thedistribution is 7.8. 48% of nodes can be reached within 6hops and 78% within 7 hops. So, we might say that, via thelens provided on the world by Messenger, we find that thereare about “7 degrees of separation” among people. We notethat long paths, i.e., nodes that are far apart, exist in thenetwork; we found paths up to a length of 29.
7.2 Network coresWe further study connectivity of the communication net-
work by examining the k-cores [5] of the graph. The conceptof k-core is a generalization of the giant connected compo-nent. The k-core of a network is a set of vertices K, whereeach vertex in K has at least k edges to other vertices inK. The distribution of k-core sizes gives us an idea of howquickly the network shrinks as we move towards the core.
The k-core of a graph can be obtained by deleting fromthe network all vertices of degree less than k. This processwill decrease degrees of some non-deleted vertices, so morevertices will have degree less than k. We keep pruning ver-tices until all remaining vertices have degree of at least k.We call the remaining vertices a k-core.
Figure 16 plots the number of nodes in a core of orderk. We note that the core sizes are remarkably stable up toa value of k ≈ 20; the number of nodes in the core dropsfor only an order of magnitude. After k > 20, the coresize rapidly drops. The central part of the communicationnetwork is composed of 79 nodes, where each of them hasmore than 68 edges inside the set. The structure of theMessenger communication network is quite different fromthe Internet graph; it has been observed [2] that the size ofa k-core of the Internet decays as a power-law with k. Herewe see that the core sizes remains very stable up to a degree≈ 20, and only then start to rapidly degrease. This meansthat the nodes with degrees of less than 20 are on the fringeof the network, and that the core starts to rapidly decreaseas nodes of degree 20 or more are deleted.

7.3 Strength of the tiesIt has been observed by Albert et al. [1] that many real-
world networks are robust to node-level changes or attacks.Researchers have showed that networks like the World WideWeb, Internet, and several social networks display a highdegree of robustness to random node removals, i.e., one hasto remove many nodes chosen uniformly at random to makethe network disconnected. On the contrary, targeted attacksare very effective. Removing a few high degree nodes canhave a dramatic influence on the connectivity of a network.
Let us now study how the Messenger communication net-work is decomposed when “strong,” i.e., heavily used, edgesare removed from the network. We consider several differentdefinitions of “heavily used,” and measure the types of edgesthat are most important for network connectivity. We notethat a similar experiment was performed by Shi et al [13]in the context of a small IM buddy network. The authorsof the prior study took the number of common friends atthe ends of an edge as a measure of the link strength. Asthe number of edges here is too large (1.3 billion) to removeedges one by one, we employed the following procedure: Weorder the nodes by decreasing value per a measure of theintensity of engagement of users; we then delete nodes as-sociated with users in order of decreasing measure and weobserve the evolution of the properties of the communicationnetwork as nodes are deleted.
We consider the following different measures of engage-ment:
• Average sent: The average number of sent messagesper user’s conversation
• Average time: The average duration of user’s conver-sations
• Links: The number of links of a user (node degree),i.e., number of different people he or she exchangedmessages with
• Conversations: The total number of conversations of auser in the observation period
• Sent messages: The total number of sent messages bya user in the observation period
• Sent per unit time: The number of sent messages perunit time of a conversation
• Total time: The total conversation time of a user inthe observation period
At each step of the experiment, we remove 10 millionnodes in order of the specific measure of engagement beingstudied. We then determine the relative size of the largestconnected component, i.e., given the network at particu-lar step, we find the fraction of the nodes belonging to thelargest connected component of the network.
Figure 17 plots the evolution of the fraction of nodes inthe largest connected component with the number of deletednodes. We plot a separate curve for each of the seven dif-ferent measures of engagement. For comparison, we alsoconsider the random deletion of the nodes.
The decomposition procedure highlighted two types of dy-namics of network change with node removal. The size of thelargest component decreases rapidly when we use as mea-sures of engagement the number of links, number of conver-sations, total conversation time, or number of sent messages.In contrast, the size of the largest component decreases veryslowly when we use as a measure of engagement the average
0 2 4 6 8 10 12 14 16
x 107
0
0.1
0.2
0.3
0.4
0.5
0.6
0.7
0.8
0.9
1
Deleted nodes
Com
pone
nt s
ize
Avg. sentAvg. timeLinksConversationsSent messagesSent per unit timeTotal timeRandom
Figure 17: Relative size of the largest connectedcomponent as a function of number of nodes re-moved.
0 2 4 6 8 10 12 14 16
x 107
0
2
4
6
8
10
12
14x 10
8
Deleted nodes
Del
eted
edg
esAvg. sentAvg. timeLinksConversationsSent messagesSent per unit timeTotal timeRandom
Figure 18: Number of removed edges as nodes aredeleted by order of different measures of engage-ment.
time per conversation, average number of sent messages, ornumber of sent messages per unit time. We were not sur-prised to find that the size of the largest component size de-creases most rapidly when nodes are deleted in order of thedecreasing number of links that they have, i.e., the numberof people with whom a user at a node communicates. Ran-dom ordering of the nodes shrinks the component at theslowest rate. After removing 160 million out of 180 millionnodes with the random policy, the largest component stillcontains about half of the nodes. Surprisingly, when deletingup to 100 million nodes, the average time per conversationmeasure shrinks the component even more slowly than therandom deletion policy.
Figure 18 displays plots of the number of removed edgesfrom the network as nodes are deleted. Similar to the rela-tionships in Figure 17, we found that deleting nodes by theinverse number of edges removes edges the fastest. As inFigure 18, the same group of node ordering criteria (num-ber of conversations, total conversation time or number ofsent messages) removes edges from the networks as fast asthe number of links criteria. However, we find that ran-dom node removal removes edges in a linear manner. Edgesare removed at a lower rate when deleting nodes by aver-age time per conversation, average numbers of sent mes-sages, or numbers of sent messages per unit time. We be-

lieve that these findings demonstrate that users with longconversations and many messages per conversation tend tohave smaller degrees—even given the findings displayed inFigure 17, where we saw that removing these users is moreeffective for breaking the connectivity of the network thanfor random node deletion. Figure 18 also shows that usingthe average number of messages per conversation as a crite-rion removes edges in the slowest manner. We believe thatthis makes sense intuitively: If users invest similar amountsof time to interacting with others, then people with shortconversations will tend to converse with more people in agiven amount of time than users having long conversations.
8. CONCLUSIONWe have reviewed a set of results stemming from the gen-
eration and analysis of an anonymized dataset representingthe communication patterns of all people using a popularIM system. The methods and findings highlight the value ofusing a large IM network as a worldwide lens onto aggregatehuman behavior.
We described the creation of the dataset, capturing high-level communication activities and demographics in June2006. The core dataset contains more than 30 billion conver-sations among 240 million people. We discussed the creationand analysis of a communication graph from the data con-taining 180 million nodes and 1.3 billion edges. The commu-nication network is largest social network analyzed to date.The planetary-scale network allowed us to explore dependen-cies among user demographics, communication characteris-tics, and network structure. Working with such a massivedataset allowed us to test hypotheses such as the averagechain of separation among people across the entire world.
We discovered that the graph is well connected, highlytransitive, and robust. We reviewed the influence of multi-ple factors on communication frequency and duration. Wefound strong influences of homophily in activities, wherepeople with similar characteristics tend to communicate more,with the exception of gender, where we found that cross-gender conversations are both more frequent and of longerduration than conversations with users of the same reportedgender. We also examined the path lengths and validatedon a planetary scale earlier research that found “6 degreesof separation” among people.
We note that the sheer size of the data limits the kindsof analyses one can perform. In some cases, a smaller ran-dom sample may avoid the challenges with working withterabytes of data. However, it is known that sampling cancorrupt the structural properties of networks, such as the de-gree distribution and the diameter of the graphs [15]. Thus,while sampling may be valuable for managing complexityof analyses, results on network properties with partial datasets may be rendered unreliable. Furthermore, we need toconsider the full data set to reliably measure the patterns ofage and distance homophily in communications.
In other directions of research with the dataset, we havepursued the use of machine learning and inference to learnpredictive models that can forecast such properties as com-munication frequencies and durations of conversations amongpeople as a function of the structural and demographic at-tributes of conversants. Our future directions for researchinclude gaining an understanding of the dynamics of thestructure of the communication network via a study of theevolution of the network over time.
We hope that our studies with Messenger data serves asan example of directions in social science research, highlight-ing how communication systems can provide insights abouthigh-level patterns and relationships in human communica-tions without making incursions into the privacy of individ-uals. We hope that this first effort to understand a socialnetwork on a genuinely planetary scale will embolden othersto explore human behavior at large scales.
AcknowledgmentsWe thank Dan Liebling for help with generated world mapplots, and Dimitris Achlioptas and Susan Dumais for helpfulsuggestions.
9. REFERENCES[1] R. Albert, H. Jeong, and A.-L. Barabasi. Error and
attack tolerance of complex networks. Nature, 406:378,2000.
[2] J. I. Alvarez-Hamelin, L. Dall’Asta, A. Barrat, andA. Vespignani. Analysis and visualization of large scalenetworks using the k-core decomposition. In ECCS’05: European Conference on Complex Systems, 2005.
[3] D. Avrahami and S. E. Hudson. Communicationcharacteristics of instant messaging: effects andpredictions of interpersonal relationships. In CSCW’06, pages 505–514, 2006.
[4] A.-L. Barabasi. The origin of bursts and heavy tails inhuman dynamics. Nature, 435:207, 2005.
[5] V. Batagelj and M. Zaversnik. Generalized cores.ArXiv, (cs.DS/0202039), Feb 2002.
[6] IDC Market Analysis. Worldwide Enterprise InstantMessaging Applications 2005–2009 Forecast and 2004Vendor Shares: Clearing the Decks for SubstantialGrowth. 2005.
[7] J. Leskovec and E. Horvitz. Worldwide Buzz:Planetary-Scale Views on an Instant-MessagingNetwork. Tech. report MSR-TR-2006-186, 2006.
[8] P. V. Marsden. Core discussion networks of americans.American Sociological Review, 52(1):122–131, 1987.
[9] M. McPherson, L. Smith-Lovin, and J. M. Cook.Birds of a feather: Homophily in social networks.Annual Review of Sociology, 27(1):415–444, 2001.
[10] B. A. Nardi, S. Whittaker, and E. Bradner.Interaction and outeraction: instant messaging inaction. In CSCW ’00: Proceedings of the 2000 ACMconference on Computer supported cooperative work,pages 79–88, 2000.
[11] E. Ravasz and A.-L. Barabasi. Hierarchicalorganization in complex networks. Physical Review E,67(2):026112, 2003.
[12] E. M. Rogers and D. K. Bhowmik.Homophily-heterophily: Relational concepts forcommunication research. Public Opinion Quarterly,34:523–538, 1970.
[13] X. Shi, L. A. Adamic, and M. J. Strauss. Networks ofstrong ties. Physica A Statistical Mechanics and itsApplications, 378:33–47, May 2007.
[14] P. Singla and M. Richardson. Yes, there is acorrelation - from social networks to personal behavioron the web. In WWW ’08, 2008.
[15] M. P. Stumpf, C. Wiuf, R. M. May. Subnets ofscale-free networks are not scale-free: samplingproperties of networks. PNAS, 102(12), 2005.
[16] S. L. Tauro, C. Palmer, G. Siganos, and M. Faloutsos.A simple conceptual model for the internet topology.In GLOBECOM ’01, vol. 3, pages 1667 – 1671, 2001.
[17] J. Travers and S. Milgram. An experimental study ofthe small world problem. Sociometry, 32(4), 1969.
[18] A. Voida, W. C. Newstetter, and E. D. Mynatt. Whenconventions collide: the tensions of instant messagingattributed. In CHI ’02, pages 187–194, 2002.
[19] D. J. Watts and S. H. Strogatz. Collective dynamics of’small-world’ networks. Nature, 393:440–442, 1998.
[20] Z. Xiao, L. Guo, and J. Tracey. Understanding instantmessaging traffic characteristics. In ICDCS ’07, 2007.