planned energy-efficient retrofitting of a residential ... · technical article open access planned...
TRANSCRIPT

Zanchini et al. Future Cities and Environment (2015) 1:3 DOI 10.1186/s40984-015-0004-9
TECHNICAL ARTICLE Open Access
Planned energy-efficient retrofitting of aresidential building in Italy
Enzo Zanchini1*, Claudia Naldi1, Stefano Lazzari2 and Gian Luca Morini1Abstract
The planned energy-efficient retrofitting of a residential building in Bologna, North-Center Italy is presented. Thebuilding is a detached house with an unheated basement, three floors with 2 apartments each, and an unheatedattic. The total heated floor area is 281.9 m2. The external wall is made of solid brick masonry and most windowsare single glazed; no thermal insulation is present. Space heating is supplied by a gas boiler and radiators in therooms. DHW is supplied by single-apartment electric boilers in 5 apartments and by a gas boiler in one apartment.Lighting is obtained by incandescent lamps.The proposed retrofitting includes: external thermal insulation of the vertical walls by calcium silicate hydrates andloft insulation by mineral wool; replacement of windows; installation of a multifunction air-to-water heat pump forheating, cooling and DHW; replacement of the radiators by new heat exchangers; LED lighting; installation of PVpanels. The building has been simulated by TRNSYS 17, and the heat pump has been simulated by own MATLABcodes. The retrofitting will reduce the total annual use of primary energy (excluding appliances) from 332.5 to 44.8kWh/m2, and will yield an important improvement of thermal comfort.
Keywords: Energy retrofitting; Residential building; Multifunction heat pump; PV panels; Hourly simulation
IntroductionThe economic growth of the 20th century has beenbased on a progressive increase of the world annual useof fossil fuels. The world annual use of primary energy isstill increasing, and fossil fuels represent even now themost important source of primary energy, as shown inFig. 1, which illustrates the world annual use of primaryenergy by source from 1980 to 2011, according to EIA(US Energy Information Administration) (http://www.eia.gov/cfapps/ipdbproject/IEDIndex3.cfm#). In 2011, 86 % ofthe world primary energy use is due to oil, carbon andgas. The fossil-fuel-based development has caused two im-portant problems: the reserves of oil and natural gas aredecreasing and the emission of carbon dioxide and ofother greenhouse gases is causing a climate change(https://www.ipcc.ch/report/ar5/wg1/). As a consequence,all the industrialized and developing countries and, mostof all, the European Union, are struggling to shift the eco-nomic growth towards a sustainable development, based
* Correspondence: [email protected] of Industrial Engineering, University of Bologna, VialeRisorgimento 2, 40136 Bologna, ItalyFull list of author information is available at the end of the article
© 2015 Zanchini et al. This is an Open Access a(http://creativecommons.org/licenses/by/4.0), wprovided the original work is properly credited
on two main pillars: the increase of energy efficiency andthe use of renewable energy sources. The energy policy ofthe European Union already obtained some success: theannual use of primary energy of the Union is slightly de-creasing from 2006, as shown in Fig. 2. The figureillustrates the use of primary energy of the EuropeanUnion by sector from 1990 to 2012, according to Eurostat(European Commission portal for statistics) (http://ec.eur-opa.eu/eurostat/data/database); it reveals that the fractionsof energy use in the residential sector and in the servicesector are quite relevant. The fractions of primary-energyuse in sectors for 2012 are better evidenced in Fig. 3,where it is shown that the sum of the fractions which referto the residential sector and to the service sector, i.e., thetotal fraction due mainly to building operation, is 39.7 %.As a consequence, an important step towards the reduc-tion of the use of fossil fuels in Europe would be the en-hancement of the energy efficiency of buildings.According to an official document of the European Com-
mission (http://www.ectp.org/cws/params/ectp/download_files/36D2981v1_Eeb_cPPP_Roadmap_under.pdf), buildingsuse 40 % of the total EU energy consumption and generate
rticle distributed under the terms of the Creative Commons Attribution Licensehich permits unrestricted use, distribution, and reproduction in any medium,.

Fig. 1 World annual use of primary energy by source from 1980 to 2011, according to EIA
Zanchini et al. Future Cities and Environment (2015) 1:3 Page 2 of 19
36 % of greenhouse gases in Europe. The construction sec-tor is expected to reduce its CO2 emissions by at least 80 %and its energy consumption by as much as 50 % by 2050.Since the replacement rate of the existing stock is very small(1–2 % per year), the energy retrofitting of existing buildingsshould play an important role to reach this goal.A wide research activity on the techniques for energy
retrofitting of buildings has been performed in the lastdecades. Some studies have concerned the optimizationof thermal insulation (Ucar and Balo 2009; Yu et al.
Fig. 2 Annual use of primary energy by sector in Europe, from 1990 to 201
2009; Daouas 2011; Cuce et al. 2014), others the im-provement of the plant efficiency (Bizzarri and Morini2006; Zhao et al. 2008, 2009; Chan et al. 2010; Terlizzeseand Zanchini 2011; Brignoli et al. 2013; Liu et al. 2013;Naldi et al. 2014), others the energy-saving potential(Balaras et al. 2000; Amstalden et al. 2007; Ascione et al.2011; Chidiac et al. 2011a, b; Dall’O’ and Sarto 2013;Shahrokni et al. 2014), others again the effects of solarchimneys, permeable coverings, cool roofs and greenroofs (Afonso and Oliveira 2000; Orosa and Oliveira
2, according to Eurostat
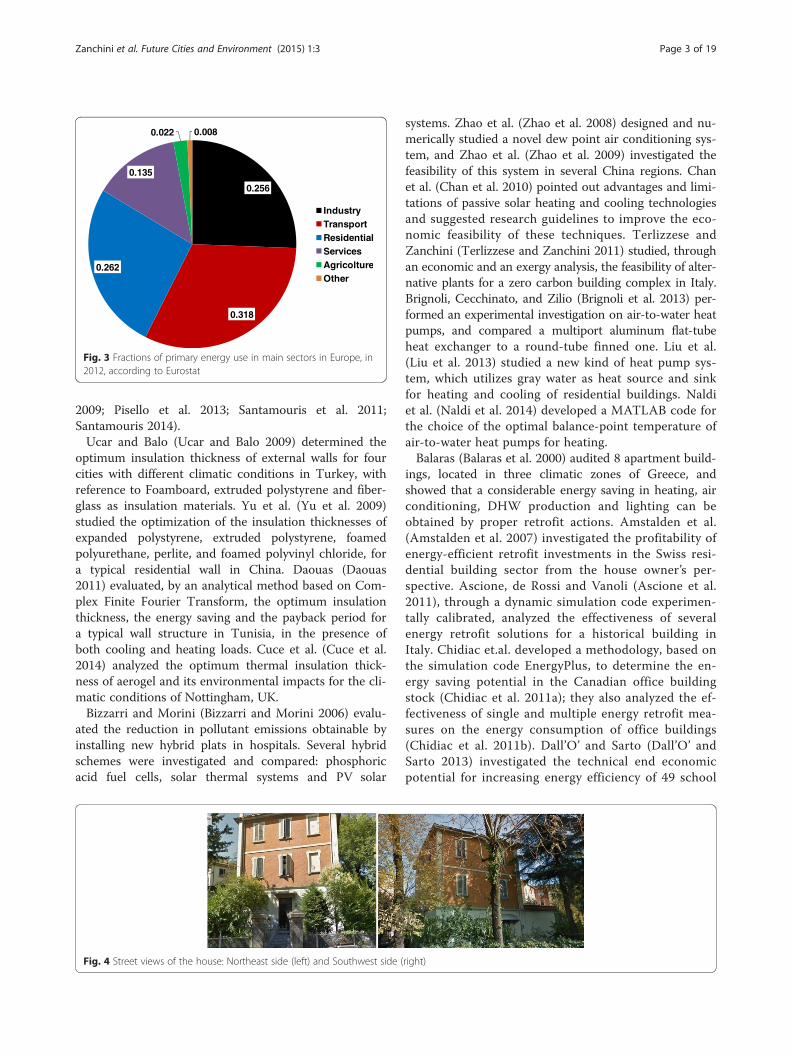
Fig. 3 Fractions of primary energy use in main sectors in Europe, in2012, according to Eurostat
Zanchini et al. Future Cities and Environment (2015) 1:3 Page 3 of 19
2009; Pisello et al. 2013; Santamouris et al. 2011;Santamouris 2014).Ucar and Balo (Ucar and Balo 2009) determined the
optimum insulation thickness of external walls for fourcities with different climatic conditions in Turkey, withreference to Foamboard, extruded polystyrene and fiber-glass as insulation materials. Yu et al. (Yu et al. 2009)studied the optimization of the insulation thicknesses ofexpanded polystyrene, extruded polystyrene, foamedpolyurethane, perlite, and foamed polyvinyl chloride, fora typical residential wall in China. Daouas (Daouas2011) evaluated, by an analytical method based on Com-plex Finite Fourier Transform, the optimum insulationthickness, the energy saving and the payback period fora typical wall structure in Tunisia, in the presence ofboth cooling and heating loads. Cuce et al. (Cuce et al.2014) analyzed the optimum thermal insulation thick-ness of aerogel and its environmental impacts for the cli-matic conditions of Nottingham, UK.Bizzarri and Morini (Bizzarri and Morini 2006) evalu-
ated the reduction in pollutant emissions obtainable byinstalling new hybrid plats in hospitals. Several hybridschemes were investigated and compared: phosphoricacid fuel cells, solar thermal systems and PV solar
Fig. 4 Street views of the house: Northeast side (left) and Southwest side (
systems. Zhao et al. (Zhao et al. 2008) designed and nu-merically studied a novel dew point air conditioning sys-tem, and Zhao et al. (Zhao et al. 2009) investigated thefeasibility of this system in several China regions. Chanet al. (Chan et al. 2010) pointed out advantages and limi-tations of passive solar heating and cooling technologiesand suggested research guidelines to improve the eco-nomic feasibility of these techniques. Terlizzese andZanchini (Terlizzese and Zanchini 2011) studied, throughan economic and an exergy analysis, the feasibility of alter-native plants for a zero carbon building complex in Italy.Brignoli, Cecchinato, and Zilio (Brignoli et al. 2013) per-formed an experimental investigation on air-to-water heatpumps, and compared a multiport aluminum flat-tubeheat exchanger to a round-tube finned one. Liu et al.(Liu et al. 2013) studied a new kind of heat pump sys-tem, which utilizes gray water as heat source and sinkfor heating and cooling of residential buildings. Naldiet al. (Naldi et al. 2014) developed a MATLAB code forthe choice of the optimal balance-point temperature ofair-to-water heat pumps for heating.Balaras (Balaras et al. 2000) audited 8 apartment build-
ings, located in three climatic zones of Greece, andshowed that a considerable energy saving in heating, airconditioning, DHW production and lighting can beobtained by proper retrofit actions. Amstalden et al.(Amstalden et al. 2007) investigated the profitability ofenergy-efficient retrofit investments in the Swiss resi-dential building sector from the house owner’s per-spective. Ascione, de Rossi and Vanoli (Ascione et al.2011), through a dynamic simulation code experimen-tally calibrated, analyzed the effectiveness of severalenergy retrofit solutions for a historical building inItaly. Chidiac et.al. developed a methodology, based onthe simulation code EnergyPlus, to determine the en-ergy saving potential in the Canadian office buildingstock (Chidiac et al. 2011a); they also analyzed the ef-fectiveness of single and multiple energy retrofit mea-sures on the energy consumption of office buildings(Chidiac et al. 2011b). Dall’O’ and Sarto (Dall’O’ andSarto 2013) investigated the technical end economicpotential for increasing energy efficiency of 49 school
right)
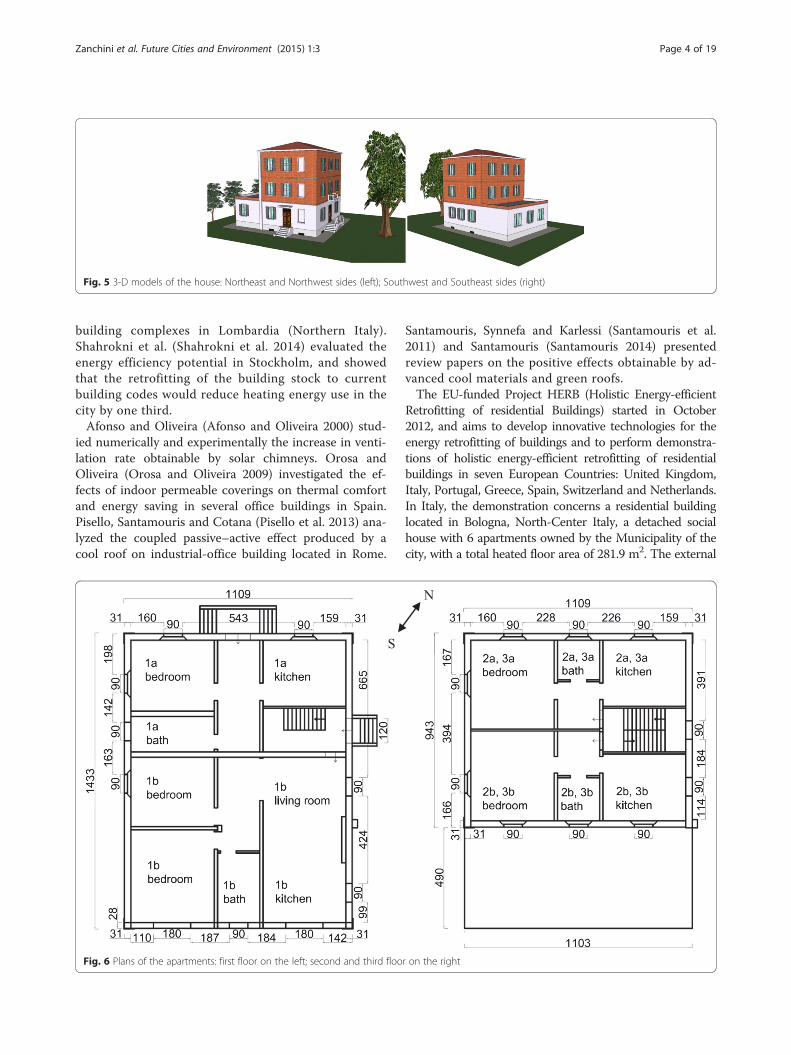
Fig. 5 3-D models of the house: Northeast and Northwest sides (left); Southwest and Southeast sides (right)
Zanchini et al. Future Cities and Environment (2015) 1:3 Page 4 of 19
building complexes in Lombardia (Northern Italy).Shahrokni et al. (Shahrokni et al. 2014) evaluated theenergy efficiency potential in Stockholm, and showedthat the retrofitting of the building stock to currentbuilding codes would reduce heating energy use in thecity by one third.Afonso and Oliveira (Afonso and Oliveira 2000) stud-
ied numerically and experimentally the increase in venti-lation rate obtainable by solar chimneys. Orosa andOliveira (Orosa and Oliveira 2009) investigated the ef-fects of indoor permeable coverings on thermal comfortand energy saving in several office buildings in Spain.Pisello, Santamouris and Cotana (Pisello et al. 2013) ana-lyzed the coupled passive–active effect produced by acool roof on industrial-office building located in Rome.
Fig. 6 Plans of the apartments: first floor on the left; second and third floo
Santamouris, Synnefa and Karlessi (Santamouris et al.2011) and Santamouris (Santamouris 2014) presentedreview papers on the positive effects obtainable by ad-vanced cool materials and green roofs.The EU-funded Project HERB (Holistic Energy-efficient
Retrofitting of residential Buildings) started in October2012, and aims to develop innovative technologies for theenergy retrofitting of buildings and to perform demonstra-tions of holistic energy-efficient retrofitting of residentialbuildings in seven European Countries: United Kingdom,Italy, Portugal, Greece, Spain, Switzerland and Netherlands.In Italy, the demonstration concerns a residential buildinglocated in Bologna, North-Center Italy, a detached socialhouse with 6 apartments owned by the Municipality of thecity, with a total heated floor area of 281.9 m2. The external
r on the right

Table 1 Main properties of the opaque enclosure elements, inthe present state
Element Description s[m]
U [W/(m2K)]
Vertical wall Internal plaster, solid brick masonry,external plaster
0.31 1.797
Floor onbasement
Tiles, subfloor, floor brick and concrete,plaster
0.26 1.476
Floor onground
Tiles, subfloor, floor brick and concrete 0.25 1.845
Terrace floor Plaster, floor brick and concrete,subfloor, tiles
0.26 1.476
Loft floor Internal plaster, floor brick andconcrete
0.09 2.903
Roof Internal plaster, floor brick andconcrete
0.21 2.279
Zanchini et al. Future Cities and Environment (2015) 1:3 Page 5 of 19
wall is made of solid bricks and is uninsulated; mostwindows are single glazed. Space heating is supplied bymeans of a gas boiler and radiators in the rooms, whileDHW is supplied by single-apartment electric boilersin 5 apartments and by a gas boiler in one apartment.Lighting is obtained by incandescent lamps. With refer-ence to the TRNSYS typical meteorological year, theannual use of primary energy for heating, DHW andlighting is 332.5 kWh/m2 and the annual emission ofCO2 is 92.5 kg/m2. The efficiency targets of the retrofit-ting, prescribed in the HERB DoW, are a reduction of atleast 80 % in the use of primary energy, a reduction of atleast 60 % in the CO2 emission, an annual use of primaryenergy less than 50 kWh/m2, excluding appliances. Theproposed retrofitting includes: external thermal insulationof the vertical walls by a 16 cm layer of calcium silicate hy-drates; insulation of loft and floors towards unheated orexternal spaces by mineral wool; replacement of windows;installation of a multifunction air-to-water heat pump forheating, cooling and DHW; replacement of the radiatorsby high-efficient fan coils and low temperature radiators;LED lighting; installation of PV panels on the Southeastand the Northeast pitches of the roof. The followingefficiency targets are expected to be reached: 86.5 %reduction of the use of primary energy, 86.3 % reduction ofCO2 emission, annual use of primary energy equal to 44.8kWh/m2, including summer cooling and dehumidifying,presently unavailable.
Table 2 Monthly mean values of temperature and relative humidity(second and fourth row)
Month Jan Feb March April May Jun
Te [°C] 1.7 4.3 9.4 13.8 20.2 21.
Te [°C] 2.1 4.6 9.4 14.2 18.2 22.
φ 0.82 0.78 0.71 0.73 0.71 0.
φ 0.89 0.87 0.72 0.67 0.68 0.
Description of the building and climatic dataThe demonstration house is located in an area very closeto the center of Bologna, main city of the region Emilia-Romagna, North-Center Italy. It is composed of threefloors, with 2 apartments each, an unheated attic, and anunheated basement which contains the boiler room. Theroof has 4 pitches, with orientations Southeast, Southwest,Northeast and Northwest. The first floor is larger thanthe second and the third, which are identical. Thehouse has a small garden, with high trees. Street viewsof the Northeast and of the Southwest side of the houseare reported in Fig. 4; 3-D models of the house, whichillustrate the Northeast and Northwest sides and theSouthwest and Southeast sides, are reported in Fig. 5.In the 3-D models, most trees have been hidden.Apartments have been numbered as follows: Apart-
ments 1a and 1b at the first floor; Apartments 2a and 2bat the second floor; Apartments 3a and 3b at the thirdfloor. Apartments with letter a are facing Northwest;those with letter b are facing Southeast. The first floor islarger than the second and the third. One of the apart-ments at the first floor (Apartment 1b) has, as a part ofthe roof, an inaccessible plane terrace. The second andthe third floor are identical. Plans of the apartments arereported in Fig. 6: the first floor is represented on theleft, the second and the third floor (which are identical)are represented on the right. The rectangle which ap-pears in the lower part of the figure at right representsthe inaccessible terrace which forms a plane roof for apart of Apartment 1b. The heated floor areas of theapartments are as follows: Apartment 1a: 44.7 m2;Apartment 1b: 80.2 m2; Apartments 2a and 3a: 39.2 m2;Apartments 2b and 3b: 39.3 m2. The total heated floorarea is 281.9 m2.The external wall, made of solid brick masonry, is
31 cm thick and uninsulated. Most windows are singleglazed, with wood frame, except those of Apartments 2band 3b, which are double glazed with aluminum frame.The internal height of each floor is 3.36 m, and the floorthickness is 0.27 m. The unheated basement is placedunder Apartment 1a and under about one third ofApartment 1b. The rest of Apartment 1b is on theground. No thermal insulation is placed between thefirst floor and the basement, or the ground, as well asbetween Apartment 1b and the terrace. The unheated
in Bologna, TRNSYS (first and third row) and UNI 10349
e July Aug Sept Oct Nov Dec
5 24.4 24.1 20.9 14.4 8.4 3.9
9 25.4 24.9 21.2 14.9 8.7 4
70 0.66 0.68 0.71 0.75 0.83 0.82
65 0.57 0.60 0.64 0.74 0.85 0.86

Fig. 7 Mean monthly values of direct and diffuse radiation on a horizontal surface, per day
Zanchini et al. Future Cities and Environment (2015) 1:3 Page 6 of 19
loft is non ventilated and uninsulated; its lowest heightis 0.20 m (at the sides), and its highest height is 1.60 m(at the center). It has a very small window, which isclosed.Space heating is supplied by means of a gas boiler,
placed in the basement, and radiators in the rooms, underwindows. The gas boiler is a modulating one, installed in2007; it has a nominal power of 62 kW, a certified effi-ciency equal to 0.93 at nominal power and slightly higherat reduced power. A constant efficiency equal to 0.93 hasbeen considered. The distribution, emission and controlefficiencies of the heating system can be assumed as equalto 0.90, 0.95 and 0.97 respectively, according to the na-tional standard UNI TS 11300–2. Thus, the overall effi-ciency of the heating system is 0.771.DHW is supplied by single apartment boilers: electric
boilers in Apartments 1a, 2a, 2b, 3a, 3b; a gas boiler in
Table 3 Main properties of the retrofitted enclosure elements
Element Description s [m] U [W/(m2K)]
Vertical wall Internal plaster, solid brick masonry,external plaster, hydrate calciumsilicates 16 cm
0.47 0.243
Floor onbasement
Tiles, subfloor, floor brick and concrete,plaster, mineral wool 9.5 cm
0.355 0.274
Terracefloor
Plaster, floor brick and concrete,subfloor, tiles, mineral wool 14 cm
0.40 0.224
Loft floor Internal plaster, floor brickand concrete, mineral wool 20 cm
0.29 0.187
Apartment 1b. No summer air conditioning is present.All rooms, including bathrooms, have windows.The main properties of the opaque enclosure elements
in the present state (decription, thickness s, transmit-tance U), are summarized in Table 1; for each element,the description starts from the internal (heated) space.Heat transfer coefficients have been determined by con-sidering standard thermal conductivities of the materialsemployed, without final roundations: there is no claim ofaccuracy in the last decimal places.Bologna is located in the center of the region Emilia
Romagna, at the border between the Padana flat andthe foot of the mountains Appennino Tosco-Emiliano.The mean altitude is 54 m above sea level, the latitudeis 44° 29’ North, the longitude is 11° 20’ East. Sincethe dynamic simulations of the building are performedthrough TRNSYS 17, the typical meteorological year(TMY) for Bologna available in that program is employed.The mean monthly values of the external air temperatureTe obtained from the TRNSYS TMY, listed in the first rowof Table 2, are slightly lower than those reported in theNational Standard UNI 10349, which are listed in thesecond row of Table 2. The values of the monthly meanrelative humidity according to TRNSYS TMY are re-ported in the third row of Table 2, and those accordingto UNI 10349 are reported in the fourth row. The averagewind speed, according to UNI 10349, is 1.6 m/s, with maindirection Southwest. The mean monthly values of thebeam radiation Hb and of the diffuse radiation Hd on ahoriontal surface according to UNI 10349, in MJ/m2 perday, are illustrated in Fig. 7.

Table 4 Heating power of the heat pump, kW, with hot waterdelivered at 40 °C
Frequency [Hz]
Te [°C] 110 90 70 50 30
−7 7.63 6.01 4.53 3.15 1.89
2 9.99 7.91 6.01 4.19 2.51
7 11.70 9.14 6.95 4.90 2.93
12 13.50 10.60 8.09 5.66 3.41
Table 6 COP of heat pump for DHW production at 50 °C andevaporator in external air
Frequency [Hz]
Te °C 110 90 70 50 30
−7 2.19 2.22 2.19 2.06 1.79
2 2.64 2.71 2.70 2.57 2.25
7 2.97 3.06 3.04 2.94 2.57
12 3.36 3.49 3.49 3.37 2.97
20 4.15 4.35 4.36 4.24 3.74
25 4.69 4.89 4.93 4.76 4.22
30 5.21 5.44 5.47 5.29 4.66
35 5.71 5.97 6.00 5.81 5.14
Zanchini et al. Future Cities and Environment (2015) 1:3 Page 7 of 19
Simulation scenariosThe following simulation scenarios have been considered.
1. Present State2. Retrofit 1 (thermal insulation of walls and floors)3. Retrofit 2 (thermal insulation of walls and floors,
replacement of windows)4. Retrofit 3 (thermal insulation of walls and floors,
replacement of windows, installation of an air-to-waterheat pump for heating and DHW)
5. Retrofit 4 (thermal insulation of walls and floors,replacement of windows, installation of anair-to-water heat pump for heating and DHW,LED lighting)
6. Retrofit 5 (thermal insulation of walls and floors,replacement of windows, installation of an air-to-waterheat pump for heating, cooling, dehumidifying andDHW, LED lighting, PV collectors).
In Scenario Retrofit 1, the following insulations of theopaque enclosure components are adopted. The verticalwall is insulated externally by a 16 cm layer of calciumsilicate hydrates, with thermal conductivity 0.045 W/(mK). This material is recyclable and requires a very lowuse of primary energy for its production. The floor onbasement is insulated by a 9.5 cm layer of mineral wool,with thermal conductivity 0.032 W/(mK). The terracebetween first and second floor is insulated by a 14 cmlayer of mineral wool, with thermal conductivity 0.037 W/(mK). The loft floor is insulated by a 20 cm layer of mineralwool, with thermal conductivity 0.04 W/(mK). The floor onground and the roof are unchanged. The main propertiesof the retrofitted enclosure elements are reported in Table 3;
Table 5 COP of the heat pump, with hot water delivered at40 °C
Frequency [Hz]
Te [°C] 110 90 70 50 30
−7 2.65 2.71 2.67 2.51 2.15
2 3.27 3.38 3.39 3.21 2.78
7 3.75 3.85 3.88 3.72 3.22
12 4.29 4.44 4.49 4.30 3.76
for each element, the description starts from the internal(heated) space.Besides the thermal insulation of the opaque enclosure
elements, scenario Retrofit 2 includes the replacement ofall windows by double glazed windows with wood frame,having a 16 mm Argon layer and low emissivity glass;the glass transmittance is Ug = 1.00 W/(m2K) and frametransmittance is Uf = 1.84 W/(m2K).In addition to the retrofitting elements of Retrofit
2, Scenario Retrofit 3 includes the installation of amultifunction air-to-water heat pump with inverter,which provides heating and DHW. The capacity ofthe thermal storage for DHW is 1.0 m3; that of thethermal storage for heating is 0.2 m3. In order to ensure ahigh COP of the heat pump during the heating seasonand to allow also summer cooling and dehumidifying(additional service provided only in Scenario Retrofit5), the present radiators are replaced by new high-efficiency fan coils for living rooms and bedrooms,and by low temperature radiators for bathrooms. Thenew fan coils and radiators operate, during the heatingseason, with a water inlet temperature between 40 °Cand 38 °C. Values of the thermal power supplied bythe heat pump in heating mode, with water deliveredat 40 °C and return temperature 34 °C, for severalvalues of the external air temperature Te and of thecompressor frequency, are reported in Table 4; thecorresponding values of the COP are reported inTable 5.
Table 7 EER of heat pump with cold water delivered at 7 °Cand condenser in external air
Frequency [Hz]
Te [°C] 110 90 70 50 30
20 4.78 5.22 5.43 5.34 4.62
25 4.08 4.45 4.63 4.56 3.98
30 3.48 3.8 3.96 3.92 3.45
35 2.97 3.24 3.39 3.36 3.00

Table 8 EER of heat pump with cold water delivered at 7 °Cand heat supplied to DHW
Frequency [Hz]
Thw [°C] 110 90 70 50 30
48 2.45 2.59 2.63 2.54 2.23
50 2.30 2.42 2.47 2.40 2.11
Zanchini et al. Future Cities and Environment (2015) 1:3 Page 8 of 19
When the heat pump works for DHW production,water is delivered with highest temperature 50 °C andlowest temperature 48 °C. The corresponding returntemperatures are 40 °C and 38 °C. Values of the COP ofthe heat pump working for DHW production with evap-orator in external air and water delivered at 50 °C, forseveral values of the external air temperature and of thecompressor frequency, are reported in Table 6.In addition to the retrofitting elements of Retrofit 3,
Scenario Retrofit 4 includes the replacement of incan-descent light bulbs by LED lighting. Besides the retrofit-ting elements of Retrofit 4, Scenario Retrofit 5 includesthe installation of PV collectors with a conversion effi-ciency 14.5 % in the Southeast pitch and in the North-east pitch of the roof: an area of 21.45 m2 is installed inthe Southeast pitch; an area of 7.8 m2 is installed in theNortheast pitch. The peak power of the PV system is4.24 kW. The installation of PV panels in the Southwestpitch is not convenient because this pitch is shadowedby high trees. In Scenario Retrofit 5, the heat pump pro-vides also summer cooling and dehumidifying. Whenthe heat pump works in cooling/dehumidifying modeand heat for DHW is required, the condensation heat issupplied to the DHW thermal storage. In the cooling/dehumidifying mode, cold water is delivered at 7 °C andreturns at 12 °C. Values of the EER of the heat pump
Fig. 8 Internal air temperature in Apartment 3a, from October 15th 2013 to
with condenser in external air, for several values of theexternal air temperature Te and of the compressor fre-quency, are reported in Table 7. Values of the EER of theheat pump with condensation heat supplied to DHW, ei-ther at Thw = 50 °C or at Thw = 48 °C, are reported inTable 8.
Building energy signature in the Present StateIn order to validate the TRNSYS simulation model andthe technical data collected for the building in thePresent State, a pre-monitoring of the building started inMay 2013 and is ongoing. The validation of the simula-tion code has been performed by considering the mea-sured values of the internal air temperature, of theexternal air temperature and of the gas volume used forheating, with reference to the period from October 15th
2013 to April 15th 2014. Hourly values of the internal airtemperature were measured by sensors placed in tworooms per apartment (kitchen and bedroom). Hourlyvalues of the external air temperature were taken frommeasurements performed by the Urbana Weather Sta-tion, Bologna, close to the building. The volume of thegas used for heating was obtained through weekly read-ings of the gas meter connected with the central boiler.The values of the internal air temperature for Apartment3a are reported in Fig. 8, as an example. The meantemperature for this apartment, in the period consid-ered, was 20.3 °C for the berdroom and 20.9 °C for thekitchen. The mean internal-air temperature for thewhole building, averaged among all apartments, was20.2 °C, which can be considered as equal to the settemperature for the internal air, namely 20 °C. Thevalues of the external air temperature, during the sameperiod, are reported in Fig. 9 and compared with those
April 15th 2014

Fig. 9 Measured external air temperature compared with TRNSYS TMY, from October 15th 2013 to April 15th 2014
Zanchini et al. Future Cities and Environment (2015) 1:3 Page 9 of 19
of TRNSYS TMY. The figure shows that winter 2013–2014 was much milder than usual: the mean temperaturefrom October 15th 2013 to April 15th 2014 was 10.15 °C,while that of TRNSYS TMY is 6.99 °C. A similar anomalyis happening in winter 2014–2105.The data employed to determine the experimental
energy signature of the building are reported in Table 9.The duration of each period, in hours, is not always amultiple of 24 h, due to differences in the readingtimes, ranging from 1:30 pm to 5:00 pm. The lower
Table 9 Data employed to determine the experimental energy sign
Period Hours Volume m3
Oct. 15 – Oct. 30 360 110
Oct. 30 – Nov. 30 744 866
Nov. 30 – Dec. 12 288 584
Dec. 12 – Jan. 20 936 1585
Jan. 20 – Jan. 27 168 273
Jan. 27 – Feb. 03 168 327
Feb. 03 – Feb. 10 167.5 263
Feb. 10 – Feb. 17 167.5 242
Feb. 17 – Feb. 24 167 224
Feb. 24 – March 03 169 236
March 03 – March 10 170.5 214
March 10 – March 17 167 165
March 17 – March 24 168.5 135
March 24 – March 31 166.5 171
March 31 – April 07 170 108
April 07 – April 15 190.5 74
heating value of the natural gas supplied to the buildingis 9.7 kWh/m3. The equation of the energy signatureobtained is
_Qexp ¼ 26:209−1:3541Te; ð1Þ
where _Qexp is the mean value of the primary energy useper unit time, in kW, and Te is the mean value of the ex-ternal air temperature in °C.
ature
Energy kWh Power kW Te °C
1067 2.96 17.23
8400.2 11.29 10.68
5664.8 19.67 5.1
15374.5 16.43 7
2648.1 15.76 7.91
3171.9 18.88 5.18
2551.1 15.23 8.64
2347.4 14.01 9.13
2172.8 13.01 9.24
2289.2 13.55 9.34
2075.8 12.17 10.43
1600.5 9.58 12.34
1309.5 7.77 13.66
1658.7 9.96 11.88
1047.6 6.16 15.35
717.8 3.77 16.1

Table 10 Data employed to determine the computationalenergy signature
Period Hours Energy kWh Power kW Te °C
Oct. 1 – Oct. 15 360 404.7 1.12 16.62
Oct. 16 – Oct. 31 384 2668.2 6.95 12.39
Nov. 01 – Nov. 15 360 4169.6 11.58 10.30
Nov. 16 – Nov. 30 360 6109.5 16.97 6.48
Dec. 01 – Dec. 15 360 7732.7 21.48 4.57
Dec. 16 – Dec. 31 384 8513.4 22.17 3.24
Jan. 01 – Jan. 15 360 8997.3 24.99 1.15
Jan.16 – Jan. 31 384 9409.0 24.50 2.23
Feb. 01 – Feb. 15 360 8374.7 23.26 2.37
Feb. 16 – Feb. 28 312 5568.1 17.85 6.61
March 01 – March 15 360 5582.1 15.51 6.93
March 16 – March 31 384 3313.0 8.63 11.74
April 01 – April 15 360 1431.7 3.98 15.04
April 16 – April 30 360 1835.0 5.10 12.61
Table 11 Annual energy need for heating in each retrofitscenario, kWh
Scenario Ap. 1a Ap. 1b Ap. 2a Ap. 2b Ap. 3a Ap. 3b Building
Present State 9487 17976 7479 6245 9475 8391 59,054
Retrofit 1 4579 9111 3435 2375 3867 2868 26,234
Retrofit 2 ÷ 5 2873 6114 1773 1608 2190 2112 16,670
Zanchini et al. Future Cities and Environment (2015) 1:3 Page 10 of 19
The data employed to determine the energy signatureof the building in the Present State by the dynamicsimulation performed through TRNSYS 17 are reportedin Table 10. The period considered is from October 1st
to April 30th of the TRNSYS TMY, with intervals of halfmonth. The primary energy use in each period has beendetermined by dividing the thermal energy need, calcu-lated through the dynamic simulation, by the overall effi-ciency of the heating plant. The latter has been set equalto 0.795, namely the product of the boiler efficiency0.93, the distribution efficiency 0.9, and the emission
Fig. 10 Comparison between the experimental energy signature and the c
efficiency 0.95. In the comparison between the experi-mental energy signature and the computational one, thecontrol efficiency has been set equal to 1, because thereal average value of the internal air temperature was20 °C. The equation of the computational energy signa-ture for the Present State is
_Qcomp ¼ 27:575−1:6208Te; ð2Þ
where _Qcomp is the mean value of the primary energyuse per unit time, in kW, obtained throgh the dynamicsimulation.A comparison of the experimental energy signature
and the computational one is illustrated in Fig. 10. Thecomparison shows that the gross heat loss coefficient ofthe building (namely the heat loss coefficient whichtakes into account also the plant efficiency) determinedthrough the dynamic simulation, 1.62 kW/K, is 19 %higher that that found experimentally. Raesons for thisdiscrepancy could be: a lower air exchange rate in thereal operation with respect to that considered in the dy-namic simulation (0.3 volumes per hour); a differencebetween the real heat loss coefficient and that calculated,for some enclosure elements; a higher plant efficiency
omputational one

Fig. 11 Thermal power required by the building for heating, in Scenarios Retrofit 2 ÷ Retrofit 5
Zanchini et al. Future Cities and Environment (2015) 1:3 Page 11 of 19
with respect to that considered; an inaccuracy of the gasvolume meter. Another difference between the experi-mental energy signature and the computational one isthe higher value of the zero-load temperature which oc-curs in the real case. This difference is probably due tothe lower internal heat gains in the real case with respectto the standard ones.In fact, during the period considered most of the ten-
ants were often outside and had a small use of energyfor cooking and lighting. A more detailed analisis of thecomparison between the experimental energy signatureand the computed one will be performed in a specificpaper. Here we will assume that the comparison illus-trated in Fig. 10 is an acceptable validation of the simu-lation code and of the technical data collected on thebuilding in its present state.In the following, the annual use of primary energy in
each scenario will be considered as equal to that ob-tained through the dynamic simulation.
Annual use of primary energy in each retrofitscenarioThe dynamic simulation of the building in each retro-fit scenario was performed through TRNSYS 17. The
Table 12 Annual use of primary energy for heating in PresentState, Retrofit 1 and Retrofit 2, kWh
Scenario Ap. 1a Ap. 1b Ap. 2a Ap. 2b Ap. 3a Ap. 3b Building
Present State 12,301 23,306 9697 8096 12,285 10,879 76,564
Retrofit 1 5937 11813 4453 3079 5014 3718 34,013
Retrofit 2 3725 7927 2299 2085 2839 2738 21,614
dynamic simulation of the air-to-water heat pump,with gas-boiler auxiliary, was performed by two ownMATLAB codes: one for operation in heating andDHW production mode (with heating from October1st to April 30th); one for operation in cooling/dehu-midifying and/or DHW production mode (with cool-ing and dehumidifying from May 1st to September30th). The evaluation of the electric energy producedby the PV system was performed according to the Na-tional Standards UNI/TS 11300–4 (2012) and UNI/TR11328–1 (2009)
Primary energy use for heating and DHW in the PresentState and Scenarios Retrofit 1 and Retrofit 2The dynamic simulations through TRNSYS 17 allowedto determine the annual energy need for heating of thebuilding, in each retrofit scenario, for each thermal zoneand, as a consequence, for each apartment and for thewhole building. The values of the annual energy needfor heating in kWh, in the Present State and in ScenariosRetrofit 1 and Retrofit 2 are reported in Table 11, foreach apartment and for the whole building. The energyneed for heating in Scenarios Retrofit 3, Retrofit 4 andRetrofit 5 coincides with that in Scenario Retrofit 2. Ahourly plot of the thermal power required by the
Table 13 Annual energy need for DHW, and use in PresentState, Retrofit 1, Retrofit 2, kWh
Ap. 1a Ap. 1b Ap. 2a Ap. 2b Ap. 3a Ap. 3b Building
Need 853.3 1367.4 748.3 750.2 748.3 750.2 5217.8
Use 2771 2188 2430 2436 2430 2436 14,689
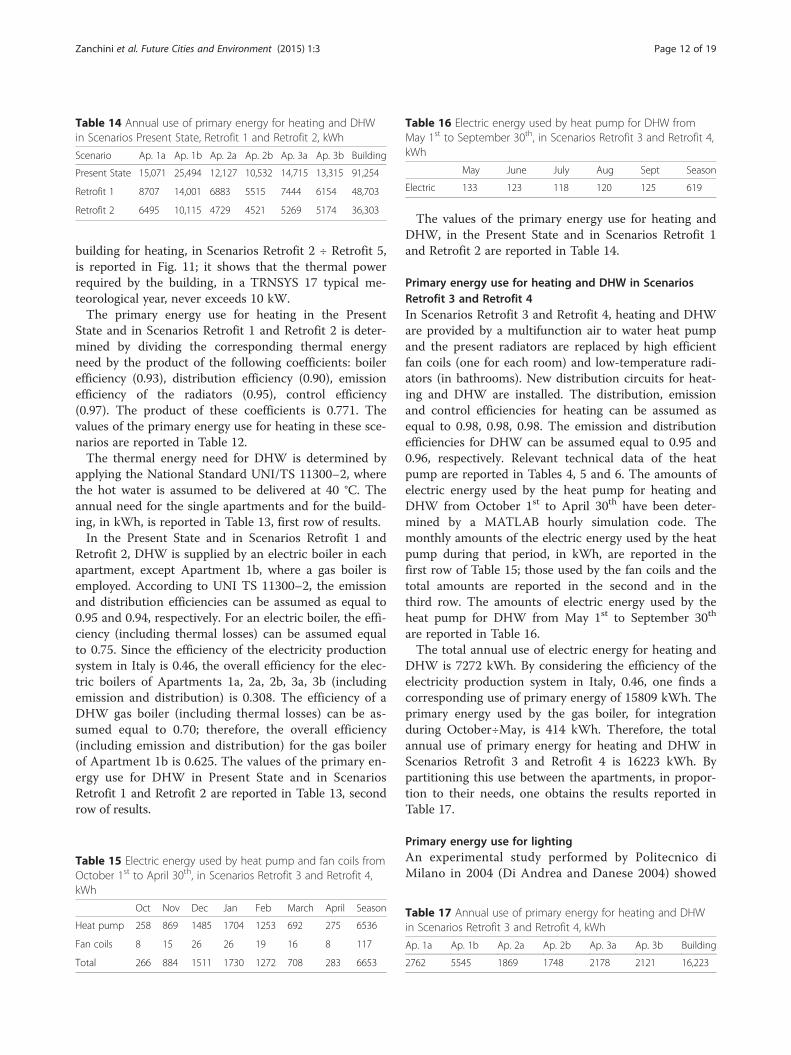
Table 14 Annual use of primary energy for heating and DHWin Scenarios Present State, Retrofit 1 and Retrofit 2, kWh
Scenario Ap. 1a Ap. 1b Ap. 2a Ap. 2b Ap. 3a Ap. 3b Building
Present State 15,071 25,494 12,127 10,532 14,715 13,315 91,254
Retrofit 1 8707 14,001 6883 5515 7444 6154 48,703
Retrofit 2 6495 10,115 4729 4521 5269 5174 36,303
Table 16 Electric energy used by heat pump for DHW fromMay 1st to September 30th, in Scenarios Retrofit 3 and Retrofit 4,kWh
May June July Aug Sept Season
Electric 133 123 118 120 125 619
Zanchini et al. Future Cities and Environment (2015) 1:3 Page 12 of 19
building for heating, in Scenarios Retrofit 2 ÷ Retrofit 5,is reported in Fig. 11; it shows that the thermal powerrequired by the building, in a TRNSYS 17 typical me-teorological year, never exceeds 10 kW.The primary energy use for heating in the Present
State and in Scenarios Retrofit 1 and Retrofit 2 is deter-mined by dividing the corresponding thermal energyneed by the product of the following coefficients: boilerefficiency (0.93), distribution efficiency (0.90), emissionefficiency of the radiators (0.95), control efficiency(0.97). The product of these coefficients is 0.771. Thevalues of the primary energy use for heating in these sce-narios are reported in Table 12.The thermal energy need for DHW is determined by
applying the National Standard UNI/TS 11300–2, wherethe hot water is assumed to be delivered at 40 °C. Theannual need for the single apartments and for the build-ing, in kWh, is reported in Table 13, first row of results.In the Present State and in Scenarios Retrofit 1 and
Retrofit 2, DHW is supplied by an electric boiler in eachapartment, except Apartment 1b, where a gas boiler isemployed. According to UNI TS 11300–2, the emissionand distribution efficiencies can be assumed as equal to0.95 and 0.94, respectively. For an electric boiler, the effi-ciency (including thermal losses) can be assumed equalto 0.75. Since the efficiency of the electricity productionsystem in Italy is 0.46, the overall efficiency for the elec-tric boilers of Apartments 1a, 2a, 2b, 3a, 3b (includingemission and distribution) is 0.308. The efficiency of aDHW gas boiler (including thermal losses) can be as-sumed equal to 0.70; therefore, the overall efficiency(including emission and distribution) for the gas boilerof Apartment 1b is 0.625. The values of the primary en-ergy use for DHW in Present State and in ScenariosRetrofit 1 and Retrofit 2 are reported in Table 13, secondrow of results.
Table 15 Electric energy used by heat pump and fan coils fromOctober 1st to April 30th, in Scenarios Retrofit 3 and Retrofit 4,kWh
Oct Nov Dec Jan Feb March April Season
Heat pump 258 869 1485 1704 1253 692 275 6536
Fan coils 8 15 26 26 19 16 8 117
Total 266 884 1511 1730 1272 708 283 6653
The values of the primary energy use for heating andDHW, in the Present State and in Scenarios Retrofit 1and Retrofit 2 are reported in Table 14.
Primary energy use for heating and DHW in ScenariosRetrofit 3 and Retrofit 4In Scenarios Retrofit 3 and Retrofit 4, heating and DHWare provided by a multifunction air to water heat pumpand the present radiators are replaced by high efficientfan coils (one for each room) and low-temperature radi-ators (in bathrooms). New distribution circuits for heat-ing and DHW are installed. The distribution, emissionand control efficiencies for heating can be assumed asequal to 0.98, 0.98, 0.98. The emission and distributionefficiencies for DHW can be assumed equal to 0.95 and0.96, respectively. Relevant technical data of the heatpump are reported in Tables 4, 5 and 6. The amounts ofelectric energy used by the heat pump for heating andDHW from October 1st to April 30th have been deter-mined by a MATLAB hourly simulation code. Themonthly amounts of the electric energy used by the heatpump during that period, in kWh, are reported in thefirst row of Table 15; those used by the fan coils and thetotal amounts are reported in the second and in thethird row. The amounts of electric energy used by theheat pump for DHW from May 1st to September 30th
are reported in Table 16.The total annual use of electric energy for heating and
DHW is 7272 kWh. By considering the efficiency of theelectricity production system in Italy, 0.46, one finds acorresponding use of primary energy of 15809 kWh. Theprimary energy used by the gas boiler, for integrationduring October÷May, is 414 kWh. Therefore, the totalannual use of primary energy for heating and DHW inScenarios Retrofit 3 and Retrofit 4 is 16223 kWh. Bypartitioning this use between the apartments, in propor-tion to their needs, one obtains the results reported inTable 17.
Primary energy use for lightingAn experimental study performed by Politecnico diMilano in 2004 (Di Andrea and Danese 2004) showed
Table 17 Annual use of primary energy for heating and DHWin Scenarios Retrofit 3 and Retrofit 4, kWh
Ap. 1a Ap. 1b Ap. 2a Ap. 2b Ap. 3a Ap. 3b Building
2762 5545 1869 1748 2178 2121 16,223

Table 18 Annual use of electric energy for lighting, kWh
Scenario Ap.1a
Ap.1b
Ap.2a
Ap.2b
Ap.3a
Ap.3b
Building
Present State ÷Retrofit 3
190 284 167 167 167 167 1141
Retrofit 4and Retrofit 5
38 57 33 33 33 33 228
Table 20 Annual use of primary energy for heating, DHW andlighting in Scenarios Present State ÷ Retrofit 4, kWh andkWh/m2
Scenario Ap.1a
Ap.1b
Ap.2a
Ap.2b
Ap.3a
Ap.3b
Building perm2
PresentState
15,484 26,111 12,489 10,895 15,077 13,678 93,734 332.5
Retrofit1
9120 14,618 7245 5878 7806 6517 51,184 181.6
Retrofit2
6908 10,733 5091 4884 5631 5537 38,784 137.6
Retrofit3
3175 6162 2231 2111 2540 2484 18,703 66.3
Retrofit4
2844 5669 1941 1820 2250 2194 16,719 59.3
Zanchini et al. Future Cities and Environment (2015) 1:3 Page 13 of 19
that the average annual use of electric energy for light-ing in Italy, for apartments with an average area of106 m2, is 375 kWh, i.e., 3.54 kWh/m2. The apart-ments considered in Ref. (Di Andrea and Danese2004) had 80 % incandescent lamps, 15.8 % fluores-cent lamps, and 4.2 % halogen lamps, a compositionsimilar to that of the apartments under exam here, inscenarios Present State ÷ Retrofit 3. We assume thatfor apartments 1a, 2a, 2b, 3a, 3b, with an area of about50 m2, the energy use per unit area is 20 % higher, i.e.,4.25 kWh/m2. With this assumption, the annual use ofelectric energy for lighting in kWh, for each apart-ment, is reported in Table 18. The first row refers toScenarios Present State ÷ Retrofit 3, while the secondrow refers to Scenarios Retrofit 4 and Retrofit 5, whereall lamps are replaced by LED lighting. The corre-sponding use of primary energy for lighting is reportedin Table 19, where the efficiency 0.46 of the Italianelectricity system has been considered.
Primary energy use for heating, DHW and lighting, inScenarios Present State ÷ Retrofit 4The total annual use of primary energy for heating,DHW and lighting, in Scenarios Present State ÷ Retrofit4, in kWh, is resumed in Table 20. The primary energyuse per unit area, in kWh/m2, is reported in the last col-umn. The table shows that Scenario Retrofit 4 yields apercent reduction of primary energy use equal to 82.2 %with respect to the Present State.
Primary energy use for heating, cooling, dehumidifying,DHW and lighting, in Scenario Retrofit 5To further reduce the annual use of primary energy andto provide also summer cooling and dehumidifying, Sce-nario Retrofit 5 is considered, where PV panels are in-stalled on the roof of the building: an area of 21.45 m2 isinstalled in the Southeast pitch; an area of 7.8 m2 is in-stalled in the Northeast pitch. The amounts of electric
Table 19 Annual use of primary energy for lighting, kWh
Scenario Ap.1a
Ap.1b
Ap.2a
Ap.2b
Ap.3a
Ap.3b
Building
Present State ÷Retrofit 3
413 617 362 363 362 363 2481
Retrofit 4 andRetrofit 5
83 123 72 73 72 73 496
energy used by heat pump and fan coils from October1st to April 30th are the same as in Scenarios Retrofit 3and Retrofit 4, and are reported in Table 15. The pri-mary energy used by the gas boiler, in the same period,is 414 kWh.Cooling and dehumidifying is provided from May 1st
to September 30th: the set point is 27 °C for the internalair temperature and 50 % for the relative humidity. Themonthly amounts of thermal energy need for coolingand dehumidifying for the whole building, evaluated bydynamic simulation through TRNSYS 17, are reported inTable 21. Also the monthly amounts of the thermal en-ergy use are reported in the last row, obtained by con-sidering an overall distribution, emission and controlefficiency equal to 0.98 × 0.98 × 0.98.The monthly amounts of the electric energy used by
the heat pump for cooling, dehumidifying and DHWproduction during the period from May 1st to September30th were determined by applying a hourly MATLABsimulation code. The results, in kWh, are reported inTable 22. In the same table, also the estimated use ofelectric energy by the fan coils is reported. The primaryenergy used by the gas boiler for integration of DHWduring this period is about 1 kWh.The monthly values of the total electric energy used
(for heating, cooling-dehumidifying, DHW and lighting)are reported in the first row of Table 23. Part of the elec-tric energy used is provided by the PV system. Monthly
Table 21 Monthly amounts of the thermal energy need anduse for cooling and dehumidifying, kWh
May June July Aug Sept Season
Sensible 566 1309 2350 2110 855 7190
Latent 102 175 286 273 125 962
Total 669 1485 2636 2383 980 8153
Total use 710 1577 2801 2532 1041 8662

Table 22 Monthly amounts of the electric energy used forcooling, dehumidifying and DHW from May 1st to September30th, kWh
May June July Aug Sept
Heat pump 353 526 824 779 423
Fan coils 8 15 26 26 8
Total 361 541 850 805 430
Zanchini et al. Future Cities and Environment (2015) 1:3 Page 14 of 19
amounts of the electric energy produced by the PVsystem are reported in the second row of the table. Inthe other rows, the following monthly energy amountsare reported, in kWh: electric energy taken from thegrid, corresponding primary energy, PV electric energyemployed for self use, PV electric energy supplied to thegrid. The table shows that the annual use of primary en-ergy due to the use of electric energy from the grid is12215 kWh. By adding the primary energy used by thegas boiler, 415 kWh, one obtains the total annual use ofprimary energy of the building, 12630 kWh, which cor-responds to 44.8 kWh/m2.
Synopsis of the total annual use of primary energy inScenarios Present State ÷ Retrofit 5A synopsis of the total annual use of primary energy perunit heated floor area in Scenarios Present State ÷Retrofit 5 is given in Fig. 12. The proposed retrofit sce-nario is Retrofit 5, which yields 86.5 % saving of primaryenergy with respect to the Present State and providesalso summer cooling and dehumidifying, a service notavailable in other scenarios.
Annual emission of CO2 in each retrofit scenarioThe emission of carbon dioxide caused by the use of fos-sil fuels and of electric energy can be calculated byemploying the European Standard EN 15603:2008. Thefuel employed in the building is natural gas. The CO2
production coefficient is 277 kg/MWh for natural gasand 617 kg/MWh for electric energy.The annual use of primary thermal energy for heating
(THE heat), of electric energy for heating (EE heat), ofprimary thermal energy for DHW (THE DHW), of
Table 23 Monthly electric energy balance and primary energy use i
Jan Feb Mar April May June
TOTAL 1749 1289 727 301 381 560
PV 148 224 356 467 564 603
From grid 1601 1066 371 0 0 0
Primary 3481 2317 806 0 0 0
Self use 148 224 356 301 381 560
To grid 0 0 0 166 183 43
electric energy for DHW (EE DHW), of electric energyfor lighting (EE light), of total primary thermal energy(THE), of total electric energy (EE), in kWh are re-ported in columns 2 ÷ 8 of Table 24. In columns 9 ÷11 of the same table are reported the kilograms ofCO2 due to the use of thermal energy (CO2 THE), thekilograms of CO2 due to the use of electric energy(CO2 EE), the total kilograms of CO2 emitted per year.In Scenarios Retrofit 3 and Retrofit 4, the use of elec-
tric energy for heating (EE heat) includes that for theproduction of DHW during the heating period. In Sce-nario Retrofit 5, the total use of electric energy cannotbe divided into use for heating (EE heat) and use forDHW (EE DHW), on account of the PV electricity in-put. The table shows that the reduction in CO2 emissionobtained in Scenario Retrofit 5 is 86.3 % with respect tothe Present State.
Comfort improvementA study on the thermal comfort has been carried out, toestimate the comfort improvement produced by theretrofitting. Dynamic simulations performed throughTRNSYS 17 allowed to determine the time evolution ofoperative temperature, of the relative humidity, and ofthe Fanger indexes PMV (Predicted Mean Vote) and thePPD (Predicted Percentage Dissatisfied) (Fanger 1970)for each room, in scenarios Present State and Retrofot5, with reference to TRNSYS TMY. The PMV indexpredicts the mean response of a large group of peopleaccording to a standard thermal sensation scale, rangingfrom +3 (hot) to −3 (cold), where 0 stands for neutral.The PPD index is related to the PMV index. Usual rec-ommended limits for PMV and PPD indexes are −0.5 <PMV < 0.5 and PPD < 20 %, respectively. With referenceto the standard UNI EN ISO 7730:2006, the followinginput conditions have been considered in winter andsummer, respectively. For the heating period: clothinginsulation of 1.0 clo (typical business suit), metabolicrate of 1.2 met (seated, light home work), air speed of0.1 m/s; for the cooling period: clothing insulation of0.5 clo (light summer clothing), metabolic rate of 1.2met (seated, light home work), air speed of 0.3 m/s.
n Scenario Retrofit 5, kWh
July Aug Sept Oct Nov Dec Year
870 825 449 285 903 1530 9869
681 577 431 306 167 139 4663
189 247 18 0 736 1391 5619
410 537 39 0 1600 3024 12,215
681 577 431 285 167 139 4251
0 0 0 21 0 0 413
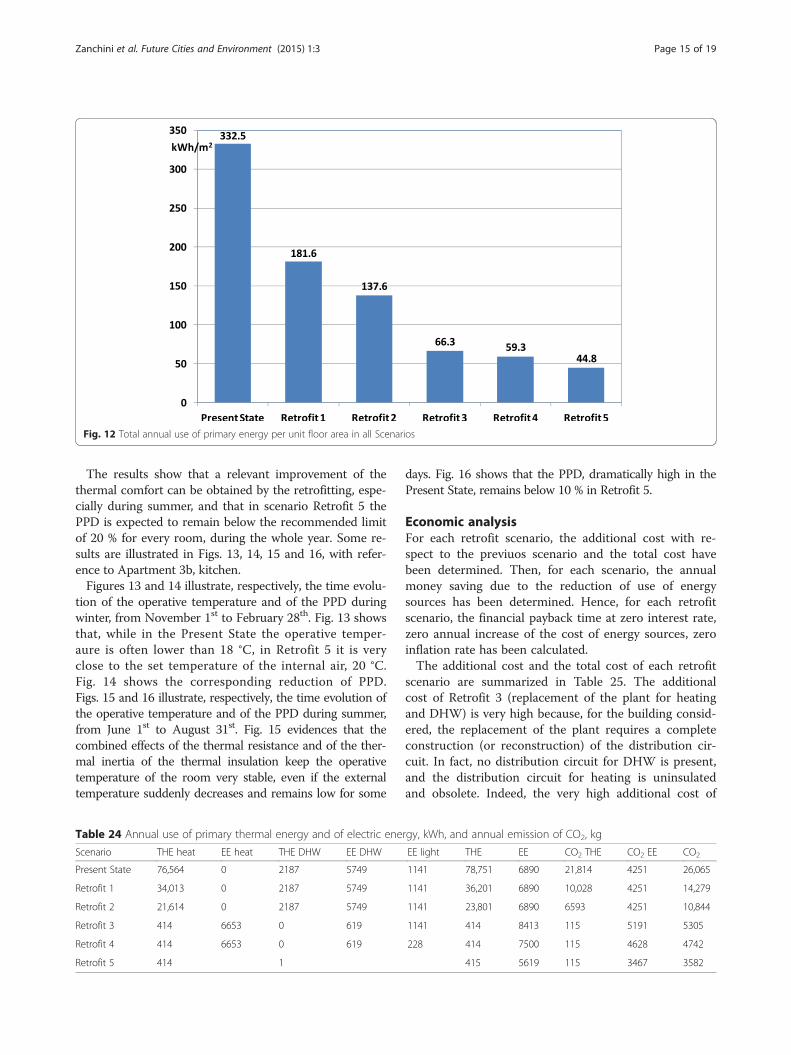
Fig. 12 Total annual use of primary energy per unit floor area in all Scenarios
Zanchini et al. Future Cities and Environment (2015) 1:3 Page 15 of 19
The results show that a relevant improvement of thethermal comfort can be obtained by the retrofitting, espe-cially during summer, and that in scenario Retrofit 5 thePPD is expected to remain below the recommended limitof 20 % for every room, during the whole year. Some re-sults are illustrated in Figs. 13, 14, 15 and 16, with refer-ence to Apartment 3b, kitchen.Figures 13 and 14 illustrate, respectively, the time evolu-
tion of the operative temperature and of the PPD duringwinter, from November 1st to February 28th. Fig. 13 showsthat, while in the Present State the operative temper-aure is often lower than 18 °C, in Retrofit 5 it is veryclose to the set temperature of the internal air, 20 °C.Fig. 14 shows the corresponding reduction of PPD.Figs. 15 and 16 illustrate, respectively, the time evolution ofthe operative temperature and of the PPD during summer,from June 1st to August 31st. Fig. 15 evidences that thecombined effects of the thermal resistance and of the ther-mal inertia of the thermal insulation keep the operativetemperature of the room very stable, even if the externaltemperature suddenly decreases and remains low for some
Table 24 Annual use of primary thermal energy and of electric ene
Scenario THE heat EE heat THE DHW EE DHW
Present State 76,564 0 2187 5749
Retrofit 1 34,013 0 2187 5749
Retrofit 2 21,614 0 2187 5749
Retrofit 3 414 6653 0 619
Retrofit 4 414 6653 0 619
Retrofit 5 414 1
days. Fig. 16 shows that the PPD, dramatically high in thePresent State, remains below 10 % in Retrofit 5.
Economic analysisFor each retrofit scenario, the additional cost with re-spect to the previuos scenario and the total cost havebeen determined. Then, for each scenario, the annualmoney saving due to the reduction of use of energysources has been determined. Hence, for each retrofitscenario, the financial payback time at zero interest rate,zero annual increase of the cost of energy sources, zeroinflation rate has been calculated.The additional cost and the total cost of each retrofit
scenario are summarized in Table 25. The additionalcost of Retrofit 3 (replacement of the plant for heatingand DHW) is very high because, for the building consid-ered, the replacement of the plant requires a completeconstruction (or reconstruction) of the distribution cir-cuit. In fact, no distribution circuit for DHW is present,and the distribution circuit for heating is uninsulatedand obsolete. Indeed, the very high additional cost of
rgy, kWh, and annual emission of CO2, kg
EE light THE EE CO2 THE CO2 EE CO2
1141 78,751 6890 21,814 4251 26,065
1141 36,201 6890 10,028 4251 14,279
1141 23,801 6890 6593 4251 10,844
1141 414 8413 115 5191 5305
228 414 7500 115 4628 4742
415 5619 115 3467 3582

Fig. 13 Operative temperature for Apartment 3b, kitchen, from November 1st to February 28th
Zanchini et al. Future Cities and Environment (2015) 1:3 Page 16 of 19
Retrofit 3 could be considered only in part as a costfor energy retrofitting, and in part as a necessary reno-vation cost of the building. The additional cost for theinstallation of heat pump, thermal storage tanks, fancoils and radiators is 24,555 Euro; the remaining add-itional cost (114,045 Euro) is for the installation of thenew distribution circuits for heating and DHW and ofheat meters.
Fig. 14 PPD for Apartment 3b, kitchen, from November 1st to February 28t
In order to determine the annual economic savings,the following data on the employed fuel, natural gas, andon electricity have been employed:
� Natural gas: lower heating value 9.595 kWh/m3; cost0.9 Euro/m3;
� Electricity: cost 0.2 Euro/kWh; value of electricitysupplied to grid 0.0389 Euro/kWh
h

Fig. 15 Operative temperature for Apartment 3b, kitchen, from June 1st to August 31st
Zanchini et al. Future Cities and Environment (2015) 1:3 Page 17 of 19
The value of the PV electricity supplied to grid is verylow at present in Italy. This is a sudden change with re-spect to the policy of a few years ago, when very high in-centives were given to PV energy production and alsothe electricity produced and self-used was paid.The annual savings obtainable in each retrofit scenario
are illustrated in Table 26. The columns of the table re-port, for each scenario: the annual use of thermal primary
Fig. 16 PPD for Apartment 3b, kitchen, from June 1st to August 31st
energy (kWh), the annual use of electric energy (kWh),the annual use of natural gas (m3), the cost of the gas used(Euro), the cost of the electricity used (Euro), the total an-nual cost of gas plus electricity (Euro), the income due toPV electricity supplied to grid (Euro), the annual savingwith respect to the Present State (Euro).In the evaluation of the payback time, for each retrofit
scenario, State incentives should be considered. Although

Table 25 Additional cost and total cost of each retrofitscenario, Euro
Retrofit scenario Add cost Total cost
Retrofit 1 67,419 67,419
Retrofit 2 18,324 85,743
Retrofit 3 138,600 224,343
Retrofit 4 871 225,214
Retrofit 5 11,660 236,874
Table 27 Total cost (Euro) and total payback time (years) ofeach retrofit scenario
Scenario Cost Cost withincentives
Payback Payback withincentives
Retrofit 1 67,419 23,597 17.1 6.0
Retrofit 2 85,743 30,010 16.8 5.9
Retrofit 3 224,343 78,520 32.2 11.3
Retrofit 4 225,214 78,825 31.5 11.0
Retrofit 5 236,874 82,906 31.5 11.0
Zanchini et al. Future Cities and Environment (2015) 1:3 Page 18 of 19
the building is owned by the Municipality of Bologna, ref-erence is made to the Italian State incentives delivered toprivate citizens, as recommended by the HERB consor-tium. The retrofit interventions are considered in the fol-lowing sequence: thermal insulation of vertical andhorizontal walls (Retrofit 1); Retrofit 1 + replacement ofwindows (Retrofit 2); Retrofit 2 + replacement of the heat-ing and DHW plant (Retrofit 3); Retrofit 3 + LED lighting(Retrofit 4); Retrofit 4 + PV system (Retrofit 5). In this se-quence, each additive cost receives a State contributionequal to 65 % of the cost. The LED lighting and the PVsystem receive this contribution because they are parts ofa general retrofit plan which yields an annual use of pri-mary energy lower than the limit prescribed by the Gov-ernment for the applicability of the 65 % contribution.The State contribution is given in the form of tax reduc-tion in 10 equal amounts, during a period of 10 years.Since vanishing interest and inflation rates are assumed,the total State contribution is considered as a cost reduc-tion available at the first year.The total cost and the total payback time of each
retrofit scenario, without incentives and with incentives,are reported in Table 27. As shown in the table, the re-placement of the plant, with the installation of new dis-tribution circuits, enhances the general payback timewith incentives from about 6 to about 11 years. Thisintervention, however, yields several benefits to thebuilding: the possibility of supplying heating, DHW,cooling and dehumidifying with a very low annual use of
Table 26 Use of energy sources and savings in each scenario,per year
Scenario THEkWh
EEkWh
Gas m3 Gascost
EE cost Cost Income Saving
PresentState
78,751 6890 8119 7307 1378 8685 0 —
Retrofit 1 36,201 6890 3732 3359 1378 4737 0 3948
Retrofit 2 23,801 6890 2454 2208 1378 3586 0 5098
Retrofit 3 414 8413 43 38 1683 1721 0 6964
Retrofit 4 414 7500 43 38 1500 1538 0 7146
Retrofit 5 415 5619 43 39 1124 1162 16 7523
primary energy; the renovation of the distributionsystem.
ConclusionsFive scenarios for the energy retrofitting of a residentialbuilding with 6 apartments located in Bologna, North-Center Italy, have been analyzed through hourly dy-namic simulations of the building and of the plant. Sim-ulations of the building have been performed byTRNSYS 17; those of the multifunction heat pump sys-tem with thermal storage by own MATLAB codes. Thesimulation code has been validated, in the Present Statescenario, by comparing the computational energy signa-ture of the building with that determined experimentallyby a pre-retrofit monitoring.The proposed retrofit scenario is the most complete
one, which includes: thermal insulation of the externalvertical walls by calcium silicate hydrates; thermalinsulation of horizontal enclosure elements by mineralwool; replacement of windows; installation of a multifuc-tion heat pump with inverter and thermal storage forheating, cooling/dehumidifying, and DHW supply; in-stallation of new distribution networks for heating/cool-ing and DHW; installation of high efficient fan coils andlow temperature radiators; LED lighting; installation of aPV system on the roof. The proposed retrofit scenarioyields a 86.5 % reduction of the use of primary energy, a86.3 % reduction of CO2 emission, and a relevant com-fort improvement. The payback time for private owners,considering State incentives, is 11 years.
Competing interestsThe authors declare that they have no competing interests.
Authors’ contributionsEZ coordinated the research work, evaluated the energy use and the CO2
production in each scenario, by employing simulation results provided by SLand CN, and wrote the paper. CN performed the dynamic simulations of theheat pump system. SL performed the dynamic simulations of the building.GLM evaluated the plant efficiency in the present state and gavesuggestions for the choice of the retrofit scenarios. All authors read andapproved the final manuscript.
AcknowledgmentThis research was funded by the European Union’s Seventh FrameworkProgram, Theme EeB.NMP.2012-2, Project HERB (Holistic energy-efficientretrofitting of residential buildings), Grant agreement no: 314283.

Zanchini et al. Future Cities and Environment (2015) 1:3 Page 19 of 19
Author details1Department of Industrial Engineering, University of Bologna, VialeRisorgimento 2, 40136 Bologna, Italy. 2Department of Sciences forArchitecture, University of Genova, Stradone S. Agostino, 37, 16123 Genova,Italy.
Received: 3 February 2015 Accepted: 1 May 2015
ReferencesAfonso C, Oliveira AC (2000) Solar chimneys: simulation and experiment. Energy
Build 32:71–79Amstalden RW, Kost M, Nathani C, Imboden DM (2007) Economic potential of
energy-efficient retrofitting in the Swiss residential building sector: Theeffects of policy instruments and energy price expectations. Energy Policy35:1819–1829
Ascione F, de Rossi F, Vanoli GP (2011) Energy retrofit of historical buildings:theoretical and experimental investigations for the modelling of reliableperformance scenarios. Energy Build 43:1925–1936
Balaras CA, Droutsa K, Argiriou AA, Asimakopoulos DN (2000) Potential for energyconservation in apartment buildings. Energy Build 31:143–154
Bizzarri G, Morini GL (2006) New technologies for an effective energy retrofit ofhospitals. Appl Therm Eng 26:161–169
Brignoli R, Cecchinato L, Zilio C (2013) Experimental analysis of an air–water heatpump with micro-channel heat exchanger. Appl Therm Eng 50:1119–1130
Chan HY, Riffat SB, Zhu J (2010) Review of passive solar heating and coolingtechnologies. Renew Sust Energ Rev 14:781–789
Chidiac SE, Catania EJC, Morofsky E, Foo S (2011a) A screening methodology forimplementing cost effective energy retrofit measures in Canadian officebuildings. Energy Build 43:614–620
Chidiac SE, Catania EJC, Morofsky E, Foo S (2011b) Effectiveness of single andmultiple energy retrofit measures on the energy consumption of officebuildings. Energy 36:5037–5052
Cuce E, Cuce PM, Wood CJ, Riffat SB (2014) Optimizing insulation thickness andanalysing environmental impacts of aerogel-based thermal superinsulation inbuildings. Energy Build 77:28–39
Dall’O’ G, Sarto L (2013) Potential and limits to improve energy efficiency inspace heating in existing school buildings in northern Italy. Energy Build67:298–308
Daouas N (2011) A study on optimum insulation thickness in walls and energysavings in Tunisian buildings based on analytical calculation of cooling andheating transmission loads. Appl Energy 88:156–164
Di Andrea F, Danese A (2004) Misure dei consumi di energia elettrica nel settoredomestico., http://www.eerg.it/resource/pages/it/Progetti_-_MICENE/compendio_misure_consumi_elettrici.pdf
Energy-efficient buildings. Multiannual roadmap for the contractual PPP underHorizon 2020. http://www.ectp.org/cws/params/ectp/download_files/36D2981v1_Eeb_cPPP_Roadmap_under.pdf
Eurostat, European Commission portal for statistics. http://ec.europa.eu/eurostat/data/database
Fanger PO (1970) Thermal comfort: Analysis and applications in environmentalengineering. Copenhagen (Denmark): Danish Technical Press
International Energy Statistics – EIA (US Energy Information Administration).http://www.eia.gov/cfapps/ipdbproject/IEDIndex3.cfm#
IPCC Fifth Assessment Report – AR5. https://www.ipcc.ch/report/ar5/wg1/Liu X, Ni L, Lau SK, Li H (2013) Performance analysis of a multi-functional heat
pump system in heating mode. Appl Therm Eng 51:698–710Naldi C, Morini GL, Zanchini E (2014) A method for the choice of the optimal
balance-point temperature of air-to-water heat pumps for heating. SustainCities Soc 12:85–91
Orosa JA, Oliveira AC (2009) Energy saving with passive climate control methodsin Spanish office buildings. Energy Build 41:823–828
Pisello AL, Santamouris M, Cotana F (2013) Active cool roof effect: impact of coolroofs on cooling system efficiency. Adv Build Energy Res 7:209–221
Santamouris M (2014) Cooling the cities – a review of reflective and green roofmitigation technologies to fight heat island and improve comfort in urbanenvironments. Sol Energy 103:682–703
Santamouris M, Synnefa A, Karlessi T (2011) Using advanced cool materials in theurban built environment to mitigate heat islands and improve thermalcomfort conditions. Sol Energy 85:3085–3102
Shahrokni H, Levihnc F, Brandt N (2014) Big meter data analysis of the energyefficiency potential in Stockholm’s building stock. Energy Build 78:153–164
Terlizzese T, Zanchini E (2011) Economic and exergy analysis of alternative plantsfor a zero carbon building complex. Energy Build 43:787–795
Ucar A, Balo F (2009) Effect of fuel type on the optimum thickness of selectedinsulation materials for the four different climatic regions of Turkey. ApplEnergy 86:730–736
Yu J, Yang C, Tian L, Liao D (2009) A study on optimum insulation thicknesses ofexternal walls in hot summer and cold winter zone of China. Appl Energy86:2520–2529
Zhao X, Lee JM, Riffat SB (2008) Numerical study of a novel counter-flow heatand mass exchanger for dew point evaporative cooling. Appl Therm Eng28:1942–1951
Zhao X, Yang S, Duan Z, Riffat SB (2009) Feasibility study of a novel dew point airconditioning system for China building application. Build Environ44:1990–1999
Submit your manuscript to a journal and benefi t from:
7 Convenient online submission
7 Rigorous peer review
7 Immediate publication on acceptance
7 Open access: articles freely available online
7 High visibility within the fi eld
7 Retaining the copyright to your article
Submit your next manuscript at 7 springeropen.com