planning and use of resources in construction
TRANSCRIPT
Univerza v Ljubljani Fakulteta za gradbeništvo in geodezijo
Jamova 2 1000 Ljubljana, Slovenija telefon (01) 47 68 500 faks (01) 42 50 681 [email protected]
Kandidat:
Žiga Babnik
Planiranje z omejenimi viri - Študij primera z uporabo Primavera project Planner verzija 3.1
Diplomska naloga št.: 2893
Univerzitetni program Gradbeništvo, Komunalna smer
Mentor: prof. dr. Žiga Turk Somentor: prof. dr. Attila Dikbas , viš. pred. dr. Aleksander Srdić
Ljubljana, 23. 6. 2006

BABNIK, Ž. 2006. Resource constrained scheduling - a case study using Primavera Project Planner 3.1 II Graduation Thesis - UNI. Ljubljana, UL, FCEG, Civil engineering, Division of Municipal Economics
IZJAVA O AVTORSTVU Podpisan ŽIGA BABNIK izjavljam, da sem avtor diplomske naloge z naslovom: »PLANIRANJE Z OMEJENIMI RESURSI - ŠTUDIJ PRIMERA Z UPORABO PRIMAVERA PROJECT PLANNER VERSION 3.1«. Izjavljam, da se odpovedujem vsem materialnim pravicam iz dela za potrebe elektronske separatoteke FGG. Ljubljana, 07.06.06

BABNIK, Ž. 2006. Resource constrained scheduling - a case study using Primavera Project Planner 3.1 III Graduation Thesis - UNI. Ljubljana, UL, FCEG, Civil engineering, Division of Municipal Economics
BIBLIOGRAFSKO – DOKUMENTACIJSKA STRAN IN IZVLEČEK
UDK: 004.42.65.012.2.69 (043.2)
Avtor: Žiga Babnik
Mentor: Prof. Dr. Žiga Turk
Somentor: Prof. Dr. Attila Dikbas, asist. Dr. Aleksander Srdić
Naslov: Planiranje z omejenimi viri - študij primera z uporabo Primavera Project
Planner Version 3.1
Obseg in oprema: 88 str., 8 pregl., 46 sl., 11 en.
Ključne besede: planiranje z omejenimi resursi, programska orodja, kontrola projekta
Izvleček
V sklopu študentske izmenjave programa Socrates Erasmus sem bil v poletnem semestru
študijskega leta 2005/06 gost na Project Management Centru na Istanbul Technical University
v Turčiji, kjer sem napisal svoje diplomsko delo. V tem diplomskem delu bom predstavil
proces planiranja z osnovnimi značilnostmi in metodami, ki morajo biti uporabljene tekom
planiranja projekta v gradbeništvu z uporabo najbolj razširjene metode kritične poti.
Predstavljen je teoretični vidik planiranja virov in njihova možnost uporabe z modernimi
programskimi orodji; slednje je aplicirano na realen projektni plan, ki je izdelan v
profesionalnem programu za planiranje in vodenje projektov Primavera Project Planner,
verzija 3.1. Tehnike za planiranje virov so izravnavanje, razporejanje, kopičenje, zbiranje in
glajenje. Za kontrolo projekta je prikazana metoda obvladovanja prislužne vrednosti. Poleg z
že omenjenimi metodami in tehnikami sem se ukvarjal tudi s tem, kako naj profesionalci v
gradbeništvu le-te uporabljajo, seveda s pomočjo programskih pripomočkov za planiranje in
vodenje projektov skozi njihov celoten potek. Prisotna so tudi poročila, ki so na voljo po
izdelanem planu in tekom same izvedbe, če plan vsebuje vse zahtevane podatke. To so
poročila plana, poročilo kontrole virov in stroškov, nosilna poročila virov in stroškov,
poročila o produktivnosti, stroških in ocenah, poročila o denarnem toku, tabelarična poročila
o virih in stroških ter matrična poročila izdelana s pomočjo Primavere. Na koncu so
predstavljene še rešitve, ki jih P3 ponuja za pošiljanje posameznih informacij med udeleženci
projekta in hranjenje le-teh na spletu ali lokalnem strežniku, kot tudi udeleženci projekta, ki
uporabljajo vire in vodijo projekt, ter njihove naloge in metode dela s pomočjo P3.

BABNIK, Ž. 2006. Resource constrained scheduling - a case study using Primavera Project Planner 3.1 IV Graduation Thesis - UNI. Ljubljana, UL, FCEG, Civil engineering, Division of Municipal Economics
BIBLIOGRAPHIC-DOCUMENTALISTIC INFORMATION
UDC: 004.42.65.012.2.69 (043.2)
Author: Žiga Babnik
Supervisor: Prof. Dr. Žiga Turk
Co-supervisiors: Prof. Dr. Attila Dikbas, assist. Dr. Aleksander Srdić
Title: Resource constrained scheduling - a case study using Primavera Project Planner
Version 3.1
Notes: 88 p., 8 tab., 46 fig, 11 eq.
Key words: resource constrained scheduling, PM software tools, project control
Abstract
In the spring semester of the academic year 2005/06 I took part in the Socrates Erasmus
student exchange, writing my graduation thesis at the Project Management Centre at Istanbul
Technical University. In this thesis I will present the process of planning along with its basic
properties and methods, which have to be used when planning a project in the construction
sector, using the expanded Critical Path Method. I included some theoretical background of
resource scheduling and its possibility of using it with modern software tools, which is
presented on a real project prepared by using Primavera Project Planner Version 3.1, a
modern programme for planning and managing projects. The techniques I dealt with are
levelling, allocation, cumulation, aggregation and smoothing. In order to control the project,
the Earned value analysis is presented as well. Apart from all the aforementioned methods
and techniques, I also decided to portray how the professionals in construction should use
these techniques with modern software tools for managing and planning the project during its
life, including the reports that are made right after a particular plan is finished, as well as
other reports compiled during the project, if the project contains all necessary data. These
reports are: schedule, resource/cost control, resource/cost loading, productivity, cash flow,
earned value, tabular resource/cost and matrix reports made with P3. In the end, the solutions
for sending and sharing project data via the web or local servers between the members of a
project team, as well as the responsibilities of the latter for resource scheduling and managing
the project using P3 are depicted.

BABNIK, Ž. 2006. Resource constrained scheduling - a case study using Primavera Project Planner 3.1 V Graduation Thesis - UNI. Ljubljana, UL, FCEG, Civil engineering, Division of Municipal Economics
ZAHVALA
Svojemu mentorju prof. Dr. Žigu Turku, se zahvaljujem za možnost in vzpostavitev Socrates
Erasmus izmenjave z Istanbul Technical University.
Prof. Dr. Attili Dikbasu iskreno hvala za nudenje potrebne študijske literature, srečanja z
mladimi raziskovalci, strokovnjaki iz gradbene industrije in nepozabno sodelovanje in
druženje.
Dragemu prijatelju Keremu se zahvaljujem za idejno usmerjanje in pomoč pri mojem delu in
bivanju v Istanbulu, kot tudi za vse nepozabne skupne trenutke v krogu njegovih.
Asist. Dr. Aleksandru Srdiću se zahvaljujem za pomoč in usmeritve pri izdelavi dela.
Ebru, Serhan, Isilay, Meltan in Emre - hvala za prijetno druženje in deljenje pogledov ter
izkušenj.
Podjetju Energoplan d.d. se zahvaljujem za podporo in strinjanje z mojimi odločitvami.
Dragi Klari se zahvaljujem za podporo, potrpežljivost in ljubeznivost v času moje študijske
izmenjave.
Posebna zahvala gre Mili za pomoč pri prevajanju in lektoriranju dela.

BABNIK, Ž. 2006. Resource constrained scheduling - a case study using Primavera Project Planner 3.1 VI Graduation Thesis - UNI. Ljubljana, UL, FCEG, Civil engineering, Division of Municipal Economics
ACKNOWLEDGEMENTS
First of all, I would like to thank my supervisor dr. Žiga Turk for providing the opportunity of
taking part in the Socrates Erasmus exchange at the Istanbul Technical University.
I would also like to thank prof.dr. Attila Dikbas for providing all the necessary resources and
literature, setting up meetings with young researchers and experts within the field of
construction industry, as well as for the remarkable cooperation and companionship.
A big thank you goes out to my dear friend Kerem for his idea-framing guidance, for helping
me out with my work and stay in Istanbul and for all the unforgettable moments I got to spend
with his family.
I would also like to thank asisst. Dr.Aleksander Srdić for directing my thesis and providing
valuable help.
Ebru, Serhan, Isilay, Meltan and Emre – thank you all for the nice socializing, as well as
sharing views and experience.
My thanks are also due to the company Energoplan d.d. for supporting me and agreeing with
my decisions.
I am grateful to my dear Klara for all the support, patience and kindness during my student
exchange.
A special thank you to Mili, whose helps me with translation and reading manuscripts.

BABNIK, Ž. 2006. Resource constrained scheduling - a case study using Primavera Project Planner 3.1 VII Graduation Thesis - UNI. Ljubljana, UL, FCEG, Civil engineering, Division of Municipal Economics
KAZALO
1 UVOD 1
1.1 Ozadje 1
1.2 Definicija problema 1
1.3 Metoda dela 2
2 PROJEKTNI MANAGEMENT 3
2.1 Organizacija in planiranje projekta 3
2.2 Planiranje pred podpisom pogodbe 5
2.3 Planiranje po podpisu pogodbe 6
2.4 Opredelitvene metode 7
2.5 Planiranje projekta 8
2.6 Metoda kritične poti 9
2.6.1 Princip mrežne metode 10
2.6.2 Primer uporabe P3 11
2.6.3 Prednosti metode kritične poti 12
2.6.4 Slabosti metode kritične poti 12
2.7 Princip gantogramov in povezanih gantogramov 13
2.7.1 Primer uporabe P3 13
2.7.2 Prednosti gantogramov in povezanih gantogramov 14
2.7.3 Slabosti gantogramov in povezanih gantogramov 15
2.8 Ocenjevanje trajanja dejavnosti 15
2.8.1 Metode in tehnike za ocenjevanje trajanja dejavnosti 16
2.8.1.1 Ocena ekspertov 16
2.8.1.2 Analogna ocenitev trajanja dejavnost 16
2.8.1.3 Kvantitativna ocenitev trajanja dejavnosti 17
2.8.1.4 Upoštevanje naključja 17
2.9 Planiranje virov 17
2.9.1 Rezervni čas v planiranju virov 17
2.9.2 Rezervni čas v planiranju omejenih virov 18

BABNIK, Ž. 2006. Resource constrained scheduling - a case study using Primavera Project Planner 3.1 VIII Graduation Thesis - UNI. Ljubljana, UL, FCEG, Civil engineering, Division of Municipal Economics
2.9.2.1 Razlogi za metodo kritične poti z omejenimi viri 19
2.9.2.2 Algoritem za metodo kritične poti z omejenimi viri 19
2.9.2.3 Sistem metode kritične poti z omejenimi viri 23
2.9.3 Metode in tehnike za planiranje virov 24
2.9.3.1 Uporaba optimalne procedure 25
2.9.3.2 Izravnavanje virov 26
2.9.3.2.1 Algoritem za izenačevanje virov 28
2.9.3.3 Razporejanje virov 31
2.9.3.3.1 Algoritem za razporejanje virov 32
2.9.3.4 Kopičenje virov 37
2.9.3.5 Zbiranje virov 38
2.9.3.6 Glajenje virov 40
2.10 Metoda obvladovanja prislužne vrednosti 42
3 ŠTUDIJ PRIMERA ZA PLANIRANJE VIROV 45
3.1 Uvod v študij primera 45
3.2 Predstavitev Molekularne biološke zgradbe v Maslak kampusu
Istanbul Technical University 45
3.3 Splošni podatki o planu Molekularne biološke zgradbe
izdelanem v P3 47
3.4 Začetek in izvedba del 48
3.4.1 Izdelava strukture izvedbe del 49
3.5 Pripomočki in tehnike za planiranje virov z uporabo P3
predstavljene v planu Molekularne biološke zgradbe 50
3.5.1 Planiranje z omejenimi viri z uporabo P3 50
3.5.2 Razporejanje virov z uporabo P3 51
3.5.3 Izravnavnje virov z uporabo P3 53
3.5.4 Glajenje virov z uporabo P3 56
3.6 Poročila projektnega plana z uporabo P3 57
3.6.1 Poročila plana Molekularne biološke zgradbe 60
3.6.1.1 Poročilo plana 60

BABNIK, Ž. 2006. Resource constrained scheduling - a case study using Primavera Project Planner 3.1 IX Graduation Thesis - UNI. Ljubljana, UL, FCEG, Civil engineering, Division of Municipal Economics
3.6.1.2 Poročilo kontrole virov in stroškov 61
3.6.1.3 Nosilna poročila virov in stroškov 61
3.6.2 Poročila ustvarjena tekom izvedbe projekta 62
3.6.2.1 Poročila o produktivnosti, stroških in ocenah 62
3.6.2.2 Poročilo o metodi zaslužnih vrednosti 63
3.6.2.3 Poročila o denarnem toku 64
3.6.2.4 Tabelarična poročila o virih in stroških 65
3.6.2.5 Matrična poročila 66
3.7 Delitev projektnih podatkov z uporabo P3 67
3.8 Člani projektnega tima 70
3.8.1 Planer 71
3.8.2 Izvrševalec 73
3.8.3 Vodja projekta 73
3.8.4 Vodja nadzora projekta 74
4 ZAKLJUČKI IN PRIPOROČILA 75
5 POVZETEK 77
6 VIRI 88

BABNIK, Ž. 2006. Resource constrained scheduling - a case study using Primavera Project Planner 3.1 X Graduation Thesis - UNI. Ljubljana, UL, FCEG, Civil engineering, Division of Municipal Economics
TABLE OF CONTENTS
1 INTRODUCTION 1
1.1 Background 1
1.2 Problem definition 1
1.3 Objectives and methodology 2
2 PROJECT MANAGEMENT 3
2.1 Project organization and project planning 3
2.2 Pre-contract planning 5
2.3 Contract planning 6
2.4 Method statement 7
2.5 Planning a project 8
2.6 Critical path method 9
2.6.1 Principles of network 10
2.6.2 Case using P3 11
2.6.3 Advantages of network 12
2.6.4 Disadvantages of network 12
2.7 Principles of bar charts and linked bar charts 13
2.7.1 Case using P3 13
2.7.2 Advantages of bar charts and linked bar charts 14
2.7.3 Disadvantages of bar charts and linked bar charts 15
2.8 Activity duration estimating 15
2.8.1 Tools and techniques for activity duration estimating 16
2.8.1.1 Expert judgement 16
2.8.1.2 Analogous estimating 16
2.8.1.3 Quantitatively based durations 17
2.8.1.4 Reserve time (contingency) 17
2.9 Resource scheduling 17
2.9.1 Float in resource scheduling 17
2.9.2 Float in resource constrained scheduling 18
BABNIK, Ž. 2006. Resource constrained scheduling - a case study using Primavera Project Planner 3.1 XI Graduation Thesis - UNI. Ljubljana, UL, FCEG, Civil engineering, Division of Municipal Economics
2.9.2.1 Reasons for RCPM 19
2.9.2.2 RCPM Algorithm 19
2.9.2.3 RCPM System 23
2.9.3 Methods and techniques for Resource scheduling 24
2.9.3.1 Using optimal procedure 25
2.9.3.2 Resource levelling 26
2.9.3.2.1 Levelling algorithm 28
2.9.3.3 Resource allocation 31
2.9.3.3.1 Allocation algorithm 32
2.9.3.4 Aggregation 37
2.9.3.5 Cumulation 38
2.9.3.6 Smoothing 40
2.10 Earned Valued analysis 42
3 A CASE STUDY OF RESOURCE SCHEDULING 45
3.1 Introduction in a case study 45
3.2 Presentation on the Technical University’s Molecular Biology
Building in Maslak Campus 45
3.3 General information about the real case schedule of MBB using P3 47
3.4 Start and execution of the work 48
3.4.1 Creating a work breakdown structure 49
3.5 Resource scheduling tools and techniques using P3 presented
in MBB’s schedule 50
3.5.1 Resource constrained scheduling using P3 50
3.5.2 Allocation in P3 51
3.5.3 Levelling in P3 53
3.5.4 Smoothing in P3 56
3.6 Reports on the schedule using P3 57
3.6.1 Reports on the MBB’s schedule 60
3.6.1.1 Schedule report 60
3.6.1.2 Resource/cost control report 61

BABNIK, Ž. 2006. Resource constrained scheduling - a case study using Primavera Project Planner 3.1 XII Graduation Thesis - UNI. Ljubljana, UL, FCEG, Civil engineering, Division of Municipal Economics
3.6.1.3 Resource/cost loading report 61
3.6.2 Reports which can be obtained during the progress 62
3.6.2.1 Resource productivity/cost, price and rates reports 62
3.6.2.2 Earned value reports 63
3.6.2.3 Reviewing cash flow report 64
3.6.2.4 Tabular Resource/Cost Repors 65
3.6.2.5 Matrix reports 66
3.7 Sharing project data in P3 67
3.8 Team members of the project 70
3.8.1 Planner 71
3.8.2 Executive 73
3.8.3 Project manager 73
3.8.4 Project control manager 74
4 CONCLUSION AND RECOMMENDATION 75
5 SUMMARY 77
6 REFERENCES 88

BABNIK, Ž. 2006. Resource constrained scheduling - a case study using Primavera Project Planner 3.1 XIII Graduation Thesis - UNI. Ljubljana, UL, FCEG, Civil engineering, Division of Municipal Economics
INDEX OF TABLES
Table 1: The legend activity box configuration
Table 2: RCPM Algorithm process overview
Table 3: The legend of notation used in algorithm
Table 4: The legend of activity box configuration
Table 5: Used notations during the allocation algorithm
Table 6: The example illustrates the method Table 7: Table of results of cumulation calculation
Table 8: Main data about MBB

BABNIK, Ž. 2006. Resource constrained scheduling - a case study using Primavera Project Planner 3.1 XIV Graduation Thesis - UNI. Ljubljana, UL, FCEG, Civil engineering, Division of Municipal Economics
INDEX OF FIGURES
Figure 1: The project planning process
Figure 2: Construction work and safety method statements
Figure 3: Steps in the planning and control process
Figure 4: A network case of the schedule in P3
Figure 5: Presentation of bar charts in P3
Figure 6: Inputs for Activity Duration Estimation
Figure 7: The CPM analysis of the schedule
Figure 8: Creating a resource constrained link
Figure 9: Schedule in step 3
Figure 10: Schedule in step 4
Figure 11: Alternative schedule in step 5
Figure 12: Ideal resource profiles
Figure 13: Levelling algorithm
Figure 14: Time analysis of example project to illustrate the resource levelling procedure
Figure 15: Results of the time analysis and the resource histogram
Figure 16: Resource levelling; examining activity F
Figure 17: Resource levelling: final result
Figure 18: Allocation algorithm
Figure 19: Time analysis of example project to illustrate the resource allocation
Figure 20: Results of time analysis and resource histogram
Figure 21: Results of resource allocation procedure
Figure 22: Graph of results of cumulation calculation
Figure 23: Scheduling and activity in smoothing
Figure 24: Illustrative graphic performance report
Figure 25: Photos of MBB
Figure 26: A Work breakdown structure for MBB' s schedule
Figure 27: Activities before and after resource constrained requirements
Figure 28: The process of using resources
Figure 29: The windows in P3 for displaying resources, their requirements and resource
measurement window
BABNIK, Ž. 2006. Resource constrained scheduling - a case study using Primavera Project Planner 3.1 XV Graduation Thesis - UNI. Ljubljana, UL, FCEG, Civil engineering, Division of Municipal Economics
Figure 30: Resource profile display options in P3 Figure 31: The resource profile in P3
Figure 32: The window in P3 for levelling Figure 33: GPLS2 resource over limit
Figure 34: Result of levelling GPLS2 using P3
Figure 35: The scheme of different reports and graphics types using in P3
Figure 36: The schedule report of the MBB' s schedule
Figure 37: The resource control report of the MBB' s schedule
Figure 38: The cost loading report of the MBB' s schedule
Figure 39: The earned value report
Figure 40: Cash flow diagram
Figure 41: The tabular resource report
Figure 42: The matrix report
Figure 43: Send mail wizard in P3
Figure 44: Primavera web publishing wizard
Figure 45: Steps in creating HTML reports using P3
Figure 46: Scheme of the project's team members structure

BABNIK, Ž. 2006. Resource constrained scheduling - a case study using Primavera Project Planner 3.1 XVI Graduation Thesis - UNI. Ljubljana, UL, FCEG, Civil engineering, Division of Municipal Economics
ACRONYMS AND SYMBOLS PM Project management
P3 Primavera Project Planner Version 3.1
CPM Critical path method
AON Acitivity on Node
ES Early start time
EF Early finish time
LS Late start time
LF Late finish time
DES Activity description
OD Original duration
FS Finish to start relationships
SS Start to start relationships
SF Start to finish relationships
FF Finish to finish relationships
TF Total float
FF Free float
PF Phantom float
RCS Resource constrained scheduling
RCPM Resource constrained Critical path method
TW Amount of work to be done
FR Float remaining
EVA The earned value analysis
PV The planned value
AC The actual cost
EV The earned value
CV Cost variance
SV Schedule variance
ACWP Actual cost for work performed
BCWP Budgeted cost for work performed
BCWS Planned value, or budgeted cost for work scheduled

BABNIK, Ž. 2006. Resource constrained scheduling - a case study using Primavera Project Planner 3.1 XVII Graduation Thesis - UNI. Ljubljana, UL, FCEG, Civil engineering, Division of Municipal Economics
CPI Cost performance index
SPI Schedule performance index
PMC Project Management Centre
ITU Istanbul Technical University
MBB Molecular Biology Building
WBS Work breakdown structure
HTML Hyper Text Markup Language
PCM Project control manager
Y Activity duration

BABNIK, Ž. 2006. Resource constrained scheduling - a case study using Primavera Project Planner 3.1 XVIII Graduation Thesis - UNI. Ljubljana, UL, FCEG, Civil engineering, Division of Municipal Economics
TABLE OF APPENDICES Appendix A List of activities and their data
Appendix B The legend of added and used resources in the schedule
Appendix C Schedule of MBB

BABNIK, Ž. 2006. Resource constrained scheduling - a case study using Primavera Project Planner 3.1 1 Graduation Thesis - UNI. Ljubljana, UL, FCEG, Civil engineering, Division of Municipal Economics
1 INTRODUCTION
1.1 Background
Project planning and programming is essential for successful project management (PM).
Without planning it is difficult to envisage the successful conclusion of any project or the
effective control of time, money or resources. There is more to planning a project than meets
the eye and a great deal more involved than simply producing a programme. Planning is also
essential when it comes to dealing with construction risks and device safe working methods.
This is so through all the stages of the process, from inception all the way to design,
tendering, construction and commissioning stages of a project.
The reasons for planning may be summarised as:
• To aid contract control,
• To establish realistic standards,
• To monitor performance in terms of output, time and money,
• To keep the schedule under constant review and take action when necessary to correct
the situation with modern PM software.
1.2 Problem definition
Critical path analysis is the analytical technique used most frequently by the construction
respondents during both the planning and control stages of managing a project. But in the pre-
contract and contract planning, only time-line planning based on planner's experiences by the
past projects is mostly used. The main goal is to be with a schedule as close as the real project
will take on. It is necessary to adopt disposable resources and information into the project and
use other techniques including resource scheduling for planning and earned value analysis for
control. All types of information entered have to be updated in the software, although the
project effect is weaker. Many construction companies in Slovenia and Turkey do not use
planning techniques efficiently in that manner.

BABNIK, Ž. 2006. Resource constrained scheduling - a case study using Primavera Project Planner 3.1 2 Graduation Thesis - UNI. Ljubljana, UL, FCEG, Civil engineering, Division of Municipal Economics
1.3 Objectives and methodology
In my thesis I will present particular fields within Project management which are used as
theoretical background for planning: methods and techniques for planning, resource
scheduling and presentation of all types of entered and updated data and evaluation methods,
which are also provided by modern software tools. In addition to that, there is a real project
schedule case and there are presented resource scheduling methods, tools and techniques
using Primavera Project Planner Version 3.1 (P3). The advantages, results and benefits of
scheduling in that way will also be presented as showing and sharing project data and reports.
I chose the P3 software package, because it is reliable, comprehensive and more professional
in comparison to Microsoft Project which is mostly preferred because of its affordability.

BABNIK, Ž. 2006. Resource constrained scheduling - a case study using Primavera Project Planner 3.1 3 Graduation Thesis - UNI. Ljubljana, UL, FCEG, Civil engineering, Division of Municipal Economics
2 PROJECT MANAGEMENT
2.1 Project organization and project planning
Project organization and project type are highly dependent on the type of a contract. Common
contract types used in construction projects are:
• Lump-sum contract
• Turn key contract
• Build operate transfer contract
• Unit price contract and others
In this research, I decided to focus on the Lump-sum type, taking into consideration the fact
that the latter is still the preferred option for many corporations and public institutions. Other
types of contracts are out of the research scope.
The parameters below describe the distribution of responsibilities between parties and define
the organizational layout for lump-sum contracts:
• The project functional requirements are prepared by the client.
• The project definition is prepared by the client.
• Design consultants are appointed by the client.
• A project manager from the client's own organization is sometimes appointed.
• Construction documentation is prepared by the consultants.
• A lump sum construction contract is awarded to the low bidder.
• A schedule is commonly prepared by the main contractor, otherwise by the client.
In a lump-sum project, detailed scheduling typically begins once the contractor has signed the
contract with the client to construct the project. Since producing the detailed schedule can
cost a substantial amount, it is not begun until the contract is awarded and it is completed as
soon as possible. There are three primary reasons for preparing the schedule immediately:

BABNIK, Ž. 2006. Resource constrained scheduling - a case study using Primavera Project Planner 3.1 4 Graduation Thesis - UNI. Ljubljana, UL, FCEG, Civil engineering, Division of Municipal Economics
• The contractor wants the schedule to control field operations.
• The planning and scheduling process is a tool to help print out and solve problems
before they arise in the field.
• The client/contractor contract may require the presentation of a project schedule to the
client/architect for use in monitoring the project.
The scheduling process being used in setting up project controls for lump-sum, linear
construction process involves four phases: planning, scheduling, monitoring and controlling.
Project planning starts with the client’s team or organization when a programme (or master
schedule) is prepared by the client's agent, representative or a project manager. This sets out
the broad framework of the project, including:
• key data for commencement and completion of the project,
• key data for design, tender and construction,
• overall programme and phasing,
• design and tendering periods,
• key data for commencement and completion of construction,
• stage or phased handover dates.
PRE-TENDER PLANNING
PRE-CONTRACT PLANNING
CONTRACT PLANNING
Figure 1: The project planning process
The main reasons for project planning are:
• to establish a realistic project master schedule or a programme on which the
appointments of consultants and contractors and commission the occupancy phase of
the scheme are based.
• to identify key dates or gateways at critical stages of the project.
• to facilitate control of the design and tendering process.

BABNIK, Ž. 2006. Resource constrained scheduling - a case study using Primavera Project Planner 3.1 5 Graduation Thesis - UNI. Ljubljana, UL, FCEG, Civil engineering, Division of Municipal Economics
• to identify potential risks in order to progress and avoid possible delays of project
completion and revenue generation.
2.2 Pre-contract planning
Pre-contract planning generally takes place during the period between the contract award and
commencement of work on a site. This is the case for a project based on a traditional
competitive tender, but differences may occur in procedures where other procurement
arrangements are used.
Before work starts on a site, the contractor will develop the pre-tender programme into the
contract master programme, showing the main construction operations to be carried out.
Copies of this programme will be presented to the client’s representative who will use it as a
tool to monitor the contractor’s overall progress during construction. The master programme
will often show when information is required by the contractor and act as a prompt for an
architect.
The master programme is the one that the client's team sees, but many contractors produce an
inertial programme for their own use in order to save time and money. It is called a target
programme with time taken out as planned - that is contracting.
In order to help the contractor organise and manage site activities at an operational level, the
target programme will need to be developed in more detail. Most of the time bars on the target
programme will represent the main work packages to be carried out by various sub-
contractors and consequently each bar will be developed into a sub-contractor programme,
showing the detailed activities to be carried out
However, to ensure that work packages start and finish on time, it is now usual for the
contractor to produce a procurement programme for each subcontractor. This programme will
show both negative and positive time. Negative time is the time needed before work starts on
site to organise design and fabrication aspects of the package or to pre-order key materials
with long lead times. Positive time is the time needed to carry out the subcontractor’s work on
site.

BABNIK, Ž. 2006. Resource constrained scheduling - a case study using Primavera Project Planner 3.1 6 Graduation Thesis - UNI. Ljubljana, UL, FCEG, Civil engineering, Division of Municipal Economics
The main reasons for pre-contract planning are:
• to provide a broad outline schedule or strategy for the project,
• to comply with contract conditions,
• to establish a construction sequence on which the master programme may be based,
• to identify key project dates,
• to highlight key information requirements,
• to enable the assessment of contract budgets and cumulative value forecasts,
• to schedule key dates with respect to key material and subcontractor requirements.
2.3 Contract planning
During the contract stage, the master programme will be further developed. For instance, a
stage programme might be prepared in order to show a part of the master programme in more
detail.
Alternatively, the contractor might produce a series of short-term programmes at weekly or
fortnightly intervals so as to schedule day-to-day work in detail. Contract planning is done by
the main contractor in order to maintain control and ensure that the project is completed on
time, within the cost limits established at the tender stage. Subcontractors contribute to the
process either by submitting their work programme for approval or thought discussion with
the main contractor.
As the contract progresses, the programme invariably changes from its original form. Delays
occur, work is disrupted due to design changes and unforeseen events take place, such as the
discovery of bad ground or contamination. This causes delay and/or disruption of the
programme, recorded on a revised programme which should be constantly updated through
the project as the work proceeds and as other problems arise. These programmes are often
referred to as the as-built programmes or, alternatively, the programmes of the day and they
are a vital tool, enabling the contractor to justify his entitlement to the extensions of time
and/or additional payment for loss and expense.
Reasons for contract planning are:

BABNIK, Ž. 2006. Resource constrained scheduling - a case study using Primavera Project Planner 3.1 7 Graduation Thesis - UNI. Ljubljana, UL, FCEG, Civil engineering, Division of Municipal Economics
• to monitor the master programme on a monthly, weekly and daily basis,
• to schedule site operations in detail in short term,
• to optimise and review resources,
• to keep the project under review and report on variances.
2.4 Method statement
The preparation of method statements forms is the essential part of the contractor’s planning
process as these underpin the programme and explain how the work is to be undertaken.
Method statements convey different meanings to clients, consultants, subcontractors and main
contractors. A method statement is not simply a list of construction operations with notes
written alongside.
It is common practise to combine the construction and safety method statements for each
work activity into a single document. This makes sense because safety is an integral factor in
the planning process.

BABNIK, Ž. 2006. Resource constrained scheduling - a case study using Primavera Project Planner 3.1 8 Graduation Thesis - UNI. Ljubljana, UL, FCEG, Civil engineering, Division of Municipal Economics
Figure 2: Construction work and safety method statements
2.5 Planning a project
When preparing any programme for a project, it is essential to follow a logical thought
process in order to develop a realistic and a workable programme. Working knowledge of the
development and construction processes is essential. The level of detail shown in the
programme should be commensurate with the project stage under consideration and, wherever
possible, activity durations should be based on empirical data or calculation.
Computer software should be used for speed, for considering “what if” options and for high
quality professional presentations.
Planning a project requires a logical approach involving various steps or thought processes:
CONSTRUCTION WORK METHOD STATEMENT
To explain the contractor’s proposed methods and sequence of working for checking by the client’s representative.
To calculate activity durations for the programme.
To decide on gang composition and resource requirements for individual activities.
To plan activities in detail so that a logical construction sequence is adopted.
To provide an easily understood document, this can be communicated to those who will carry out the work on site.
SAFETY METHOD STATEMENT
To demonstrate safe systems of work for hazardous operations.
To be included in the construction schedule together with subcontractor’s safety method statements.
To manage any residual risks identified in the risk assessment.
To provide practical control measures.
To explain how the work is to be supervised and monitored.
To explain first aid and emergency arrangements should the worst happen.
To explain the work.

BABNIK, Ž. 2006. Resource constrained scheduling - a case study using Primavera Project Planner 3.1 9 Graduation Thesis - UNI. Ljubljana, UL, FCEG, Civil engineering, Division of Municipal Economics
• getting a feel for the project,
• establishing key project dates,
• establishing key activities or events,
• assessing how long the activities will take,
• establishing the sequence,
• deciding which programming technique to use.
Figure 3: Steps in the planning and control process
The resources can comprise labour, equipment, material or other resources assigned to the
activity when the baseline schedule is constructed.
2.6 Critical path method
The resurgence in the use of the Critical path method (CPM) in the late 1980s was mainly due
to the introduction of the personal computer and developments in the user-friendly project
software. Now, linked bar charts are more popular for most projects, but within the larger
Determine scope of work.
Determine project duration.
Determine level of detail necessary.
Determine available resources.
Determine distribution of work effort.
Dtermine project costs and estimate budget.
Determine participants in and frequency of updates.
Determine the update output for analysis and presentations.
Establish baseline (target) schedule.
Anticipate change by developing contingency plans.
Track work progress and actual costs.
Compare progress and costs target.
Evaluate performance.
Forecast, analyze and recommend action.

BABNIK, Ž. 2006. Resource constrained scheduling - a case study using Primavera Project Planner 3.1 10 Graduation Thesis - UNI. Ljubljana, UL, FCEG, Civil engineering, Division of Municipal Economics
schemes CPM still plays an important role, especially with the advent of cheaper software and
hardware. There is little doubt that networks are here to stay, albeit that developments in
project management software using precedence and linked bar charts presentation formats are
largely preferred to arrow diagram techniques.
Whatever the case, as construction projects become larger and more complex to schedule and
manage, project managers and larger contractors become increasingly reliant on computers to
undertake project planning tasks; the use of project management software will become the
norm. Of course, the computer has now become an everyday site tool for both, the
construction manager and the planner.
2.6.1 Principles of network
PM software tools are using Acitivity on Node (AON) network for CPM analyisis. The
construction of an AON network is straightforward. All the scheduler has to do is to create a
node for each activity and then connect the nodes by arcs as dictated by the precedence
relations.
The duration of each activity is given, and the earliest and latest event times of the activity
can be calculated by making forward and backward passes through the network. From this
information, a schedule that will facilitate calculation of the total float or spare time for each
activity can be produced.
The critical path can be identified by determining the following four parameters for each
activity:
• ES - early start time: the earliest time at which the activity can start given
that its precedent activities must be completed first.
• EF - early finish time, equal to the earliest start time for the activity plus the
time required to complete the activity.
• LF - late finish time: the latest time at which the activity can be completed

BABNIK, Ž. 2006. Resource constrained scheduling - a case study using Primavera Project Planner 3.1 11 Graduation Thesis - UNI. Ljubljana, UL, FCEG, Civil engineering, Division of Municipal Economics
without delaying the project.
• LS - late start time, equal to the latest finish time minus the time required to
complete the activity.
Once the activities and their sequencing have been defined, the CPM diagram can be drawn.
An examples of a CPM network diagram can be seen in Figure 14 and in Figure 4 using P3.
The project management software carries out the time analysis for the programme sequence
developed by the planner. This allows the operations to be sorted according to a particular
priority, thereby enabling the critical path to be calculated and highlighted. The critical path is
defined as the longest route through the sequence of operations which must be undertaken in
order to complete the project.
2.6.2 Case using P3
Figure 4: A network case of the schedule in P3
Table 1: The legend activity box configuration
When the late finish and the early finish dates are the same, the activity is referred to as
critical.
DES Activity description
OD Original duration
ES Early start EF Early finish LS Late start LF Late finish
FFL Free float TL Total float

BABNIK, Ž. 2006. Resource constrained scheduling - a case study using Primavera Project Planner 3.1 12 Graduation Thesis - UNI. Ljubljana, UL, FCEG, Civil engineering, Division of Municipal Economics
2.6.3 Advantages of network
• Through the discipline of CPM, the user can achieve better planning due to the logical
approach undertaken during the development of the construction sequence.
• Identification of critical operations on which effort and resources can be applied aids
the contractor’s management. This enables “management by exception” to be applied
to critical activities.
• CPM allows the planner to express his ideas in graphical form. Recent developments
in project management software allow networking on screen to be carried out.
• The planner has the facility to assign priorities for labour, plant, material and
subcontractor resources to each operation on the network.
• Bar charts analysis aids understanding at site management level.
• The effect of changes and variations can be evaluated and time-cost optimisation
analysis undertaken.
• Cash flow assessments and valuation forecasting information may be output in
graphical format and readily updated during the project.
• Using laptop and site-based computers, progress may be speedily analysed and variety
of management reports made available.
2.6.4 Disadvantages of network
• Several activities are in practice often scheduled to start just after the preceding one,
so there is a complex concurrency, but with a delay at the beginning. This can be
overcome by using a ladder diagram. This introduces concurrent activities with a
“lead-lag” start and finish which can be likened to dummy activities but with a
duration attached.
• In these situations precedence diagrams offer much more flexibility.
• For all the man-hours spent on in-company management training programmes learning
to appreciate networks, they have never captivated managers in small and medium-
sized companies.

BABNIK, Ž. 2006. Resource constrained scheduling - a case study using Primavera Project Planner 3.1 13 Graduation Thesis - UNI. Ljubljana, UL, FCEG, Civil engineering, Division of Municipal Economics
2.7 Principles of bar charts and linked bar charts
The bar chart is laid out with the time-scale in days/weeks/months/years along the top axis
and list of tasks or activities down the left hand side. The time required for each activity is
represented by a horizontal line (or bar), with the length of the line indicating the duration of
the activity. Most architects and site managers tend to have problems with understanding
anything other than bar charts displays, even where network analysis has been stipulated in
the contract documents as the project planning technique to be employed. However, bar charts
have limitations and the key disadvantage is that they do not show dependency.
Consequently, it is not easy to see the interrelationship between activities and how dependent
they might be on one another. This is not so bad when it comes to a simple project, but where
there are a large number of activities on the programme, real problems can arise for the
manager. The problem can be overcome by using the linked bar chart.
Relationships used in linked bar charts include:
• Finish to start relationships FS
• Start to start relationships SS
• Start to finish relationships SF
• Finish to finish relationships FF
2.7.1 Case using P3
Figure 5: Presentation of bar charts in P3

BABNIK, Ž. 2006. Resource constrained scheduling - a case study using Primavera Project Planner 3.1 14 Graduation Thesis - UNI. Ljubljana, UL, FCEG, Civil engineering, Division of Municipal Economics
There are a number of project management software packages available, which employ linked
bar charts as the preferred display. Those include:
• CS Project Professional - Crest Software
• Hornet Windmill - Claremont Controls
• Microsoft Project - Microsoft Corporation
• Primavera Project Planner Version 3.1 – Primavera Systems, Inc.
• Power Project Professional - Asta Development
2.7.2 Advantages of bar charts and linked bar charts
• Simple format readily understood at all levels of management.
• Applicable at all stages of the planning process: project planning, pre-tender, pre-
contract planning and contract planning.
• Particularly useful in showing the relationship between the pre-tender, master
programme and short-term programmes.
• Clearly mimics the construction sequence – the use of linking between bars facilitates
the overlapping of related operations.
• Easily updated at weekly and monthly intervals for review purposes and progress
reports.
• Key milestone symbols may be introduced to highlight critical dates with regard to
key contract stages, information requirements and as aid to subcontractor and
materials procurement.
• Resources may be shown on the bar chart, which clearly relates labour, plant and
subcontractors to the rate of working and helps the manager to see problems of
continuity and waste.
• Facilitates the production of labour histograms, value-time forecasts, cumulative
labour and plant forecasts and other project budgets so that actual progress may be
charted against planned progress.
• Enables the contractor to quickly and simply fulfil contractual requirements to submit
a programme prior to commencement of work on site.
BABNIK, Ž. 2006. Resource constrained scheduling - a case study using Primavera Project Planner 3.1 15 Graduation Thesis - UNI. Ljubljana, UL, FCEG, Civil engineering, Division of Municipal Economics
• Readily updated with information such as key site deliveries, progress to date and
delays, making it simple to produce an “as built” programme which may prove an
asset to the contractor in forming contractual claims. The effect of the receipt of late
information on programmed operations can be monitored and reported.
• Copies of the contract position at the date of a specific occurrence may provide
evidence of the resulting delay.
• The bar chart programme can be used to form the basis of financial forecasting for
both the client and the contractor.
• Computer printouts in full colour can be scaled down to A4 size, which is invaluable
for management reports and ease of handling.
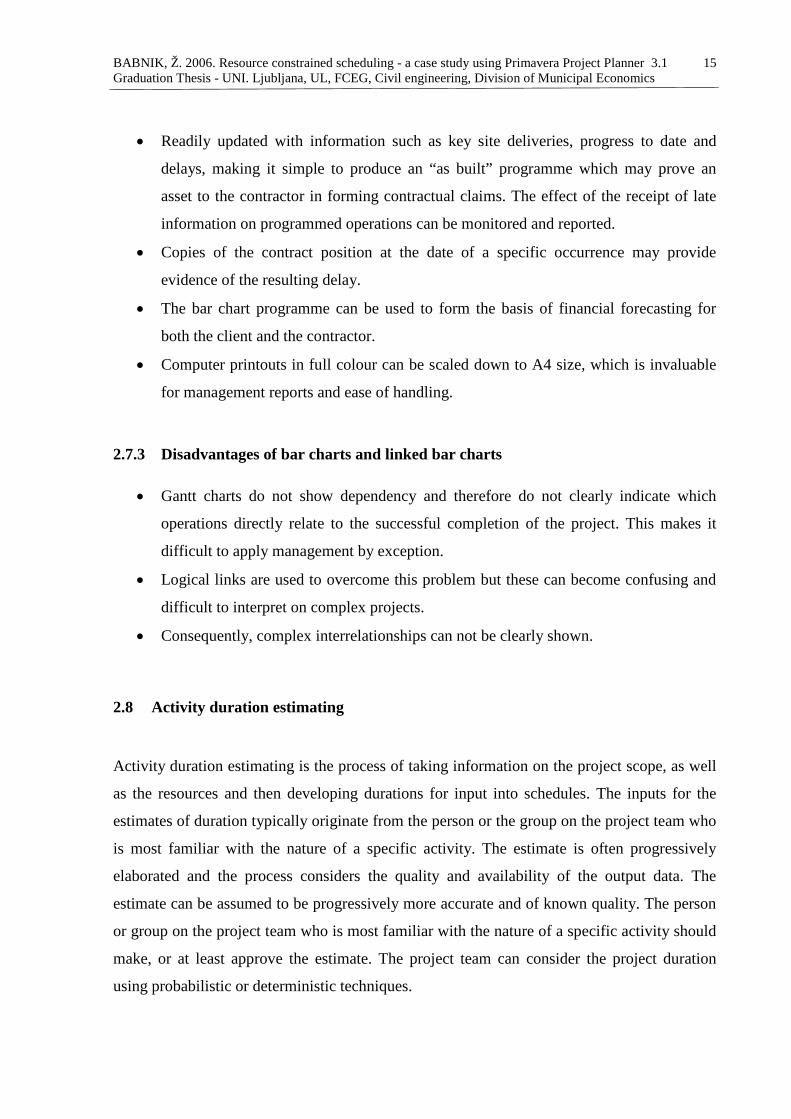
2.7.3 Disadvantages of bar charts and linked bar charts
• Gantt charts do not show dependency and therefore do not clearly indicate which
operations directly relate to the successful completion of the project. This makes it
difficult to apply management by exception.
• Logical links are used to overcome this problem but these can become confusing and
difficult to interpret on complex projects.
• Consequently, complex interrelationships can not be clearly shown.
2.8 Activity duration estimating
Activity duration estimating is the process of taking information on the project scope, as well
as the resources and then developing durations for input into schedules. The inputs for the
estimates of duration typically originate from the person or the group on the project team who
is most familiar with the nature of a specific activity. The estimate is often progressively
elaborated and the process considers the quality and availability of the output data. The
estimate can be assumed to be progressively more accurate and of known quality. The person
or group on the project team who is most familiar with the nature of a specific activity should
make, or at least approve the estimate. The project team can consider the project duration
using probabilistic or deterministic techniques.
BABNIK, Ž. 2006. Resource constrained scheduling - a case study using Primavera Project Planner 3.1 16 Graduation Thesis - UNI. Ljubljana, UL, FCEG, Civil engineering, Division of Municipal Economics
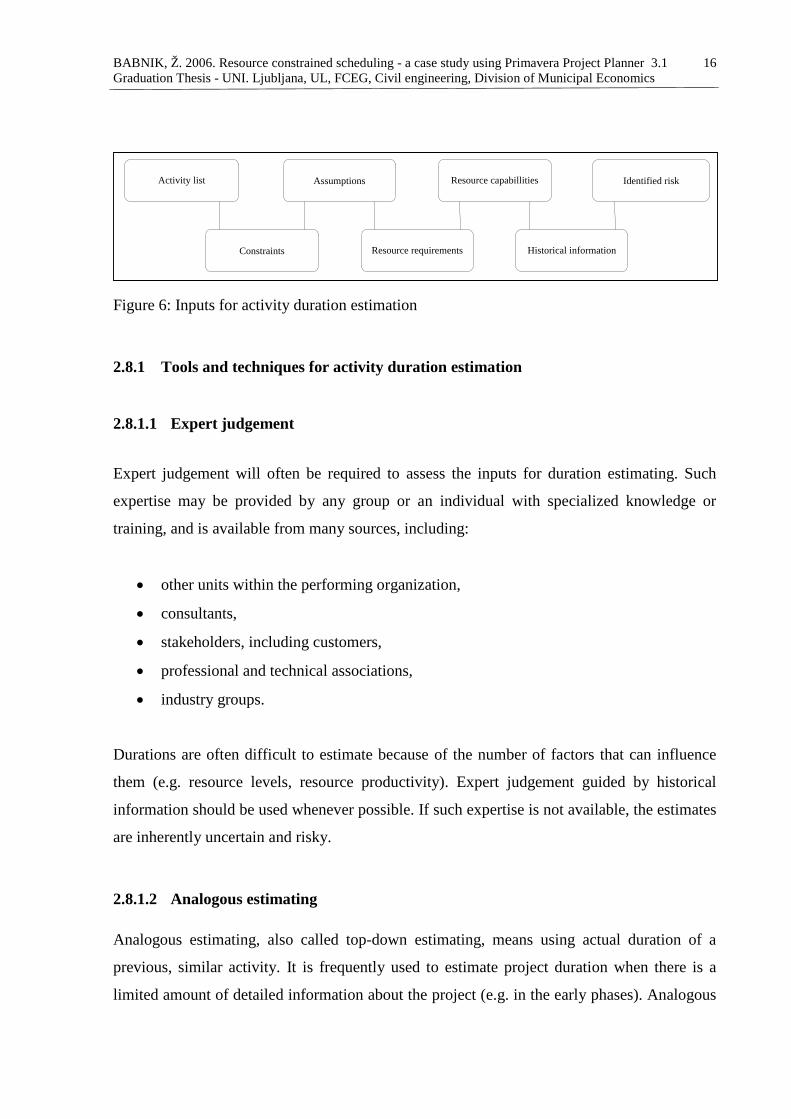
Figure 6: Inputs for activity duration estimation
2.8.1 Tools and techniques for activity duration estimation
2.8.1.1 Expert judgement
Expert judgement will often be required to assess the inputs for duration estimating. Such
expertise may be provided by any group or an individual with specialized knowledge or
training, and is available from many sources, including:
• other units within the performing organization,
• consultants,
• stakeholders, including customers,
• professional and technical associations,
• industry groups.
Durations are often difficult to estimate because of the number of factors that can influence
them (e.g. resource levels, resource productivity). Expert judgement guided by historical
information should be used whenever possible. If such expertise is not available, the estimates
are inherently uncertain and risky.
2.8.1.2 Analogous estimating Analogous estimating, also called top-down estimating, means using actual duration of a
previous, similar activity. It is frequently used to estimate project duration when there is a
limited amount of detailed information about the project (e.g. in the early phases). Analogous
Historical informationResource requirementsConstraints
Activity list Assumptions Resource capabillities Identified risk

BABNIK, Ž. 2006. Resource constrained scheduling - a case study using Primavera Project Planner 3.1 17 Graduation Thesis - UNI. Ljubljana, UL, FCEG, Civil engineering, Division of Municipal Economics
estimating is a form of expert judgement and is most reliable when the previous activities are
in fact similar and when the individuals preparing the estimates have the needed expertise.
2.8.1.3 Quantitatively based durations The quantities to be performed for each specific work category (i.e. number of drawing,
meters of cable, tons of steel, etc.) defined by the engineering/design effort, when multiplied
by the productivity unit rate (i.e. hours per drawing, meters of cable per hour, etc.) can be
used to estimate activity durations.
2.8.1.4 Reserve time (Contingency) Project teams may choose to incorporate an additional time frame called time reserve,
contingency, or buffer that can be added to the activity duration or elsewhere in the schedule
as recognition of schedule risk. This reserve time can be a percentage of the estimated
duration or a fixed number of work periods. The reserve time can later be reduced or
eliminated, as more precise information about the project becomes available. Such reserve
time should be documented along with other data and assumptions.
2.9 Resource scheduling
2.9.1 Float in resource scheduling The concept of float has been adopted for use in resource constrained projects. Certain
activities have float, which permits them to start later than their earlier dates. Total float (TF)
is the number of days an activity can be delayed without a possible effect on the finish of the
project. Correctly controlled, this float is valuable in regulating the use of labour, materials,
cost and other resources. P3 bases the calculations of early and late dates and float for each
activity on the network logic, data date, remaining durations and any imposed constrains.
Early dates indicate the earliest start and finish dates on which an activity can be performed,
taking network logic into consideration. Late dates represent the latest dates on which an
activity can start and finish without the project being delayed. Float helps identifying schedule
problems and analysis schedule status. P3 calculates TF as the difference between the late and
early finish dates. A positive total float value represents the number of work periods an
activity can slip before it possibly affects the project finish date. Free float (FF) equals the

BABNIK, Ž. 2006. Resource constrained scheduling - a case study using Primavera Project Planner 3.1 18 Graduation Thesis - UNI. Ljubljana, UL, FCEG, Civil engineering, Division of Municipal Economics
amount of time the early start of an activity can be delayed without delaying the early start of
a successor. Presentation of float is seen in cases 3.7.1. and 3.6.2.
FF = ES2-Y-ES1 (1)
TF = LF – ES – Y (2)
Y (activity duration)
2.9.2 Float in resource constrained scheduling The CPM generates useful information about the project, such as the shortest project duration,
the critical path, TF and FF of each activity. Once resources are considered in the scheduling
process, the information about the correct float has been lost. As a result, one or more paths
become critical. The difference between "theoretical remaining" TF and the "actual
remaining" is referred to as a phantom float (PF).
Since the schedule needs to be updated periodically based on current project performance, it is
required to rebuild a resource constrained schedule when a certain amount of the latter has
changed: activity duration extension, activity start/finish time change, etc.
This rescheduling normally generates a different schedule in terms of activity work sequence.
The changed activity sequence occurs because current practical resource constrained
scheduling (RCS) techniques employ certain priority rules (LS, TF, FF, etc.) and the updated
activities data could affect those activity priority orders. The changed activity sequence could
force the project manager to reorganize the project at high cost and the reorganization may be
required every time the schedule is updated.
Regardless of the disadvantages, construction professionals are heavy users of the CPM and
RCS techniques assisted by project management software. A traditional CPM schedule is not
realistic because some resources are highly limited in practice. A resource constrained CPM
(RCPM) technique that takes advantage of both CPM and RCS techniques will be presented
in addition.
BABNIK, Ž. 2006. Resource constrained scheduling - a case study using Primavera Project Planner 3.1 19 Graduation Thesis - UNI. Ljubljana, UL, FCEG, Civil engineering, Division of Municipal Economics
RCPM:
• considers resource availability, which makes a schedule more realistic,
• correctly identifies floats and the critical path,
• provides a stable schedule in a certain required level through the project duration.
2.9.2.1 Reasons for RCPM Once resource constraints are applied, the activity sequence relies not only on technological
relationships, but also on resource dependencies. Since the resource dependency is omitted in
the backward pass, the late time of an activity that has resource dependency can be greater
than the real values. If the late time of an activity is greater than the real value, the TF shall be
increased by the difference. Furthermore, the increased TF or the late time could affect
predecessors, depending on the network condition. Then, most critical activities become non-
critical.
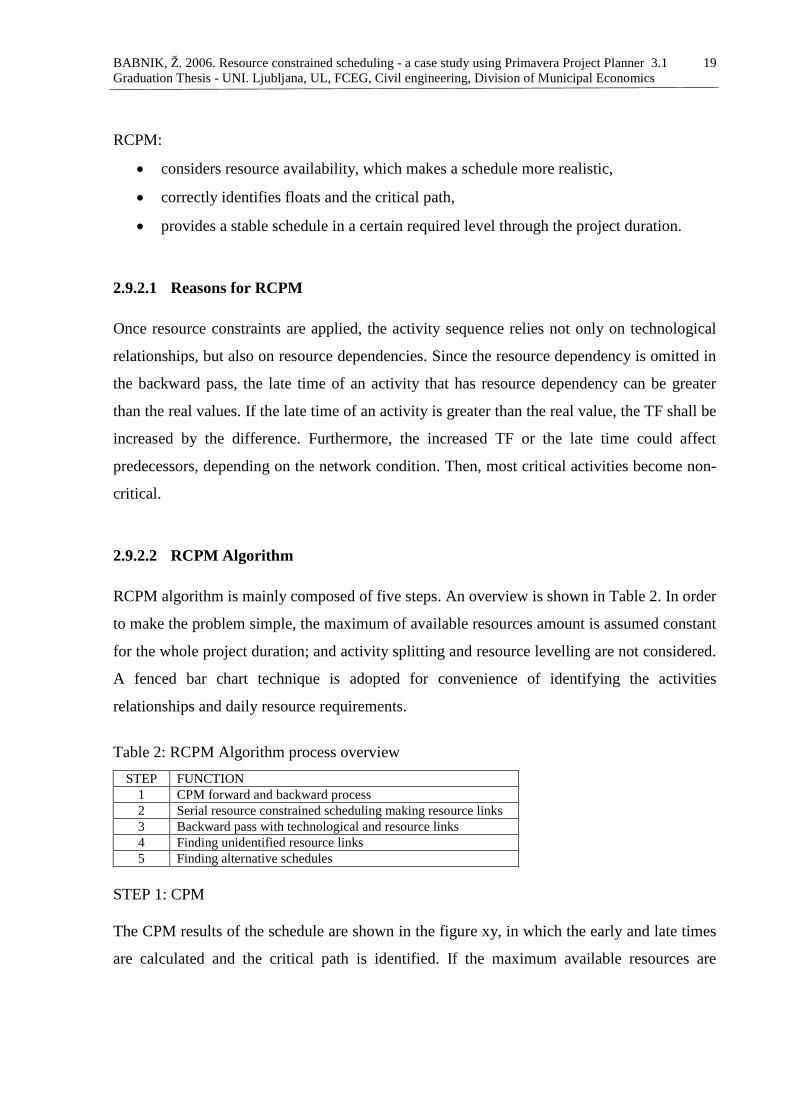
2.9.2.2 RCPM Algorithm RCPM algorithm is mainly composed of five steps. An overview is shown in Table 2. In order
to make the problem simple, the maximum of available resources amount is assumed constant
for the whole project duration; and activity splitting and resource levelling are not considered.
A fenced bar chart technique is adopted for convenience of identifying the activities
relationships and daily resource requirements.
Table 2: RCPM Algorithm process overview
STEP FUNCTION 1 CPM forward and backward process 2 Serial resource constrained scheduling making resource links 3 Backward pass with technological and resource links 4 Finding unidentified resource links 5 Finding alternative schedules
STEP 1: CPM The CPM results of the schedule are shown in the figure xy, in which the early and late times
are calculated and the critical path is identified. If the maximum available resources are

BABNIK, Ž. 2006. Resource constrained scheduling - a case study using Primavera Project Planner 3.1 20 Graduation Thesis - UNI. Ljubljana, UL, FCEG, Civil engineering, Division of Municipal Economics
assumed as two for resource A (R(A)) and one for resource B (R(B)), days 3 – 6 are over the
given resource limit. Now an RCS technique is required to remove these resource overuses.
1 8765432
R(B)
7
11 15141312
0 1100110 01 0 0000
R(A) 0 1233330 00 0 0000
E (0,1)
82
9
72
3
42
9
D (1,0)
0
A (0,1)
20
2 4 9
C (1,0)
2
2
6
6
6
6
9
9
B (1,0) F (0,1)
9
9
11
11
G (0,0)
LS
Act (R(A), R(B))
EFES
LF
Time (days)109
Figure 7: The CPM analysis of the schedule
STEP 2: SERIAL METHOD WITH CREATING RESOURCE CONSTRAINED LINK
Dependency caused by the resource transfer can be treated as a logical relationship in the
CPM. At this point, one or more resource links can be created between the current activity
and all or some of the just completed activities the time extension of which directly affects the
start time of the current activity due to a resource limit. If there is no such completed activity,
then a resource link can be created for an activity according to various priority rules. For
simplicity, the priority is given to the activity that has the highest resource requirement
(combined amount for multiple resource types). A tie can be resolved by the smaller activity
identification. Once resource links are created, any time extension of the predecessor will
delay the start time of the current activity.
In the example schedule, activities A, B and D can be scheduled as indicated by the original
CPM schedule. Activity C should be delayed until enough resources are available because it
cannot be scheduled as originally due to the limit of R(A). Activity C can start right after
activity B's completion, which is the earliest possible start time for activity C. Since activity
B's completion releases one of R(A), which is enough for activity C's performance for the
whole duration, a resource link can be added between activities B and C as shown in the

BABNIK, Ž. 2006. Resource constrained scheduling - a case study using Primavera Project Planner 3.1 21 Graduation Thesis - UNI. Ljubljana, UL, FCEG, Civil engineering, Division of Municipal Economics
figure 8. Activities F, E and G do not encounter any resource limit, so they can be scheduled
as in the initial relationship. The figure 8 is showing that no activity can start earlier than the
current start time and that overall duration has been extended by two days, due to the chain
effect of activity C's delay.
As a result of step 2, resource links are created and the scheduled start and end times of an
activity automatically become ES and LF, but LS and LF are still not identified at this step.
1 8765432 109
R(B)
11 15141312
0 1100110 01 0 0000
R(A) 0 2222220 11 1 0000
E (0,1)
82
11
42
D (1,0)
A (0,0)
60
C (1,0)
2 6 6 9
B (1,0) F (0,1)
11 13
G (0,0)
Act (R(A), R(B))
EFES
Time (day)
2
Figure 8: Creating a resource constrained link
STEP 3: BACWARD PROCESS A backward pass is required to find LS and LF considering both the resource links and the original technological relationship. The figure 9 displays results such as late times and the critical path.

BABNIK, Ž. 2006. Resource constrained scheduling - a case study using Primavera Project Planner 3.1 22 Graduation Thesis - UNI. Ljubljana, UL, FCEG, Civil engineering, Division of Municipal Economics
1 8765432 9
R(B)
11 15141312
0 1100110 01 0 0000
R(A) 0 2222220 11 1 0000
E (0,1)
82
11
42
D (1,0)
A (0,0)
60
C (1,0)
2 6 6 9
F (0,1)
11 13
G (0,0)
Act (R(A), R(B))
EFES
Time (day)
2
2 6 6 11
116 11 130 2
115
119LFLS
B (1,0)
10
Figure 9: Schedule in step 3
STEP 4: FINDING MORE RESOURCE LINKS In the result of step 3, the TF of a critical activity is obvious in that any delay of it will extend
the project completion time. This means we do not need to check it anymore for its correct
float. Activity for which TF is other than zero may not has its full floats if there is any
resource constraint for the TF period. In the figure 9, for instance, activity E cannot have its
full TF because activity F requires one of resource B and the availability of this resource is
only one. This is the case because resource links in step 2 are created only when the
prescheduled activities release resources with their completion, enabling the delayed activity
to start immediately. In other words, there are no resource links between activities, if the
completion of the pre-scheduled activities does not immediately affect the delayed activity’s
start, although the released resources are transferred to the delayed activity. In order to find
those unidentified resource dependencies, every activity of nonzero TF will be checked by
delaying the completion time day by day, and a resource link will be created between
activities that have resource dependency. In the schedule, activities D, E, and F have total
floats of 3, 7, and 2, respectively. Activities D and F can have their full TF, but activity E can
not have its full TF due to the limit of resource B and activity F. Hence, a resource-
constrained link between activities E and F is created as shown in the figure 10.
This final schedule may be acceptable within the current known conditions such as resource
limit, technological dependency, equipment condition, material delivery time, etc., but the
RCPM algorithm continues for one more step in order to find alternative schedules. Due to
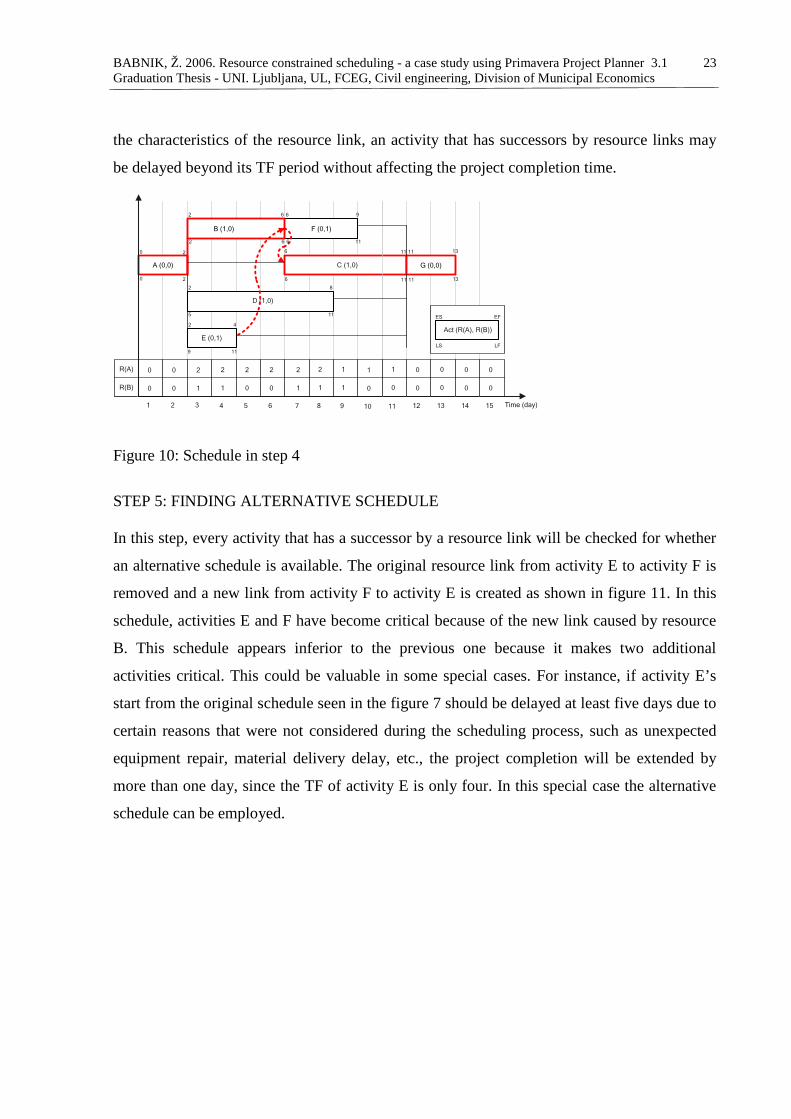
BABNIK, Ž. 2006. Resource constrained scheduling - a case study using Primavera Project Planner 3.1 23 Graduation Thesis - UNI. Ljubljana, UL, FCEG, Civil engineering, Division of Municipal Economics
the characteristics of the resource link, an activity that has successors by resource links may
be delayed beyond its TF period without affecting the project completion time.
1 8765432 109
R(B)
11 15141312
0 1100110 01 0 0000
R(A) 0 2222220 11 1 0000
E (0,1)
82
11
42
D (1,0)
A (0,0)
60
C (1,0)
2 6 6 9
F (0,1)
11 13
G (0,0)
Act (R(A), R(B))
EFES
Time (day)
2
2 6 6 11
116 11 130 2
115
119LFLS
B (1,0)
Figure 10: Schedule in step 4
STEP 5: FINDING ALTERNATIVE SCHEDULE In this step, every activity that has a successor by a resource link will be checked for whether
an alternative schedule is available. The original resource link from activity E to activity F is
removed and a new link from activity F to activity E is created as shown in figure 11. In this
schedule, activities E and F have become critical because of the new link caused by resource
B. This schedule appears inferior to the previous one because it makes two additional
activities critical. This could be valuable in some special cases. For instance, if activity E’s
start from the original schedule seen in the figure 7 should be delayed at least five days due to
certain reasons that were not considered during the scheduling process, such as unexpected
equipment repair, material delivery delay, etc., the project completion will be extended by
more than one day, since the TF of activity E is only four. In this special case the alternative
schedule can be employed.

BABNIK, Ž. 2006. Resource constrained scheduling - a case study using Primavera Project Planner 3.1 24 Graduation Thesis - UNI. Ljubljana, UL, FCEG, Civil engineering, Division of Municipal Economics
1 8765432 109
R(B)
11 15141312
0 1100000 11 1 0000
R(A) 0 2222220 11 1 0000
E (0,1)
82
11
119
D (1,0)
A (0,0)
60
C (1,0)
2 6 6 9
F (0,1)
11 13
G (0,0)
Act (R(A), R(B))
EFES
Time (day)
2
2 6 6 11
116 11 130 2
115
119LFLS
B (1,0)
Figure 11: Alternative schedule in step 5
2.9.2.3 RCPM System
A prototype system has been developed to implement the proposed algorithm using Visual
Basic 6.0, Visual C++ 6.0 and Ra (P3 API). Most functions to implement the RCPM
procedures are written in C++ and built into a DLL file. The Visual Basic part reads required
data directly from P3 and executes the procedures communicating with functions in the DLL
file.
On the other hand planners use RCPM scheduling when they recognize the resource
constrained problem, with dummy activities and their relationships. It is also possible to
define the dependency in resource constrained scheduling in that way.
2.9.3 Methods and techniques for Resource scheduling
During the time analysis we obtained the early and late start and finish times of the activities.
During these procedures no resources were assigned to the activities. Nevertheless, the
completion of individual tasks requires different resources in practice – manpower, machines,
materials and subcontractors. The limitations of these resources can influence the start and the
finish of activities and sometimes the duration of the project. On the other hand, even if the
resource requirements for projects are far below the limitations, a good arrangement of the
activities can cut the peak resource requirement and thus makes the project more efficient. No

BABNIK, Ž. 2006. Resource constrained scheduling - a case study using Primavera Project Planner 3.1 25 Graduation Thesis - UNI. Ljubljana, UL, FCEG, Civil engineering, Division of Municipal Economics
doubt, systematic and optimal planning of resource demand can cut the project cost and its
importance is therefore growing.
The heuristic procedures that optimize resource handling procedures can be divided into two
groups. One, when the assumption of limited resources has to be satisfied. Procedures that
arrange activities in this way can lengthen the project duration that has been gained from the
ordinary time analysis. These kinds of procedures are called resource allocation procedures.
Procedures of the second group can not change the duration of the project. In these cases
more efficient resource utilization is the mail goal. These methods are known as resource
levelling. Procedures that allow the change of project duration are the topic of Resource
Allocation (limited resources).
Terms of allocation and levelling and are widely used in the above mentioned sense, but other
definitions are also used in practice. An often used approach is the one within which the term
levelling covers all the resource optimization procedures and the term of resource allocation
stands for the assignment of resources to the tasks of the project. The term resource allocation
is used as a method that helps to utilize resources on the most efficient level in a way that
allows the lengthening of the duration of the project. However, to avoid confusion, the term
allocation with limited resources or levelling by keeping the project duration will always be
indicated in the text.
2.9.3.1 Using optimal procedure Both types of allocation methods are optimization problems in mathematical sense. The
planner wants to make a schedule that satisfies all the resource limitations but causes the least
increase in project duration in case of resource allocation (limited resources). When the
project duration is fixed he or she wants to level the schedule so that the peak resource
requirements will be as small as possible. Operational research offers a wide variety of
different optimization techniques. Mathematical models for allocation and levelling can be
created that can be later solved by Linear Programming, Integer Programming or other
methods, e.g. different kinds of enumeration. The application of these models cannot be found
in practice. The reason for this is that these models work with so many variables – even in the

BABNIK, Ž. 2006. Resource constrained scheduling - a case study using Primavera Project Planner 3.1 26 Graduation Thesis - UNI. Ljubljana, UL, FCEG, Civil engineering, Division of Municipal Economics
case of a relatively small network. That makes the computational process very slow. The
other side of the coin is that engineers know well that due to the bias in duration and resource
estimation the optimal solution is just fiction and a close optimal solution from the practical
point of view can be as good as a real optimum from the mathematical point of view.
According to the above mentioned reasons, algorithms based on heuristic rules are instead of
being based on the exact optimization procedures, based on practice.
2.9.3.2 Resource levelling
Resource levelling is also known as levelling within the float or smoothing is used when
resource limits are far beyond the requirements, therefore they do not have any influence on
the duration of the project. It is also used when the amounts of required resources are based
on estimations and therefore a resource profile that is closed to the planned resource profile
can be satisfactory. The efficient utilization of resources, that is, a better distribution of them
can make the project more successful. The ideal resource profiles can be seen in the figure xy.
Generally speaking, it can be stated that the closer the resource profile is to the ideal form, the
lower the overall cost will be. Every sudden rise in the resource histogram, especially after the
peak, is usually solved by hiring extra personnel, which results in extra costs.
Figure 12: Ideal resource profiles
Resource levelling procedures are based on the idea of rescheduling activities within the limit
of the early start and late finish times. A heuristic approach that uses the same thought will be
presented below.
time
Resource unit / day
time
Resource unit / day

BABNIK, Ž. 2006. Resource constrained scheduling - a case study using Primavera Project Planner 3.1 27 Graduation Thesis - UNI. Ljubljana, UL, FCEG, Civil engineering, Division of Municipal Economics
For the sake of simplicity it is assumed that there are no maximal types of precedence
relationships in the network for which levelling is required. Finally, it has to be mentioned
that the desired resource profile to which the resources will be smoothed can take any form.
This depends on the planner.
Table 3: The legend of notation used in algorithm
N set of activities
A set of precedence relationships
N number of activities in the network
I notation of an activity, i=1…n
S start activity; no precedence relation runs into this activity
T finish activity; no precedence relationships runs out of this activity
iτ duration time of activity i
f the thf day of the project
iR required amount of resource per time unit for activity i
fSR value of the resource histogram on the day f
iEFES / earliest start/finish of activity i
iLFLS / latest start/finish of activity i
fG the desired amount of resource on the thf day
V ( ) ( )pfSRG ff ...0;2
=∑ − the value of deviation between the
desired and the actual resource diagram
ii FS / scheduled start/finish of activity i
iD the maximal possible shift for activity i
The algorithm is based on the observation that activities have to be rescheduled within the
limits of their total or free float. The reverse order of the time analysis has to be followed. An
activity can be taken into account if all the successor activities have been rescheduled. This
implies that the algorithm has to be started with the finish activity. The activity has to be
shifted to where it gives the smallest value of V. The iteration is finished when all the
activities have been taken into account. In case of changes of any start time the whole

BABNIK, Ž. 2006. Resource constrained scheduling - a case study using Primavera Project Planner 3.1 28 Graduation Thesis - UNI. Ljubljana, UL, FCEG, Civil engineering, Division of Municipal Economics
procedure can be repeated. To start the levelling, time analysis has to be performed and the
resource histogram arranged for early starts has to be done.
2.9.3.2.1 Levelling algorithm
Figure 13: Levelling algorithm
Figure 14: Time analysis of example project to illustrate the resource levelling procedure
Step 0. perform a time analysis. Let ii ESS = and ii EFF = ∀ Ni∈ Step 1. REPEAT There_were_changes=false REPEAT Take an activity i of which all the successors are being rescheduled Determine the amount of the possible shift ( iD ) for activity i
[ ;)( ikijj SSSzS −−
;)( ikijj SSFzF −−
;)( ikijj FFSzS −−
ikijj FFFzF −− )( ] ∀ ( )[ ] Akij ∈ Shift i by day to day in the defined interval and calculate V after each shift. Where V takes its minimum value defines the start of i. If the start of i has been changed THEN there_were_changes=true
UNTIL i=s UNTIL there_were_changes=false
SS1
FF0 SS0 SS1 Name: A Dur: 3 days ES: 0 EF: 3 LS: 0 LF: 3 Res: 4 men
Name: D Dur: 1 day ES: 1
EF: 2
LS: 3 LF: 4 Res: 2 men
Name: E Dur: 4 days ES: 1 EF: 5 LS: 6 LF: 10 Res:
Name : F Dur: 6 days ES: 2 EF: 8 LS: 4 LF: 10 Res: 3 men
Name: C Dur: 4 days ES: 0 EF: 4
LS: 5 LF: 9 Res: 4 men
Name: B Dur: 8 days ES: 3 EF: 8 LS: 3 LF: 8
2 men
Name: G Dur: 10 days ES: 8 EF: 10 LS: 8 LF: 10 Res: 5 men
Res:
3 men
FF0 SS1
FS0 FS0
FF0
TF: 0
TF: 0 TF: 0
TF: 13
TF: 16 TF: 16
TF: 13
BABNIK, Ž. 2006. Resource constrained scheduling - a case study using Primavera Project Planner 3.1 29 Graduation Thesis - UNI. Ljubljana, UL, FCEG, Civil engineering, Division of Municipal Economics
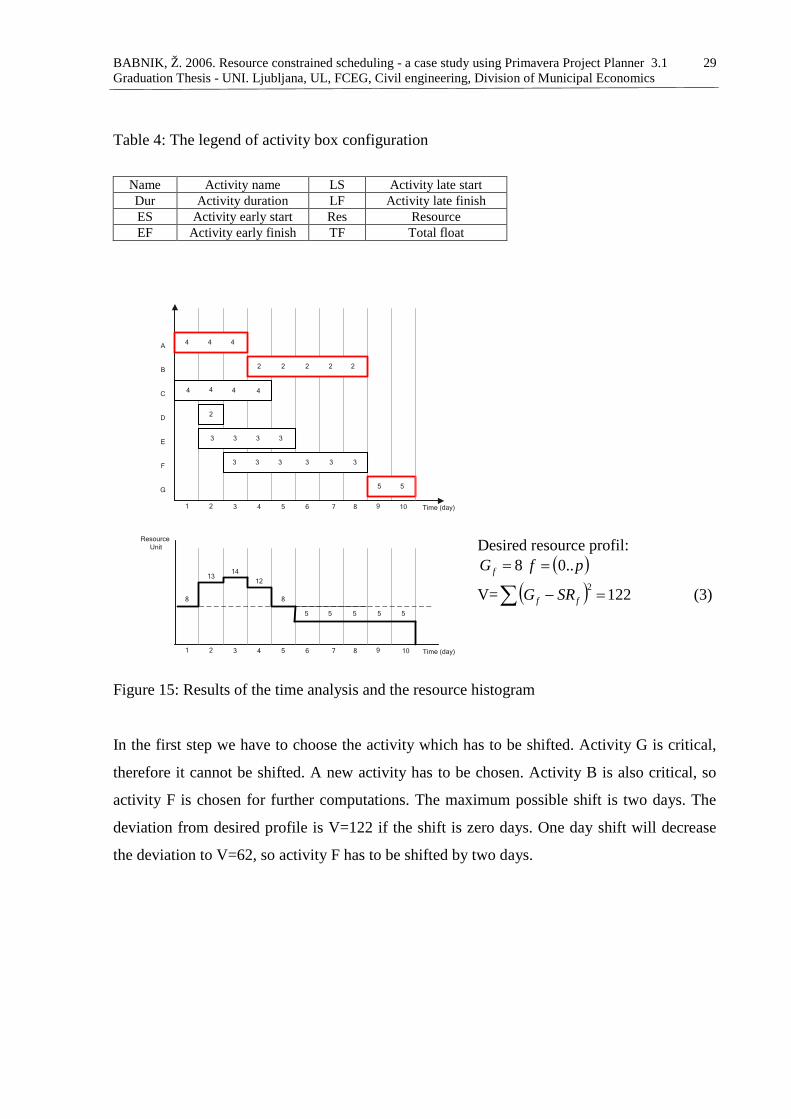
Table 4: The legend of activity box configuration
Name Activity name LS Activity late start Dur Activity duration LF Activity late finish ES Activity early start Res Resource EF Activity early finish TF Total float
1 8765432 109
G 5 5
A
B
C
D
E
F
22222
44 4
1 8765432 109
44 4 4
2
33 3 3
33 3 333
8
12
1413
8
55555
Time (day)
Time (day)
Resource Unit
Figure 15: Results of the time analysis and the resource histogram
In the first step we have to choose the activity which has to be shifted. Activity G is critical,
therefore it cannot be shifted. A new activity has to be chosen. Activity B is also critical, so
activity F is chosen for further computations. The maximum possible shift is two days. The
deviation from desired profile is V=122 if the shift is zero days. One day shift will decrease
the deviation to V=62, so activity F has to be shifted by two days.
Desired resource profil: 8=fG ( )pf ..0=
V= ( ) 1222=−∑ ff SRG (3)

BABNIK, Ž. 2006. Resource constrained scheduling - a case study using Primavera Project Planner 3.1 30 Graduation Thesis - UNI. Ljubljana, UL, FCEG, Civil engineering, Division of Municipal Economics
1 8765432 109
A 5 5
a
F
E
D
C
B
44 4
1 8765432 109
44 4 4
2
33 3 3
33 3 333
8
12
1413
8
55555
1 8765432 109
8
121113
8
5
8
555
1 8765432 109
89
1113
8 88
555
Time (day
Time (day)
Time (day)
Time (day)
22222
ResourceUnit
ResourceUnit
ResourceUnit
Figure 16: Resource levelling; examining activity F
We continue with rescheduling activities. Activity E gets the shift for three days and activity
D for two days. There is no need for rescheduling activity C.
No shift on F: 8=fG ( )pf ..0=
V= ( ) 1222=−∑ ff SRG (4)
1 day shift on F: 8=fG ( )pf ..0=
V= ( ) 862=−∑ ff SRG (5)
2 days shift on F: 8=fG ( )pf ..0=
V= ( ) 622=−∑ ff SRG (6)
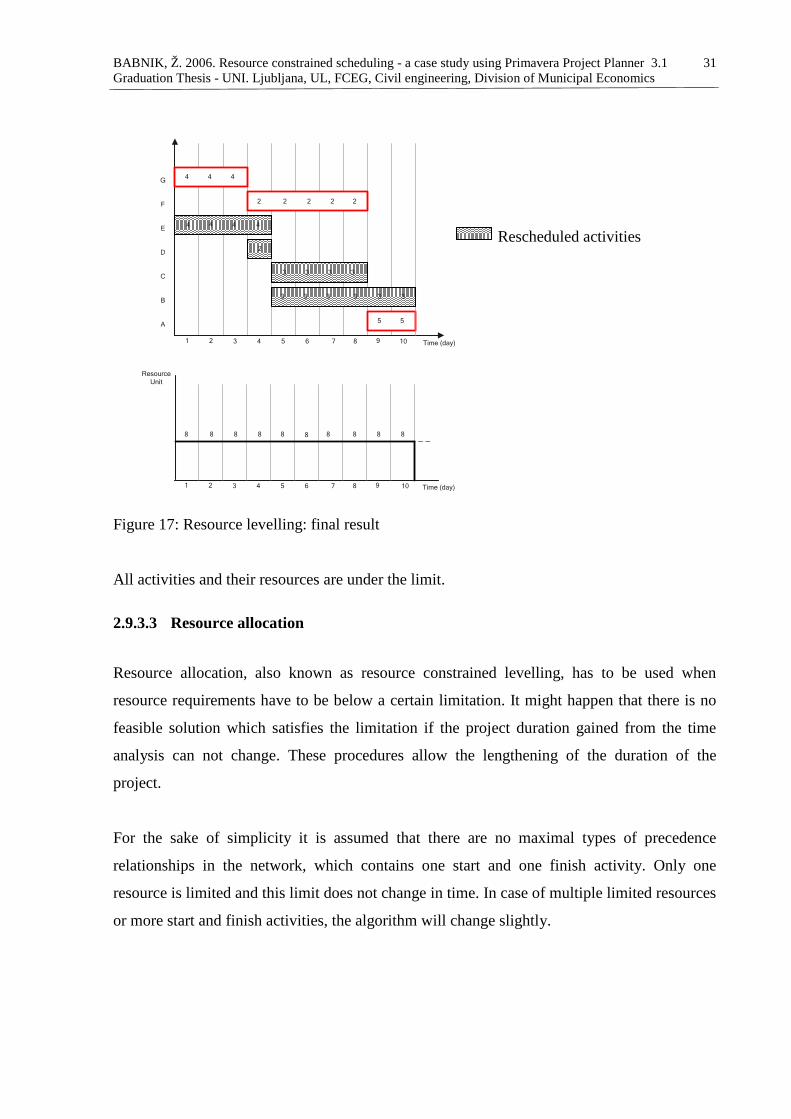
BABNIK, Ž. 2006. Resource constrained scheduling - a case study using Primavera Project Planner 3.1 31 Graduation Thesis - UNI. Ljubljana, UL, FCEG, Civil engineering, Division of Municipal Economics
1 8765432 109
A 5 5
G
F
E
D
C
B
44 4
1 8765432 109
44 4 4
2
33 3 3
33 3 333
88 88888888
Time (day)
Time (day)
22222
ResourceUnit
Figure 17: Resource levelling: final result
All activities and their resources are under the limit.
2.9.3.3 Resource allocation
Resource allocation, also known as resource constrained levelling, has to be used when
resource requirements have to be below a certain limitation. It might happen that there is no
feasible solution which satisfies the limitation if the project duration gained from the time
analysis can not change. These procedures allow the lengthening of the duration of the
project.
For the sake of simplicity it is assumed that there are no maximal types of precedence
relationships in the network, which contains one start and one finish activity. Only one
resource is limited and this limit does not change in time. In case of multiple limited resources
or more start and finish activities, the algorithm will change slightly.
Rescheduled activities

BABNIK, Ž. 2006. Resource constrained scheduling - a case study using Primavera Project Planner 3.1 32 Graduation Thesis - UNI. Ljubljana, UL, FCEG, Civil engineering, Division of Municipal Economics
It has to be mentioned that the function describing the resource limitation can take any form,
especially if it is used in the company level in multi project environment. Subtracting the
resource requirements of a project from the company's resource pool will result in resource
limitations that can change from day to day for the rest of the projects.
Table 5: Used notations during the allocation algorithm
L Resource limit
pp Project duration (result of the allocation)
A possible solution to the resource allocation problem can be using resource levelling to
satisfy the resource limits. If the limits cannot be kept within the given project duration, then a
fictive SF (p+1) relationship has to be added to the network between the start and finish
activities. The application of this precedence relationship will increase the project duration by
one day. Now, another levelling has to be performed for this increased project duration. If the
resource requirements are still above the limits, the project duration has to be increased by
another day and new levelling, must be performed. This procedure has to be continued until
the result resource profile is below the limits.
2.9.3.3.1 Allocation algorithm The above-mentioned procedure is rather time consuming, that is why a faster algorithm is
going to be presented. It is similar to the algorithm used for the simple time analysis, but it is
just being completed with resource handling step. It is on the observation that an activity can
be arranged on the time scale if its predecessor activities are arranged, too. This implies that
the algorithm has to be started with the start activity. Once an activity has been chosen, its
start has to be calculated by its predecessors. Adding its resources to the resource histogram,
it has to be examined if the resource histogram was below the resource limit or not. If not, the
activity has to be shifted until the resource limits are satisfied.
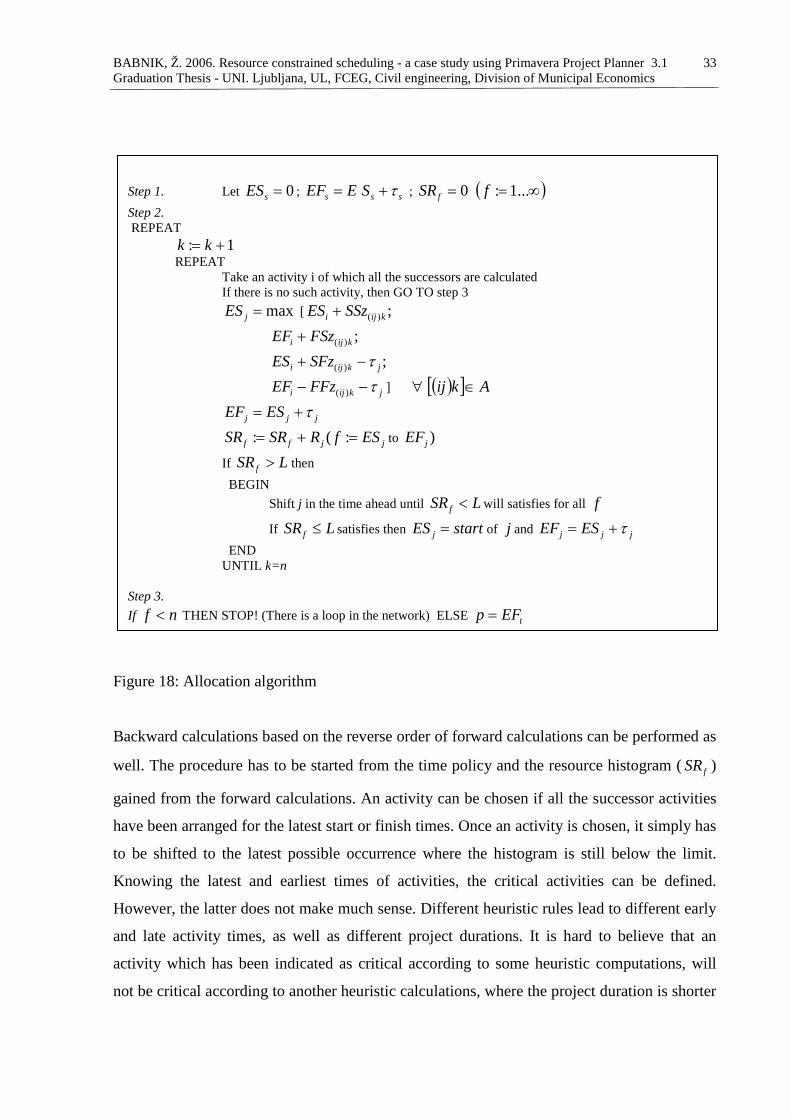
BABNIK, Ž. 2006. Resource constrained scheduling - a case study using Primavera Project Planner 3.1 33 Graduation Thesis - UNI. Ljubljana, UL, FCEG, Civil engineering, Division of Municipal Economics
Figure 18: Allocation algorithm
Backward calculations based on the reverse order of forward calculations can be performed as
well. The procedure has to be started from the time policy and the resource histogram ( fSR )
gained from the forward calculations. An activity can be chosen if all the successor activities
have been arranged for the latest start or finish times. Once an activity is chosen, it simply has
to be shifted to the latest possible occurrence where the histogram is still below the limit.
Knowing the latest and earliest times of activities, the critical activities can be defined.
However, the latter does not make much sense. Different heuristic rules lead to different early
and late activity times, as well as different project durations. It is hard to believe that an
activity which has been indicated as critical according to some heuristic computations, will
not be critical according to another heuristic calculations, where the project duration is shorter
Step 1. Let 0=sES ; sss SEEF τ+= ; 0=fSR ( )∞= ...1:f Step 2. REPEAT 1: += kk REPEAT Take an activity i of which all the successors are calculated If there is no such activity, then GO TO step 3 max=jES [ ;)( kiji SSzES +
;)( kiji FSzEF +
;)( jkiji SFzES τ−+
jkiji FFzEF τ−− )( ] ∀ ( )[ ] Akij ∈
jjj ESEF τ+=
jjff ESfRSRSR =+= :(: to )jEF
If LSRf > then BEGIN Shift j in the time ahead until LSRf < will satisfies for all f
If LSRf ≤ satisfies then startES j = of j and jjj ESEF τ+= END UNTIL k=n Step 3. If nf < THEN STOP! (There is a loop in the network) ELSE tEFp =

BABNIK, Ž. 2006. Resource constrained scheduling - a case study using Primavera Project Planner 3.1 34 Graduation Thesis - UNI. Ljubljana, UL, FCEG, Civil engineering, Division of Municipal Economics
than in the first case. Application of exact optimization methods can help a lot to solve these
theoretical problems.
The resource limited scheduling problem depicted in the figure 19 illustrates the algorithm.
The availability of the resource is limited to 4 men.
Figure 19: Time analysis of example project to illustrate the resource allocation
FS0
FS8 SS0
FS0
FS0
FF0
Name: A Dur: 2 days ES: 0 EF: 2 LS: 0 LF: 2 Res: 3 men
Name: B Dur: 3 day ES: 3
EF: 5
LS: 6 LF: 9 Res: 3 men
Name : D Dur: 2 days ES: 6 EF: 8 LS: 10 LF: 11 Res: 4 men
Name: C Dur: 2 days ES: 3 EF: 4 LS: 8 LF: 9
2 men
Name: E Dur: 2 days ES: 12 EF: 13 LS: 12 LF: 13 Res: 3 men
Res:
FS0
SS0
TF: 4
TF: 0 TF: 0
TF: 3 TF: 3

BABNIK, Ž. 2006. Resource constrained scheduling - a case study using Primavera Project Planner 3.1 35 Graduation Thesis - UNI. Ljubljana, UL, FCEG, Civil engineering, Division of Municipal Economics
1 8765432 109
33
3
1 8765432 109
2 2
33 3
3
4
3 3
4
4 4
3A
B
C
D
E
Time (day)
ResourceUnit
Time (day)
It can be seen that the resource limit makes this time policy non-feasible. The result of the
resource allocation can be seen in the figure 20.
1 8765432 109
33
3
1 8765432 109
2 2
33 3
2
3
4
4 4
3 A
B
C
D
E
11
3
11
ResourceUnit
Time (day)
Time (day)
Figure 21: Results of resource allocation procedure
Figure 20: Results of time analysis and resource histogram

BABNIK, Ž. 2006. Resource constrained scheduling - a case study using Primavera Project Planner 3.1 36 Graduation Thesis - UNI. Ljubljana, UL, FCEG, Civil engineering, Division of Municipal Economics
The calculation starts with scheduling activity A. The resource requirement of the activity has
been added to the resource histogram. The only activity for which all predecessors are
scheduled is activity B, therefore activity B is chosen for further computations. Based on its
predecessors, it can be started on day 2 and finished on day 5. Activity C is the next in the
queue. Based on its predecessors, it can be started on day 2, but a conflict arises when adding
its resources to the histogram. To solve this resource conflict, its start has to be shifted to day
5 and it will be finished on day 7. Activity D can be chosen for further computations.
According to the previous shift in the start and finish of activity C, activity D can start on day
7. Finally, activity E can start on day 9. The new project duration that satisfies the resource
limitation is 11 days.
Remarks to the algorithm:
It is possible that more activities can be taken into account at the same time. In this case the
scheduler can decide what activity should be next. The following rules can be applied for
choosing among the activities:
• Choose the activity with the greatest resource demand.
• Choose the activity with the greatest total float.
• Choose the activity that has the minimum early start time.
• Choose the activity that has the maximum late start time.
• Choose the activity with the smallest priority.
It can never be known which rule gives the better solution. Rules that perform well in some
cases can perform poor in others.

BABNIK, Ž. 2006. Resource constrained scheduling - a case study using Primavera Project Planner 3.1 37 Graduation Thesis - UNI. Ljubljana, UL, FCEG, Civil engineering, Division of Municipal Economics
2.9.3.4 Aggregation Aggregation is the simplest among the methods of scheduling the resources. It is a method of
determining the total number of resource units required on a time basis throughout the life of
the project. The most frequently used unit is a day.
The method of aggregation is created with a number of cells into which the resources are
accumulated. This table will normally have one cell for every time unit of the project or
period of interest, e.g. the next three months. Each activity of the network is then examined to
see if it uses the resources which are of interest in this exercise. The resources required for
this task are the same as in the case seen in the figure 14 and then added to the appropriate
cells in the main table. At the end of the list of activities, the contents of the table can be
printed in a variety of ways; as a table, as histogram, as bar chart or as a part of a management
report.
Table 6 : The example illustrates the method
EARLY START AGGREGATION LATE START AGGREGATION
DAY 1 2 3 4 5 6 7 8 9 10 DAY 1 2 3 4 5 6 7 8 9 10
ACTIVITY ACTIVITY A 4 4 4 A 4 4 4 B 5 5 5 5 5 B 5 5 5 5 5 C 4 4 4 4 C 4 4 4 4 D 2 D 2 E 3 3 3 3 E 3 3 3 3 F 3 3 3 3 3 3 F 3 3 3 3 3 3 G 5 5 G 5 5
TOTAL (ES) 8 13 14 15 11 8 8 8 5 5 TOTAL
(LS) 4 4 6 8 12 15 15 15 11 5
This is the basic principle of aggregation, the resource requirement being slotted into the cell
with the corresponding times of activity. In most network calculations there are two sets of
calculated time: the early times and the late times. The aggregations can be done with either
of these sets and consequently an early start aggregation or a late start aggregation is obtained.
Obtaining the two tables is useful for the project manager as an initial guide to the flexibility
that exists in the project, as well as potential loading.

BABNIK, Ž. 2006. Resource constrained scheduling - a case study using Primavera Project Planner 3.1 38 Graduation Thesis - UNI. Ljubljana, UL, FCEG, Civil engineering, Division of Municipal Economics
In the example seen in the table 6 there are two results; the first one being early start
aggregation and the second one late start aggregation.
The movement of requirement from the beginning of the project towards the end is typical of
many situations and is the key which other scheduling heuristic techniques use as an
advantage.
2.9.3.5 Cumulation The cumulation method provides a running accumulation of the resource requirements during
the life of the project. The input of this process is the output of the aggregation calculation. In
the cumulation the aggregation results are accumulated on a running basis. Using the example
of the table 6 again we get:
Table 7: Table of results of cumulation calculation
EARLY START AGGREGATION 8 13 14 15 11 8 8 8 5 5
LATE START AGGREGATION 4 4 6 8 12 15 15 15 11 5
EARLY START CUMULATION 8 21 35 50 61 69 77 85 90 95
LATE START CUMULATION 4 8 14 22 34 49 64 79 90 95

BABNIK, Ž. 2006. Resource constrained scheduling - a case study using Primavera Project Planner 3.1 39 Graduation Thesis - UNI. Ljubljana, UL, FCEG, Civil engineering, Division of Municipal Economics
1 8765432 9 Time (day)
10
20
30
40
50
60
70
80
90
100
Resource (unit)
10
Figure 22: Graph of results of cumulation calculation
The result gives the project managers the total resource usage, which can be expected from
the start of the project to any time in it. For example, by the seventh day in this simple case 77
units of resource will be required of the total 95 units.
It is even more useful, if both the early start and late start aggregation are cumulated. What
the user is given are the bounds within which normal resource usage should move during the
performance of the project. The normal use of this method is when working with costs, which
are in effect a particular form of resource. As reports of progress are obtained, the manager
can quickly determine if they are in the bounds of reasonableness by checking, whether the
figure lies within the envelope of the cumulation. This is not a fool proof test, but it can give
early warnings of possible catastrophes.
It is also used as an initial guide when management sets up a new team for a project. The
gradient of the minimum slope straight line that lies within the envelope gives an indication of

BABNIK, Ž. 2006. Resource constrained scheduling - a case study using Primavera Project Planner 3.1 40 Graduation Thesis - UNI. Ljubljana, UL, FCEG, Civil engineering, Division of Municipal Economics
the rate at which each resource will be used at the various stages of the project. In this simple
example the eight phases of start-up, main progress and completion have different resource
demands that can be seen by drawing eight lines in the envelope.
2.9.3.6 Smoothing The objective of the smoothing method is to produce a feasible schedule within the time
constrains with a uniform level of resource requirement or planned usage.
In the allocation routines it is very difficult to produce a schedule which is time limited and
where the resource requirement does not suddenly explode into unacceptable dimensions. The
smoothing procedure looks at the whole project and works within the time frames of the
project that have been set by the user. There are four steps in the cycle which repeats until all
activities have been scheduled.
• Schedule any critical activities
• Find the most important activity yet to be scheduled
• Find the best place to schedule this activity and do so
• Adjust the early and late times of the unscheduled activities to take account of this
new scheduled activity
The overall attack of this procedure is to work within the float of activities in order to find a
good place for them to be scheduled. Float can be added to all activities by increasing the
duration of the project calculated by the time analysis. Since activities with no float on them
cannot be moved, the first step is to schedule them in the time slots they need as defined by
their start and finish times. The resources which are needed to accommodate this work are
also recorded as in the aggregation process.
Once the decision has been made to work within the limits of the time frame and not to allow
automatic extensions, there are three items which measure to some extent the importance of
the activity, amount of work to be done (TW) and the float remaining (FR) or the flexibility in

BABNIK, Ž. 2006. Resource constrained scheduling - a case study using Primavera Project Planner 3.1 41 Graduation Thesis - UNI. Ljubljana, UL, FCEG, Civil engineering, Division of Municipal Economics
choosing a time slot for this task to be scheduled. The latter two items are simple numeric
calculations and so a computer program can easily produce a single number which can be
formulated as:
FRTWF = (7)
The activity with the largest factor of this kind has either a lot of work or very little flexibility
and is sifted from those that need to be scheduled. The complication of the conflicts caused by
multiple resources will be touched on later.
Having selected an activity to schedule, it is necessary to find the best place to put it there.
This is not as difficult as it seems, for the many managers when confronted with the situation
of this partial schedule intuitively guess what to do. The best place is the one where the
resources utilization to date is the lowest within the span of the early start and late finish times
of this activity. This is shown in the figure 23.
1 8765432 9 11 141312 Time (day)
ACTIVITY
100
Resource Unit
10
Figure 23: Scheduling and activity in smoothing

BABNIK, Ž. 2006. Resource constrained scheduling - a case study using Primavera Project Planner 3.1 42 Graduation Thesis - UNI. Ljubljana, UL, FCEG, Civil engineering, Division of Municipal Economics
PM software cannot view the profile in the way that the project schedule does in order to
deduce the slot in which to schedule the activity. The only automated approach is to try the
activity in every feasible position and make a judgement on how good the result is. The
simplest statistical test is to take the sum of the squares of the resource requirements in this
time span for each possible schedule slot and compare them. The best, that is the lowest, or if
two or more are the same, the earliest is then selected as the schedule for this particular
activity. The effect of this sum of squares test is to force the procedure to avoid any peaks in
the resource profile if possible and to prefer to fill in the valleys.
It is easy to create an image when there is only one resource to manipulate but in real life
there can be many associated with the project. A method needs to be devised to separate
conflicts that arise when resource A needs to be in one slot and resource B would prefer to be
in a different one. The easiest way out is to use qualitative ranking of the resources. By this,
some of the problems of relative importance to electricians and plumbers can be avoided. If
this approach is adopted, then all tasks with the highest priority resource are scheduled before
looking at any of the others.
This seems arbitrary, but it is not too far away from the way a person would work. It opens
the door for easy production of alternative schedules when the administrator is insured of the
key resource as far as the project is concerned. In general terms it will be the one doing the
most work within the longest time spam, but it may not be. It almost certainly will not be the
best paid or the most costly resource. The other item of interest with this procedure, as
compared to allocation methods, is that a prediction of the final resource level is not required.
2.10 Earned Valued Analysis
The earned value analysis (EVA) in its various forms is the most commonly used in one in the
method of performance measurement controlling process. The Cash flow chart presented in
chapter 4.6.2.3. is the base for EVA, which integrates scopes, cost (or resource) and schedule
measures to help the project management team assess project performance. The earned value
(EV) involves calculating three key values for each activity:

BABNIK, Ž. 2006. Resource constrained scheduling - a case study using Primavera Project Planner 3.1 43 Graduation Thesis - UNI. Ljubljana, UL, FCEG, Civil engineering, Division of Municipal Economics
• The planned value (PV) is the portion of the approved cost estimate planned to be
spent on the activity during a given period.
• The actual cost (AC) is the total of costs incurred in accomplishing work on the
activity during a given period. The AC must correspond to whatever was budgeted for
the PV and the EV (e.g. direct hours only, direct costs only, or all costs including
indirect costs).
• The EV is the value of the work actually completed – the budgeted cost of work
performed.
These three values are used in combination in order to provide measures of whether or not a
working task is being accomplished as planned. The most commonly used measures are the
cost variance (CV) and the schedule variance (SV).
ACEVCV −= (8)
PCEVSV −= (9)
These two values, the CV and the SV, can be converted to efficiency indicators to reflect the
cost and schedule performance of any project. The cost performance index (CPI) is the most
commonly used cost - efficiency indicator.
ACEVCPI = (10)
The cumulative (the sum of all individual EV budgets divided by the sum of all individual
ACs) is widely used to forecast the project's costs at completion. Also, the schedule
performance index (SPI) is sometimes used in conjunction with the CPI to forecast the project
completion estimates.
PVEVSPI = (11)
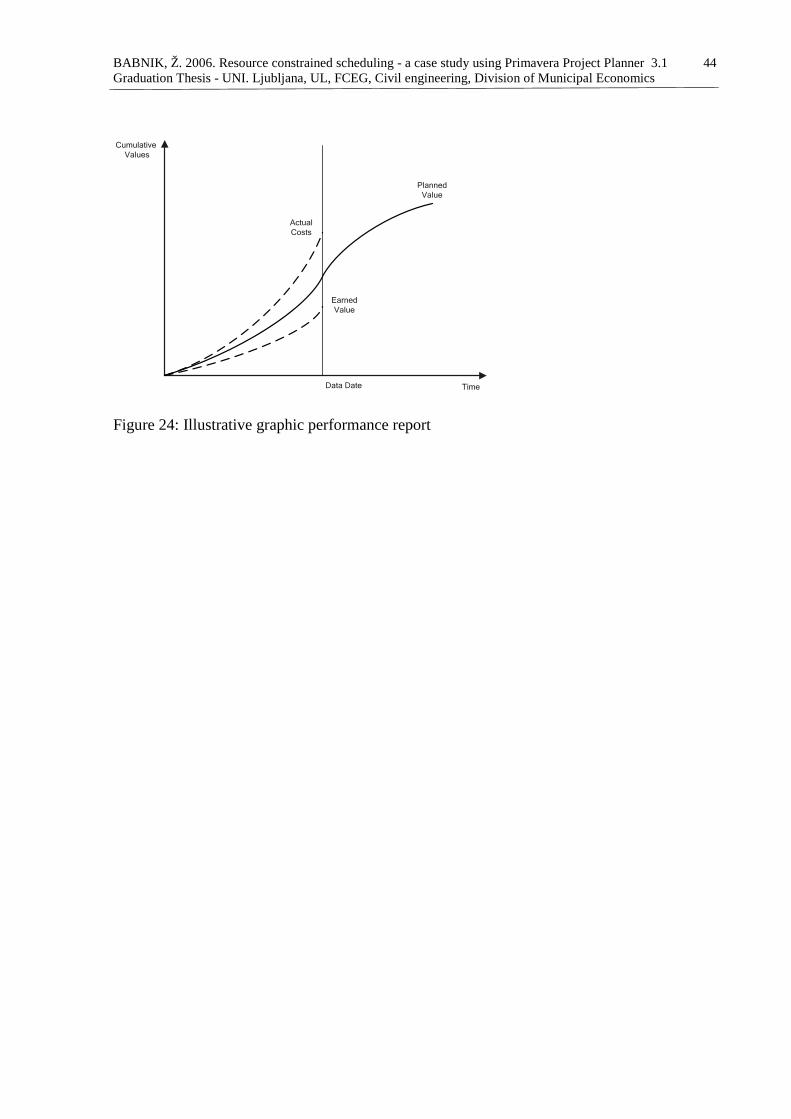
BABNIK, Ž. 2006. Resource constrained scheduling - a case study using Primavera Project Planner 3.1 44 Graduation Thesis - UNI. Ljubljana, UL, FCEG, Civil engineering, Division of Municipal Economics
Data Date Time
Planned Value
Earned Value
Cumulative Values
ActualCosts
Figure 24: Illustrative graphic performance report

BABNIK, Ž. 2006. Resource constrained scheduling - a case study using Primavera Project Planner 3.1 45 Graduation Thesis - UNI. Ljubljana, UL, FCEG, Civil engineering, Division of Municipal Economics
3 A CASE STUDY OF RESOURCE SCHEDULING
3.1 Introduction in a case study
The main objective of the Project Management Centre (PMC) at the Istanbul Technical
University (ITU) is to gain international recognition as a centre of excellence in topics of
project and construction management in both theoretical and practical applications through
teaching, training, research and development and by providing the highest level of expert
service to business practices. PMC also provides the construction management service for the
needs of ITU.
After searching for the most suitable schedule, I decided to analyse the schedule of Molecular
Biology Building (MBB). The schedule was prepared while attending a master programme. It
was based on construction management at PMC in ITU, its author being Ebru Baykal, a
master student in the academic year 2003/2004. All calculations, quantities and assigned
resources in the schedule were prepared by Ebru and show the Turkish construction
characteristics. The schedule is not particularly complex and the presentation of resource
constrained scheduling tools and techniques it is clear.
3.2 Presentation on the Technical University's Molecular Biology Building in Maslak
Campus
This centre was designed to be the heart of the bio-technology and gene projects of Turkey.
The centre with its laboratories, research and development facilities, as well as technological
equipment serves both to the ITU Molecular Biology and Genetic Department's educational
activities and to the power of Turkish research and development in international technology
interface.
The building was designed to have a specific character in campus. In addition, geometry,
interior space use and details are kept on minimum, while contemporary needs are being

BABNIK, Ž. 2006. Resource constrained scheduling - a case study using Primavera Project Planner 3.1 46 Graduation Thesis - UNI. Ljubljana, UL, FCEG, Civil engineering, Division of Municipal Economics
responded to. Integrated interior space design and transparent surface arrangements allow
users to come together easily in order to have productive meetings.
On the ground floor there are coffee rooms, the library and service units. On the first floor
there are classrooms, the computer lab and club rooms. On the second, third and fourth floor
there are laboratories and on the fifth floor, there are administration and support units, as well
as the end multi-purpose hall with suitable equipment to be used during various meetings and
events.
In the basement there are labs and technical units. The basement, ground and first floor are
visually connected by an interior space. The stairs and the elevator are placed parallel to the
Büyükdere avenue and being three-dimensional, they surround the mass as a transparent shell.
This shell in rectangular geometry serves both to separate the laboratory units and office
units, as well as to define the area where the technical equipments is placed on the roof. The
building is connected to the Arts and Sciences Faculty by means of a sub-level passage.
Table 8: Main data about MBB
Main function Laboratories and Education Design Project Gülsün Sağlamer, Meltem Aksoy, Pelin Dursun Korkmaz Investor Istanbul Technical University Static project TEM Muhendislik Musavrlik Ltd. Sti. Mechanic project MECON Yapi Endustriyel Muh. Taah. ve Tic. Ltd. Sti Electric project ROTA-TEK Muhendislik Elektrik Ins. San. Tic. Ltd. Sti Main contractor Sibel Gurcu Project management ITU Project Management Centre, Attila Dikbas, Isilay Akkoyun Construction Area 3756 m2 Main structure Steel Frame Date of design Completion 1. 11.2003 Date of construction start 20.11.2003 Date of construction finish 1.8.2004 Grant Dr. Y. Müh. Orhan Öcalgiray Costs of the project 2 Million USD

BABNIK, Ž. 2006. Resource constrained scheduling - a case study using Primavera Project Planner 3.1 47 Graduation Thesis - UNI. Ljubljana, UL, FCEG, Civil engineering, Division of Municipal Economics
Figure 25: Photos of MBB
3.3 General information about the real case schedule of MBB using P3
The schedule has got 163 activities, 51 of which are lying on the critical path. There are 321
relationships between the activities, which are distributed as per the activity work breakdown
structure. The list of activities can be seen in the appendix A. Appendix B shows the data of 80
different resources entered. The resources have been shown by labour values and have been
BABNIK, Ž. 2006. Resource constrained scheduling - a case study using Primavera Project Planner 3.1 48 Graduation Thesis - UNI. Ljubljana, UL, FCEG, Civil engineering, Division of Municipal Economics
distributed to the relevant activities with normal distribution as per the activity distributions. The
budget for the activities has also been distributed in the same manner.
The values of the resources and their unit costs show the united and weighed costs of the relevant
activities with all the material costs and labour costs divided by the budgeted cost of the relevant item.
This approach brings smart and condensed information regarding the activities, budgeted labour and
budgeted costs, regardless of the material quantities and has been chosen as the general intention of
the project management. This approach is used in order to sub contract the works on lump sum basis
with a fixed price, have strict control of the labour at the site and the budgeted cost in the planning
phase during the execution of the work.
3.4 Start and execution of the work
After site mobilization of the structural contractor, the earth works with excavation and back
filling were started. After the earth works, structural works followed with formwork,
reinforcement and concrete for foundation. Then structural and water insulation works for the
basement started. The building of a full brick wall was planned to start right after the
placement of protection concrete. After finishing the basement, steel structure works started
with the erection of the first floor columns, the installation of main and sub beams and the
montage of the trap slab surface. Then the installation of the connection plates could be
executed.
The sequence of the steel structure works was planed floor by floor starting from the bottom
to the top. When the main steel structure was built, the metal painting started as well as
settings up the gypsum walls with aluminium facade. At the same time the site road works
began with storm water installation and landscaping.
Finishing works began with laying down granite tiles for each floor, matt water based
painting and the montage of doors and windows. The mechanical and electrical equipment
installations and elevator installations were to be executed at this stage. The mechanical
works comprised of the installation of sewer clean water, heating and the ventilation system.
The electrical works were divided into weak and high current works. All building works were
finished off with glazing.
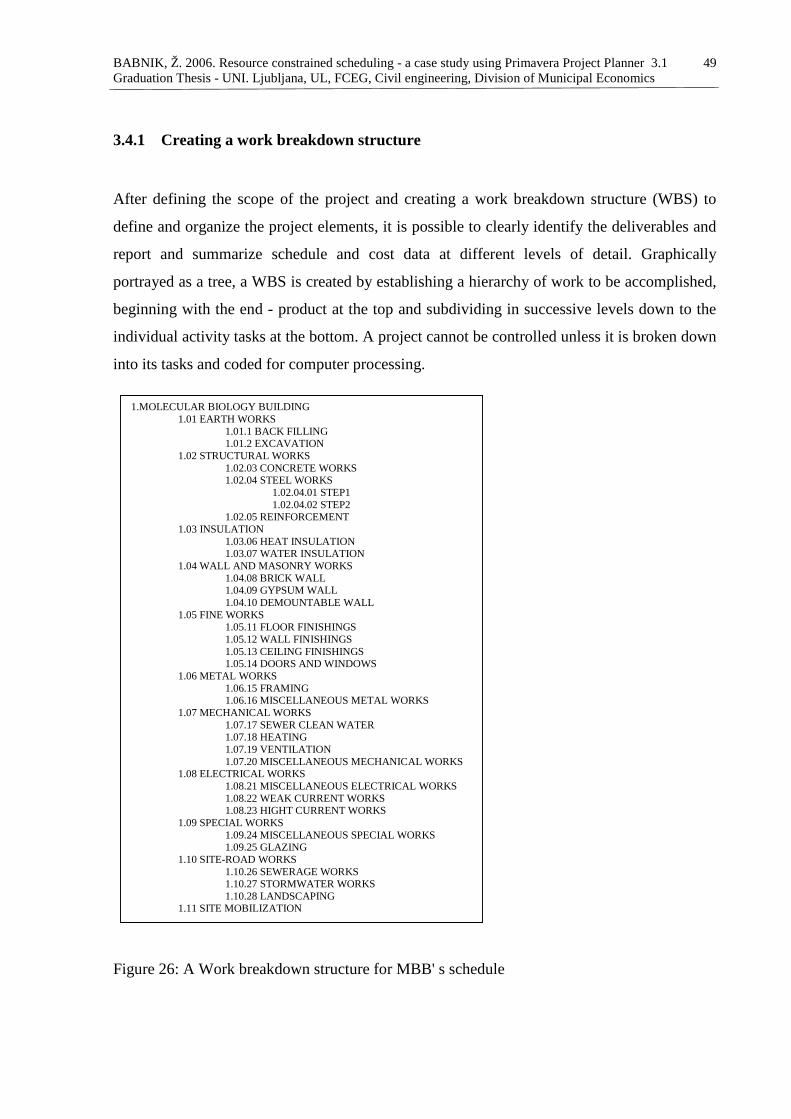
BABNIK, Ž. 2006. Resource constrained scheduling - a case study using Primavera Project Planner 3.1 49 Graduation Thesis - UNI. Ljubljana, UL, FCEG, Civil engineering, Division of Municipal Economics
3.4.1 Creating a work breakdown structure After defining the scope of the project and creating a work breakdown structure (WBS) to
define and organize the project elements, it is possible to clearly identify the deliverables and
report and summarize schedule and cost data at different levels of detail. Graphically
portrayed as a tree, a WBS is created by establishing a hierarchy of work to be accomplished,
beginning with the end - product at the top and subdividing in successive levels down to the
individual activity tasks at the bottom. A project cannot be controlled unless it is broken down
into its tasks and coded for computer processing.
Figure 26: A Work breakdown structure for MBB' s schedule
1.MOLECULAR BIOLOGY BUILDING 1.01 EARTH WORKS 1.01.1 BACK FILLING 1.01.2 EXCAVATION 1.02 STRUCTURAL WORKS 1.02.03 CONCRETE WORKS 1.02.04 STEEL WORKS 1.02.04.01 STEP1 1.02.04.02 STEP2 1.02.05 REINFORCEMENT 1.03 INSULATION 1.03.06 HEAT INSULATION 1.03.07 WATER INSULATION 1.04 WALL AND MASONRY WORKS 1.04.08 BRICK WALL
1.04.09 GYPSUM WALL 1.04.10 DEMOUNTABLE WALL
1.05 FINE WORKS 1.05.11 FLOOR FINISHINGS 1.05.12 WALL FINISHINGS 1.05.13 CEILING FINISHINGS 1.05.14 DOORS AND WINDOWS
1.06 METAL WORKS 1.06.15 FRAMING 1.06.16 MISCELLANEOUS METAL WORKS 1.07 MECHANICAL WORKS 1.07.17 SEWER CLEAN WATER 1.07.18 HEATING 1.07.19 VENTILATION 1.07.20 MISCELLANEOUS MECHANICAL WORKS 1.08 ELECTRICAL WORKS 1.08.21 MISCELLANEOUS ELECTRICAL WORKS 1.08.22 WEAK CURRENT WORKS 1.08.23 HIGHT CURRENT WORKS 1.09 SPECIAL WORKS 1.09.24 MISCELLANEOUS SPECIAL WORKS 1.09.25 GLAZING 1.10 SITE-ROAD WORKS 1.10.26 SEWERAGE WORKS 1.10.27 STORMWATER WORKS 1.10.28 LANDSCAPING 1.11 SITE MOBILIZATION

BABNIK, Ž. 2006. Resource constrained scheduling - a case study using Primavera Project Planner 3.1 50 Graduation Thesis - UNI. Ljubljana, UL, FCEG, Civil engineering, Division of Municipal Economics
3.5 Resource scheduling tools and techniques using P3 presented in MBB's schedule
3.5.1 Resource constrained scheduling using P3
Resource GW1 is used for erecting gypsum walls in the MBB's schedule. The activity
Gypsum wall 10, with its identity number vWM01 and original duration of 30 days, has
assigned GW1 resource. The total float of that activity is 7 days. If a group of workers, after
the completion of constructing the 10 centimetre wide gypsum wall, starts with constructing a
20 centimetre wide gypsum wall, there will be no total float of Gypsum wall 10 activity. It
means that the critical activity Gypsum wall 20 will use the resource GW1 30 days after its
start. The resource constrained problem should be solved by dividing Gypsum wall 20 into
two activities: Gypsum wall 20 and Gypsum wall 20A. Their durations are 30 days and 10
days. The resource GW1 is assigned to the new activity and additional relationship links are
created: SF from Gypsum wall 10 and Gypsum wall 20. Successors of the new activity are the
same as from activity Gypsum wall 20. The previous manual solution satisfies resource
constrained requirements. Using levelling procedure in P3, it is possible to set and select
splitting of activities.
Figure 27: Activities before and after resource constrained requirements

BABNIK, Ž. 2006. Resource constrained scheduling - a case study using Primavera Project Planner 3.1 51 Graduation Thesis - UNI. Ljubljana, UL, FCEG, Civil engineering, Division of Municipal Economics
3.5.2 Allocation in P3
P3 enables to develop a resource plan that integrates resources, costs and schedule to
implement effective project control. Begin by building a dictionary of the resources necessary
to complete the project; for each resource set availability limits, unit prices, and a calendar to
define its standard work time and non-work time; then allocate resources to the activities that
require them.
Using this information, P3 enables to produce resource reports and profiles. Analyze the
resource allocation and adjust the project plan to avoid over allocation as well as the peaks
and valleys of resource usage. The figure 28 presents a flow chart of a typical process of
creating a resource driven schedule. After creating the list of resources required, the resources
have to be allocated and measured.
Figure 28: The process of using resources
Define list of resources.
Set resource unit rate limits.
Define resource calanders.
Add activities and relationships.
Assign resources to activities.
Estimate budgets and rates of use.
Review resource profiles.
Level resources.

BABNIK, Ž. 2006. Resource constrained scheduling - a case study using Primavera Project Planner 3.1 52 Graduation Thesis - UNI. Ljubljana, UL, FCEG, Civil engineering, Division of Municipal Economics
Figure 29: The windows in P3 for displaying resources, their requirements and resource
measurement window
After assigning resources to activities, it is possible to see each resource profile of the whole
project in P3.
Figure 30: Resource profile display options in P3

BABNIK, Ž. 2006. Resource constrained scheduling - a case study using Primavera Project Planner 3.1 53 Graduation Thesis - UNI. Ljubljana, UL, FCEG, Civil engineering, Division of Municipal Economics
Figure 31: The resource profile in P3
3.5.3 Levelling in P3
Resource levelling is an automated process that delays the start of certain activities. During
levelling, P3 compares the requirements of all scheduled activities to the maximum quantity
available at the time of levelling. P3 delays an activity, if too few resources are available at
any time during the activity’s duration.
In P3, there is a possibility of selecting resources for levelling as well as specify the levelling
priority for each activity. In addition to delaying activities until resources are available, P3
can decrease the overall duration of an independent activity during resource levelling. By
using surplus available resources during any work period when they exist, P3 increases the
units per time period of a resource, reducing the duration of that resource proportionately.
This can reduce the overall duration of the overall activity.
During levelling, P3 can also make the work periods of a task or independent activity non
contiguous. If it is allowed to split an activity, P3 can suspend work until sufficient resources
become available on that activity.
The results of levelling can be seen in a bar chart. It is possible to set up a bar chart to show
the following bars for activities: early bars (where they were scheduled after levelling),

BABNIK, Ž. 2006. Resource constrained scheduling - a case study using Primavera Project Planner 3.1 54 Graduation Thesis - UNI. Ljubljana, UL, FCEG, Civil engineering, Division of Municipal Economics
unlevelled bars (where they were scheduled before levelling) and level delay bars and points
(the amount of time they were delayed). P3 draws the level delay bar from the unlevelled start
date to the levelled start date to illustrate the amount of delay; the level delay point is placed
at the unlevelled start of the activity.
If there the automatic resource levelling function is turned on, P3 levels each time of
scheduling the project or each time of modifying the data that affect levelling, such as when
there is an addition, change or when a resource, calendar or relationship are deleted.
Figure 32: The window in P3 for levelling
Activities Gypsum Plastering, their identity numbers being: MBF3FW07, MBF1FW07 and
MBBFW02, are using GPLS2 resource. It provides costs for material and plastering group.
The total amount of work which has to be done is 2745 m2, but because of the typical features
of the plastering, the quantity of water based painting is limited from normal 160 m2 to
maximum 170 m2 per day. Resource excess can be seen in the figure 33. It is possible to use
levelling techniques in P3. The figure 34 present the successful result of levelling process.
In backward leveling, P3 can schedule activities to occur earlier than their scheduled early dates, meaning the project must begin earlier than planned in order to be complete according to the schedule with the available resources.
Forward leveling schedules the early dates of activities from the start to the finish of the project, obeying network logic while ensuring that sufficient resources are available to perform each activity.

BABNIK, Ž. 2006. Resource constrained scheduling - a case study using Primavera Project Planner 3.1 55 Graduation Thesis - UNI. Ljubljana, UL, FCEG, Civil engineering, Division of Municipal Economics
Figure 33: GPLS2 resource over limit
Figure 34: Result of levelling GPLS2 using P3

BABNIK, Ž. 2006. Resource constrained scheduling - a case study using Primavera Project Planner 3.1 56 Graduation Thesis - UNI. Ljubljana, UL, FCEG, Civil engineering, Division of Municipal Economics
3.5.4 Smoothing in P3 During levelling, P3 refers to the normal and maximum availability limits in the Resource
Dictionary. Sometimes the normal limit is insufficient to provide enough resource to schedule
an activity. Without smoothing, P3 assumes the maximum availability of resources.
Smoothing uses different assumptions about resource availability. By modelling incremental
increases in availability, smoothing minimizes the peaks and valleys in the resource usage
profile. This is often desirable: maintaining relatively constant resource levels can reduce
costs.
Choosing none smoothing option when the normal and maximum limits of all resources are
equal or nearly equal. Using this option, P3 tries to schedule an activity within its float span
using the normal resource limit. Levelling without smoothing schedules activities as early as
possible, using total float to delay others while keeping usage below the maximum limit. If
there is an insufficient resource, P3 tries again, beginning at the early schedule date, using the
maximum limit. This method may result in overestimation of the amount of resource being
used.
For example, if an activity requires 6 units per time period of a resource that has normal and
maximum limits of 5 and 15, respectively, P3 makes all 15 units available to the activity.
Choosing the non - time constrained option when the normal and maximum limits
significantly differ. This method of levelling attempts to keep resource usage as close to the
normal limits as possible, using positive float to delay and stagger activities rather than using
the maximum quantity available and scheduling several activities to occur simultaneously.
This technique can produce a smoother profile of resource use than levelling without
smoothing.
P3 divides the range between normal and maximum into ten increments. If the activity cannot
be scheduled assuming normal limits, P3 delays the activity for one work period (within its
available positive float) and tries again. After exhausting the float, P3 begins the entire
levelling process again on the original date, this time increasing the availability assumption by
one increment (ten percent of the difference between the normal and maximum limits). P3

BABNIK, Ž. 2006. Resource constrained scheduling - a case study using Primavera Project Planner 3.1 57 Graduation Thesis - UNI. Ljubljana, UL, FCEG, Civil engineering, Division of Municipal Economics
repeats this process, if necessary, until it reaches the maximum limit. If the activity still
cannot be scheduled, P3 continues assuming the maximum limit and delays the activity for
one work period at a time, repeating the process and causing negative total float if necessary.
Choosing the time constrained option when the project must finish on time, regardless of the
resources required. P3 levels activities assuming double the normal and maximum resource
limits, and proceeds as when using the none option; however, no activity is delayed beyond
its late schedule dates. If P3 cannot schedule an activity within its available float, the activity
occurs on its original schedule date and a warning message appears in the Resource Levelling
Analysis Report. No changes are made to the Resource Dictionary, but P3 reflects the doubled
maximum limits in the Resource Levelling Analysis Report.
3.6 Reports on the schedule using P3
P3 provides some very beneficial reports and graphics for cost analysis and forecasting, which
enable the communication regarding detailed or summarized information about the projects
between the scheduler, site and the project manager. To make the most suitable report, it is
necessary to determine the content, format, order and the selection of activities, among other
options. After determining individual reports or graphics, or a series of reports or graphics, it
is possible to print them.
P3’s wide variety of reports provides multi-dimensional views of the project. For a simple
one-dimensional view of the schedule or the resource/cost data, choose schedule reports,
resource/cost control reports, resource productivity/cost, price, and rates reports, earned value
reports, tabular resource/cost reports, or resource/cost loading reports. The activity and
resource/cost matrix reports add a second dimension because schedule data can be combined
with resource/cost data in a cross tab report. Custom reports give the opportunity of
expanding the presentation to a third dimension by including custom or calculated data, which
are not included in the standard reports.
Generally speaking, projects contain many activities, a smaller number of resources and an
even smaller number of cost accounts. Once the project is under the way, it is necessary to

BABNIK, Ž. 2006. Resource constrained scheduling - a case study using Primavera Project Planner 3.1 58 Graduation Thesis - UNI. Ljubljana, UL, FCEG, Civil engineering, Division of Municipal Economics
modify the schedule to keep it current. Cost accounts help to track budgets and accumulated
resource use, actual costs as well as the estimates of costs to complete. The main aim of using
cost accounts is to review costs at a summarized or a detailed level for any group of activities
in the project, e.g. when organizing layout by cost account and including cost data columns in
the list of activities to review cost accounts at a detailed level. For example, one cost account
may represent the efforts of an entire department containing 40 people working on 100 tasks.
Developing a cost account structure enables each cost account's presentation of a unique
project component. It is also possible to establish separate cost categories to classify resources
into categories such as labour, material or equipment.
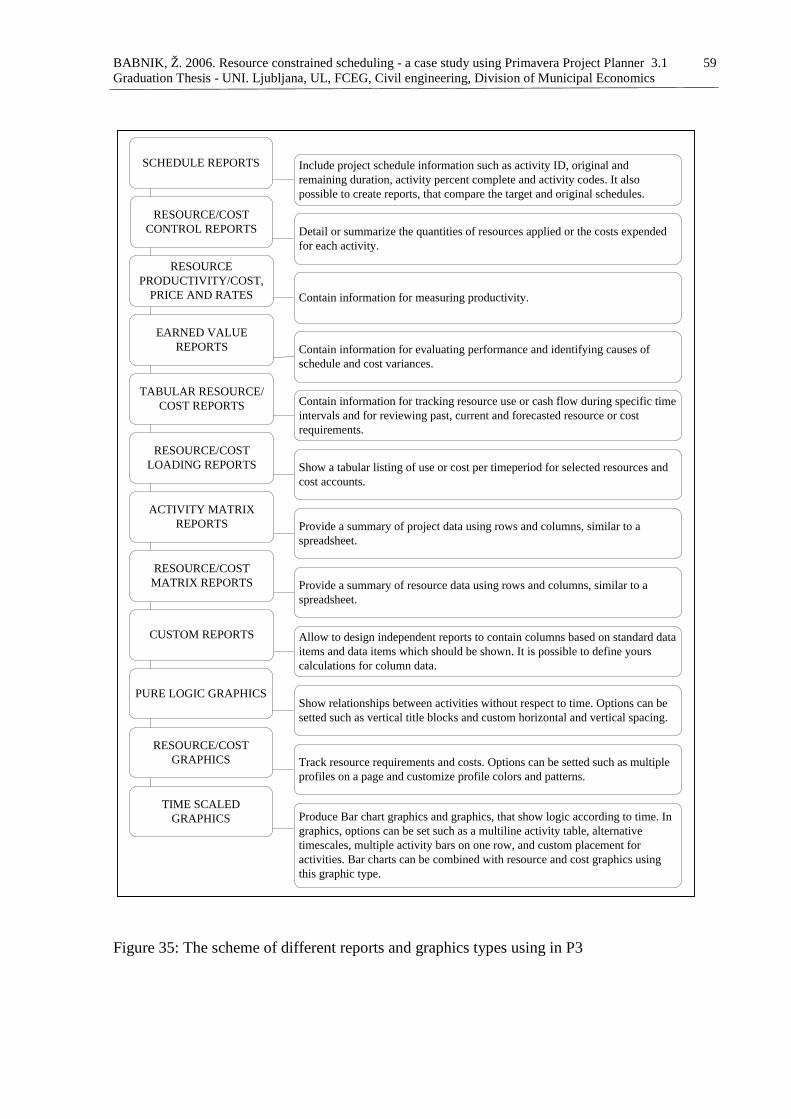
BABNIK, Ž. 2006. Resource constrained scheduling - a case study using Primavera Project Planner 3.1 59 Graduation Thesis - UNI. Ljubljana, UL, FCEG, Civil engineering, Division of Municipal Economics
Figure 35: The scheme of different reports and graphics types using in P3
SCHEDULE REPORTS Include project schedule information such as activity ID, original and remaining duration, activity percent complete and activity codes. It also possible to create reports, that compare the target and original schedules.
RESOURCE/COST CONTROL REPORTS Detail or summarize the quantities of resources applied or the costs expended
for each activity.
RESOURCE PRODUCTIVITY/COST,
PRICE AND RATES Contain information for measuring productivity.
EARNED VALUE REPORTS Contain information for evaluating performance and identifying causes of
schedule and cost variances.
TABULAR RESOURCE/COST REPORTS Contain information for tracking resource use or cash flow during specific time
intervals and for reviewing past, current and forecasted resource or cost requirements.
RESOURCE/COST LOADING REPORTS Show a tabular listing of use or cost per timeperiod for selected resources and
cost accounts.
ACTIVITY MATRIX REPORTS Provide a summary of project data using rows and columns, similar to a
spreadsheet.
RESOURCE/COST MATRIX REPORTS Provide a summary of resource data using rows and columns, similar to a
spreadsheet.
CUSTOM REPORTS Allow to design independent reports to contain columns based on standard data items and data items which should be shown. It is possible to define yours calculations for column data.
PURE LOGIC GRAPHICSShow relationships between activities without respect to time. Options can be setted such as vertical title blocks and custom horizontal and vertical spacing.
RESOURCE/COST GRAPHICS Track resource requirements and costs. Options can be setted such as multiple
profiles on a page and customize profile colors and patterns.
TIME SCALED GRAPHICS Produce Bar chart graphics and graphics, that show logic according to time. In
graphics, options can be set such as a multiline activity table, alternative timescales, multiple activity bars on one row, and custom placement for activities. Bar charts can be combined with resource and cost graphics using this graphic type.

BABNIK, Ž. 2006. Resource constrained scheduling - a case study using Primavera Project Planner 3.1 60 Graduation Thesis - UNI. Ljubljana, UL, FCEG, Civil engineering, Division of Municipal Economics
3.6.1 Reports on the MBB's schedule
3.6.1.1 Schedule report Schedule report provides a tabular list of data showing activity identifications, descriptions,
durations, float and early and late schedule dates. Customize the report to show additional
data on separate lines (e.g. displaying budgets, resources, predecessor/successor activities and
logs).
Figure 36: The schedule report of the MBB' s schedule

BABNIK, Ž. 2006. Resource constrained scheduling - a case study using Primavera Project Planner 3.1 61 Graduation Thesis - UNI. Ljubljana, UL, FCEG, Civil engineering, Division of Municipal Economics
3.6.1.2 Resource/cost control report Resource report organizes data by the resource quantity designed. Cost report shows the cost
accounts and currency associated with the resources. Control reports provide detailed or
summarized information about the quantities of resources for each activity or for the costs
expended for each activity.
Figure 37: The resource control report of the MBB' s schedule
3.6.1.3 Resource/cost loading report
Resource/cost loading report is the tabular list of using costs by time-period for selected
resources and cost accounts; it includes subtotals and totals. Further example shows total
monthly cost loading for all activities. After organizing the report by resource, cost account,
cost category, activity code or project code, P3 first groups activities by the organizing item,
such as resource or activity code value and then subdivides them by the code specified.

BABNIK, Ž. 2006. Resource constrained scheduling - a case study using Primavera Project Planner 3.1 62 Graduation Thesis - UNI. Ljubljana, UL, FCEG, Civil engineering, Division of Municipal Economics
Control report shows values for the budget, actual to date, actual during period, estimate to
complete and estimate at completion (forecast) and the variance between the budget and the
forecast values.
Figure 38: The cost loading report of the MBB' s schedule
3.6.2 Reports which can be obtained during the progress
Further reports are used after the start of construction, when the project management team
controls and measures the costs, resources and duration of the project.
3.6.2.1 Resource productivity/cost, price and rates reports Resource productivity or labour indicates the amount produced (output) per unit of resource
used (input). For example, the surface of a wall painted per person - days of work. This
measure of productivity helps to identify areas of a project that need performance

BABNIK, Ž. 2006. Resource constrained scheduling - a case study using Primavera Project Planner 3.1 63 Graduation Thesis - UNI. Ljubljana, UL, FCEG, Civil engineering, Division of Municipal Economics
improvements and is thus used for comparing the actual rates to budgets and forecasts using
the resource productivity report. The cost version (cost, price, and rates reports) displays data
in a cost per resource quantity.
Assigning resources and cost accounts with categories to activities is needed to generate a
productivity report. Cost accounts should be developed for grouping the resources (labour
input and material output) for a particular work item. For example, suppose that the site
manager wants to measure the productivity of an electrician’s day in terms of the number of
linear feet of electrical conduit installed. Specify a cost account that represents the installation
of electrical conduit and assign it to the electrician and electrical conduit resources.
Consecutive range can be used for cost accounts within a work item. Using the same unit of
measure for all labour resources within a cost account; identify each with a designator (such
as L for Labour) in the cost category position in the Cost Accounts Dictionary. P3 calculates
the labour input by collecting only specified cost accounts with an L in the cost category
position.
3.6.2.2 Earned value reports
Earned value report is used to evaluate performance by identifying the causes of schedule and
cost variances. Performance is measured on a cumulative basis according to units or costs;
earned value is calculated as the product of the percent complete and the budget. To report
variance values accurately, P3 requires a target plan as designate as Target 1. If it is specified
for a resource, P3 uses the resource percent complete for the activity; otherwise, P3 uses the
schedule percent complete.
It is also possible to base the budgeted amount upon the budgets from the current or target
schedule. In the Earned value calculations dialog box in P3 the project management team can
indicate which budget should be used to calculate the earned value and the planned value.

BABNIK, Ž. 2006. Resource constrained scheduling - a case study using Primavera Project Planner 3.1 64 Graduation Thesis - UNI. Ljubljana, UL, FCEG, Civil engineering, Division of Municipal Economics
Figure 39: The earned value report
3.6.2.3 Reviewing cash flow report
After assigning budgets to the cost accounts it is possible to analyze cash flow for the entire
project. P3 provides several ways of reviewing the budget with examining a time-phased
spending plan using a cost table or profile. Three different curves can show the accumulated
current estimate, earned value and scheduled budget costs.
Actual cost for work performed (ACWP), budgeted cost for work performed (BCWP), and planned value, or budgeted cost for work scheduled (BCWS) are compared to report cost and schedule variances.

BABNIK, Ž. 2006. Resource constrained scheduling - a case study using Primavera Project Planner 3.1 65 Graduation Thesis - UNI. Ljubljana, UL, FCEG, Civil engineering, Division of Municipal Economics
Figure 40: Cash flow diagram
3.6.2.4 Tabular Resource/Cost Reports
The tabular resource usage report is used to track resource use during specific time intervals.
P3 shows up to three different schedules for comparing past, current and forecasted resource
requirements. The format of the tabular cost report (cash-flow report) is similar to that of the
tabular resource report. Both reports compare expenditure rates between periods based on
early, late and Target 1 schedule dates and spread the actual to date values from the resource
actual start to the data date.

BABNIK, Ž. 2006. Resource constrained scheduling - a case study using Primavera Project Planner 3.1 66 Graduation Thesis - UNI. Ljubljana, UL, FCEG, Civil engineering, Division of Municipal Economics
If the period performance is stored, tabular reports spread resource quantities and costs evenly
for each update period, as well as the quantities and costs for the current period from the last
storage date to the data date. If the period performance is not stored, tabular reports spread
resource quantities and costs evenly from the resource start through the data date. The report
spreads the estimate to complete values evenly from the data date to the finish date.
Figure 41: The tabular resource report
3.6.2.5 Matrix reports
Matrix reports provide a two-dimensional view of the project data, similar to a cross-tab
report. Display schedule data, quantity or cost information in columns and rows, grouped by
activity codes and/or resources or cost accounts. For example, the amount of money spent by
each department by project can be seen. P3 offers two types of matrix reports, activity and
resource/cost. Activity matrix reports are used to report activity or resource data grouped by
activity codes. Resource/cost matrix reports are used to review the data grouped by resource
or cost account. P3 provides an extensive list of data items you can specify for an activity or
resource/cost matrix report, such as activity identification, schedule dates, durations,
resources, cost accounts and variances. These selections determine the values P3 displays in
the report cells.

BABNIK, Ž. 2006. Resource constrained scheduling - a case study using Primavera Project Planner 3.1 67 Graduation Thesis - UNI. Ljubljana, UL, FCEG, Civil engineering, Division of Municipal Economics
Figure 42: The matrix report
Once the project is underway, it is necessary to modify the schedule to keep it current.
3.7 Sharing project data in P3
Once a project is underway, the schedule and resource use must be updated at regular
intervals. Each project is different: it may be needed to be updated daily, weekly or monthly,
depending on the amount of time a project spans and how frequently forecasts should be
adjusted.
To facilitate the communication of the vital project data within the corporate office or
between offices worldwide, P3’s E-mail capabilities can be used to send and receive project
information. Update information can be collected and merged into the project, keeping it as
current as possible. A backup of an entire project or project group can be sent in P3 to another
member of the workgroup using ordinary e-mail system. P3 backs up the open project into
one file with the project name and the extension.
Instead of sending an entire project or a project group through e-mail, specified activities
from a project can also be sent. P3 allows to choose whether to send the activities in the
current view, currently selected activities, or filtered activities, as well as to choose a Standard

BABNIK, Ž. 2006. Resource constrained scheduling - a case study using Primavera Project Planner 3.1 68 Graduation Thesis - UNI. Ljubljana, UL, FCEG, Civil engineering, Division of Municipal Economics
or Custom status sheet. The Standard status sheet is a quick way of updating activity progress,
while the Custom status sheet allows more flexibility in collecting information about the data
items selected.
Figure 43: Send mail wizard in P3
Since most companies run multiple projects simultaneously, coordination is the key to
achieving overall corporate objectives. Each project shares resources with other projects, its
activities depending on the accomplishment of activities in other projects, and its information
must be available to, as well as shared by participants and management. To facilitate the
communicating project data within a company with offices spread locally or worldwide, it is
possible to create layouts in P3, save them in HTML format and create P3 reports in HTML
format using the Primavera Web Publishing Wizard, then placing them on a central server -
office network or the Internet. By publishing project information on a central server, a user
can maintain a single copy of the project layouts and reports, which the administrators,
management, or individual project managers can access at any time. Using the World Wide
Web to disseminate information also supplies the most current project information to remote
managers.
P3’s Web Publishing feature enables to publish project information on the World Wide Web
or on an office intranet for others to access. The Primavera Web Publishing Wizard can guide
user through the process of creating Web pages that contain the specified project information.
Once the pages are completed, they can be transferred to the Internet or placed on company
intranet server. Layouts can be saved in Hyper Text Markup Language (HTML) format in P3.

BABNIK, Ž. 2006. Resource constrained scheduling - a case study using Primavera Project Planner 3.1 69 Graduation Thesis - UNI. Ljubljana, UL, FCEG, Civil engineering, Division of Municipal Economics
Figure 44: Primavera web publishing wizard
Creating a structure of HTML documents P3’s Web Publishing Wizard creates a hierarchical
structure of HTML pages based on the projects and reports specified. These pages contain
hypertext links, or jumps to other pages in the structure, enabling to move between projects
and reports and from page to page within a report. Only the structure must be set up once and
then, as the projects progresses, the Wizard is used to add new reports, remove outdated
reports, or update existing ones with the latest data. The first HTML page lists the project
categories that have been defined, such as Development Projects, Construction Projects,
Information System Projects, etc. a user can select a category to display the list of projects
and overview information about each project it contains. A project can be selected from this
list to see the reports that are available and displayed as an HTML page containing that
information.
HTML is a platform independent language, which means that pages do not have to be viewed
using the same type of computer that generated them. Once an HTML structure in P3 is
created, anyone can use an Internet browser to review HTML documents, whether they are
downloaded from the World Wide Web or an office intranet.
To create and maintain HTML reports using the Primavera Web Publishing Wizard, there are
seven steps one has to follow, which can be seen in the figure 45.
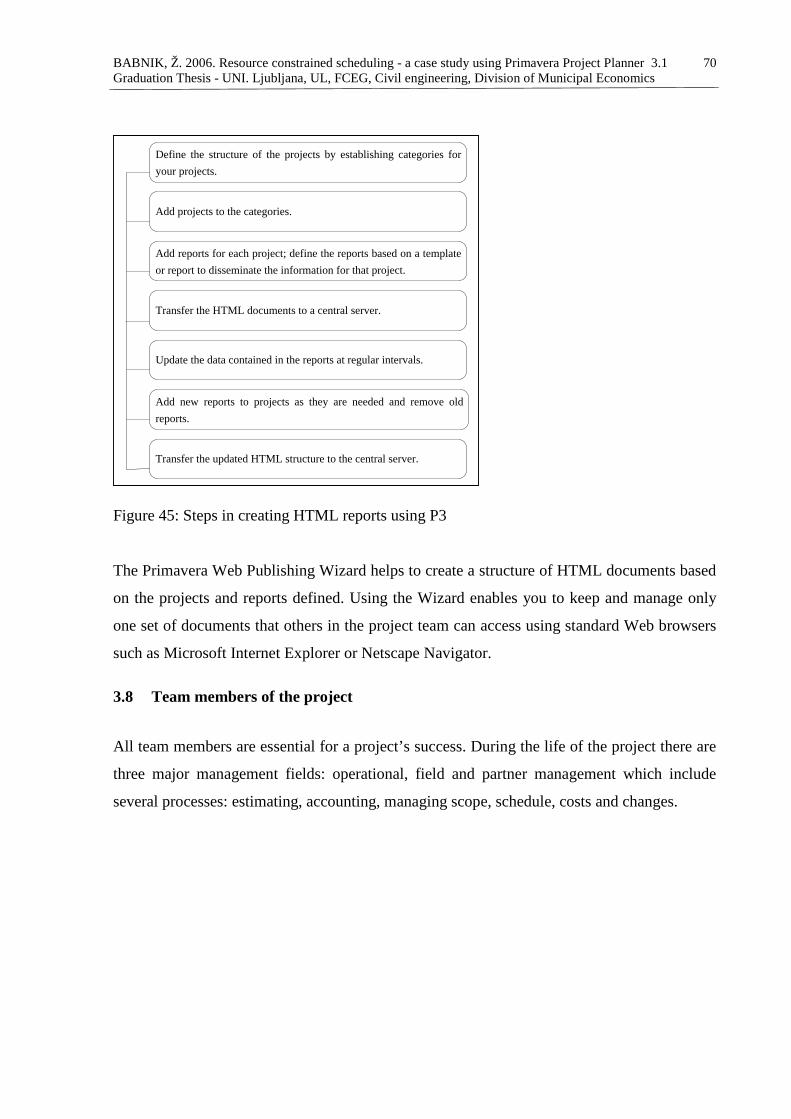
BABNIK, Ž. 2006. Resource constrained scheduling - a case study using Primavera Project Planner 3.1 70 Graduation Thesis - UNI. Ljubljana, UL, FCEG, Civil engineering, Division of Municipal Economics
Figure 45: Steps in creating HTML reports using P3
The Primavera Web Publishing Wizard helps to create a structure of HTML documents based
on the projects and reports defined. Using the Wizard enables you to keep and manage only
one set of documents that others in the project team can access using standard Web browsers
such as Microsoft Internet Explorer or Netscape Navigator.
3.8 Team members of the project
All team members are essential for a project’s success. During the life of the project there are
three major management fields: operational, field and partner management which include
several processes: estimating, accounting, managing scope, schedule, costs and changes.
Define the structure of the projects by establishing categories for your projects.
Add projects to the categories.
Add reports for each project; define the reports based on a template or report to disseminate the information for that project.
Transfer the HTML documents to a central server.
Update the data contained in the reports at regular intervals.
Add new reports to projects as they are needed and remove old reports.
Transfer the updated HTML structure to the central server.

BABNIK, Ž. 2006. Resource constrained scheduling - a case study using Primavera Project Planner 3.1 71 Graduation Thesis - UNI. Ljubljana, UL, FCEG, Civil engineering, Division of Municipal Economics
Figure 46: Scheme of the project's team members structure
Executive, Project manager, Project Controls manager and Scheduler have to deal with
resource scheduling, updating project’s information, controlling and estimating project data.
3.8.1 Scheduler
A scheduler has to manage the preparation and scheduling of construction work and the
respective work crew. His workday is spent gathering and analyzing information to prepare
reports on the progress of projects, ensuring that assignment and scheduling of work follows
company policy and evaluating current procedures and recommends changes to improve the
efficiency of planning and scheduling of projects.

BABNIK, Ž. 2006. Resource constrained scheduling - a case study using Primavera Project Planner 3.1 72 Graduation Thesis - UNI. Ljubljana, UL, FCEG, Civil engineering, Division of Municipal Economics
Schedule projects quickly and easily:
• Identify all critical paths within a project by using CPM.
• Integrate schedules from engineering, architects, subcontractors and owners to create a
master program schedule.
• Easily create attractive and fully customizable graphics including Gantt charts,
Activity Network Diagrams, Time-scaled Logic Diagrams and Histograms.
• Quickly plan for the upcoming day, week or month to ensure everyone knows what
they are responsible for.
• Control budgets, changes and estimates at completion to ensure a successful project
delivery.
• Allocate resources to activities using distribution curves to accurately reflect how the
work is performed.
• Improve collaboration by quickly emailing entire projects with the click of a button.
• Communicate status to general contractors, subcontractors, owners and other project
team members via customizable industry standard reports.
• Coordinate labour, material, equipment and subcontractors to ensure on-schedule, on-
budget completion.
• Quickly compare baseline budgets to the actual costs and work performed while
maintaining independent versions of cost to complete estimations.
• Store actual cost, units, earned value and planned value by customizable financial
period for comparison current and future trends.
• Create unlimited “what-if” scenarios to explore alternatives.
• Break activities down into smaller weighted steps and track the completion of the
steps to determine the activity percent complete.
• Document risks and calculate risk exposure values and impacts on the project's
schedule, costs and durations.
• Build thresholds for tolerable project performance and get notified when performance
is outside of the acceptable performance window.
• Leverage best practices by using templates and completed projects to build new
projects.

BABNIK, Ž. 2006. Resource constrained scheduling - a case study using Primavera Project Planner 3.1 73 Graduation Thesis - UNI. Ljubljana, UL, FCEG, Civil engineering, Division of Municipal Economics
• Perform earned value analysis by using past performance to predict a more accurate
cost to completion.
3.8.2 Executive
An executive plans and directs all aspects of organization's construction function. The
majority of team is consumed by ensuring all projects are completed on time, within budget
and according to pre-established specifications.
Executive Solution Capabilities:
• View current trends and forecasts for projects within a business unit or a profit & lost
centre via a web based dashboard.
• Review, analyze and manage issues and risks across portfolios of projects and
programs to ensure there are no surprises near the completion deadline.
• Manage by acceptation by using calculated key performance indictors and automated
alerts. Quickly determine which projects or programs need help to get back on track.
• Drill into program and project details by viewing project dashboards that contain
schedule performance, cost performance, earned value metrics, milestone dates and
WBS summaries.
• Communicate with the project manager or project team by using P3’s communication
capabilities.
• Keep up to date by reading executive summaries about each project or program within
a customized portfolio.
• Run reports about the projects from anywhere using the web and launching the report
and get the data needed.
3.8.3 Project manager
The role of a project manager comprises overseeing and directing construction management.
Project managers divide their time between communicating directly with
contractors/designers about the costs of a project, staffing and scheduling as well as working
to ensure plans adhere to contract specifications.

BABNIK, Ž. 2006. Resource constrained scheduling - a case study using Primavera Project Planner 3.1 74 Graduation Thesis - UNI. Ljubljana, UL, FCEG, Civil engineering, Division of Municipal Economics
Project Manager Solution Capabilities:
• Access to web-based project management functions (such as WBS and activity
creation and maintenance) ensures that projects are completed on-time and on-budget.
• Complete Issue and Risk management functions to ensure project status is understood
and tough decisions are made in a timely manner.
• Robust resource management capabilities help the project manager to understand
resource allocation and schedules to ensure the best fit for the project.
• Customized project workspaces store documents, discussion threads, approvals and
other important project information in a central repository for easy access.
• Auditable approval workflows track subjects, documents and changes that are
important to a project’s success.
• Detailed time reports, expense reports, budgets and financial information ensure that
real-world data is available to make important decisions.
• Reporting and program dashboards ensure that data is collected and shared, so that
project managers and their stakeholders are not surprised by project trends.
3.8.4 Project controls manager
A project controls manager (PCM) develops and manages the project controls effort,
including estimating, scheduling, and cost analysis, for all projects within the company.
PCMs provide guidance and specialized assistance to projects for the resolution of difficult
and complex problems.
Project Controls Manager Solution Capabilities:
• Set the standards for organizations by determining global coding structures that all
projects must adhere to.
• View summary information about projects via a web based or personalized dashboard.
• Drill into project details, like WBS, activities, resource assignments and issues to
resolve problems.

BABNIK, Ž. 2006. Resource constrained scheduling - a case study using Primavera Project Planner 3.1 75 Graduation Thesis - UNI. Ljubljana, UL, FCEG, Civil engineering, Division of Municipal Economics
4 CONCLUSION AND RECOMMENDATIONS
The purpose of project management is to achieve the goals and objectives of a project through
a planned expenditure of resources that meet the project's quality, costs, time and safety
requirements. A construction companies are in business in order to be successful and make
money. When producing a successful project, financial risks can thus be controlled and
minimized.
Modern project management is based on the concept of the office of a project manager using
the computerized CPM network, as well as the use of bar charts as a visual tool for presenting
schedule results. The planner prepares a resource loaded and cost loaded CPM schedule,
which is then converted into a list of time-phased budgets. The sum of the budget equals the
value of the contract. The schedule leads to the required project completion date.
The levelling and allocation techniques present an important role during the scheduling
process and are widely used. When it comes to P3, it is possible to choose either automatic or
manual levelling procedure. Choosing smoothing method for maintaining relatively constant
resource levels can reduce the costs.
Cost estimating and budgeting is driven by definitions of functions and elements, the
breakdown of work into tasks and packages and the assignment of packages to particular
individuals and organizations. The process leads to more accurate cost pictures at each
transition point. Control requires that the project scope be maintained throughout each stage.
Tabular reports are very useful as a communication tool. Only by tracking and comparing the
actual usage of resources to the baseline budget, the contractor can determine the physical
progress and earned value. Management must gauge the progress gained for the amount of
resources expended to determine if the project is over or under the baseline budget.
The use of sensible solutions for today's project management professional program P3
provides keeping the project under the constant review, taking action when necessary to
correct the situation and measuring what was done against what should have been done. It is
also very helpful when it comes to proactively defining problem areas of the project. With the
schedule which contains resources, costs and main data about the project, measuring,

BABNIK, Ž. 2006. Resource constrained scheduling - a case study using Primavera Project Planner 3.1 76 Graduation Thesis - UNI. Ljubljana, UL, FCEG, Civil engineering, Division of Municipal Economics
monitoring and managing during the project life should be easier and more successful. After
costs and resources are assigned and updated, it is possible to see cash flows, earned values
and all needed reports for analyzing the time and resources, including associated costs and
revenues. P3 helps to obtain early warning of project risk, improve the insight into project
performance, forecast project health at completion and to collaborate with the project team.
Update information about the project can be collected and merged into the project, keeping it
as current as possible. To facilitate the communicating project data within a company, it is
necessary to publish the project data on the company's intranet or world wide web.
Good project management implies exact project control. All projects have two primary
control documents: the estimate and the schedule. The project managers have to evaluate and
analyse data as well, as they have to be familiar with controlling and evaluating techniques,
using modern PM software.
The preparation of a very detailed schedule is not needed when it comes to small and non
complex projects, due to the fact that the development of the schedule also presents a
substantial amount of cost.
Every company uses different planning techniques for managing with all kinds of projects and
is of course aware of the existence of modern PM software tools. However, planning sectors
in construction industry are lag behind in exploiting advanced scheduling software tools.
Planning sectors meet the scheduling problems on a daily basis, so it is essential that they
acquire some theoretical background about resource scheduling techniques and methods,
otherwise modern software tools cannot be used efficiently by everyone on the project team:
planning, site and project managers. The main goal of scheduling is for the planning sector to
develop the optimal schedule, because producing an ideal one is almost impossible, as well as
unrealistic.
From my point of view, the companies which do not use PM software tools efficiently have to
increase their investments in training and educating their employed project teams, as well as
in establishing information technology systems that will support and help PM teams.

BABNIK, Ž. 2006. Resource constrained scheduling - a case study using Primavera Project Planner 3.1 77 Graduation Thesis - UNI. Ljubljana, UL, FCEG, Civil engineering, Division of Municipal Economics
5 POVZETEK
5.1 UVOD
Projektno planiranje in programiranje je nujno za uspešni projektni gradbeni management, za
izvajanje kontrole nad viri, časom in rapoložljivim proračunom. Razlogi za planiranje so
naslednji:
• Podpora kontroliranju pogodb za izvedbo gradbenih projektov,
• Vzpostavitev realnih norm,
• Vzdrževanje plana pod stalnim nadzorom in urgiranje s pomočjo sodobne programske
opreme, ko je to potrebno.
Metoda kritične poti je pogosto uporabljena v procesu planiranja, kontrole in izvedbe
gradbenih projektov. V fazi planiranja večina planerjev tako v Sloveniji, kot v Turčiji
uporablja samo časovno planiranje, ki temelji na planerjevih preteklih izkušnjah. Nujno je
potrebno definirati in v projektni plan vključiti razpoložljive vire in ostale potrebne
informacije o projektu, uporabiti tehnike in metode za planiranje virov, metode obvladovanja
prislužne vrednosti za kontrolo projekta ter uporabiti vse zmožnosti, ki jih ponujaja sodobna
programska oprema. V diplomskem delu je predstavljeno področje projektnega managementa,
ki služi kot osnova za planiranje, hkrati z metodami in tehnikami za planiranje z omejenimi
viri. Na realnem primeru projektnega plana so prikazane tudi uporabe navedenih tehnik s
profesionalnim programom za planiranje Primavera Project Planner verzija 3.1.
5.2 PROJEKTNI MANAGEMENT
5.2.1 Organizacija projekta in procesi planiranja
Organizacija projekta temelji predvsem na tipu pogodbe. V svojem delu sem izbral najbolj
razširjeno obliko pogodbe na pavšalni znesek. Proces planiranja projekta je sestavljen iz:
• Procesa izdelave ponudbe do podpisa pogodbe
• Procesa od podpisa pogodbe do začetka izvedbe del
• Procesa planiranja tekom gradnje

BABNIK, Ž. 2006. Resource constrained scheduling - a case study using Primavera Project Planner 3.1 78 Graduation Thesis - UNI. Ljubljana, UL, FCEG, Civil engineering, Division of Municipal Economics
Ko glavni izvajalec pridobi posel, časovni plan gradnje razvije v glavni projektni plan, v
katerem so prikazane dejavnosti in časovni potek le-teh z definirami in vključenimi viri, ki
predstavljajo količine in cene materiala, delovne sile in ostalo zahtevano opremo. Za izdelavo
plana je potrebno definirati in smiselno razporediti vse dejavnosti.. Istočasno morajo biti
znane metode vodenja, kontrole projekta in merjenja količin tekom izvedbe.
5.2.2 Metoda kritične poti
Metoda kritične poti je analitična tehnika, ki v dejavnostni mreži določi kritično pot. Tiste
dejavnosti, ki ležijo na najdaljši kritični poti, ne smejo imeti nobenih zamud. Princip
dejavnostne mreže za metodo kritične poti uporabljajo tudi programi za planiranje. V
diplomskem delu je predstavljen osnovni princip metode, dejanski primeri z uporabo P3 ter
prednosti in slabosti metode kritične poti in predstavitvenih diagramov.
5.2.3 Ocenjevanje trajanja dejavnosti
Določitev trajanja dejavnosti poteka v času priprave plana. Pogosto ocenitev opravi najbolj
izkušena oseba iz določenega področja, ki se poslužuje verjetnostnih ali determinističnih
tehnik za določitev trajanja dejavnosti.
5.2.4 Planiranje virov
5.2.4.1 Rezervni čas posamezne dejavnosti in metoda kritične poti z omejenimi viri
Dejavnost, ki ne leži na kritični poti ima rezervni čas, ki omogoča, da se dejavnost začne
kasneje, kot je njen predviden zgodnji čas, oziroma lahko traja dlje kot njen zgodnji konec.
Po določitvi in razporeditvi virov posameznim dejavnostim točne informacije o rezervnih
časih izgubijo legitimno veljavo. Projektni plan in metoda kritične poti z vstavljenimi viri
nista realna, saj so v praksi viri realno omejeni. Predstavljen je algoritem metode kritične poti
z omejenimi viri, ki tovrstne ovire odstrani. Planerji take pomankljivosti rešujejo z uvedbo
nepravih dejavnosti in dodatnimi medsebojnimi relacijami.

BABNIK, Ž. 2006. Resource constrained scheduling - a case study using Primavera Project Planner 3.1 79 Graduation Thesis - UNI. Ljubljana, UL, FCEG, Civil engineering, Division of Municipal Economics
5.2.4.2 Metode in tehnike za planiranje virov
Zahtevane omejitve virov, ki so dodeljeni posameznim aktivnostim, vplivajo na trajanje
dejavnosti. Z optimalno razporeditvijo, planiranjem dejavnosti in zadostitev mej virov lahko
ustvarimo učinkovitejši projekt in zmanjšamo njegove stroške.
5.2.4.2.1 Izravnavanje virov
Procedura izravnavanja virov temelji na ideji prerazporeditve dejavnosti znotraj zahtevanih
časovnih omejitev za zadostitev mej virov oz. odpravljanje morebitnih vrhov. Predstavljen je
enostaven algoritem s primerom, ki prikazuje navedeni proces in rešitev.
5.2.4.2.2 Razporejanje virov
Razporejanje virov je metoda, kjer morajo biti viri pod zahtevanimi mejami in kjer je mogoče
časovno podaljšanje trajanje projekta. Razporejanje je možno preko izbire prioritetnega
kriterija. Predstavljen je enostaven algoritem s primerom, ki prikazuje navedeni proces in
rešitev.
5.2.4.2.3 Kopičenje virov
Je najenostavnejša metoda izmed metod planiranja virov, ki omogoča prikaz vseh virov na
zahtevano časovno enoto v obliki tabele ali histograma in je zelo uporabna za prikaz virov
tekom projekta.
5.2.4.2.4 Zbiranje virov
Vhodni podatki za metodo zbiranja virov so končni podatki metode kopičenja virov. Rezultat
je grafična predstavitev, ki projektnemu vodji ponuja prikaz izbora vseh virov, ki so potrebni
skozi celoten projekt. Metoda omogoča nadzor nad možnostjo prevelike porabe virov.
5.2.4.2.5 Glajenje
Cilj te metode je izdelava plana znotraj časovnih omejitev s konstantno porabo virov. Glajenje
upošteva celoten projekt in deluje znotraj časovnih okvirov, kjer za posamezno dejavnost
iščemo najboljše mesto v planu - točko med zgodnjim začetkom in poznim koncem
dejavnosti, ko je poraba virov do tistega časa najmanjša. Za merilo uporabimo statični
moment v histogramu virov, nato te momente primerjamo med seboj za različne uvrstitve,

BABNIK, Ž. 2006. Resource constrained scheduling - a case study using Primavera Project Planner 3.1 80 Graduation Thesis - UNI. Ljubljana, UL, FCEG, Civil engineering, Division of Municipal Economics
najboljši razpored pa je tisti, ki daje najmanjše momente. Bistvo je, da se izognemo viškom
porabe virov in zapolnimo vrzeli.
5.2.4.2.6 Metoda obvladovanja prislužne vrednosti
Metoda prislužne vrednosti je najbolj razširjena metoda procesa kontrole projektov. Graf
denarnega toka je osnova za analizo, saj lahko razberemo učinek projekta. Standardna »S«
krivulja nam poda planirane vrednosti stroškov, dejanske vrednosti ter proračunske vrednosti
opravljenih dejavnosti. Indikator učinkovitosti plana in stroškovni indikator nam podata
učinkovitost.
5.3 ŠTUDIJ PRIMERA PLANIRANJA VIROV
5.3.1 Projektni plan Molekularne biološke zgradbe
Podan je primer realnega projektnega plana za Molekularno biološko zgradbo Istanbul
Technical University, izdelan s programom Primavera Project Planner verzija 3.1. To je
profesionalni program za planiranje in vodenje projektov in je primeren za obdelavo zelo
velikega števila dejavnosti.Viri so dodeljeni posameznim aktivnostim in njihovo trajanje je
določeno preko kvanitativne metode določitve trajanja dejavnosti.
5.3.2 Izdelava strukture izvedbe del
Izdelava strukture izvedbe del oz. razdelitev projekta v posamezne segmente je nujna za
računalniško obdelavo in nadaljno kontrolo projekta. Podan je primer drevesne strukture za
realen primer plana.
5.3.3 Tehnike planiranja virov z uporabo P3 uporabljene v planu MBB
5.3.3.1 Planiranje z omejenimi viri z uporabo P3
Konkretno so predstavljene dodatne zahteve in omejitve virov ter ustrezna rešitev s tvorbo
nove dejavnosti in novih relacij med dejavnostmi za zadostitev zahtev.
5.3.3.2 Razporejanje virov z uporabo P3
P3 omogoča izdelavo plana, ki vključuje stroške in vire za razvoj učinkovite projektne
kontrole. Prikazan je postopek uporabe s pomočjo P3.

BABNIK, Ž. 2006. Resource constrained scheduling - a case study using Primavera Project Planner 3.1 81 Graduation Thesis - UNI. Ljubljana, UL, FCEG, Civil engineering, Division of Municipal Economics
5.3.3.3 Izravnavnje virov z uporabo P3
Izravnavanje virov je avtomatiziran proces, ki se najprej loti vrhov na tistem delu projektne
mreže, ki je vzrok za uravnavanje. Nato program na novo razporedi dejavnosti znotraj
rezervnih časov. Prikazan je realen primer z rešitvijo in metoda izravnavanja virov v
programskem okolju P3.
5.3.3.4 Glajenje virov z uporabo P3
V procesu izravnavanja virov je mogoče v P3 izbrati možnost glajenja, ki v profilu virov
odpravi vrhove in doline. Približno konstanten profil lahko zniža stroške. Razložene so opcije
načina glajenja glede na zahtevane časovne omejitve.
5.3.4 Poročila plana Molekularne biološke zgradbe z uporabo P3
P3 ponuja veliko različnih poročil za stroškovne analize in napovedi. Poročila služijo komunikaciji in
deljenju informacij med projektnim timom. Predstavljena so poročila, ki so na voljo po izdelanem
planu in tekom izvedbe, če plan vsebuje vse zahtevane podatke. Obravnavana in predstavljena so
poročila plana, poročilo kontrole virov in stroškov, nosilna poročila virov in stroškov, poročila o
produktivnosti, stroških in ocenah, poročila o denarnem toku, tabelarična poročila o virih in stroških
ter matrična poročila.
5.3.5 Deljenje podatkov o projektu z uporabo P3
Tekom izvedbe projekta morajo biti podatki o virih in ostale informacije o projektu tekoče
posodobljene. Predstavljene so rešitve, ki jih P3 ponuja za pošiljanje posameznih informacij
med udeleženci projekta in hranjenje le teh na spletu ali lokalnem serverju.
5.3.6 Udeleženci projekta
Vsi udeleženci projekta so zelo pomembni za njegov končni uspeh. Predstavljeni so tisti, ki so
najbolj odgovorni za planiranje, delo z viri in vodenje projekta ter njihove naloge in metode
dela s pomočjo P3.
5.4 ZAKLJUČKI IN PRIPOROČILA
Uporaba sodobne programske upreme omogoča nadzor nad projektom, reagiranje ko je le-to
potrebno in ocenjevanje samega poteka izvedbe. Če so v projektni plan vključeni viri, stroški
in ostale potrebne informacije, je vodenje, nadzor in ocenjevanje projekta lažje, učinkovitejše

BABNIK, Ž. 2006. Resource constrained scheduling - a case study using Primavera Project Planner 3.1 82 Graduation Thesis - UNI. Ljubljana, UL, FCEG, Civil engineering, Division of Municipal Economics
in bolj uspešno. Projektni timi morajo biti seznanjeni z metodami planiranja virov in
metodami projektne kontrole; učinkovitejša uporaba sodobne programske opreme za
planiranje in vodenje projektov mora postati norma.

BABNIK, Ž. 2006. Resource constrained scheduling - a case study using Primavera Project Planner 3.1 83 Graduation Thesis - UNI. Ljubljana, UL, FCEG, Civil engineering, Division of Municipal Economics
APPENDICES Appendix A: List of activities and their data
Activity ID Activity description Original duration
Remaining duration
Percent complete
Early start
Early finish Resource
Budgeted cost
5.th FLOOR STRUCTUAL WORKS
MBF5STR01 COLUMNS AND BEAMS 4 4 0 21.feb.04 24.feb.04 SSTR1 20,160.00 MBF5STR02 MONTAGE OF THE TRAPES SLAB SURFACE 1 1 0 25.feb.04 25.feb.04 SSTR1 1,344.00 MBF5STR03 2 LEVELLED DOUBLE REINFORCEMENT GRID 1 1 0 26.feb.04 26.feb.04 RG 352.00 MBF5STR04 SCREED 1 1 0 27.feb.04 27.feb.04 SCR 2,994.60 MBF5STR05 PROTECTION CONCRETE 1 1 0 1.mar.04 1.mar.04 CON2 2,084.25 STRUCT.W2 END OF STRUCTURAL WORKS 0 0 0 1.mar.04 0.00
INSULATION MBF5ISO02 LEING MEBRAN 1 1 0 28.feb.04 28.feb.04 ISO2 10,008.00 MBF5ISO01 FORMBOARD FOR 5 TH FLOOR 1 1 0 29.feb.04 29.feb.04 ISO1 4,235.22
ISOLATION2 END OF THE INSULATION WORKS 0 0 0 29.feb.04 0.00 FINE WORKS
MBF5FW03 ROUGH PLASTERING 2 2 0 29.feb.04 1.mar.04 RPLS2 210.84 MBF5FW04 GRATON 3 3 0 2.mar.04 4.mar.04 GR 33,618.64 MBF5FW01 GRANIT TILES FOR FLOOR 1 1 0 12MAY04 12MAY04 GTL2 422.18 MBF5FW02 ROCKWOOD SUSPENDING CEILING 1 1 0 29MAY04 29MAY04 RSC2 606.10
4.th FLOOR STRUCTUAL WORKS
MBF4STR01 INSTALLATION OF THE MAIN BEAMS 7 7 0 9.feb.04 15.feb.04 SSTR2 16,800.00 MBF4STR02 INSTALLATION OF THE SUB BEAMS 6 6 0 10.feb.04 15.feb.04 SSTR1 11,424.00 MBF4STR03 MONTAGE OF THE TRAPES SLAB SURFACE 3 3 0 16.feb.04 18.feb.04 SSTR1 12,768.00 MBF4STR04 2 LEVEL REINFORCEMENT GRID 1 1 0 19.feb.04 19.feb.04 G 4,294.00 MBF4STR05 4 th FLOOR SLAB CONCRETE 1 1 0 20.feb.04 20.feb.04 CON1 7,968.55
FINE WORKS MBF4FW07 ROUGH PLASTERING 1 1 0 28.feb.04 28.feb.04 RPLS2 159.03 MBF4FW05 TILES FOR WALLS 2 2 0 29.feb.04 1.mar.04 TIL1 1,538.50 MBF4FW08 GYPSUM PLASTERING 11 11 0 01MAY04 11MAY04 GPLS1 10,638.60 MBF4FW01 GRANIT TILES FOR FLOOR 7 7 0 12MAY04 18MAY04 GTL1 27,562.58 MBF4FW04 MATT WATER BASED PAINTING 6 6 0 23MAY04 28MAY04 PTG1 8,850.60 MBF4FW06 ROCKWOOD SUSPENDING CEILING 3 3 0 29MAY04 31MAY04 RSC1 9,348.00 MBF4FW03 METAL SKIRTING 1 1 0 29MAY04 29MAY04 MS1 4,320.00 MBF4FW02 CARPET COVERING 1 1 0 8.jun.04 8.jun.04 CC 2,871.00
3.th FLOOR STRUCTUAL WORKS
MBF3STR01 INSTALLATION OF THE MAIN BEAMS 7 7 0 31.jan.04 6.feb.04 SSTR2 16,128.00 MBF3STR02 INSTALLATION OF THE SUB BEAMS 3 3 0 1.feb.04 3.feb.04 SSTR1 10,080.00 MBF3STR03 MONTAGE OF THE TRAPES SLAB SURFACE 2 2 0 4.feb.04 5.feb.04 SSTR1 12,768.00 MBF3STR04 2 LEVEL REINFORCEMENT GRID FOR 3 ND FLOOR 1 1 0 6.feb.04 6.feb.04 RG 4,294.00 MBF3STR05 3rd FLOOR SLAB CONCRETE 1 1 0 7.feb.04 7.feb.04 CON1 7,968.55
FINE WORKS MBF3FW06 ROUGH PLASTERING 1 1 0 27.feb.04 27.feb.04 RPLS1 159.03 MBF3FW04 TILES FOR WALLS 1 1 0 2.mar.04 2.mar.04 TIL2 641.04 MBF3FW07 GYPSUM PLASTERING 10 10 0 01MAY04 10MAY04 GPLS2 3,523.59 MBF3FW01 GRANIT TILES FOR FLOOR 11 11 0 12MAY04 22MAY04 GTL1 40,899.08 MBF3FW03 MATT WATER BASED PAINTING 5 5 0 23MAY04 27MAY04 PTG2 6,921.35 MBF3FW05 ROCKWOOD SUSPENDING CEILING 3 3 0 29MAY04 31MAY04 RSC2 8,920.50 MBF3FW02 METAL SKIRTING 1 1 0 29MAY04 29MAY04 MS2 5,400.00
2.th FLOOR STRUCTUAL WORKS
MBF2STR01 ERECTION OF THE 2nd STEP COLUMNS 3 3 0 20.jan.04 22.jan.04 SSTR2 36,960.00 MBF2STR02 INSTALLATION OF THE CONNECTION PLATES 1 1 0 23.jan.04 23.jan.04 SSTR2 2,688.00 MBF2STR03 INSTALLATION OF THE MAIN BEAMS 7 7 0 24.jan.04 30.jan.04 SSTR2 16,800.00 MBF2STR04 INSTALLATION OF THE SUB BEAMS 3 3 0 26.jan.04 28.jan.04 SSTR1 11,424.00 MBF2STR05 MONTAGE OF THE TRAPES SLAB SURFACE FOR 2nd FLOOR 2 2 0 29.jan.04 30.jan.04 SSTR1 12,768.00 MBF2STR06 2 LEVELS REINFORCEMENT GRID FOR 2st FLOOR 1 1 0 31.jan.04 31.jan.04 RG 4,294.00 MBF2STR07 2nd FLOOR SLAB CONCRETE 1 1 0 1.feb.04 1.feb.04 CON1 7,886.40
FINE WORKS MBF2FW05 ROUGH PLASTERING 1 1 0 27.feb.04 27.feb.04 RPLS2 159.03 MBF2FW06 GYPSUM PLASTERING 10 10 0 11MAY04 20MAY04 GPLS1 8,480.11

BABNIK, Ž. 2006. Resource constrained scheduling - a case study using Primavera Project Planner 3.1 84 Graduation Thesis - UNI. Ljubljana, UL, FCEG, Civil engineering, Division of Municipal Economics
MBF2FW01 GRANIT TILES FOR FLOOR 11 11 0 21MAY04 31MAY04 GTL2 38,328.28 MBF2FW03 MATT WATER BASED PAINTING 5 5 0 1.jun.04 5.jun.04 PTG1 7,054.88 MBF2FW04 ROCKWOOD SUSPENDING CEILING 3 3 0 6.jun.04 8.jun.04 RSC1 9,659.60 MBF2FW02 METAL SKIRTING 1 1 0 6.jun.04 6.jun.04 GTL1 32,417.70
1.th FLOOR STRUCTUAL WORKS
MBF1STR01 MAIN BEAMS INSTALLATION OF THE FIRST FLOOR 4 4 0 12.jan.04 15.jan.04 SSTR1 16,800.00 MBF1STR02 SUB BEAMS INSTALLATION OF THE 1st LEVEL 3 3 0 13.jan.04 15.jan.04 SSTR2 11,424.00 MBF1STR03 MONTAGE OF THE TRAPES SLAB SURFACE FOR 1st FLOOR 2 2 0 16.jan.04 17.jan.04 SSTR2 12,768.00 MBF1STR04 2 LEVELS REINFORCEMENT GRID FOR 1st FLOOR 1 1 0 18.jan.04 18.jan.04 RG 3,942.00 MBF1STR05 1st LEVEL SLAB CONCRETE 1 1 0 19.jan.04 19.jan.04 CON1 7,147.05
FINE WORKS MBF1FW06 ROUGH PLASTERING 1 1 0 26.feb.04 26.feb.04 RPLS2 160.19 MBF1FW04 TILES FOR WALLS 2 2 0 3.mar.04 4.mar.04 TIL1 846.71 MBF1FW07 GYPSUM PLASTERING 11 11 0 01MAY04 11MAY04 GPLS2 9,858.34 MBF1FW01 GRANIT TILES FOR FLOOR 9 9 0 23MAY04 31MAY04 GTL1 35,395.61 MBF1FW03 MATT WATER BASED PAINTING 1 1 0 1.jun.04 1.jun.04 PTG2 8,197.20 MBF1FW02 METAL SKIRTING 1 1 0 2.jun.04 2.jun.04 MS2 4,920.00 MBF1FW05 ROCKWOOD SUSPENDING CEILING 3 3 0 6.jun.04 8.jun.04 RSC1 8,911.00
GROUND FLOOR STRUCTUAL WORKS
MBGSTR01 INSTALLATION OF THE ANKRAJ PLAQUES 2 2 0 4.jan.04 5.jan.04 SSTR2 4,704.00 MBGSTR02 ERECTION OF THE 1st STEP COLUMNS 3 3 0 6.jan.04 8.jan.04 SSTR1 36,960.00 MBGSTR03 INSTALLATION OF THE MAIN BEAMS 4 4 0 8.jan.04 11.jan.04 SSTR2 16,800.00 MBGSTR04 INSTALLATION OF THE SUB BEAMS 3 3 0 9.jan.04 11.jan.04 SSTR1 11,424.00 MBGSTR05 MONTAGE OF THE TRAPES SLAB SURFACE 1 1 0 12.jan.04 12.jan.04 SSTR2 12,768.00 MBGSTR06 2 LEVELS REINFORCEMENT GRID FOR GROUND FLOOR 1 1 0 13.jan.04 13.jan.04 RG 3,942.00 MBGSTR07 GROUND LEVEL SLAB CONCRETE 1 1 0 14.jan.04 14.jan.04 CON1 7,147.05
FINE WORKS MBGFW06 ROUGH PLASTERING 1 1 0 26.feb.04 26.feb.04 RPLS1 159.03 MBGFW05 TILES FOR WALLS 2 2 0 3.mar.04 4.mar.04 TIL2 846.71 MBGFW07 GYPSUM PLASTERING 5 5 0 21MAY04 25MAY04 GPLS1 3,207.65 MBGFW01 GRANIT TILES FOR FLOOR 12 12 0 1.jun.04 12.jun.04 GTL2 39,730.53 MBGFW03 MATT WATER BASED PAINTING 3 3 0 13.jun.04 15.jun.04 PTG1 2,668.55 MBGFW04 ROCKWOOD SUSPENDING CEILING 3 3 0 16.jun.04 18.jun.04 RSC1 9,667.20 MBGFW02 METAL SKIRTING 1 1 0 16.jun.04 16.jun.04 MS1 1,669.56
BASEMENT STRUCTUAL WORKS
MBBSTR01 REINFORCEMENT OF BASEMENT CURTAIN WALLS,COLUMN 5 5 0 11.dec.03 15.dec.03 REIN 1 9,908.10 MBBSTR02 FORMWORK FOR BASEMENT CURTAIN WALLS,COLUMNS 6 6 0 12.dec.03 17.dec.03 FRM1 8,232.96 MBBSTR05 REINFORCEMENT OF SLAB 5 5 0 16.dec.03 20.dec.03 REIN 1 21,797.82 MBBSTR03 CONCRETE FOR BASEMENT FOR CURTAIN WALLS,COLUMNS 1 1 0 18.dec.03 18.dec.03 CON1 7,639.95 MBBSTR04 FORMWORK FOR SLAB 7 7 0 20.dec.03 26.dec.03 FRM1 18,524.16 MBBSTR06 BS30 CONCRETE FOR SLAB 1 1 0 27.dec.03 27.dec.03 CON1 7,639.95
INSULATION MBBISO01 APPLIYING EPC FOR WATER INSULATION TO WALLS 1 1 0 17.jan.04 17.jan.04 ISO5 8,832.00
MBBISO02 WATER INSULATION FOR CURTAIN WALLS WITH FORMBOARD 1 1 0 17.jan.04 17.jan.04 ISO4 8,832.00
FINE WORKS MBBFW02 GYPSUM PLASTERING 7 7 0 18.dec.03 24.dec.03 GPLS2 6,219.65
FINE WORK1 BEGINNING OF THE FINE WORKS 0 0 0 18.dec.03 0.00 MBBFW01 ROUGH PLASTERING 2 2 0 18.dec.03 19.dec.03 RPLS1 425.80 MBBFW03 TILES FOR WALLS 3 3 0 5.mar.04 7.mar.04 TIL1 2,117.57 MBBFW04 GRANIT TILES FOR FLOOR 6 6 0 1.jun.04 6.jun.04 GTL1 40,112.00 MBBFW06 MATT WATER BASED PAINTING 7 7 0 7.jun.04 13.jun.04 PTG2 5,174.33 MBBFW07 ROCKWOOD SUSPENDING CEILING 2 2 0 14.jun.04 15.jun.04 RSC2 7,628.50 MBBFW05 METAL SKIRTING 1 1 0 15.jun.04 15.jun.04 MS2 4,918.80
FINE WORK2 END OF THE FINE WORKS 0 0 0 18.jun.04 0.00 FOUNDATION STRUCTUAL WORKS
MBFSTR01 LEAN CONCRETE 1 1 0 30.nov.03 30.nov.03 CON3 4,415.34 STRUCT.W1 BEGINNING OF STRUCTURAL WORKS 0 0 0 30.nov.03 0.00 MBFSTR02 FORMWORK FOR FOUNDATION 10 10 0 1.dec.03 10.dec.03 FRM1 21,440.00 MBFSTR03 REINFORCEMENT FOR FOUNDATION 7 7 0 4.dec.03 10.dec.03 REIN 1 74,310.75 MBFSTR04 BS30 CONCRETE FOR FOUNDATION 1 1 0 11.dec.03 11.dec.03 CON1 50,933.00 MBFSTR05 PROTECTION CONCRETE 1 1 0 14.dec.03 14.dec.03 CON2 2,326.02
INSULATION ISOLATION1 BEGINNING OF THE INSULATION WORKS 0 0 0 12.dec.03 0.00
MBFISO01 LYING MEBRANE+APPLYING EPC 1 1 0 13.dec.03 13.dec.03 ISO3 9,117.72

BABNIK, Ž. 2006. Resource constrained scheduling - a case study using Primavera Project Planner 3.1 85 Graduation Thesis - UNI. Ljubljana, UL, FCEG, Civil engineering, Division of Municipal Economics
MOBILIZATION & START UP WORKS 1 BEGINNING OF THE PROJECT 0 0 0 14.nov.03 0.00
MOB01 SITE MOBILIZATION 7 7 0 14.nov.03 20.nov.03 GENER1 518.00 EARTH WORKS
EARTHWORK1 BEGINNING OF EARTH WORKS 0 0 0 14.nov.03 0.00 EW01 EXCAVATION 8 8 0 21.nov.03 28.nov.03 EW1 7,904.26
EW02 HAND EXCAVATION 7 7 0 21.nov.03 27.nov.03 HAND EXC 1,488.00
EW03 LINING WITH QUARRYSTONE 1 1 0 29.nov.03 29.nov.03 EW2 1,019.82 EW05 LIEING DRENAJ PIPE 1 1 0 18.jan.04 18.jan.04 GENER1 8,584.00
EARTHWORK2 END OF EARTH WORKS 0 0 0 18.jan.04 0.00 EW04 FILLING WITH GRANULAR MATERIAL 3 3 0 19.jan.04 21.jan.04 EW3 1,408.32
WALL & MASONRY WO WM05 FULL BRICK WALL 7 7 0 15.dec.03 21.dec.03 WM1 4,399.67
WMASONRY1 BEGINNING OF THE WALL AND MASONRY WORKS 0 0 0 22.dec.03 0.00 WM03 BIMS10 5 5 0 21.feb.04 25.feb.04 WM2 2,061.40 WM04 BIMS20 4 4 0 21.feb.04 24.feb.04 WM3 3,270.20 WM06 CUBICAL DEMONTABLE WALL 0 0 0 8.mar.04 7.mar.04 DW2 0.00 WM02 GYPSUM WALL20 40 40 0 22.mar.04 30.apr.04 GW2 38,001.36 WM01 GYPSUM WALL10 30 30 0 22.mar.04 20.apr.04 GW1 21,648.26 WM07 DEMOUNTABLE WALL WITH JALUZZI 7 7 0 7.jun.04 13.jun.04 DW1 30,690.00
WMASONRY2 END OF THE WALL AND MASONRY WORKS 0 0 0 13.jun.04 0.00 METAL WORKS
MTW02 METAL SUB FRAMING 20*40 30 30 0 21.feb.04 21.mar.04 MSF 101,600.00 MTW01 METAL DOOR FRAMING 1 1 0 01MAY04 01MAY04 MEF 6,462.50
MECHANICAL WORKS MW03 CILLER SYSTEM 7 7 0 28.dec.03 3.jan.04 MEC3 265,350.00 MW04 MISCELLANEOUS MECHANICAL WORKS 60 60 0 28.dec.03 25.feb.04 MEC4 63,362.00
MECHANICW1 BEGINNING OF THE MECHANICAL WORKS 0 0 0 28.dec.03 0.00 MW06 LAB.TECH 20 20 0 2.mar.04 21.mar.04 MEC6 44,101.00 MW05 FIRE PROTECTION SYSTEM 10 10 0 3.mar.04 12.mar.04 MEC5 12,038.00 MW01 VENTILATION 30 30 0 11.apr.04 10MAY04 MEC1 198,600.00 MW02 HEATING CENTRAL 20 20 0 11.apr.04 30.apr.04 MEC2 39,749.00
MECHANICW2 END OF MECHANICAL WORKS 0 0 0 10MAY04 0.00 MW07 AUTOMATIC CONT 7 7 0 16.jun.04 22.jun.04 MEC7 59,800.00
ELECTRITICAL WORKS ELW03 GALVANIZING ELECTIRAL CHANNELS 4 4 0 25.dec.03 28.dec.03 EL03 37,768.00
ELECTRW1 BEGINNING OF ELECTRICAL WORKS 1 1 0 25.dec.03 25.dec.03 0.00 ELW05 MAIN CABLING 10 10 0 29.dec.03 7.jan.04 EL05 37,878.00 ELW06 GROUNDING 2 2 0 29.dec.03 30.dec.03 EL06 6,264.00 ELW04 DATA NETWORK CABLING 2 2 0 29.dec.03 30.dec.03 EL04 21,515.00 ELW07 PHONE CABLING 2 2 0 2.jan.04 3.jan.04 EL07 13,300.00 ELW12 ELECTRICAL PIPING(PVC BORU VE AKSESUARLARI) 10 10 0 21.feb.04 1.mar.04 EL12 6,477.00 ELW13 ELECTRICAL UTILITIES(saltlar ve panolar) 7 7 0 2.mar.04 8.mar.04 EL13 36,180.00 ELW08 GENERATOR INSTALLATION 7 7 0 2.mar.04 8.mar.04 EL08 42,451.00 ELW02 INTERIOR LIGHTING(sortiler) 15 15 0 2.mar.04 16.mar.04 EL02 21,934.00 ELW10 LIFT INSTALLATION 10 10 0 2.mar.04 11.mar.04 EL10 22,148.00 ELW11 EXTERIOR LIGHTS 7 7 0 2.mar.04 8.mar.04 EL11 65,084.00 ELW01 ELECTRICAL ARMATURE MONTAGE 7 7 0 1.jun.04 7.jun.04 EL01 54,182.00 ELW09 UPS MONTAGE 2 2 0 14.jun.04 15.jun.04 EL09 6,505.00
ELECTRW2 END OF ELECTRICAL WORKS 1 1 0 16.jun.04 16.jun.04 0.00 SITE ROAD WORKS
SRW01 SEWERAGE WORKS 2 2 0 26.feb.04 27.feb.04 SW, MH 2,926.20 SRW02 STORM WATER WORKS 1 1 0 26.feb.04 26.feb.04 SWW, MH 1,844.00 SRW03 LANDSCAPING 15 15 0 28.feb.04 13.mar.04 GENER3 88.00
SPECIAL WORKS SW08 PAINTING ON METAL WORKS FOR FIRE PROTECTION 1 1 0 25.feb.04 25.feb.04 FP 18,750.00
SPECIALW1 BEGINNING OF SPECIAL WORKS 0 0 0 25.feb.04 0.00 SW05 METAL DOORS 1 1 0 25.feb.04 25.feb.04 MDF 900.00 SW06 CHIMNEY CONSTRUCTION 3 3 0 26.feb.04 28.feb.04 CIMC 5,550.00 SW01 ALUMINIUM FACADE WORKS 60 60 0 2.mar.04 30.apr.04 FW1 188,653.50 SW02 CUBICAL DOORS 1 1 0 8.mar.04 8.mar.04 DW2 9,720.00 SW10 COMPOSIT PANEL WORKS 15 15 0 01MAY04 15MAY04 CP 39,600.00 SW11 TEMPERED DOUBLE GLAZING 15 15 0 01MAY04 15MAY04 TDG 219,060.00 SW03 GRANITE TILES FOR STAIRS 12 12 0 16.jun.04 27.jun.04 GTFS 15,548.11 SW04 LAMINATED DOORS 7 7 0 16.jun.04 22.jun.04 LD 30,498.82 SW09 GRANITE BENCH(TEZGAH) 1 1 0 23.jun.04 23.jun.04 GB 5,554.98 SW07 STAINLESS HANDRAIL 10 10 0 28.jun.04 7.jul.04 SHR 23,220.00
2 END OF THE PROJECT 0 0 0 7.jul.04 0.00

BABNIK, Ž. 2006. Resource constrained scheduling - a case study using Primavera Project Planner 3.1 86 Graduation Thesis - UNI. Ljubljana, UL, FCEG, Civil engineering, Division of Municipal Economics
Appendix B: The legend of added and used resources in the schedule
Sign of resource
Resource description Unit
price (YTL/unit)
Sign of resource
Resource description Unit
price (YTL/unit)
CC CARPET + LABOURING M2 16 HAND EXC HAND EXCAVATION CREW M3 9,6
CIMC CHIMNEY CONSTRUCTION M 185 ISO1 FORMBOARD M2 8,37 CON1 CONCRETE CREW+BS30 M3 82,15 ISO2 MEBRAN SERIMI M2 18 CON2 CONCRETE CREW+PROTECTION CONCRETE M3 59,55 ISO3 LEING MEMBRANE+EPC+LABOURING M2 16,34 CON3 CONCRETE CREW+LEAN CONCRETE M3 63,53 ISO4 FORMBOARD+BRICK+LABOURING M2 23
CP COMPOSIT PANEL+LABOURING M2 120 ISO5 EPC+LABOURING M2 23 DW1 DEMOUNTABLE WALL WITH JALUZZI CREW M2 225 LD LAMINATED DOORS+LABOURING M2 90,06 DW2 CUBICAL DEMOUNTABLE WALL+LABOURING M2 135 MDF METAL DOOR+LABOURING UNIT 150 ELO1 ELECTRICAL ALARM UNIT 54.182,00 MEC 1 VENTILATION GROUP 198.600,00 ELO2 INTERIOR LIGHTS UNIT 21.934,00 MEC2 HEATING SYSTEM GROUP 39.749,00 EL03 GALVANIC ELECTRICAL UNIT 37.768,00 MEC 3 CILLER SYSTEM GROUP 265.350,00 EL04 DATA UNIT 21.515,00 MEC 4 MECHANICAL WORKS GROUP 63.362,00 EL05 MAIN CAB UNIT 37.878,00 MEC 5 FIRE PROTECTION GROUP 12.038,00 EL06 GROUNDING UNIT 6.264,00 MEC 6 LAB GROUP 44.101,00 EL07 PHONE UNIT 13.300,00 MEC 7 OTOM GROUP 59.800,00 EL08 GENERATOR UNIT 42.451,00 MEF METAL FRAMING KG 2,5 EL09 UPS UNIT 6.503,00 MH MANHOLE UNIT 850 EL10 LIFT UNIT 22.148,00 MS1 METAL SKIRTING MTL 12 EL11 EX UNIT 65.084,00 MS2 METAL SKIRTING MTL 12 EL12 EL.PIPE UNIT 6.477,00 MSF METAL SUB FRAMING KG 2,54 EL13 EL.UT UNIT 3.618,00 PTG1 PAINTING CREW1 M2 5,49 EW1 EXCAVATION+LABOURING M3 1,82 PTG2 PAINTING CREW2 M2 5,49 EW2 QUARRY STONE+LABOURING M3 7,39 REIN 1 REINFORCEMENT CREW1 TN 990,81 EW3 GRANULLAR MATERIAL+LABOURING M3 4,89 RG REINFORCEMENT GRID+3MEN KG 1 EW4 PIPE COST+LABOURING M 18,92 RPLS1 ROUGH PLASTERING CREW1 M2 5,02 FP FIRE PROTECTION PAINT+LABOURING M2 37,5 RPLS2 ROUGH PLASTERING CREW2 M2 5,02
FRM1 FORMWORK M2 10,72 RSC 1 ROCKWOOD SUSPENDING CEILING 1 M2 19 FW1 FACADE ALUMINIUM WORK+LABOURING M2 79,5 RSC 2 ROCKWOOD SUSPENDING CEILING 2 M2 19 GB GRANITE BENCH+LABOURING M 145,8 SCR SCREED CREW M3 69
GENER1 GENERAL WORKS CREW (5 MAN) DAY 74 SHR STAINLESS HANDRAIL+LABORING MTL 135 GENER2 GENERAL WORKS CREW (2 MAN) TON 29 SSTR1 STEEL STRUCTURE CREW1 TON 672 GENER3 GENERAL WOEKS CREW (6 MEN) DAY 88 SSTR2 STEEL STRUCTURE CREW2 TON 672 GPLS1 GYPSUM PLASTERING M2 7,14 SW SEWERAGE WORKS M 12,54 GPLS2 GYPSUM PLASTERING M2 7,14 SWW STORMWTARE WORKS M 7,2
GR GRATON+LABOURING M2 66,44 TDG TEMPERED DOUBLE
GLAZING+LABORING M2 90 GTFS GRANIT TILES+LABOURING M 79,98 TIL1 TILING FOR WALLS M2 26,71 GTL1 GRANIT TILES CREW 1 M2 75,39 TIL2 TILING FOR WALLS M2 26,71 GTL2 GRANIT TILES CREW 2 M2 75,39 WM1 MASONRY CREW FOR BRICK M2 8,4 GW1 GYPSUM WALL 10 CREW1 M2 17,9 WM2 MASONRY CREW FOR BIMS10 M2 9,37 GW2 GYPSUM WALL 20 CREW2 M2 24,36 WM3 MASONRY CREW FOR BIMS20 M2 13,28
Appendix C: Schedule of MBB

BABNIK, Ž. 2006. Resource constrained scheduling - a case study using Primavera Project Planner 3.1 87 Graduation Thesis - UNI. Ljubljana, UL, FCEG, Civil engineering, Division of Municipal Economics
REFERENCES Used references A Guide to the Project Management Body of Knowledge. 2000. Pennsylvania, Project Management Institute, Inc: 211 p. A. Marchman, D., L. Anderson, T. 2003. Construction Scheduling with Primavera Enterprise, Second Edition. New York: Delmar Learning, Inc: 367 p. Cook, B., Williams, P. 2004. Construction Planning, Programming and Control. Oxford, Blackwell Publishing Ltd: 442 p. Engineering & Construction, 2006. Bala Cynwyd, Primavera Systems, Inc. http://www.primavera.com/industry/ec/index.asp (1.6.2006). Gordon, J., Tulip, A. 1997. Resource Scheduling. International Journal of Project management, 15, 6: 359-370. Hajdu, M. 1997. Network Scheduling Techniques for Construction Project Management. Dordrecht: Kluwer Academic Publishers: 329 p. J.Libertone, M., P. Johnson, B., A.Smith, C. 2001. Project Management in Construction: Software Use and Research Directions. Journal of Construction Engineering and Management, 127, 2: 101-107. Kyunghwan, K., Garza, J. 2003. Phantom Float. Journal of Construction Engineering and Management, 129, 5: 507-517. Primavera Project Planner P3- Reference, 2001. Bala Cynwyd, Primavera Systems, Inc: 740p. Pilcher, R. 1998. Principles of Construction Management. Santa Barbara, CA, Prentice Hall, 356p. Suhanic, G. 2001. Computer-Aided Project Management. New York, Oxford University Press, Inc: 472 p. Sağlamer, A., Aksoy M., Dursun, P. 2004. İTÜ 2001 Atılım 2004 Yeni Ufuklar. Istanbul, Istanbul Technical University: p. 174-177. Sniedovich, M. 2005. Towards an AoA-Free Courseware for the Critical Path Method. Informs Transactions on Education, 5, 2. http://ite.pubs.informs.org/Vol5No2/Sniedovich/ (1.6.2006).

BABNIK, Ž. 2006. Resource constrained scheduling - a case study using Primavera Project Planner 3.1 88 Graduation Thesis - UNI. Ljubljana, UL, FCEG, Civil engineering, Division of Municipal Economics
Other references Bowers, J.A. 2000. Interpreting Float in Resource Constrained Projects. International Journal of Project Management, 18, 1: 385-392. Brucker, P., Drexl, A., Mőhring, R., Neumann, K., Pesch, E. 1998. Resource-constrained Project Scheduling: Notation, Classification, Models, and Methods. European Journal of Operational Research, 112, 1: 3-41. Kolisch, R. 1996. Efficient Priority Rules for the Resource-constrained Project Scheduling Problem. Journal of Operations Management, 14, 1: 179-192. Nudtasomboon, N., U.Randhawa, S. 1997. Resource-constrained Scheduling with Renewable and Non-renewable Resources and Time-resource Tradeoffs. Computer Ind. Engng., 32, 1: 227-242.