planning for future hazards...200 300 400 500 600 700 800 900 fy00 fy01 fy02 fy03 fy04 fy05 fy06...
TRANSCRIPT
Planning for Future Hazards
Topic Overview:
• Floodplain management strategies to reduce future damage
• Planning and recovery strategies
• Short term and long term risk reduction
• Setting a floodplain management vision
• Partnerships with local stakeholders

Planning for Future Hazards
Community Risk Dashboard Concept
Flood Risk Portfolio
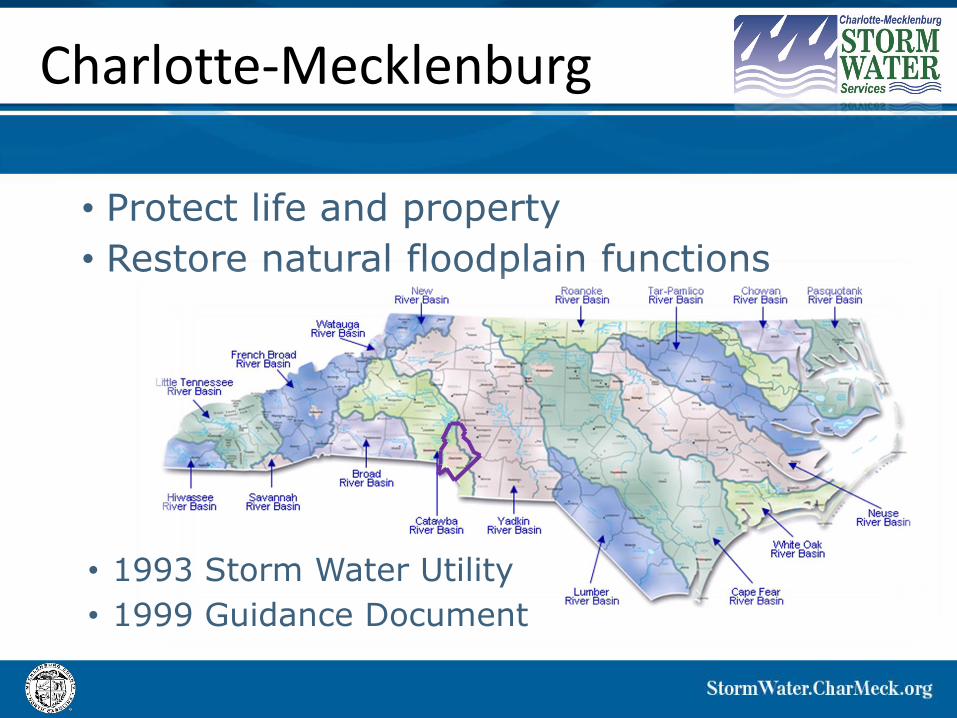
Charlotte-Mecklenburg
• Protect life and property
• Restore natural floodplain functions
• 1993 Storm Water Utility
• 1999 Guidance Document
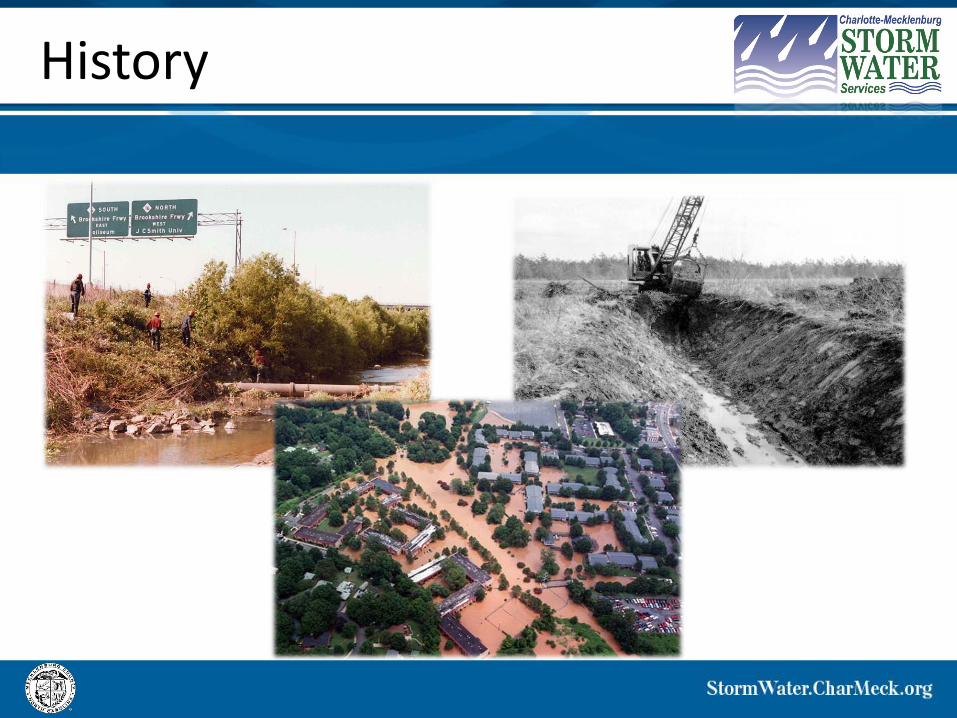
History
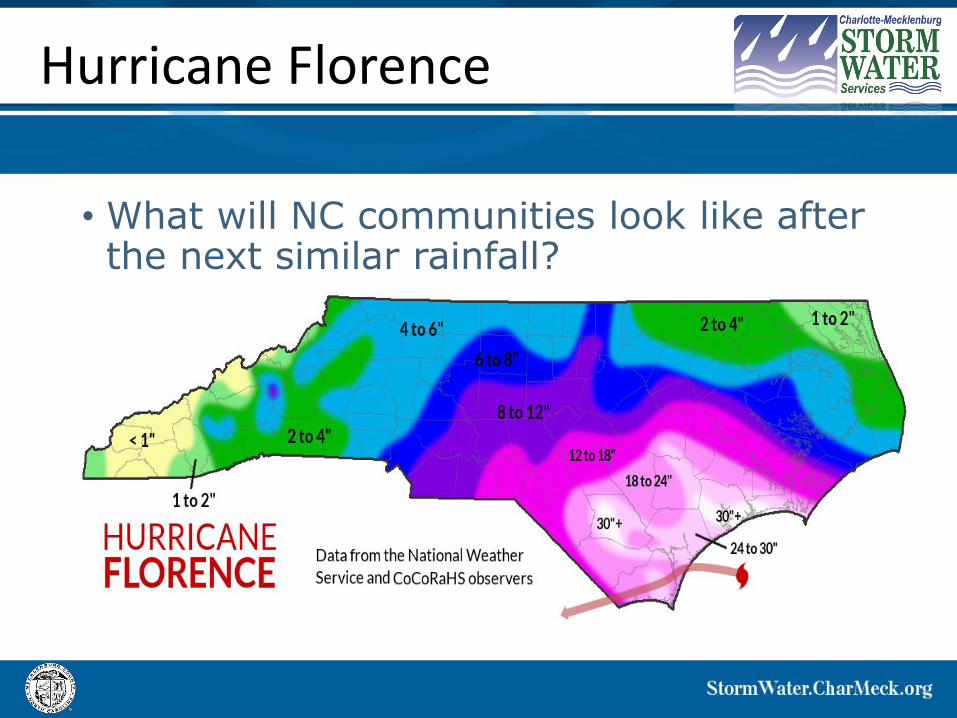
Hurricane Florence
• What will NC communities look like after the next similar rainfall?
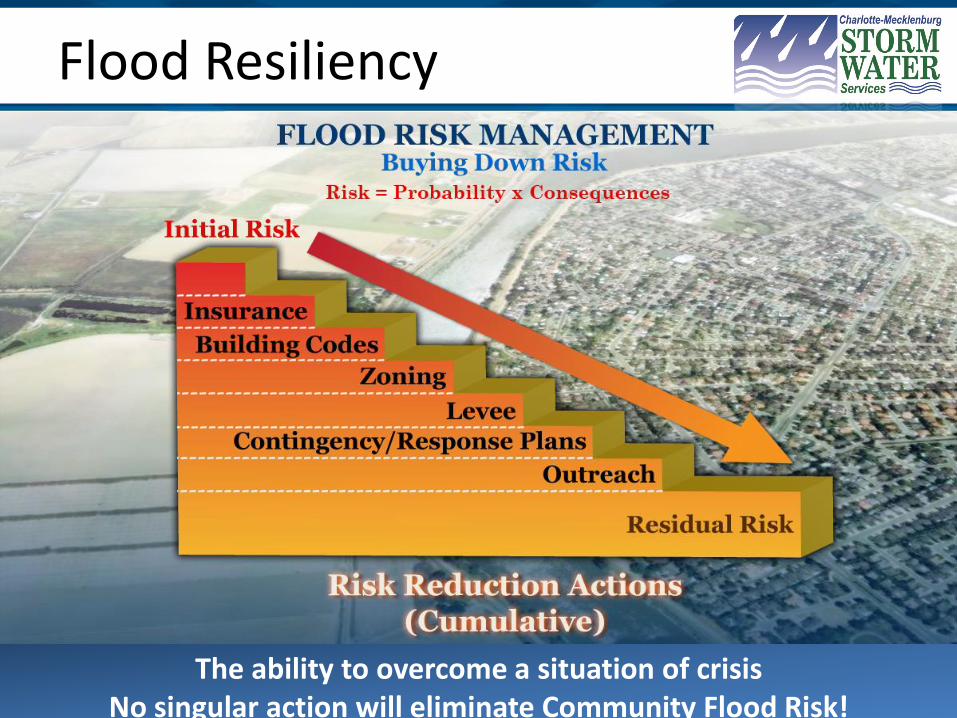
Flood Resiliency
The ability to overcome a situation of crisis No singular action will eliminate Community Flood Risk!

8
Flood Risk Management
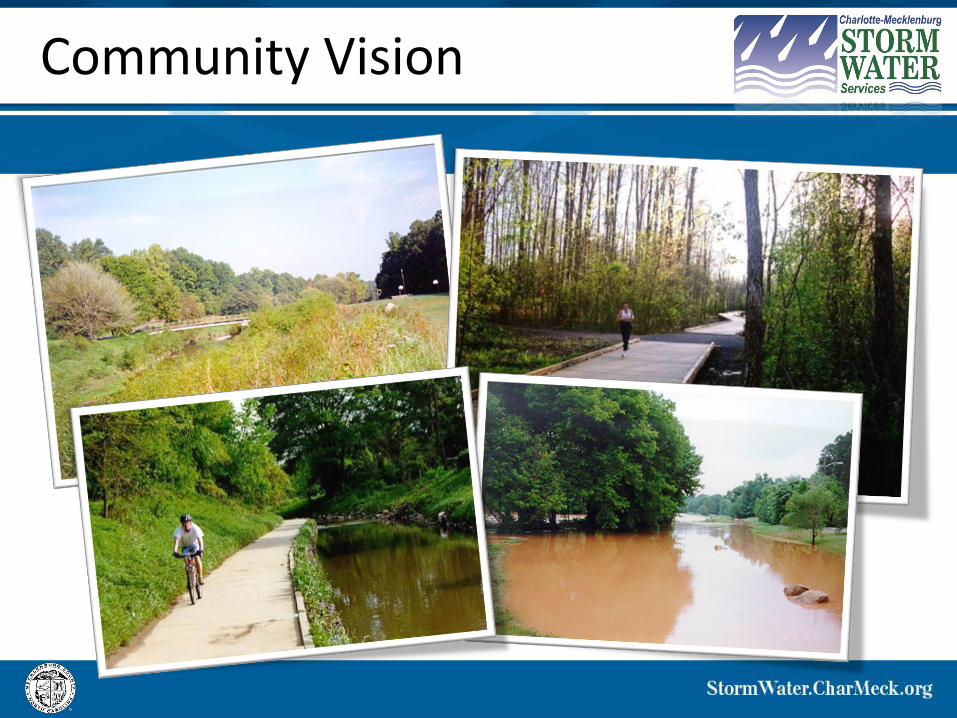
Community Vision
Begin with the END in Mind
Community Values & Priorities:▫ Floodplains
▫ Community Resilience
▫ Health & Safety
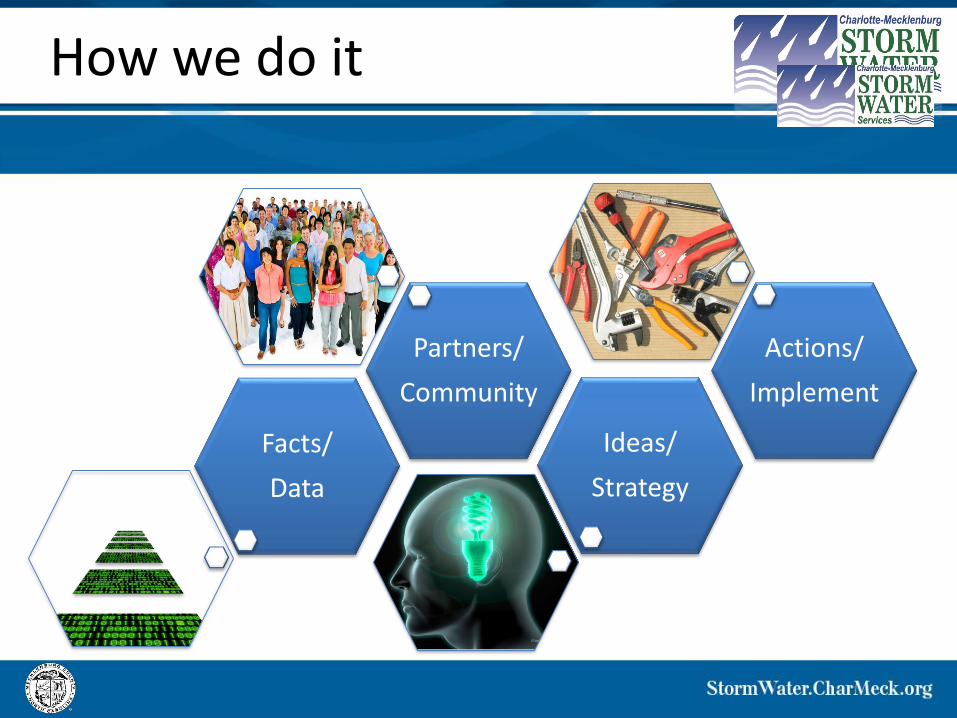
How we do it
Facts/
Data
Actions/
Implement
Partners/
Community
Ideas/
Strategy
Food for thought…
• Approach to developing a vision?
• Adequately promote long term resilience?
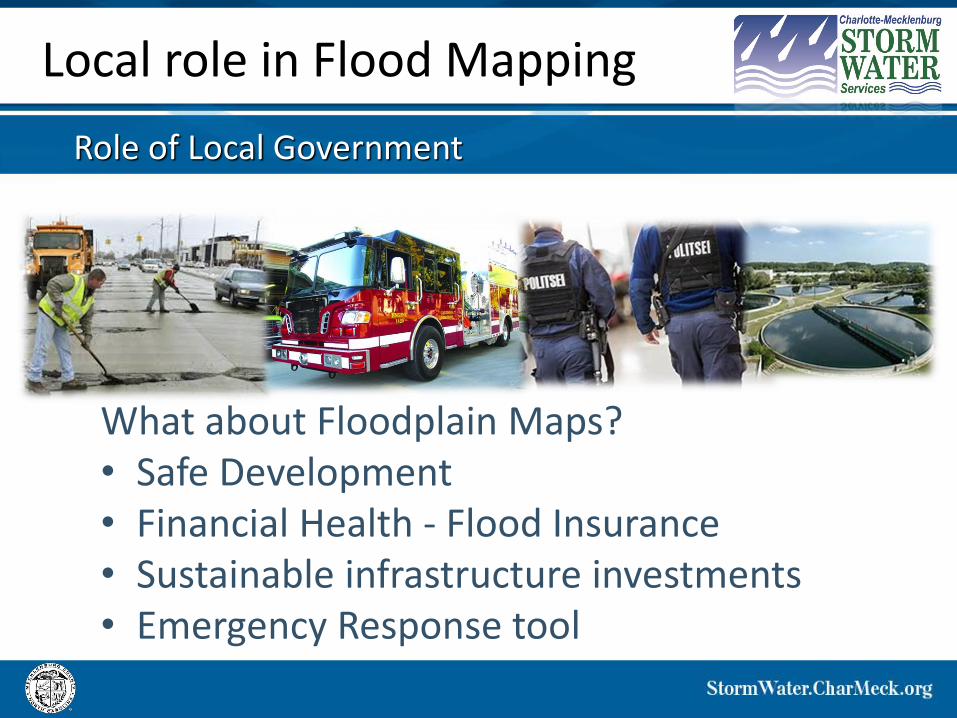
Local role in Flood Mapping
What about Floodplain Maps?• Safe Development• Financial Health - Flood Insurance• Sustainable infrastructure investments• Emergency Response tool
Role of Local Government
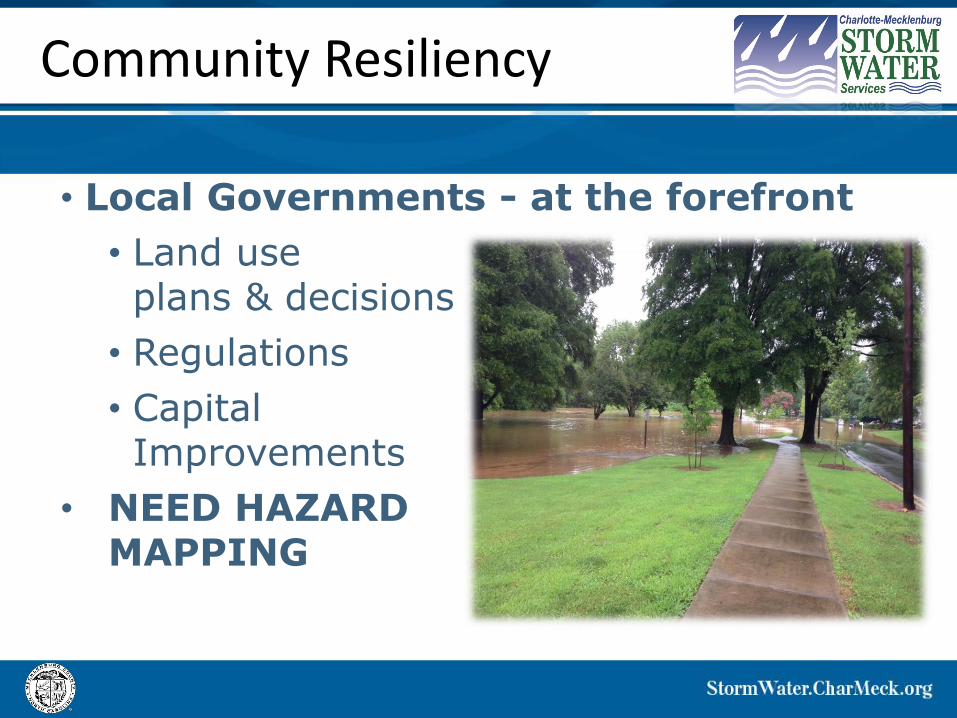
• Local Governments - at the forefront
• Land use plans & decisions
• Regulations
• Capital Improvements
• NEED HAZARDMAPPING
Community Resiliency
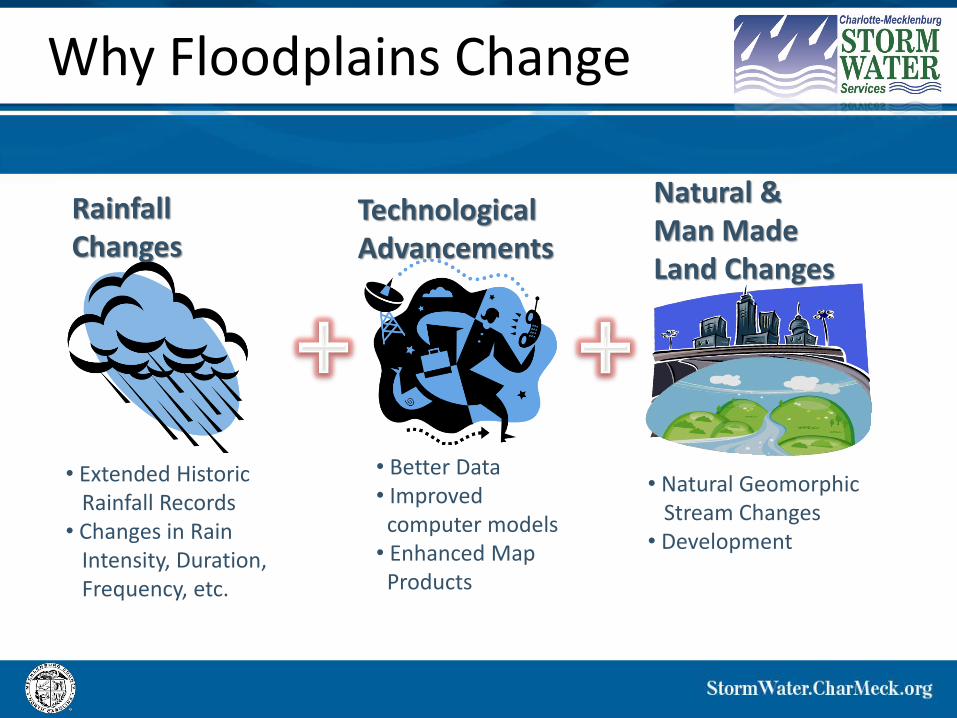
Why Floodplains Change
Technological Advancements
Natural & Man Made Land Changes
RainfallChanges
• Extended Historic Rainfall Records
• Changes in Rain Intensity, Duration,Frequency, etc.
• Better Data• Improved
computer models• Enhanced Map
Products
• Natural GeomorphicStream Changes
• Development
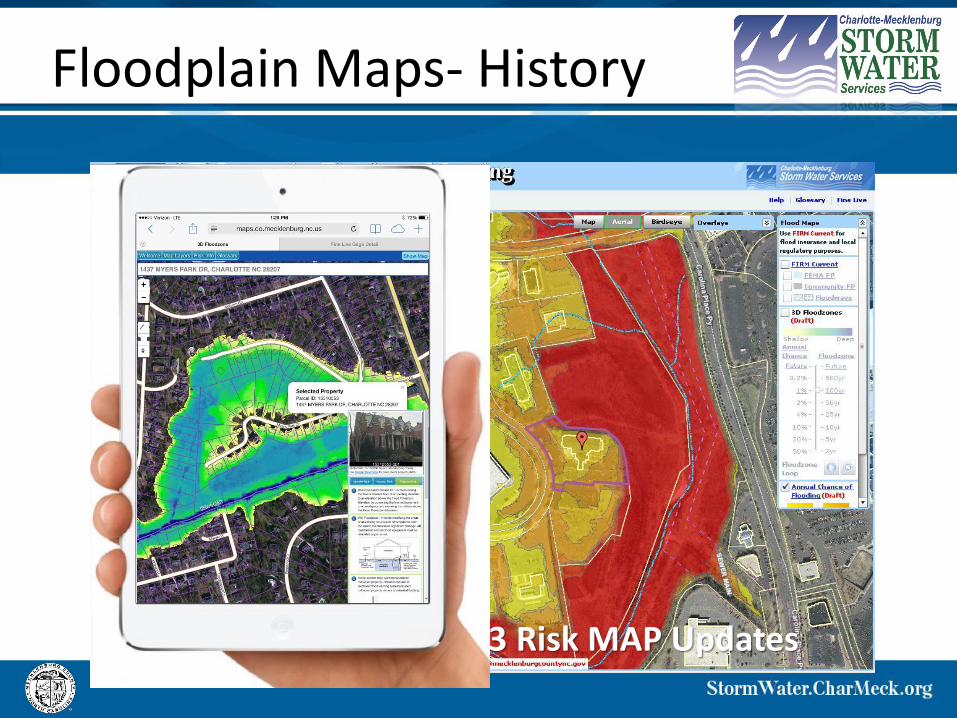
First Maps Dated 1978 – 20041% annual chance Flood
Floodplain Maps- History
Map Updates 20041% annual chance Flood
Insurance Maps available online with additional property information
2013 Risk MAP Updates
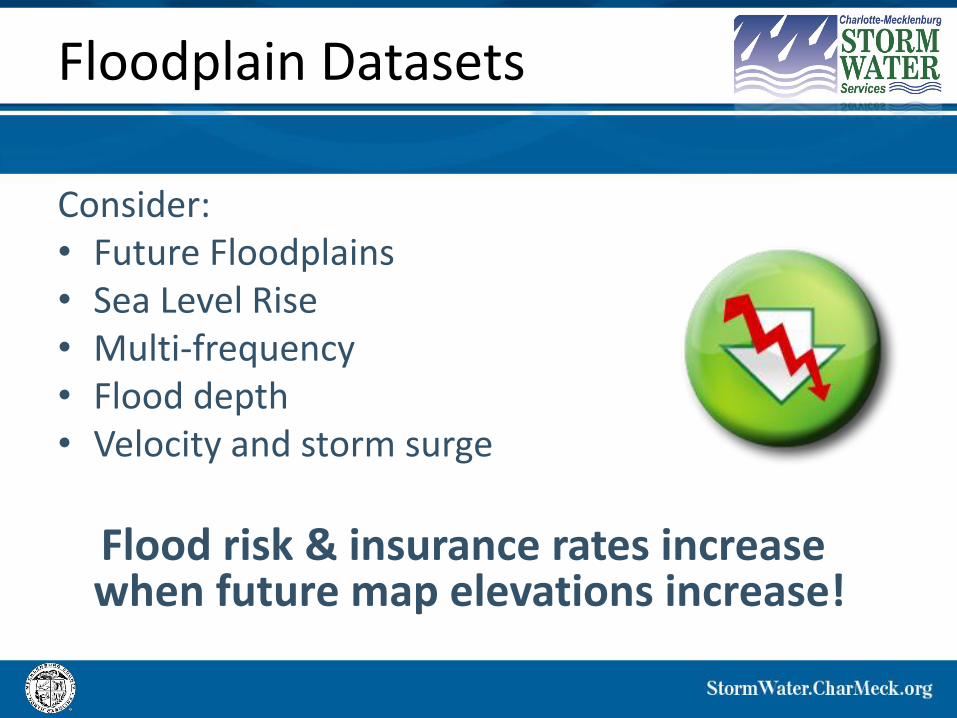
Floodplain Datasets
Consider:• Future Floodplains• Sea Level Rise• Multi-frequency• Flood depth• Velocity and storm surge
Flood risk & insurance rates increasewhen future map elevations increase!
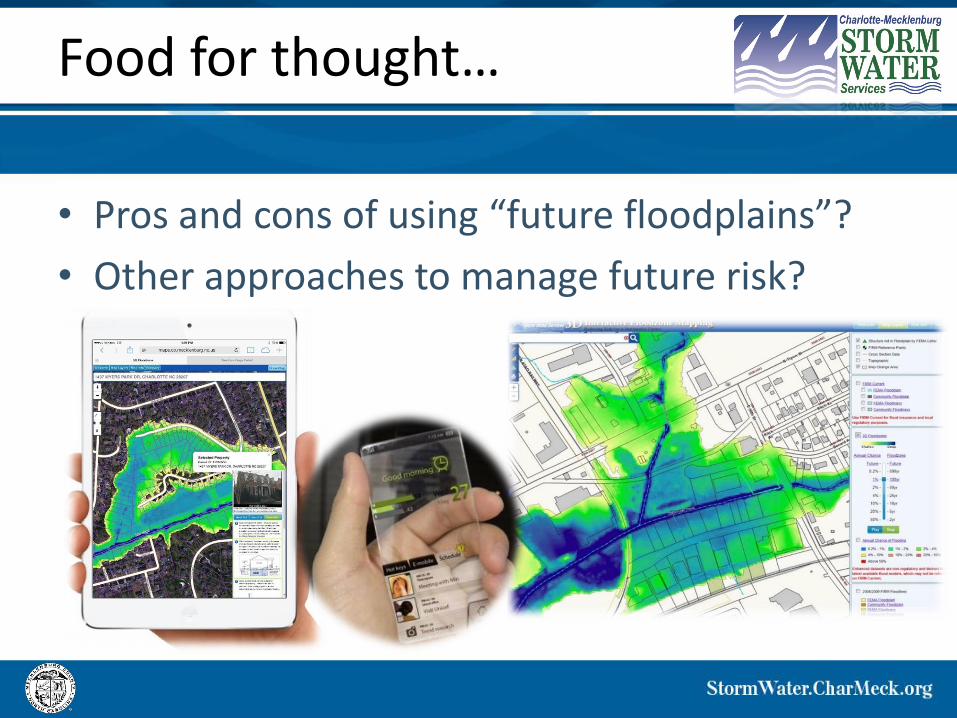
Food for thought…
• Pros and cons of using “future floodplains”?
• Other approaches to manage future risk?
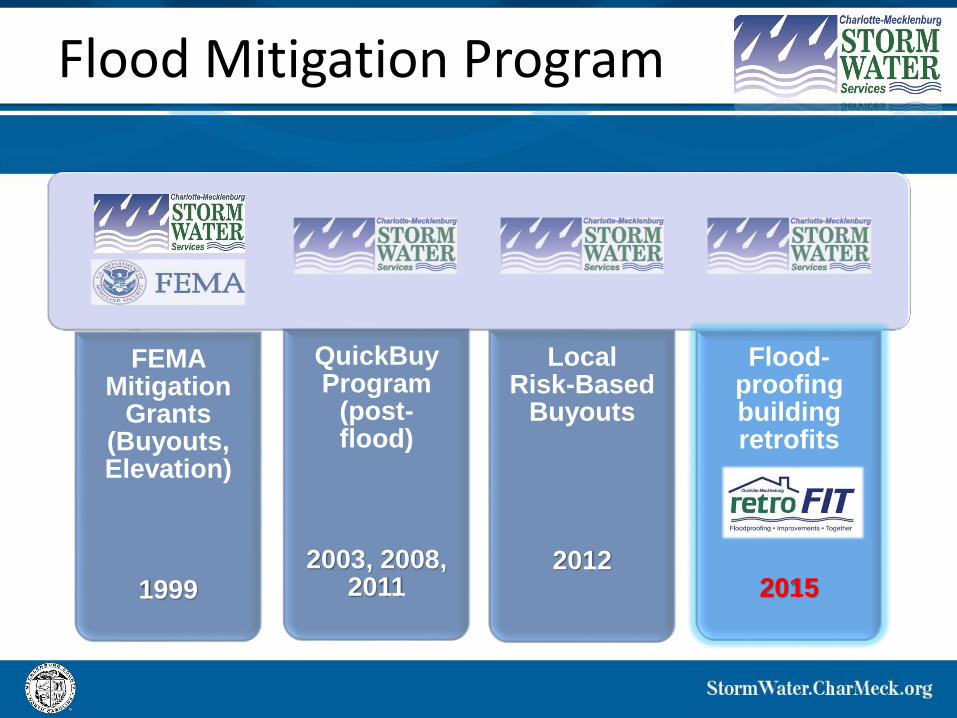
Flood Mitigation Program
FEMA Mitigation
Grants (Buyouts, Elevation)
1999
QuickBuyProgram
(post-flood)
2003, 2008, 2011
Local Risk-Based
Buyouts
2012
Flood-proofing building retrofits
2015
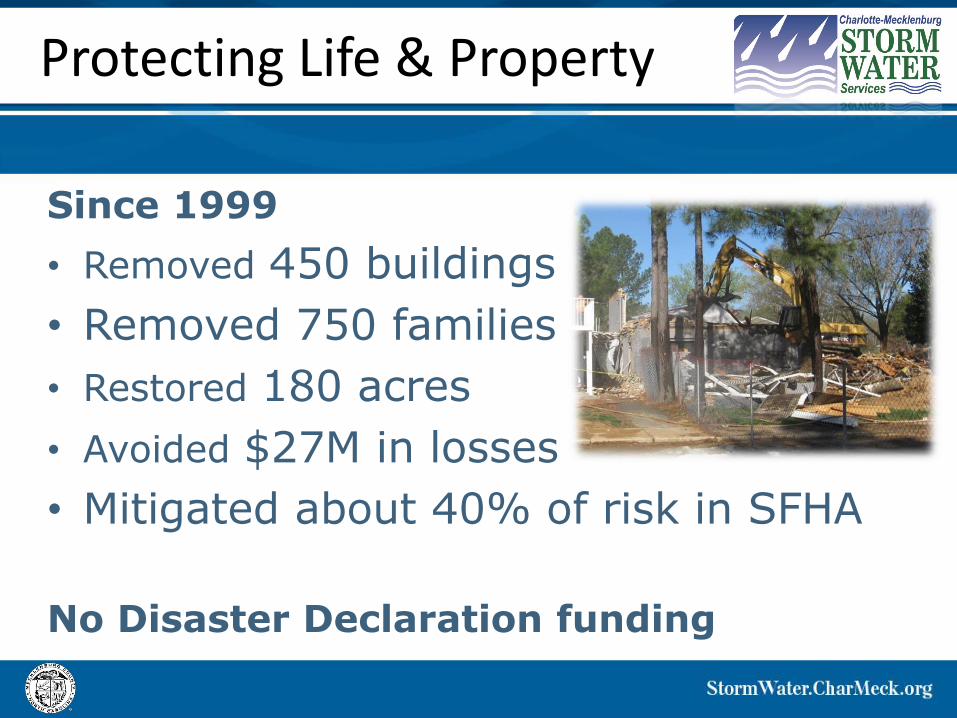
Since 1999
• Removed 450 buildings
• Removed 750 families
• Restored 180 acres
• Avoided $27M in losses
• Mitigated about 40% of risk in SFHA
No Disaster Declaration funding
Protecting Life & Property

Since 1996
• Creek Use Policy
• CIP Projects
• Over 30 Floodplain miles
• Development Ordinances
• Buffers
• LID & Post-Construction Controls
• Greenway Development
• 50 miles, 200 mile goal
Enhance Quality of Life
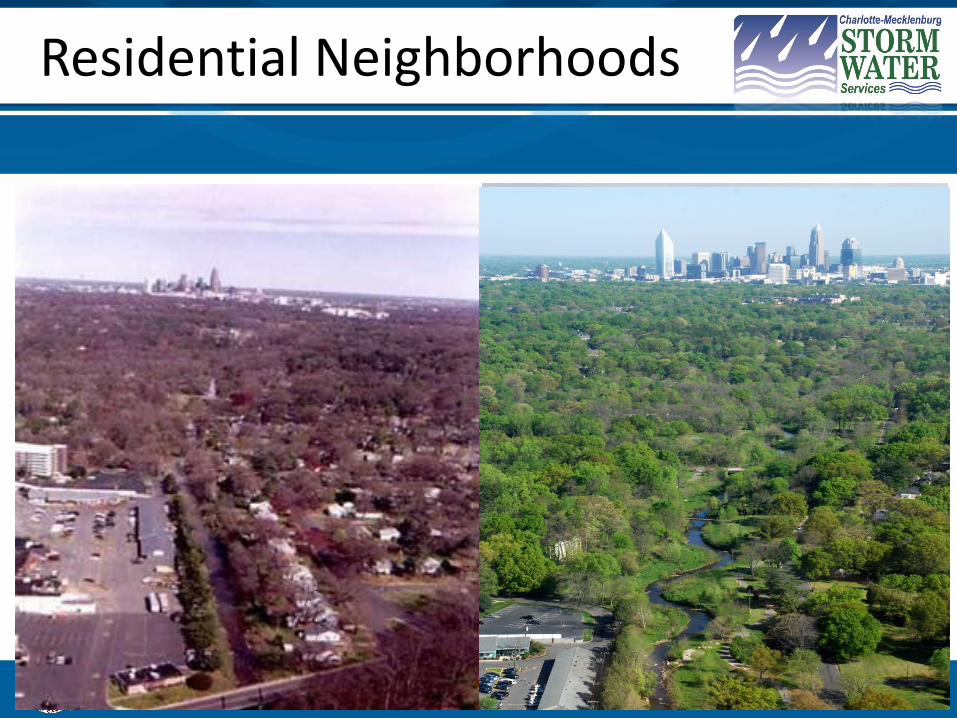
Residential Neighborhoods
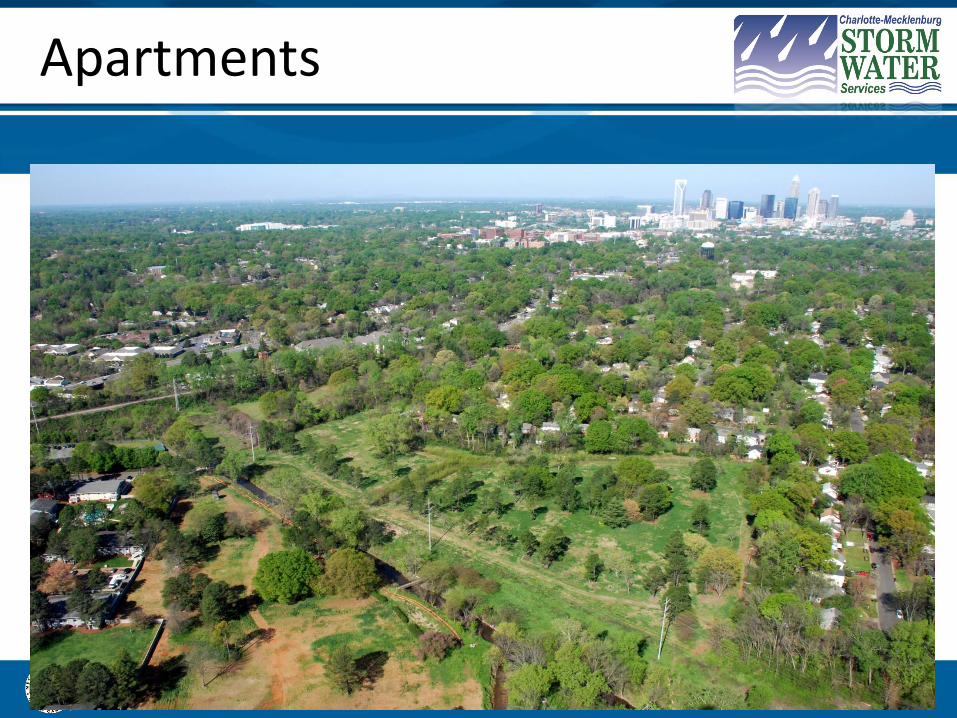
Apartments
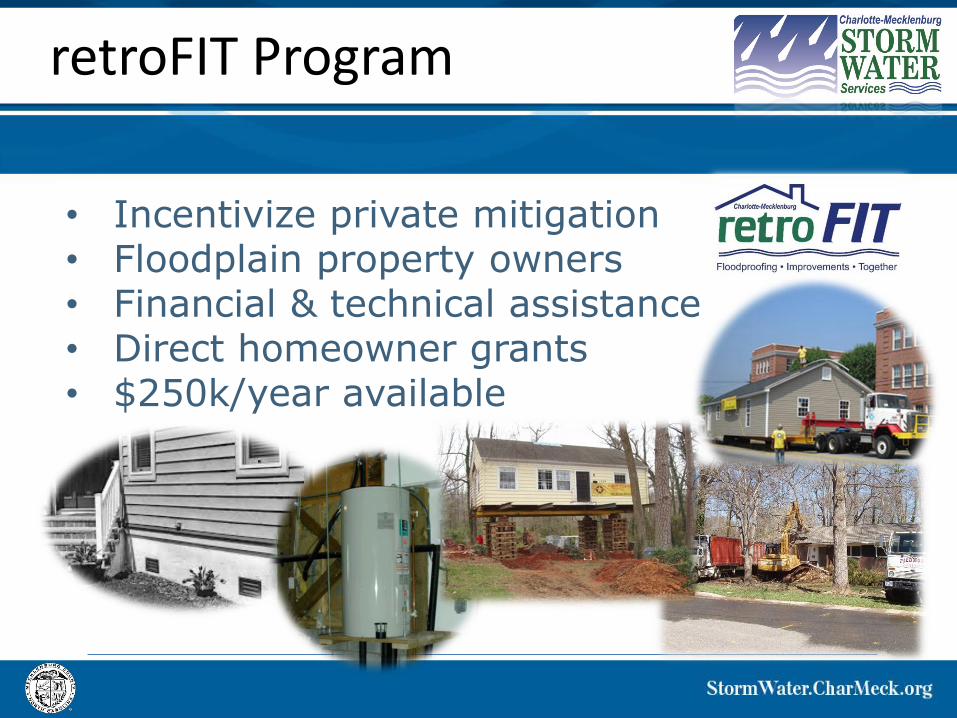
• Incentivize private mitigation• Floodplain property owners• Financial & technical assistance• Direct homeowner grants• $250k/year available
retroFIT Program
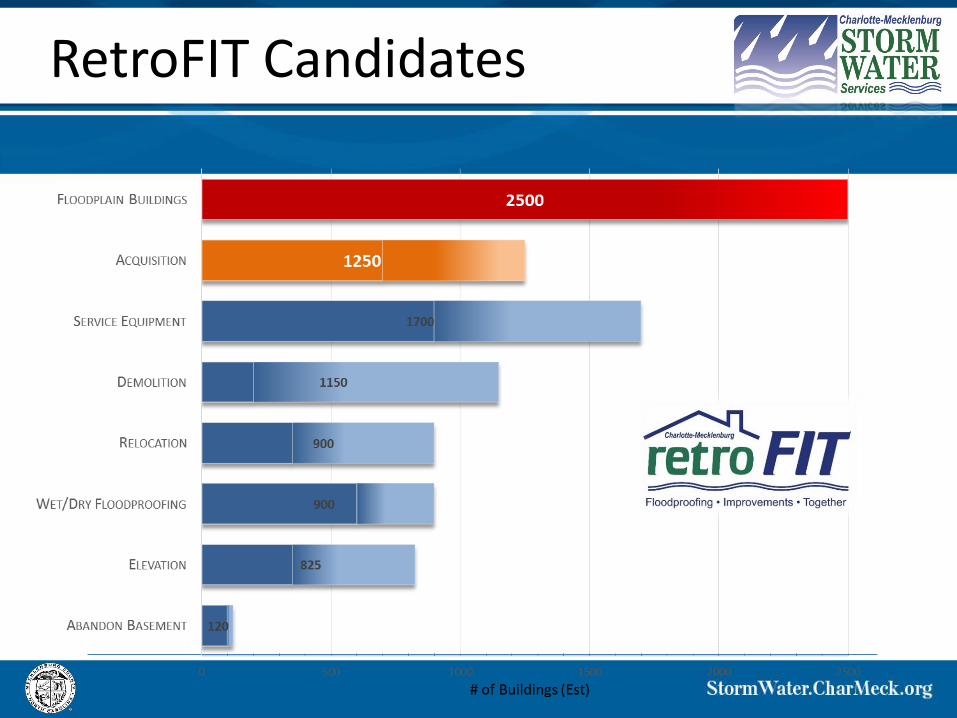
RetroFIT Candidates
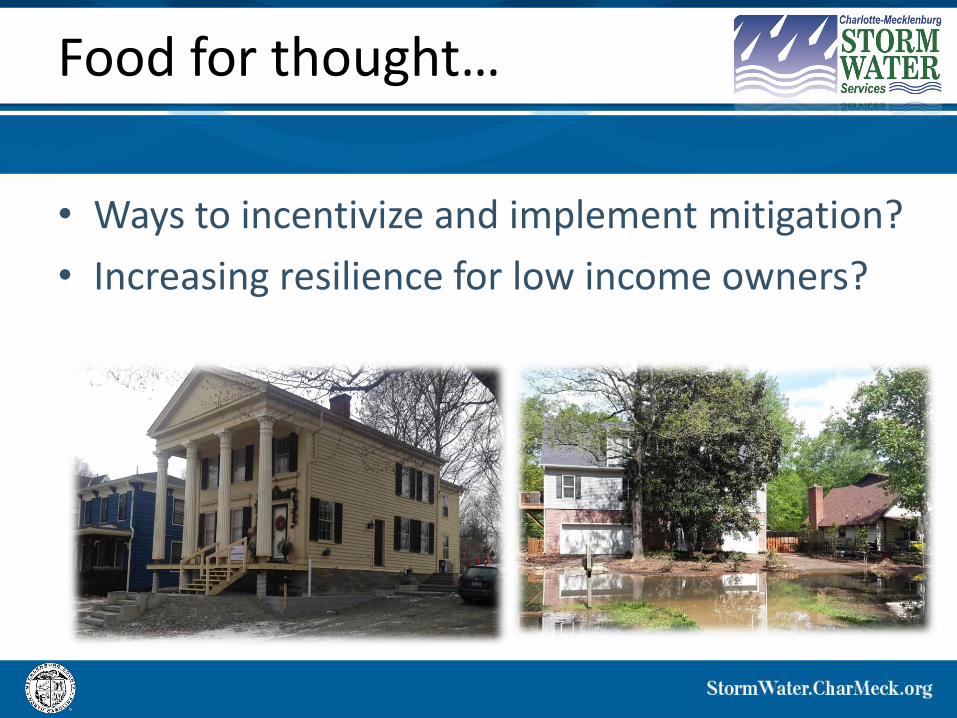
Food for thought…
• Ways to incentivize and implement mitigation?
• Increasing resilience for low income owners?
Risk Reduction Planning
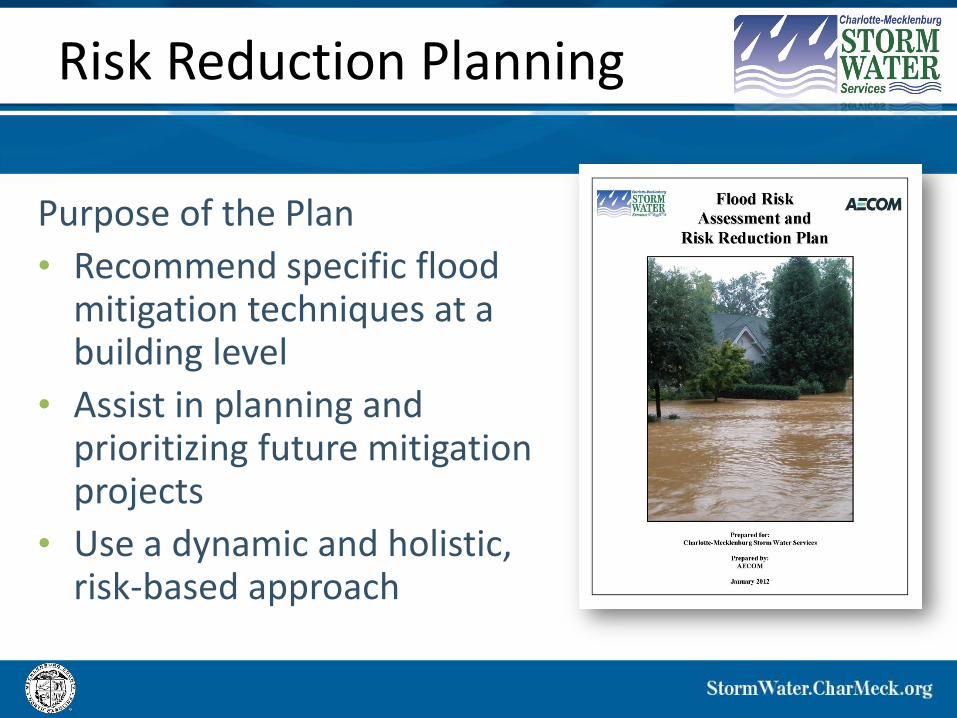
Purpose of the Plan
• Recommend specific flood mitigation techniques at a building level
• Assist in planning and prioritizing future mitigation projects
• Use a dynamic and holistic, risk-based approach
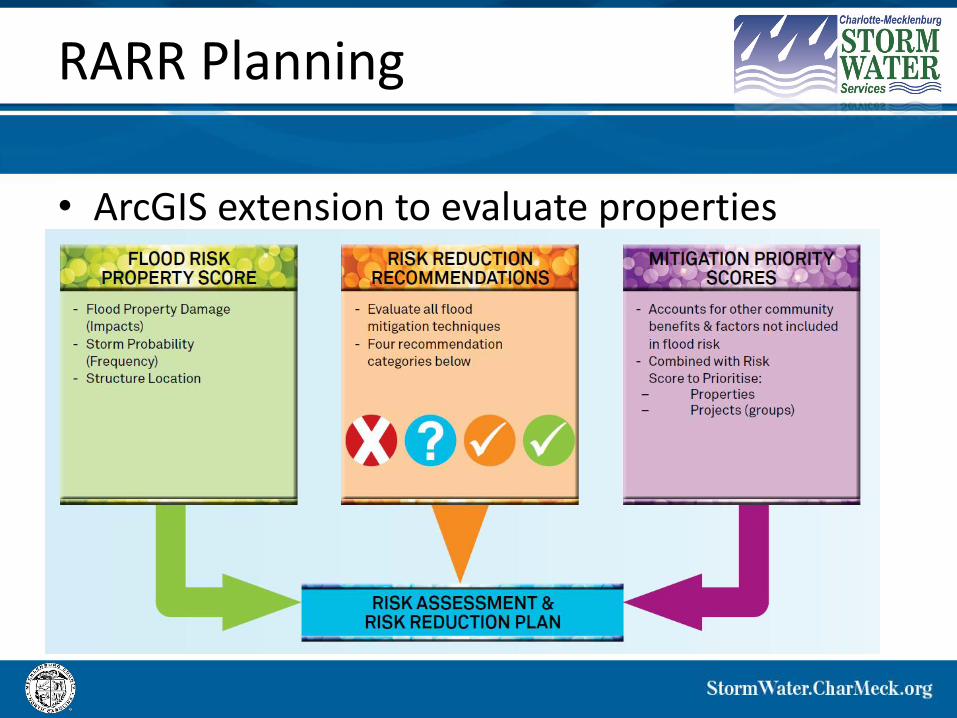
RARR Planning
• ArcGIS extension to evaluate properties
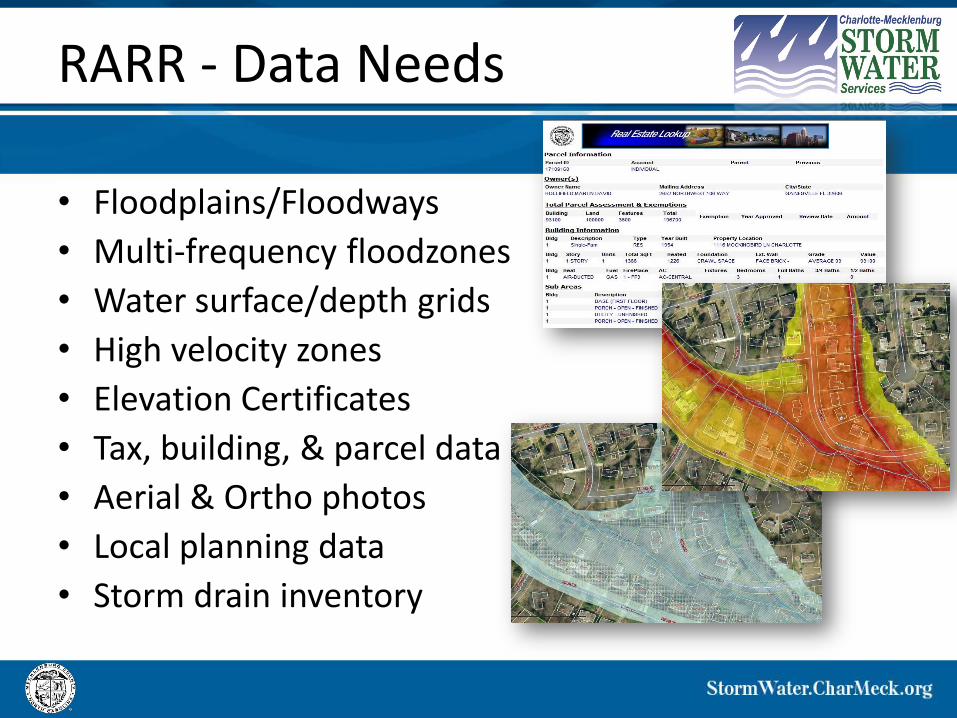
RARR - Data Needs
• Floodplains/Floodways
• Multi-frequency floodzones
• Water surface/depth grids
• High velocity zones
• Elevation Certificates
• Tax, building, & parcel data
• Aerial & Ortho photos
• Local planning data
• Storm drain inventory
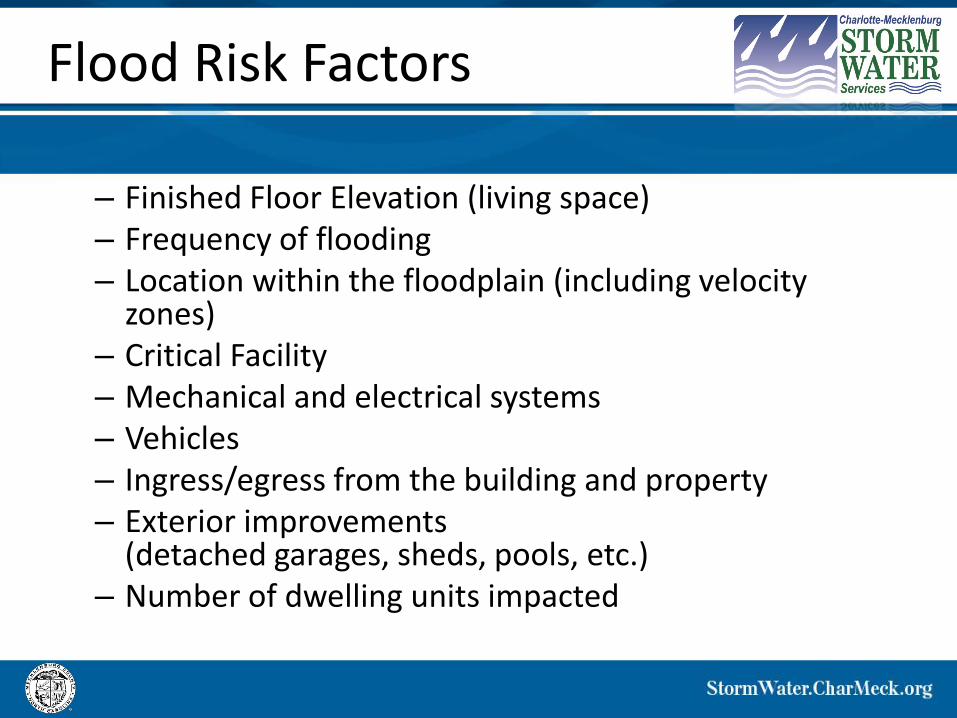
Flood Risk Factors
– Finished Floor Elevation (living space)– Frequency of flooding– Location within the floodplain (including velocity
zones)– Critical Facility– Mechanical and electrical systems – Vehicles– Ingress/egress from the building and property– Exterior improvements
(detached garages, sheds, pools, etc.)– Number of dwelling units impacted
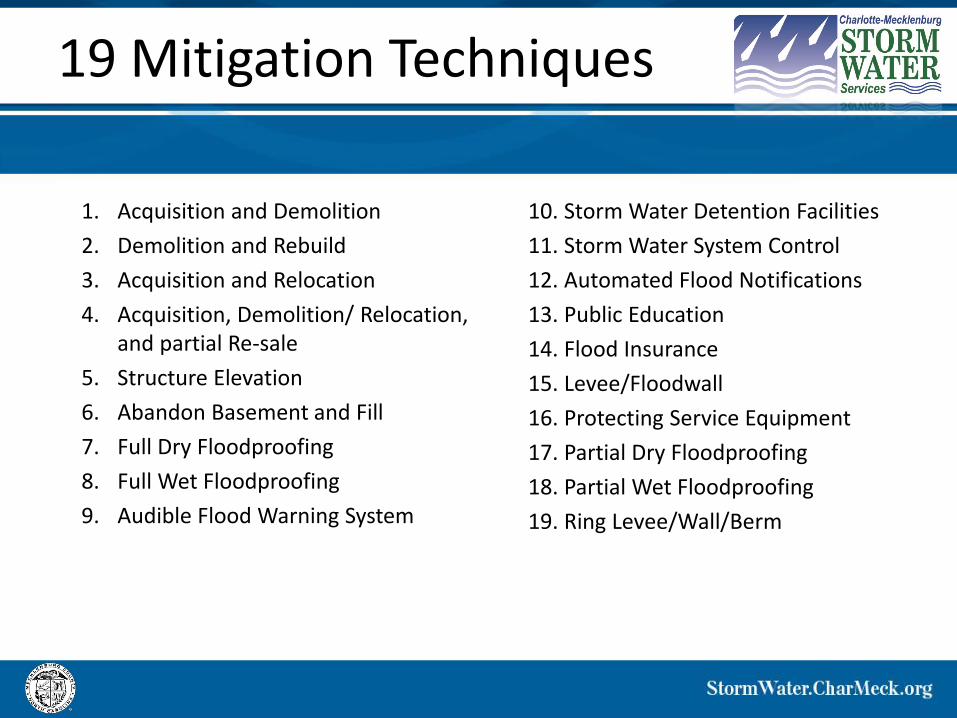
19 Mitigation Techniques
1. Acquisition and Demolition
2. Demolition and Rebuild
3. Acquisition and Relocation
4. Acquisition, Demolition/ Relocation, and partial Re-sale
5. Structure Elevation
6. Abandon Basement and Fill
7. Full Dry Floodproofing
8. Full Wet Floodproofing
9. Audible Flood Warning System
10. Storm Water Detention Facilities
11. Storm Water System Control
12. Automated Flood Notifications
13. Public Education
14. Flood Insurance
15. Levee/Floodwall
16. Protecting Service Equipment
17. Partial Dry Floodproofing
18. Partial Wet Floodproofing
19. Ring Levee/Wall/Berm
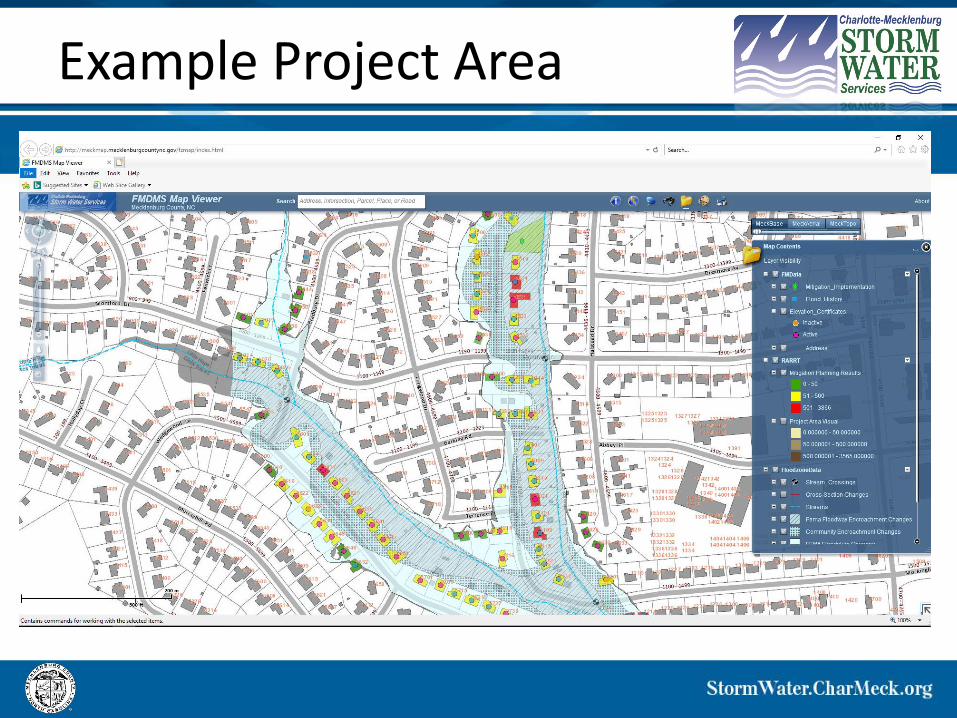
Example Project Area
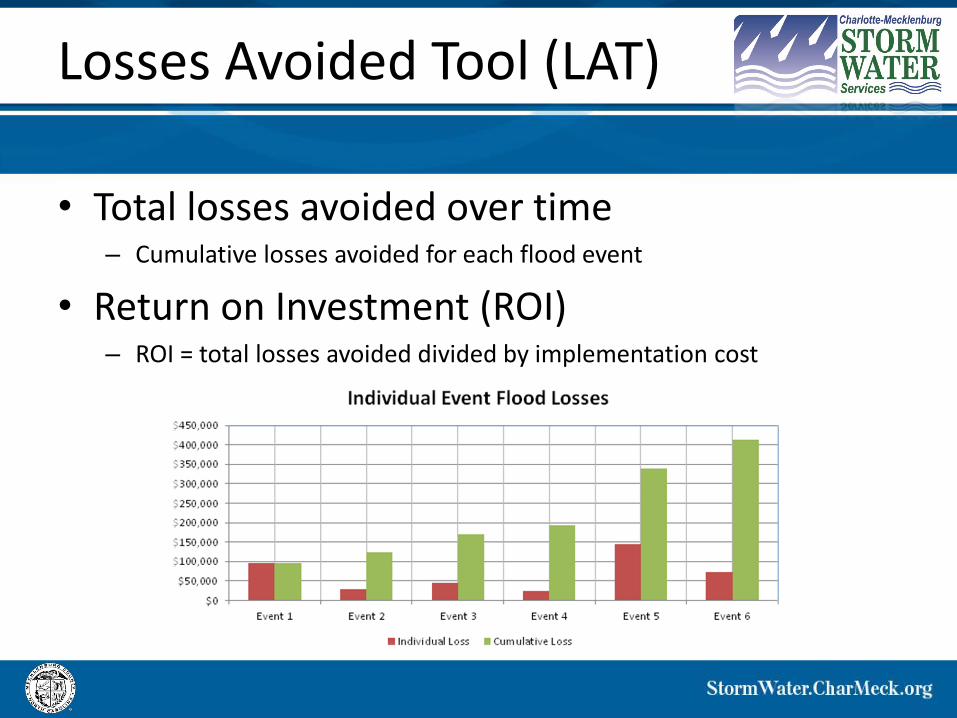
Losses Avoided Tool (LAT)
• Total losses avoided over time– Cumulative losses avoided for each flood event
• Return on Investment (ROI)– ROI = total losses avoided divided by implementation cost
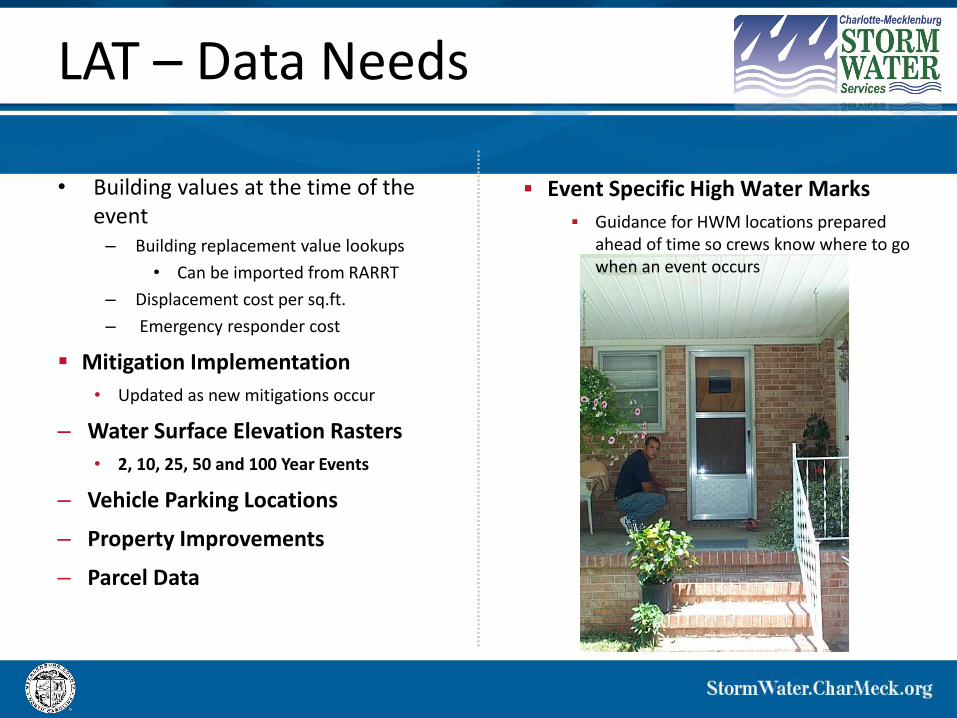
LAT – Data Needs
• Building values at the time of the event– Building replacement value lookups
• Can be imported from RARRT
– Displacement cost per sq.ft.
– Emergency responder cost
▪ Mitigation Implementation
• Updated as new mitigations occur
– Water Surface Elevation Rasters
• 2, 10, 25, 50 and 100 Year Events
– Vehicle Parking Locations
– Property Improvements
– Parcel Data
▪ Event Specific High Water Marks
▪ Guidance for HWM locations prepared ahead of time so crews know where to go when an event occurs
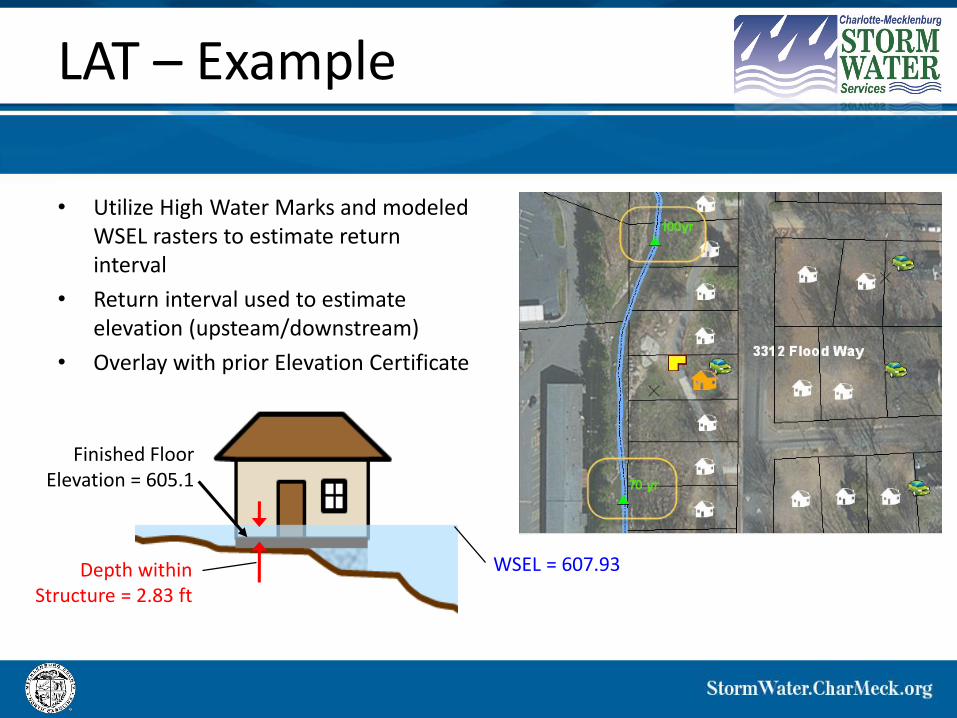
LAT – Example
• Utilize High Water Marks and modeled WSEL rasters to estimate return interval
• Return interval used to estimate elevation (upsteam/downstream)
• Overlay with prior Elevation Certificate
Finished FloorElevation = 605.1
WSEL = 607.93Depth within Structure = 2.83 ft
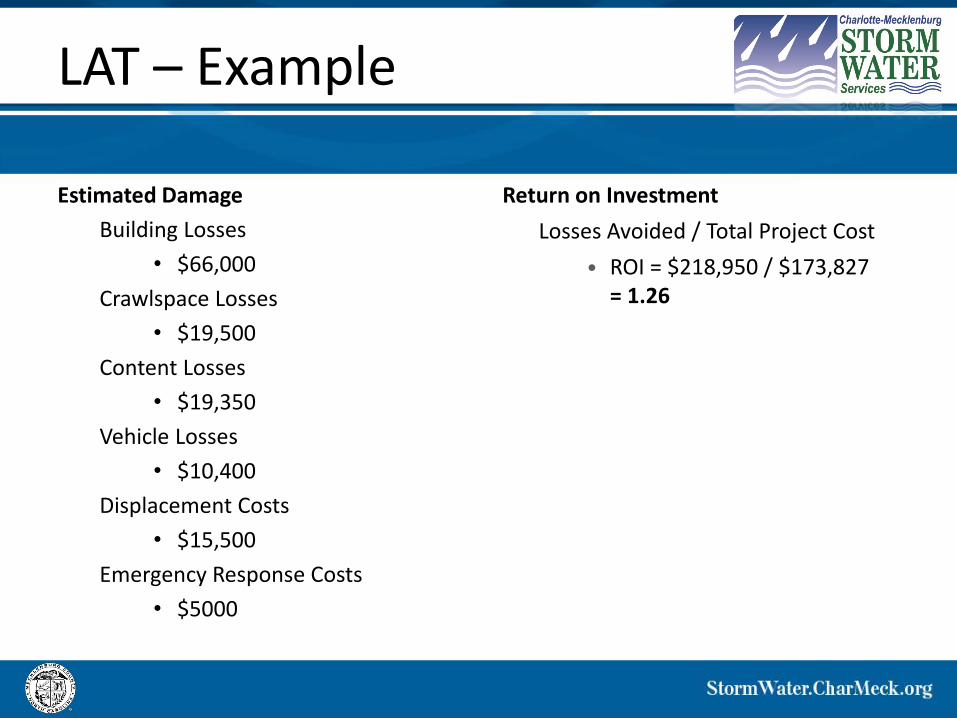
Estimated Damage
Building Losses
• $66,000
Crawlspace Losses
• $19,500
Content Losses
• $19,350
Vehicle Losses
• $10,400
Displacement Costs
• $15,500
Emergency Response Costs
• $5000
Return on Investment
Losses Avoided / Total Project Cost
• ROI = $218,950 / $173,827= 1.26
LAT – Example
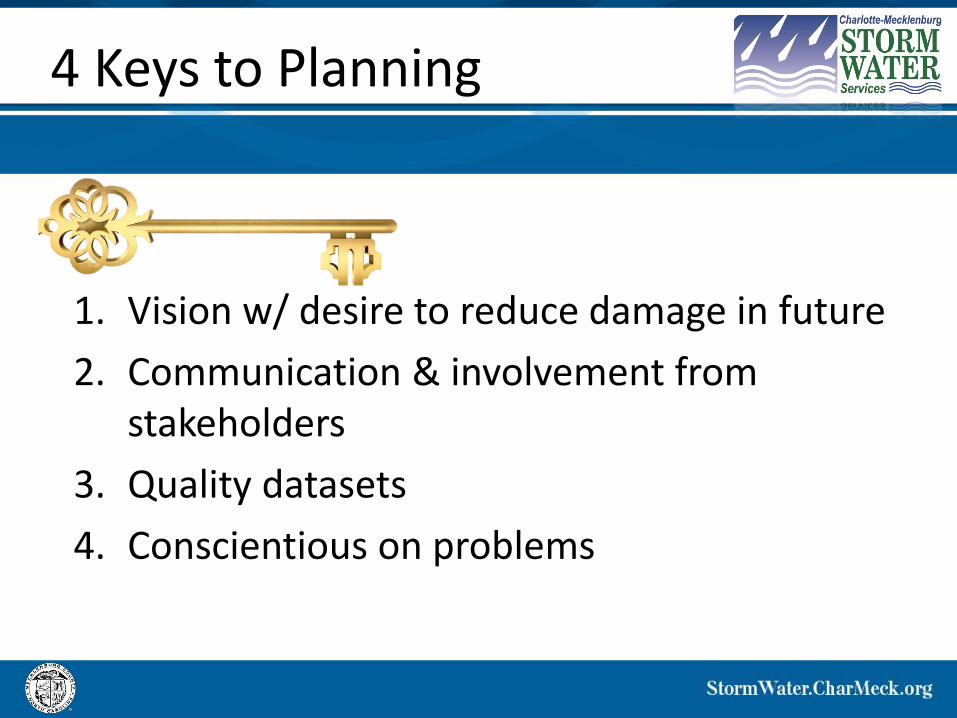
4 Keys to Planning
1. Vision w/ desire to reduce damage in future
2. Communication & involvement from stakeholders
3. Quality datasets
4. Conscientious on problems
Food for thought…
• Consider how to make hazard mitigation planning more useful
• Communicating information so it leads to action
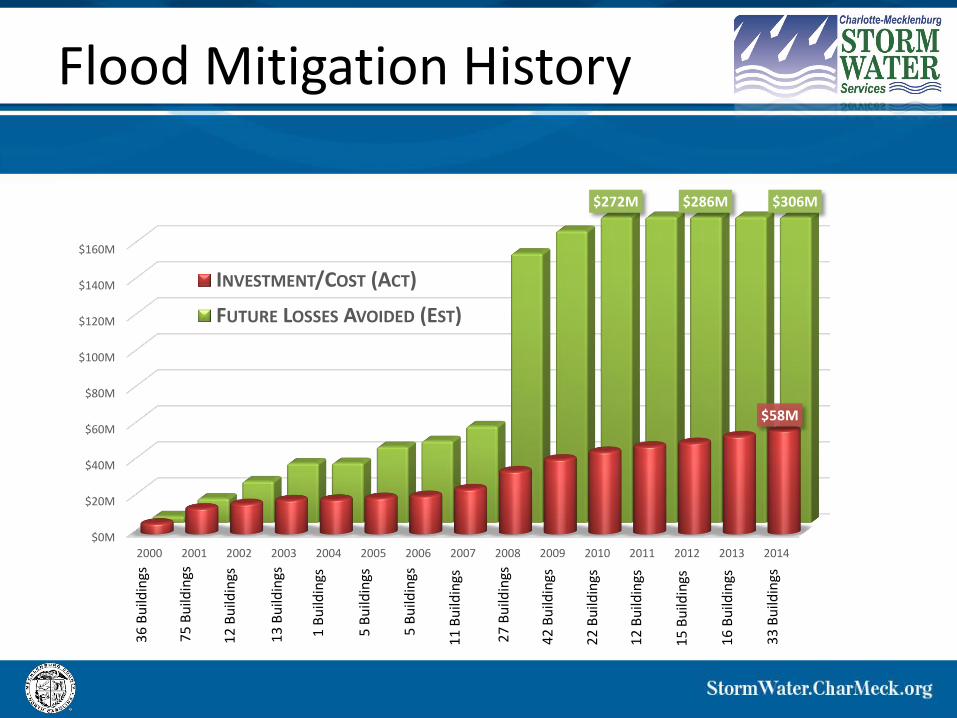
$0M
$20M
$40M
$60M
$80M
$100M
$120M
$140M
$160M
2000 2001 2002 2003 2004 2005 2006 2007 2008 2009 2010 2011 2012 2013 2014
$58M
$272M $286M $306M
INVESTMENT/COST (ACT)
FUTURE LOSSES AVOIDED (EST)
36
Bu
ildin
gs
75
Bu
ildin
gs
12
Bu
ildin
gs
13
Bu
ildin
gs
1B
uild
ings
5 B
uild
ings
5 B
uild
ings
11
Bu
ildin
gs
27
Bu
ildin
gs
42
Bu
ildin
gs
22
Bu
ildin
gs
12
Bu
ildin
gs
15
Bu
ildin
gs
16
Bu
ildin
gs
33
Bu
ildin
gs
Flood Mitigation History
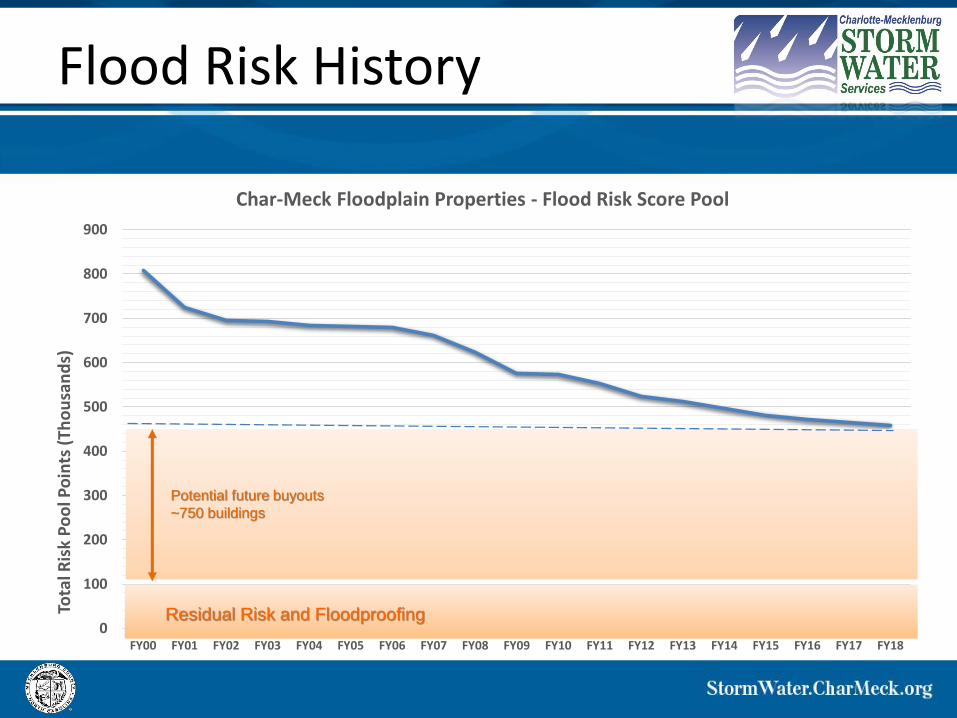
0
100
200
300
400
500
600
700
800
900
FY00 FY01 FY02 FY03 FY04 FY05 FY06 FY07 FY08 FY09 FY10 FY11 FY12 FY13 FY14 FY15 FY16 FY17 FY18
Tota
l Ris
k P
oo
l Po
ints
(Th
ou
san
ds)
Char-Meck Floodplain Properties - Flood Risk Score Pool
Potential future buyouts
~750 buildings
Residual Risk and Floodproofing
Flood Risk History
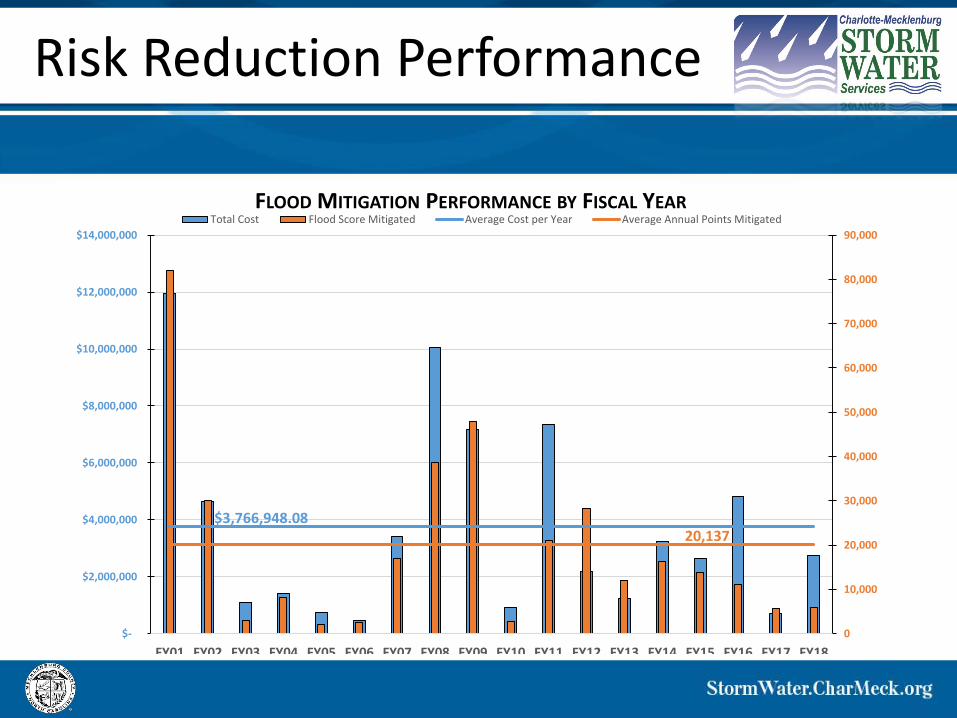
$3,766,948.0820,137
0
10,000
20,000
30,000
40,000
50,000
60,000
70,000
80,000
90,000
$-
$2,000,000
$4,000,000
$6,000,000
$8,000,000
$10,000,000
$12,000,000
$14,000,000
FY01 FY02 FY03 FY04 FY05 FY06 FY07 FY08 FY09 FY10 FY11 FY12 FY13 FY14 FY15 FY16 FY17 FY18
FLOOD MITIGATION PERFORMANCE BY FISCAL YEARTotal Cost Flood Score Mitigated Average Cost per Year Average Annual Points Mitigated
Risk Reduction Performance
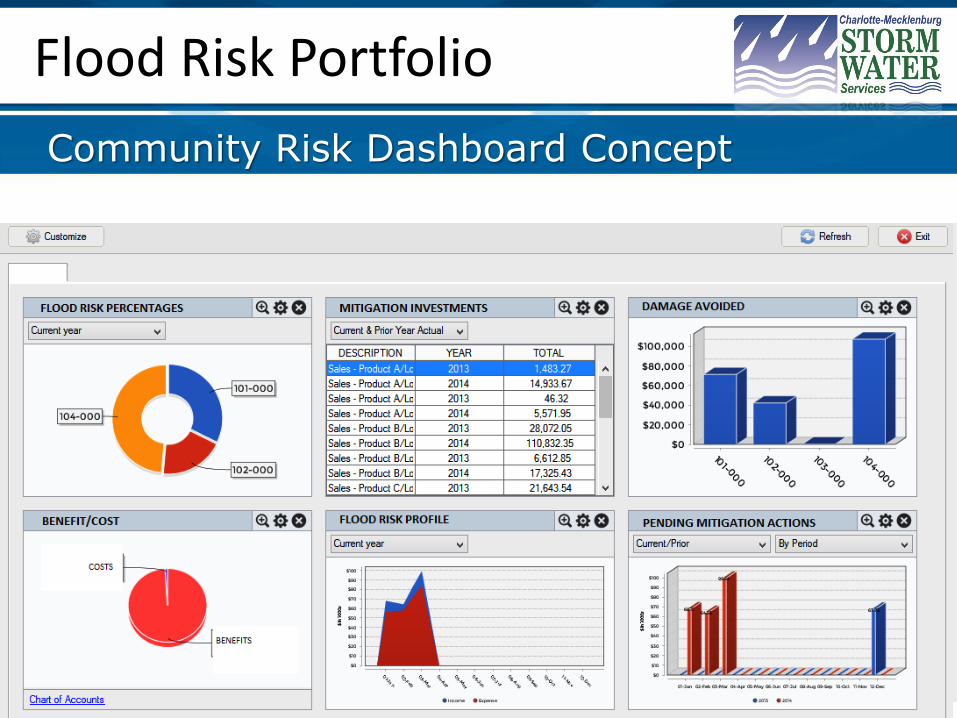
Community Risk Dashboard Concept
Flood Risk Portfolio
Powerpoint Templates
1. Have a vision
2. Identify resilient funding
3. Show the benefits & track results