planning for income to last - commonwealth financial … · planning for income to last throughout...
TRANSCRIPT

Planning for Income to LastRetirement Income Planning
Not FDIC Insured • May Lose Value • No Bank Guarantee

1
Understand the five key financial risks
facing retirees
Determine how to maximize your income sources
Develop a retirementincome plan
This guide explains why you should consider developing a retirement income plan.
It also discusses what you may need to know when working with your advisor
to build one – including five key risks facing today’s retirees.

You May Be Retired for Even Longer Than You Worked Whether you’re approaching retirement or already retired, you face the increasingly complex challenge of
planning for income to last throughout your lifetime.
That’s why it’s important that you consider building a retirement income plan. All it takes is a little time, a lot of
awareness, and some step-by-step assistance with your investment professional.
Today’s retirees approach retirement much differently than those of previous generations:
• Many people have higher expectations about their retirement years
• With our increasing life span, spending 30 years or more in retirement is a realistic possibility
• Only 27 percent of employees are covered by a traditional pension,1 and only 25 percent of employers offer
retiree health benefits2
1. U.S. Department of Labor, Bureau of Labor Statistics, National Compensation Survey: Employee Benefits in Private Industry in the United States, Percentage of Employees Participating in Retirement and Capital Accumulation Plans by Type of Plan (Medium and Large Private Establishments), 2004–2013.
2. Kaiser Family Foundation, Employer Health Benefits, 2012 Survey.
3. Social Security Administration, Income of the Aged Chartbook, 2012, released April 2014. Based on highest quintile of $63,648. Percentages may not equal 100% due to rounding. For illustrative purposes only.
1
50%
15%16%
17%
Five key risks you’ll need to address Before you can begin building
a practical road map to financial
security, you’ll need to understand
– and integrate into your plan –
five key risks that could potentially
limit your success in reaching your
retirement income goals:
• Longevity
• Health care expenses
• Asset allocation
• Inflation
• Excess withdrawal
67% from your own sources
33% from outside sources
2%
INDIVIDUALS WILL BE RESPONSIBLE FOR THE MAJORITY OF THEIR INCOME IN RETIREMENT3
INVESTMENTS
EARNED INCOME
OTHER
SOCIAL SECURITY
PENSION

2
Longevity A retirement income plan may help to ensure that your assets last as long as your retirement. When thinking
about how long they might need income, many people tend to think in terms of life expectancy. But by
definition, half of the population will live longer than they expect, which means that they will underestimate
how long they will need their savings to last.
A more realistic approach is to plan for longevity – a long continuance of life – as illustrated in the graph
below. As a result, you will want to consider planning to need income well into your 90s so you reduce the
risk of running out of money late in life.
65 70 75 80 85 90 95 100
Male age 65
Female age 65
Couple (both age 65)
Age
85
92
88
94
92
97 Source: Annuity 2000 Mortality Table, Society of Actuaries.
Figures assume a person is in good health.
RETIREES SHOULD PLAN FOR LIVING LONGER THAN THEY EXPECT
What you can do: When building your retirement
income plan, allow for the
possibility that you’ll live longer
than you think.
Challenge: Many people underestimate
their life span and therefore risk
outliving their assets.
50% CHANCE OF ONE SPOUSE SURVIVING
25% CHANCE OF ONE SPOUSE SURVIVING

3
Health Care Expenses Longer life spans, rising medical costs, declining employer-sponsored medical coverage, and possible shortfalls
ahead for Medicare all add up to make health care expenses a critical challenge for retirees and pre-retirees
alike. In fact, Fidelity estimates that retirees may need to fund a considerable portion of their own health care
expenses not covered by Medicare, such as copays, deductibles, and over-the-counter drugs, especially if they
do not have employer coverage.
And these estimates don’t include possible long-term care, which averages over $83,000 per year in the U.S. for
a private nursing home room.* It is possible that half of those aged 65 today will be admitted to a nursing home
at some point in their lives, reinforcing how important it is to ensure that you can cover these expenses.
* Department of Health and Human Services, LongTermCare.gov, accessed July 31, 2013.
† Fidelity Benefits Consulting, 2014. Based on a hypothetical couple retiring in 2014, 65 years or older with average (82 male, 85 female) life expectancies. Estimates are calculated for “average” retirees, but may be more or less depending on actual health status, area, and longevity.
It does not include other health-related expenses, such as over-the-counter medications, most dental services, and long-term care.
23%
44%
33%
Expenses associated withMedicare Part B and D premiums
Prescription drug out-of-pocket expenses
Medicare cost-sharing provisions:copayments, coinsurance,
deductibles, and excluded benefits
FIDELITY ESTIMATES THAT A 65-YEAR-OLD RETIRING COUPLE WILL NEED APPROXIMATELY $220,000 TO COVER MEDICAL COSTS IN RETIREMENT†
What you can do: Maximize savings specifically intended to meet health care
expenses and ask your advisor whether a long-term care policy
makes sense for you. Long-term insurance is costly at any age, but
it is significantly less expensive when purchased earlier in life.
Challenge: Rising health care costs, coupled with
inadequate health care coverage, can
have a devastating impact on your
lifetime income plan.

4
Asset Allocation People who fear losing their nest egg may choose conservative investments in the hope that this strategy will
help mitigate risk. But by so doing, they are giving up long-term growth potential and may outlive their money.
Market risk comes with investing. While we can’t control market behavior, we may be able to manage its
long-term effects through our investment choices. One option is asset allocation, which may help to strike a
balance between conservative and aggressive investments.
A significant imbalance in either direction may expose you to risk. Too aggressive a portfolio can increase your
vulnerability to market volatility, while a portfolio that’s too conservative may not outpace inflation, thereby
increasing the risk that you will outlive your assets.
Generally, among asset classes, stocks may present more short-term risk and volatility than bonds or short-term instruments but may provide greater potential return over the long term. Although bonds generally present less short-term risk and volatility than stocks, bonds contain interest rate risk (as interest rates rise, bond prices usually fall); the risk of issuer default; and inflation risk. U.S. Treasury bills maintain a stable value (if held to maturity), but returns are generally only slightly above the inflation rate. Foreign investments, especially those in emerging markets, involve greater risk but may offer greater potential return than U.S. investments. The above target asset mixes are hypothetical models and illustrate certain examples of many possible combinations of investment allocations that could help an investor pursue his or her goals; these target asset mixes do not constitute investment advice under the Employee Retirement Income Security Act of 1974 (ERISA). You should choose your own investments based on your particular objectives and situation. Remember that you may change how your account is invested. Be sure to review your decisions periodically to make sure they are still consistent with your goals.
These target asset mixes were developed by Strategic Advisers, Inc., a registered investment advisor, and Fidelity Investments.
EXAMPLES OF TARGET ASSET MIXES DESIGNED TO MEET GOALS
Conservative May be appropriate for investors who want to minimize fluctuations in market value by taking an income-oriented approach with some potential for capital appreciation.
Growth May be appropriate for investors who have a preference for growth and who can withstand significant fluctuations in market value.
Aggressive Growth May be appropriate for investors who seek aggressive growth and who can tolerate wide fluctuations in market value, especially over the short term.
BalancedMay be appropriate for investors who want the potential for capital appreciation and some income and who can withstand moderate fluctuations in market value.
35%40%
10% 15%
60%25%
15%
49%
25%
5%
21%
30%
50%
14%
6%
DOMESTIC EQUITIES
INTERNATIONAL EQUITIES
BONDS
SHORT-TERM INVESTMENTS

5
The graph above represents the average annual return percentage for the investment categories shown from 1926 to 2013 from Ibbotson Associates. Past performance is no guarantee of future results. Returns include the reinvestment of dividends and other earnings. This graph is for illustrative purposes only and does not represent actual or implied performance of any investment option. All indices are unmanaged and it is not possible to invest directly in an index.
Domestic stocks are represented by the Standard & Poor’s 500 Index (S&P 500®). The S&P 500 is a market capitalization-weighted index of 500 common stocks chosen for market size, liquidity, and industry group presentation to represent U.S. equity performance. Foreign stocks (international equities) are represented by the MSCI® EAFE® (Europe, Australasia, Far East) Index for the period from 1970 to the last calendar year. Foreign Stocks prior to 1970 are represented by the S&P 500. Bonds are represented by the U.S. Intermediate Government Bond Index, which is an unmanaged index that includes the reinvestment of interest income. Short-term investments are represented by U.S. Treasury bills, which are backed by the full faith and credit of the U.S. government. Inflation is represented by the Consumer Price Index, which monitors the cost of living in the United States.
U.S. stock prices are more volatile than those of other securities. Government bonds and corporate bonds have more moderate short-term price fluctuation than stocks but provide lower potential long-term returns. U.S. Treasury bills maintain a stable value (if held to maturity), but returns are generally only slightly above the inflation rate. Please see “Important Information” and “Index Definitions” on back cover.‡ Data for health care costs is from the Centers for Medicare and Medicaid Services, National Health Expenditures Estimates 2012–2022.
What you can do: Even in retirement, the key to long-lasting income may depend
on a balanced asset allocation that may help to provide relatively
minimal downside risk, while potentially providing relatively high
upside benefit.
Challenge: Retirees with a portfolio overly concentrated
in conservative investments expose
themselves to a greater risk of outliving
their assets.
RETIREES NEED STOCKS FOR THE LONG HAUL
Comparison of average annual rising costs vs. average annual investment returns
Conservative Balanced Growth Aggressivegrowth
Inflation3.0%
6.1%
7.96%
8.97%9.64%
Health care costs‡
6.2%
Rising costs Average annual portfolio returns (1926–2013)
10
8
6
4
2
0
The graph shows how historical
annual returns on various asset
allocations have fared compared
with inflation and health care costs.
Keep in mind that equity investments
generally involve greater risk than
other investments, including the
possibility of losing principal.
Asset allocation does not ensure a
profit or guarantee against a loss.

6
What you can do: Include investments with the
potential to outpace inflation in
your investment portfolio and
investment plan.
Challenge: Inflation increases future costs
of goods and services and
erodes the value of assets set
aside to meet those costs.
Inflation Inflation is the long-term tendency of money to lose purchasing power. And it can have a particularly negative
effect on retirees because it chips away at retirement income in two ways:
• Increases the future cost of goods and services
• Potentially erodes the value of assets set aside to meet those costs
For example, today a gallon of milk costs about $3.50. In 2030, a 3% annual inflation rate could send that price
to $7. As inflation pushes the price of everything from milk to new cars higher, it drives the buying power of a
dollar down. That’s why it’s so important for your investments to outpace inflation.
Even low inflation can damage purchasing power
The strong likelihood of continuing inflation makes it imperative that your retirement savings include investments
with the potential to beat inflation – especially considering the longer retirement that today’s retirees can
anticipate. This chart shows the potential effect that various rates of inflation could have on the buying power
of $50,000 over 25 years.
All numbers were calculated based on hypothetical inflation rates of 2%, 3%, and 4% (historical average from 1926 to 2014 was 3%) to show the effects of inflation over time; actual inflation rates may be more or less.
$0
$10,000
$20,000
$30,000
$40,000
$50,000
$60,000
25 years20 years15 years10 years5 yearsToday$0
$10,000
$20,000
$30,000
$40,000
$50,000
$60,000
25 years20 years15 years10 years5 yearsToday
$50,000
$30,477
$23,880
$18,756
Years from retirement start date
DO
LLA
RS
2% INFLATION
3% INFLATION
4% INFLATION

7
Excess Withdrawal Even the savviest asset allocation strategy can misfire without an equally wise strategy for withdrawing your
assets. The withdrawal rate you decide on can dramatically affect how long your money will last. This variable
is largely in your control.
The first step is understanding how much you’ll spend in retirement. In a recent survey, nearly 60% of pre-retirees
thought they would be spending less once they retired. However, the same survey found that fewer than 25% of
retirees were spending much less than they had before retiring – with 50% spending the same or more.§
Let’s see how different withdrawal rates may affect the life of a pool of assets. The chart below takes a balanced
portfolio of $500,000 and tracks it over the period from 1972 to 2012 using a range of inflation-adjusted
withdrawal rates.
A 4% withdrawal rate – $20,000 in the first year and then adjusted each year for actual historical inflation – is the only one of the scenarios that would have sustained the asset pool and produced income throughout the couple’s projected lifetime. While a withdrawal rate of 5% could have extended the income for nearly 25 years, the portfolio still would have run out of money when there was still a 63% chance of one member of the couple being alive.
Source: Fidelity Investments. Hypothetical value of assets held in an untaxed account of $500,000 invested in a portfolio of 50% stocks, 40% bonds, and 10% short-term investments with inflation-adjusted withdrawal rates as specified. This chart uses historical monthly performance from January 1972 through December 2012 from Ibbotson Associates; stocks, bonds, and short-term investments are represented by the S&P 500, U.S. Intermediate-Term Government Bonds, and U.S. 30-day T-bills, respectively. This chart is for illustrative purposes only and is not indicative of any investment. Past performance is no guarantee of future results.
¶ Probability of a couple surviving to various ages is based on Annuity 2000 Mortality Table, Society of Actuaries. Figures assume a person is in good health.
§ Employee Benefit Research Institute and Mathew Greenwald & Associates, Inc., 2010 Retirement Confidence Survey.
SUSTAINABLE WITHDRAWAL RATES CAN EXTEND THE LIFE OF A PORTFOLIO
HOW A 65-YEAR-OLD COUPLE RETIRING IN 1972 WITH $500,000 IS AFFECTED
$0
$1M
$2M
1972 1976 1980 1984 1988 1992 1996 2000 2004 2008
A couple, both age 65, would have run out of money at age 88 if they had withdrawn 5%, adjusted upward for inflation each year.
2012
$.5M
Hypothetical Couple (both age 65)¶
99% atage 70
98% atage 75
94% atage 80
83% atage 85
63% atage 90
35% atage 95
100% atage 65
DO
LLA
RS R
EMA
ININ
G
7% 6%
4%
8%9%10%
5%
What you can do: Use as conservative a withdrawal rate as possible,
particularly in your early years of retirement.
Challenge: Withdrawal rates much above 5%, especially in
the early years of your retirement, may increase
the likelihood that you will deplete your
assets prematurely.
8
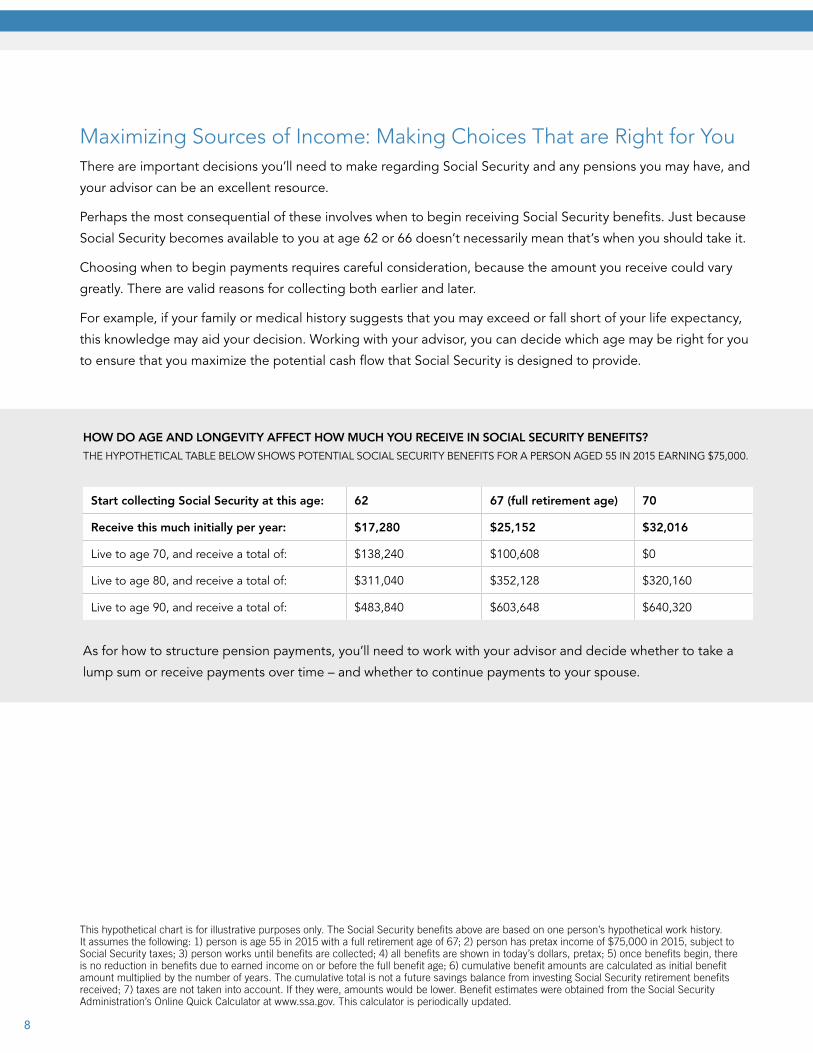
Maximizing Sources of Income: Making Choices That are Right for You There are important decisions you’ll need to make regarding Social Security and any pensions you may have, and
your advisor can be an excellent resource.
Perhaps the most consequential of these involves when to begin receiving Social Security benefits. Just because
Social Security becomes available to you at age 62 or 66 doesn’t necessarily mean that’s when you should take it.
Choosing when to begin payments requires careful consideration, because the amount you receive could vary
greatly. There are valid reasons for collecting both earlier and later.
For example, if your family or medical history suggests that you may exceed or fall short of your life expectancy,
this knowledge may aid your decision. Working with your advisor, you can decide which age may be right for you
to ensure that you maximize the potential cash flow that Social Security is designed to provide.
As for how to structure pension payments, you’ll need to work with your advisor and decide whether to take a
lump sum or receive payments over time – and whether to continue payments to your spouse.
Start collecting Social Security at this age: 62 67 (full retirement age) 70
Receive this much initially per year: $17,280 $25,152 $32,016
Live to age 70, and receive a total of: $138,240 $100,608 $0
Live to age 80, and receive a total of: $311,040 $352,128 $320,160
Live to age 90, and receive a total of: $483,840 $603,648 $640,320
This hypothetical chart is for illustrative purposes only. The Social Security benefits above are based on one person’s hypothetical work history. It assumes the following: 1) person is age 55 in 2015 with a full retirement age of 67; 2) person has pretax income of $75,000 in 2015, subject to Social Security taxes; 3) person works until benefits are collected; 4) all benefits are shown in today’s dollars, pretax; 5) once benefits begin, there is no reduction in benefits due to earned income on or before the full benefit age; 6) cumulative benefit amounts are calculated as initial benefit amount multiplied by the number of years. The cumulative total is not a future savings balance from investing Social Security retirement benefits received; 7) taxes are not taken into account. If they were, amounts would be lower. Benefit estimates were obtained from the Social Security Administration’s Online Quick Calculator at www.ssa.gov. This calculator is periodically updated.
HOW DO AGE AND LONGEVITY AFFECT HOW MUCH YOU RECEIVE IN SOCIAL SECURITY BENEFITS?
THE HYPOTHETICAL TABLE BELOW SHOWS POTENTIAL SOCIAL SECURITY BENEFITS FOR A PERSON AGED 55 IN 2015 EARNING $75,000.

Creating Your Retirement Income Plan
It’s clear that you need a plan
And here’s some good news: it doesn’t have to be a daunting process, and you won’t have to go it alone.
Your advisor can make the process smoother and easier by helping you:
• Identify your income needs in retirement
Create a realistic budget based on your desired
lifestyle, and determine which of your expenses are
essential and which are discretionary.
• Consider all sources of income
Review all the income and assets you have to fund
retirement, and decide when might be the optimal
time to begin Social Security benefits or structure
any pension payments.
• Compare income and expenses
Earmark predictable sources of income to cover
essential expenses, and assign less predictable
sources to fund discretionary expenses.
• Allocate your investment portfolio
Choose investments to meet growth and income
needs – while taking into account such factors as
your age, withdrawal rates, and risk tolerance.
• Monitor your plan regularly
Work with your advisor at least once a year to
adjust your plan as your life changes in retirement.

Experience the Fidelity Difference advisor.fidelity.com
Fidelity Representative | 800-544-9999
advisor.fidelity.com
IMPORTANT INFORMATION
IMPORTANT: Any projections and simulations are hypothetical in nature, do not reflect actual investment results, and are not guarantees of future results. Over time, results may vary with each use. It is not possible to invest directly in an index. All indexes include reinvestment of dividends and interest income. Although past performance does not guarantee future results, it may be useful in comparing alternate investment strategies over the long term. Performance returns for actual investments will generally be reduced by fees or expenses not reflected in these hypothetical illustrations.
INDEX DEFINITIONS
Standard & Poor’s 500 Index (S&P 500) is a market capitalization-weighted index of 500 widely held U.S. stocks and includes reinvestment of dividends. U.S. Intermediate-Term Government Bond Index is an unmanaged index that includes the reinvestment of interest income.
MSCI EAFE (Europe, Australasia, Far East) Index is an unmanaged market capitalization-weighted index that is designed to represent the performance of developed stock markets outside the United States and Canada and assumes the highest possible withholding taxes are applicable. The Consumer Price Index is a widely recognized measure of inflation calculated by the U.S. government.
The information provided is general and educational in nature. It is not intended to be, and should not be construed as, legal or tax advice. Laws of a specific state or laws relevant to a particular situation may affect the applicability, accuracy, or completeness of this information. Consult an attorney or tax advisor regarding a specific legal or tax situation.Investing involves risk, including risk of loss.
Not NCUA or NCUSIF insured. May lose value. No credit union guarantee.
Approved for use in Advisor and 401(k) markets. Firm review may apply.
Third-party trademarks and service marks are the property of their respective owners. All other trademarks and service marks are the property of FMR LLC or an affiliated company.
Before investing, consider the funds’ investment objectives, risks, charges, and expenses. Contact your investment professional or visit advisor.fidelity.com for a prospectus or, if available, a summary prospectus containing this information. Read it carefully.
381323.9.0 FIDELITY INVESTMENTS INSTITUTIONAL SERVICES COMPANY, INC., 500 SALEM STREET, SMITHFIELD, RI 02917 1.791929.108 0915
Your Advisor and Fidelity Are Here to Help
Like a good road map, a well-thought-out retirement income plan, built with
the assistance of your financial advisor, may provide reassurance and the
confidence of knowing you are heading in the right direction.
Fidelity’s reliable support – with a wide range of investment options and years
of investment management experience through all market conditions –
complements your advisor’s know-how to help you pursue your goals.