planning process for the design of integrated fixed-and flexible...
TRANSCRIPT
31
Planning Process for the Design of Integrated Fixed- and Flexible-Route Bus Service in Rochester Michael Meyer, Department of Civil Engineering, Massachusetts Institute of
Technology
Demand-responsive transportation is an accepted form of transportation in small and medium-size cities. However, as these types of systems are introduced into larger urban areas that already have fixed-route services, the systems and the preceding planning process necessarily become more complex. This paper describes the planning process that was used in the design of an integrated fixed- and flexible-route system in one suburb of Rochester, New York. The system is one component of a federal demonstration project designed to evaluate the feasibility of such systems in major metropolitan areas. A description is given of the planning approach taken and the methodologies and analyses used. The use of a simulation model to determine the extent of the dial-a-bus service area in the suburb and a logit model to predict the expected demand for such service is described. In addition, the methodology developed for the system integration design, i.e., the combination and coordination of existing bus service with flexible-route services, is explained. Provision of opportunities for public involvement during the planning process is also described.
As people, industries, and activities have shifted from the high-density central city to the lower and mediumdensity suburbs, conventional line-haul public transportation has been unable to serve newly emerging travel demand. Rochester, New York, has experienced this reorientation of metropolitan growth. In 1960, 54 percent of the population of metropolitan Rochester lived within the boundaries of the central city, whereas in 1970 only 36 percent lived in this area. In Rochester, as in other major urban areas, this increased growth in the suburbs has increased the desire for intersuburban transportation. However, the bus network serves only the central-city residents and those in the suburbs who travel directly to the downtown district.
In August 1973, the Rochester-Genesee Regional Transportation Authority (RGRTA) implemented a new type of transit service designed to serve the lower and medium-density suburban areas where little or no service existed. This system, known as PERT (PERsonal Transit) Dial-a-Bus, offered a flexible, demandresponsive, door-to-door service in Greece, a suburb bordering the central city. The main purpose of PERT was to serve intracommunity trips and provide feeder service to regular line-haul transit routes (1).
In April 1975, the PERT system became part of a federal demonstration project sponsored by the Service and Methods Demonstration Program of the Urban Mass Transportation Administration. Specific objectives of the demonstration project were to
1. rncrease the level and quality of transit service, 2. Improve transit coverage (through system ad
justment), 3. Test the effectiveness of various operating strat
egies, and 4. Test the use of automated scheduling and dispatch
ing systems.
Three suburban service areas in the Rochester area were chosen as sites for the demonstration.
This paper examines the planning process used for the design and implementation of service in Irondequoit-
the second suburb to receive such service-by looking at the techniques used, the alternative system designs evaluated, and the final system design that was implemented. It is not the purpose of this paper to present a detailed description of the techniques used nor to present an in-depth analysis of individual components in the overall system design. Such discussions are presented elsewhere (2). However, one of the most formidable barriers to solving a problem is the process used in its solution. This paper describes only one approach used in planning a demand-responsive transit service, but some of the methods used and system alternatives considered are applicable to future design efforts.
BACKGROUND
Unlike Greece, Irondequoit was served by a larger number of conventional bus routes. Analysis of bus coverage showed that during the peak hours 80 percent of the town's population lived within 0.625 km (0.4 mile) of a bus route. During the off-peak periods, this figure approached 75 percent. An important characteristic of these bus routes, and one that directly affected the final service design, was that they were radial routes serving the north-south travel patterns within Irondequoit and travel to downtown Rochester. The percentages of local trips within Irondequoit for each bus route before the routes were changed as part of the new service design (taken from 1975 ridership counts) are given below:
Route Number
5 7 9
10 12
Percentage of Local Trips
10 11 2 6 0
6 0 1.5 No data No service
These data should be contrasted with the following data for Irondequoit taken from a 1974 New York State Department of Transportation travel survey, which found that 52 percent of the trips originating in Irondequoit also had destinations there and thus that the existing transit service was not serving a large portion of the h·avel demand in Irondequoit (data are for trips by all modes):
Trip Number Percentage
Within Irondequoit 105 900 51.9 To Kodak Park 3 850 1.9 To Greece 6 080 3.0 To central business district 14 500 7.1 To the rest of Rochester 47 300 23.1 To the rest of the metropolitan area 26 600 13.0 Total 204 230 100
It was decided that PERT would try to serve this demand better.
32
Another factor that affected the design of the Irondequoit service was the existence of PERT Dial-a-Bus in Greece. That service had been designed so that a high degree of demand-responsive transportation was provided during the day and subscription services complemented the many-to-many services during the peak hours. When the time came to begin the Irondequoit design process, the Greece system had been in operation for about 2 years. Ridership had reached a somewhat stable level, and daily level-of-service characteristics remained consistent. The use of a computer for customer scheduling was about to begin; when that was successfully implemented, it was to be followed by computer-assisted experimentation with fare and priority variations for different categories of customers. Because of this, it became the objective in Irondequoit to experiment with a more hybrid and possibly less demandresponsive service concept. Even if there had been a desire to emulate the Greece experience, the large number of fixed bus routes in Irondequoit did not permit such a simple solution.
DEMAND ANALYSIS
An integral part of planning the dial-a-bus system for Irondequoit involved being able to predict the service demand that would result from various service designs. Major tasks in this process included identi[ying the population most affected by the new tra nsport s ys tem (demographic data), determining existing travel patterns, identifying major trip generators and attractors, and forecasting travel demand.
Although some demographic changes had occurred since 1970, the 1970 census still provided a good reference for important community statistics. For planning purposes, the base zone system used to aggregate the data was divided into 10 planning areas according to geographical and community considerations. Data such as number of households, total employment, number of automobiles, and population density were collected for each planning area. Information was gathered on the location and trip-making impact of hospitals, schools, apartment complexes, shopping areas, and other major employment centers.
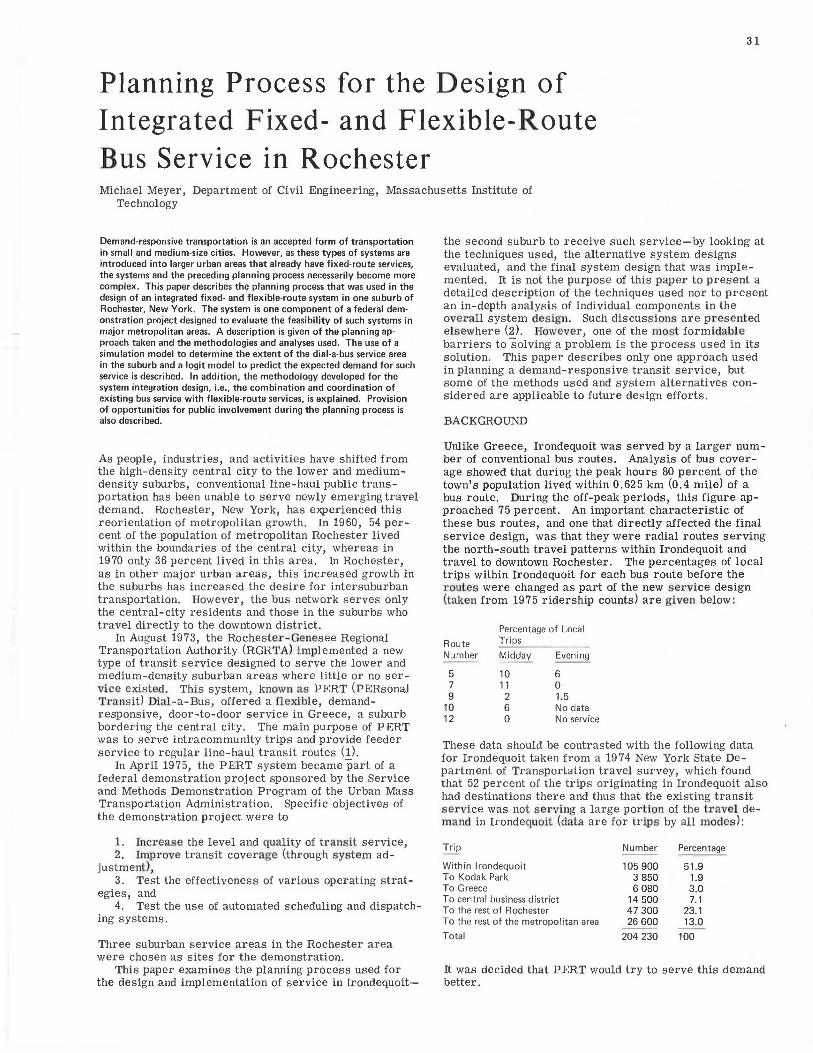
Figure 1 shows the location of some major trip generators and attractors within Irondequoit. A large num-
Figure 1. Activity centers in Irondequoit.
• HIGH SCHOOL
D ELEMENTARY SCHOOL ... SHOPP I MG (ENTERS
• GOVERNMENT CrnTERS D
• HOSPITAL
ber of the activity centers are located within two corridors defined by St. Paul Avenue and Ridge Road. Given that the final system design was to service as much of the town as possible and at the same time provide service to major activity centers, these two corridors became the focus of design efforts.
Market segments that were identified and analyzed in Irondequoit included the elderly, low-income people, day-care-age children, households with and without automobiles, and current transit users. Analysis of census data for Irondequoit showed a relatively high percentage of elderly-13 percent as compared to a national average of 10 percent. This percentage has increased since the 1970 census as a result of construction of a number of apartment complexes for the elderly in the Irondequoit area. Irondequoit also had more women in the labor force than any other part of metropolitan Rochester-42 percent-which implied a potential transportation need for children of day-care and nursery-school age.
A number of demand models specifically designed for demand-responsive transportation were considered for the analysis of potential demand. Included in this process were a model developed by the Mitre Corporation (3), the market share model developed by Lel'man and Wilson (4), and the methodology us ed in the demand analysis for the PERT system in Greece. None of these models, however, was found to be appropriate as a forecasting tool in the Irondequoit design process. A model was needed that not only predicted the amount of demand but also the spatial distribution of that demand. In addition, the model should be sensitive to service characteristics such as fare, travel time, wait time, and a number of socioeconomic characteristics of the various special markets.
Given these considerations, a disaggregate demand model was designed to estimate travel demand for diala-bus service in Irondequoit. The model was of the following form:
P(f0 ,d0 ,m 0 ) = exp (Ur0
,m0
,u0/i~ exp (Ur,d,m)
oil f,d,m
where
(I)
P(f0, mo, do) = probability of a given frequency of destination and mode choice and
Ur,d,m = utility of alternative (f, d, m).
The utility function was assumed to be a linear combination of independent variables that reflects socioeconomic characteristics (household size, incom.e, automobile ownership( ancl residential location), att1·activeness of destina tion r etail employment), mode-sp ecific var iables (automobile bias and availability of transit), and generalized travel cost (money and time).
One problem faced in the model formulation was the value placed on one component of the time variableout-of-vehicle travel time. Unlike fixed-route bus service, many-to-many service consists of two basic types of demand-requests for immediate pickup and requests for service made some time before desired pickup. In the case of shopping trips, the return portion of the trip will usually be an immediate request whereas the initial request for service will be made ahead of time. Therefore, what should be the value of out-of-vehicle travel time? The value chosen for this variable was 30 min, the time from pickup request to actual pickup as determined from the PERT Dial-a-Bus system in Greece. This figure was subsequently used as the basis for a sensitivity analysis to determine how sensitive the model results were to changes in out-of-vehicle travel time

(they were found to be extremely sensitive). One distinction made for the demand analysis was the
separate consideration of shopping frips. This was particularly appropriate because s hopping had become one of the major trip purposes served by the PERT system in Greece. According to an on-board survey conducted in Greece, 39 percent of all many-to-many trips were classified as shopping trips. People who currently used the fixed bus routes in Irondequoit were also surveyed in order to estimate the number of passengers who would use a modified service.
The model results were used primarily to verify existing estimates of potential demand, which were based on experiences in the Greece system and in demandresponsive systems elsewhere in the country, and the existing socioeconomic characteristics of Irondequoit. The model was used to provide input for simulation (de-
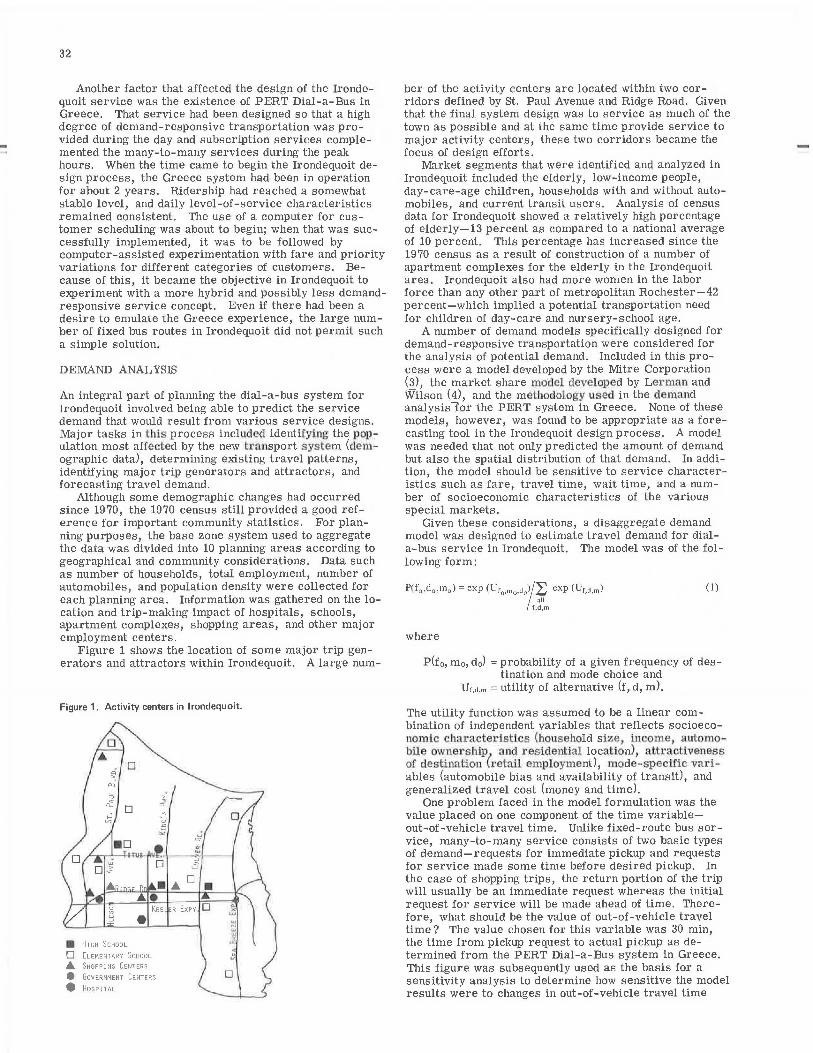
Figure 2. Off-peak bus routes.
5 7 11 9 1'1 12
Figure 3. Mix of bus services implemented in Irondequoit.
RT, s Rr. RT, 11
SU'.1:IERV ILLE SHUTTLE (A)
ST PAUL BLVD,
RT, 7
-~ ' o . ::, . =:~\OGE 4E9 . . • LOOP STOPS
11. 19 qT. l~ ~T' 12
LOOP
(s l
DJqH-BIJS (ol
33
scribed later in this paper), but this input also included what common sense said would probably happen. The model results (a predicted 1.1 percent market share) were quite reasonable.
SYSTEM DESIGN
An important aspect of the Rochester demonstration project is the concept of system integration, i.e., the combination and coordination of existing fixed-route with flexible-route service. There are several app r oacJ1es to the design of an integrated transit system, among them (a) simply superimpos ing the new llexibleroute services on the unchanged fixed routes or (b) performing route rationalization, a procedure in which modifications made to existing fixed routes are then integrated with flexible-route service. The objective of route rationalization is to reduce the cost of transit service in lower density and medium-density areas where fixed-route service is carrying people at a relatively high cost per passenger.
The following considerations motivated the system design process in Irondequoit:
1. A different service plan from that used in Greece should be used so that the two approaches could be compared.
2. Existing fixed routes in Irondequoit should be changed in such a way that people still have a comparable service option at comparable cost.
3. Fixed- and flexible-route service options should be us ed in addit ion to many-to-many, flexible-route, dial - a - bus sel'vice.
The final design was a hybrid system in which some fixed routes were left, others were modified or eliminated, a new fixed route was added in the Loop to connect principal demand generators and attractors, and dial-a-bus service was introduced in a fairly limited part of central Irondequoit.
The development of a planning methodology for the Irondequoit system integration design ( 5) was based on a dual approach: an analysis of the adequacy of the existing fixed-route bus system and an evaluation of system economics. Information on the service provided by the fixed-route bus system and corresponding ridership was necessary for deciding which routes should be modified. It also helped in determining an areawide network of transit service that efficiently combined all types of transit, ensured coordinated transfers, and served major origin-destination patterns. Specific tasks in this analysis included the following:
1. Examination of present fixed-route service in potential dial-a-bus service areas,
2. Investigation of the cost characteristics of each route,
3. Separation of unprofitable and profitable-tomarginal routes, and
4. Analysis of actual savings that would accrue by substituting demand-responsive service.
The strategy followed by the demonstration staff was to make no drastic change in a sound peak-period bus network; the dial-a-bus service was thus planned mainly as a feeder service to the fixed-route system. Five bus routes ran during the midday off-peak period (Figure 2). Each of these routes was analyzed by using information such as headways, ridership, and the location at which one bus could be taken off the schedule without adversely affecting the rest of the route. The Irondequoit services that were eventually implemented are shown in Figure 3.
::
34
The Summerville Shuttle serves the corridor north of the dial-a-bus service area formerly served by route 5. The advantage of this scheme was that it added one bus (the Summerville Shuttle) and allowed one bus to be eliminated from the route 5 and route 7 schedules, resulting in a net saving of one bus. It also provided a new link between the residential Summerville area (route 5 corridor) and Irondequoit Plaza, a major shopping center. Because the original bus schedule had an exceptionally long layover time, the Summerville Shuttle could also offer some flexible routing and still maintain the original route 5 schedule. On request, the shuttle bus would deviate along specified corridor routes. This concept has been referred to as loop deviation. The Summerville Shuttle meets the route 5 bus at Ridge Road for timed transfers and allows transfers to routes 7 and 11 at the same location. The fare for this service is $0.40 ($0.20 for senior citizens), and a loop deviation costs an extra $0.10.
The Irondequoit Loop runs counterclockwise along Ridge Road, Kings Highway, Titus Avenue, and Hudson Avenue, linking most of Irondequoit' s activity centers. Many local trips that were not possible on the radial fixed-route system can now be made. Passengers may board and leave Loop buses at all specially marked stops and may transfer to or from fixed bus routes, shuttle, and dial-a-bus at appropriate stops. Fares for this service are $0.25/ passenger, $0.20 for senior citizens and the handicapped, and $0.05 for a transfer to or from a Regional Transit Service (RTS) shuttle route.
One possibility for evening service was the elimination of all service in Irondequoit. This could have been justified by the light ridership in this period and the greater flexibility and doorstop service offered by diala-bus. However, after 9:00 p.m. only two buses are used on most routes, the minimum necessary to make the downtown meets. Therefore, cutting routes in Irondequoit would help RTS, the transit operator, only until 9 :00 p.m. If such a limited cut were made-from 7:00 to 9:00 p.m., for example-the confusion of the constant changes in service between time periods would not be worth the savings that would result from cutting 2 h of bus service.
Another possibility, and the one that was chosen, was to leave early-evening service substantially intact and to improve late-evening service (after 9:00 p.m.) by providing· greater coverage. In this service, named Urban .PEH.'l', bus service atter 9:00 p.m., not oniy in irondequoit but also along the remaining portions of routes 5, 7, 9, and 10 between Irondequoit and downtown Rochester, was taken over by PERT. PERT was to follow the latenight 65-min cycle in order to allow transfers downtown and was to provide some route-deviation service on these routes. This deviation was made possible by the fact that some routes did not need the full cycle time allowed to complete their runs. This deviation service should be particularly appealing during the late-night period when personal safety is a concern of many people. Given the low patronage and the capability of one route-deviation bus to serve fixed-route corridors, another advantage of the PERT takeover of the late-evening service was the possibility of using fewer buses than had previously been used. However, at the beginning of the service, four buses ran these routes, as was the case during the RTS operation.
The fares for Urban PERT are $0.25 to or from regular RTS stops and $1.00 to or from special-zone request stops ($0.25 for each additional passenger making the identical trip); the elderly and the handicapped pay $0.20 to or from each regular stop and $0.50 for a special-zone request.
The main issue for the midday routes was the degree
to which fixed-route service would be cut back when PERT services began. Eliminating a large portion of this service would tend to increase vehicle productivities on PERT and would save money for RTS. However, given the nonlocal nature of the fixed-route trips, level of service for those using these routes would deteriorate if the routes were cut. This made wholesale cutbacks in fixed-route service unattractive. However, there were cases when fixed routes served very few people (e.g., route 12) or closely paralleled other lines (e.g., routes 5 and 7) and cutbacks became more reasonable.
New fixed-route PERT services that covered the same corridor as current routes but with an improved service pattern were an alternative that fell somewhere between retention and elimination of routes. PERT could provide new fixed-route service linking sections of Irondequoit that had been inaccessible by bus. Another possible PERT service on fixed-route corridors was route deviation, which would allow cutting current routes without eliminating all corridor service.
For any corridor in Irondequoit, the choice was between current fixed - route service (if any), substitution of a PERT fixed-route service, or no corridor service. The major factors in making this choice were current ridership, the resulting cost savings if a route were cut, and the improvements in ridership and connectivity to activity centers and reductions in walking time that would occur with a new PERT corridor service. With these factors in mind, a network of fixed routes and route-deviation services was designed. The interrelations among the various routes were also considered so that routes and schedules would be coordinated as much as possible.
SERVICE-AREA BOUNDARIES
The issue of service-area boundaries was addressed primarily from the standpoint of how much of Irondequoit should be included in the many-to-many dial-a-bus service zone. The extent of dial-a-bus service in Irondequoit became a much debated issue during the months before service implementation. Many groups, and thus many viewpoints, were involved in this debate, but the issue quickly became one of either offering service to the entire town-a position held by some community groups-or designing a reduced service area in which a higher level of service would be provided to a s111alie1 11u111Ue1· uf µeuplt:. Il wa::; ieit, howt:veI, that the number of vehicles that could be allocated to the Irondequoit service might be too small to provide adequate service to the entire town. Thus, a simulation model developed at MIT was used to evaluate different service-area configurations with a varying fleet size. The model traced demands for service from their occurrence through assignment and actual pickup and delivery. The critical outputs of the model included levelof-service variables such as average wait and ride times for passengers using the system. The inputs to the model described the vehicle system, the operating environment, and the characteristics of service demand. The simulation model analyzed the impact of different service characteristics (e.g., number of vehicles, demand rate, and service area) on the level of service provided to passengers.
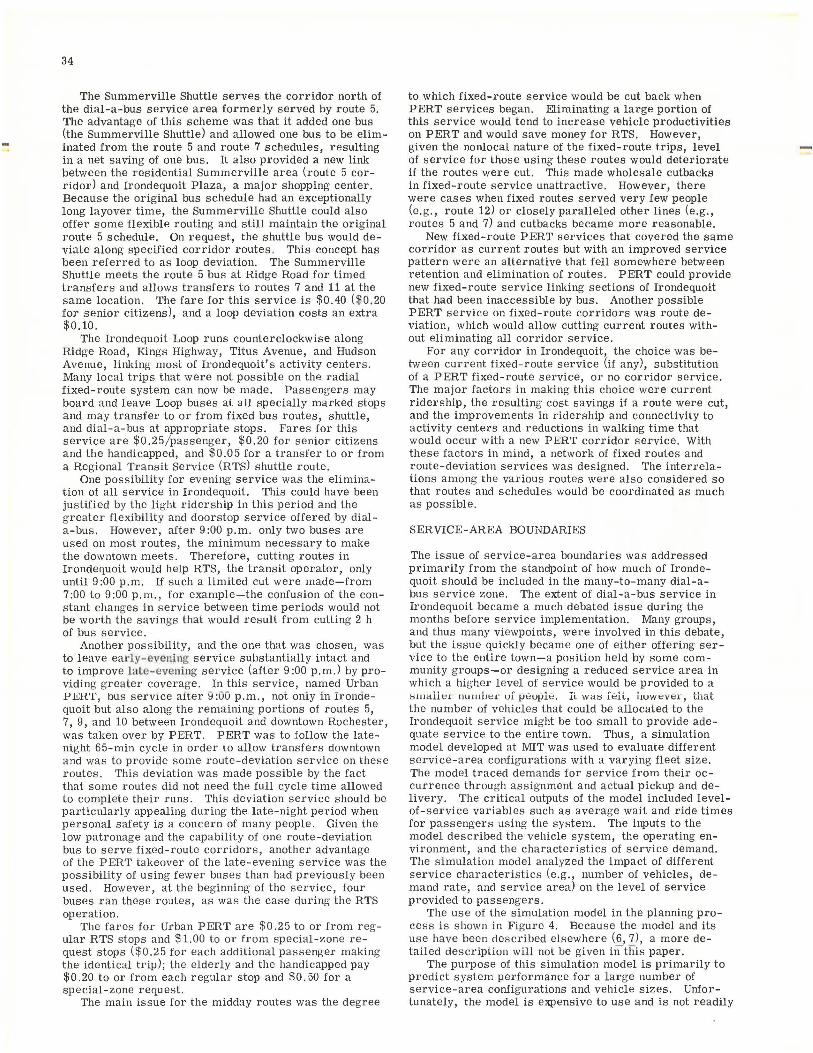
The use of the simulation model in the planning process is shown in Figure 4. Because the model and its use have been described elsewhere (6, 7), a more detailed description will not be given in th is paper.
The purpose of this simulation model is primarily to predict system performance for a large number of service-area configurations and vehicle sizes. Unfortunately, the model is expensive to use and is not readily

35
Figure 4. Role of simulation in the planning process.
DEMAND PR I OR I Tl ES FOR FINAL S tM
UI..-A.l' JQNS OF
fotAL SER-
At<ALYS IS ERV I CE DEC IS IOIIS
available for design work. However, new descriptive supply models are being developed that will predict system level of service and will also be inexpensive and simple to use (8).
The final decision on the boundaries for the many-tomany service reflected a desire by the project staff to follow a cautious strategy in system design. It was much better to start with a small area, an area which could be served reasonably well, and then expand into different sections when the demand built up and the system showed stable performance. The staff did not wish to repeat experiences elsewhere where maximum service on the first day of operation contributed to eventual system failure (9).
CITIZEN INPUT INTO THE PLANNING PROCESS
There were three important participants in the Irondequoit public involvement process: an ad hoc citizens' advisory committee of PERT to specify local transit needs; the demand-responsive demonstration project committee of RGRTA; and the town officials of Irondequoit who wished to see a PERT system that fit in with the town's growth policy and transportation goals.
The citizens' committee was appointed by the Irondequoit Town Board dltring the stwuner oC 1975 at t he request of RGRTA. Its main role was to provide intense local feedback during the planning p,·ocess and to chab· citywide meetings that were to be held before implementation of PERT service.
In its first meeting, the citizens' committee was introduced to the important impacts of PERT, how it functioned, and what the committee's role would be in developing the plan. It was decided in the next meeting that two citywide meetings would be held in September to help Irondequoit residents understand what PERT could mean to their community. An afternoon and an evening session included the following activities: a slide presentation on the PERT Dial-a-Bus experience in Greece, promotion of the special service to downtown Rochester for the handlcapped and the elderly (with a vehicle on display), a technical presentation by the project staff, and a question-and-answer period. During the meetings, the people of Irondequoit expressed concern over a reduction in fixed-route service and the impermanence of a demonstration project as well as an interest in a less personal subscription service for a lower fare. After the initial survey of public opinion, the citizens' committee continued to meet regularly with RGRTA and PERT staff and participated in the preparation of the final service plan.
In December, a formal presentation concerning service concepts for Irondequoit was made to the citizens' committee by the technical sta.ff. The reasons fox· each proposed service design were discussed and, although reservations were expressed about not including the entire town in the service area, the trade-offs involved in an incremental strategy of cautious expansion were clear
/[LOP ENT
Svsrrn iNTE<;RATION
DEVELOP
~u, SCHEDULE
} NTRODUCE
SERVICE
and the citizens' committee supported the plan.
CONCLUSIONS
The evaluation of the dial-a-bus system implemented in Irondequoit will provide useful information on the role of demand-responsive transportation in a metropolitan trnusporl:ation network. This paper has addressed another important factor in demand-responsive transportation, Le., the process used to design such services. Althouglt it is not expected that many such planning efforts will include as many analyses and tasks as did the Irondequoit process, some conclusions have been reached that can be considered generally applicable.
The estimation of demand is a task that can best be accomplished by evaluating prior experience and determining its relevance to the particular situation in question. In Roch.ester, the existence of PERT Dial-a-Bus in Greece helped in estimating potential demand for diala-bus in the neighboring suburb. The formal model developed was used solely to determine the consistency of these estimates.
Much has been written about the value of and the need for public involvement in any planning process. The necessity of suc11 involvement is even more apparent when a demand-responsive system is designed because the service concepts involved are unfamiliar to people used to traditional fixed bus routes. The members of the Irondequoit citizens' committ.ee were very helpful in explaining and promoting the new service, identifying different system options, and participating in system evaluation.
One of the major issues of system design usually debated in the public arena is the size of the service area: Who will get service and who will not? The planner must have available some means of analyzing different service-area configurations, given different vehicle fleet sizes. In Rochester an expensive simulation model was used to provide this analysis, but models are being developed that will be less expensive and easier to use.
In recent years, demand-responsive transportation systems have gained acceptance as a workable means of transportation in medium- and small-size cities. The question that remains unanswered is, What can be the role of such systems in larger metropolitan areas? Just as the systems themselves become more complicated when designed for larger urban areas, so too the planning process necessarily becomes more complex. The eventual success or failure of such systems will thus greatly depend on the ability of the planning process to handle this increased complexity.
REFERENCES
1. PERT: The First Year of Operation. MIT and Rochester-Genesee Regional Transportation Authority, Dec. 1974.
2. D. Roos and others. Rochester Integrated Adaptable Metropolitan Transit Service Program First Year

36
Report. Center for Transportation Studies, MIT, Cambridge, Rept . 76-21, June 1976.
3. B. Arrillaga and D. Medville. Demand, Supply and Cost Modelling Framework for Demand-Responsive Transportation Systems. TRB, Special Rept. 147, 1976, pp. 32-47.
4. S. R. Lerman and N. H. M .. Wilson. An Analytic Model for Dial-a-Ride System Design. TRB, Transportation Research Record 522, 1974, pp. 38-46.
5. System Integration Plan, PERsonal Transit Services. MIT and Rochester-Genesee Regional Transportation Authority, Sept. 1975.
6. N. H. M. Wilson and others. Scheduling Algorithms for Dial-a-Ride. Urban Systems Laboratory, MIT, Cambridge, Rept. US .-TR-70-14, 1970.
7. M. D. Meyer and N. H. M. Wilson. The Use of Simulation in the Design of a Dial-a-Ride System. Proc., 1976 Summer Computer Simulation Conference, July 1976.
8. M. Flusberg and N. H. M. Wilson. A Descriptive Supply Model for Demand-Responsive Transportation System Planning. Proc., 7th Annual Meeting of Transportation Research Forum, 1976.
9. R. C. Carlson. Anatomy of Systems Failure: Diala-Ride in Santa Clara County, California. Paper presented at 6th International Conference of DemandResponsive Transportation Systems and Other Paratransit Services, Washington, D.C., March 15-17, 1976.
Findings of a Study to Estimate the Effectiveness of Proposed Car-Pool-Incentive Policies· Jeffrey M. Bruggeman and Richard B. Rubin, Peat, Marwick,
Mitchell and Company Frank Griffiths, Market Facts, Inc.
This paper summarizes the findings of a car-pooling impact study conducted for the Federal Energy Administration. The aim of the study was to estimate the impacts of various proposed car-pool-incentive policies on work travel. A market research methodology was adapted to estimate modal-split impacts under various policy conditions and corresponding estimates of vehicle kilometers of travel and fuel consumption. A trade· off model was used to simulate modal behavior under 14 representative car-pool-incentive policies and nine travel-time sensitivity tests. Pairedcomparison responses on work-trip preference collected by a specially designed survey were the primary input to the trade-off model. The study produced two major sets of results: (a) tabulations and cross tabulations of the survey data and (b) estimates of the impact on modal split, vehicle kilometers of travel, and fuel consumption from policy simulations of the trade-off model. Gasoline rationing was found to be the
consumption. Substantial surcharges on gasoline sales and parking in the central business district or in facilities of major employers were moderately effective. Purely incentive policies such as tax rebates to car-pool members and car-pool matching programs were not very effective. If practical policies for achieving significant discriminatory travel-time ad· vantages for high-occupancy vehicles could be implemented, they would be moderately effective.
Car pooling has tremendous potential for conserving transportation energy in urban areas. Despite the sim -plicity of car pooling, Americans have been reluctant to take advantage of its many benefits. Recognizing this problem, the Federal Energy Administration (FEA) sought to determine the incentives and disincentives that will encourage people to alter their basic travel habits.
PURPOSE OF THE STUDY
Significant car pooling already exists in most urban areas but does not approach its full potential. The FEAsponsored study of car-pooling impacts was specifically designed to select representative policies and assess their potential for reducing vehicle kilometers of travel
and energy consumption through their impact on modal choice. The study concentrated on the type of travel that has the greatest car-pooling potential-the work trip in urban areas.
Many policies have been proposed for encouraging the formation of car pools. The following were selected for evaluation in the study:
1. Gasoline rationing, 2. Four types of parking-rate adjustment, 3 . Two levels of gasoline surcharge, 4. A toll surcharge, 5. Rebate for car-pool n-1cn1be1-s, 6. Three types of car-pool matching improvement
programs, 7. Two programs to improve the availability of mid
day transportation, and 8. Nine sensitivity tests of travel-time changes.
These policies (with the exception of the sensitivity tests) were applied to specific target g1·oups at levels representative of typical, administratively feasible programs.
METHODOLOGY
Because the decision on whether or not to car pool is highly subjective, a quantitative market research approach was used instead of a traditional modal-split methodology. The study methodology is presented in greater detail in a paper by Rubin, Bruggeman, and Griffiths in this Record.
Market Research Appro:tch
Research techniques used in a marketing context to eval-