planning report 01-2 the economic impactsof nist's data
TRANSCRIPT
Planning Report 01-2
The Economic Impacts
of NIST's
Data Encryptio
n
Standard (DES) P
rogram
Prepared by:
TASC, Inc.
for
National In
stitute of
Standards & Tech
nology
Program Office
Strategic
Planning and
Economic
Analysis
Group
October 2
001
U.S Department of CommerceTechnology Administration
The Economic Impacts of NIST’s Data Encryption Standard (DES) Program
October 2001
Prepared for:
The National Institute of Standards and Technology Program Office
Strategic Planning and Economic Analysis Group
Prepared under:
Contract No. 50SBNB7C1122 Task Order No. 8
Prepared by:
David P. Leech Michael W. Chinworth
Approved by:
Gary G. Payne Christopher M. Waychoff
TASC
1101 Wilson Blvd Suite 1600
Arlington, VA 22209
ACKNOWLEDGEMENTS Yousef Hashimi made important contributions to the background research for this report, especially concerning the early history and development of commercial encryption technology. In addition, Michael Marx made incisive recommendations for improving the analysis and presentation of the initial “published data” approach to estimating DES program benefits. We also acknowledge Cathy Howdyshell, Federal Reserve Bank of Richmond, for her guidance concerning the history and methodology of the Federal Reserves’ National Averages Report program. Kathy Tunis, of the Federal Reserve library, provided guidance and easy access to the historical series of National Averages Reports. These proved invaluable to the final study effort.
iii
TABLE OF CONTENTS
LIST OF FIGURES .......................................................................................................................V
LIST OF TABLES .........................................................................................................................V
EXECUTIVE SUMMARY...................................................................................................... ES-1
1 INTRODUCTION ................................................................................................................... 1
1.1 NIST/ITL ROLE IN DES ................................................................................................... 1
1.2 THE INDUSTRIAL RESPONSE TO DES......................................................................... 2
1.3 CASE STUDY OBJECTIVES............................................................................................ 3
1.4 REPORT OVERVIEW....................................................................................................... 3
2 BACKGROUND...................................................................................................................... 5
2.1 ENCRYPTION BASICS ................................................................................................... 5
2.2 ECONOMIC IMPORTANCE OF ENCRYPTION........................................................... 7
2.3 EVOLUTION OF DES .................................................................................................... 10 2.3.1 Identifying Government Security Needs ................................................................... 10 2.3.2 Identified Market Limitations ................................................................................... 13 2.3.3 Proposal Solicitations .............................................................................................. 14 2.3.4 NIST’s Investment in Promulgating DES.................................................................. 17
2.4 SUMMARY: THE ECONOMIC IMPORTANCE OF NIST’S DES PROGRAM........... 20
3 INDUSTRY SUPPLY CHAIN............................................................................................... 23
3.1 THE SUPPLY CHAIN FOR DES INFRATECHNOLOGY ............................................ 23
3.2 END USERS .................................................................................................................... 23
3.3 THE STRUCTURE OF SELECTED END-USE MARKETS ........................................... 25 3.3.1 Historical Trends in the Number and Asset Size of Retail Banks............................... 26 3.3.2 Major Forms of Electronic Transactions in Retail Banking........................................ 27
3.4 DES-BASED PRODUCT MANUFACTURERS ............................................................. 29 3.4.1 Market Entry and Growth....................................................................................... 29 3.4.2 Market Composition............................................................................................... 34
3.5 SUMMARY..................................................................................................................... 37
4 ECONOMIC ASSESSMENT FRAMEWORK................................................................... 38
4.1 MARKET BARRIERS: AN OVERVIEW ........................................................................ 38
4.2 NIST’S OUTPUTS AND THEIR IMPLICATIONS........................................................ 39 4.2.1 Market Expansion................................................................................................... 39
iv
4.2.2 Market Risk Mitigation & Cost Avoidance.............................................................. 40 4.2.3 Operational Efficiency for Users of DES-Based Encryption...................................... 42
4.3 MARKET SUBSTITUTES FOR DES.............................................................................. 43 4.3.1 Early Alternatives to DES........................................................................................ 44 4.3.2 RSA....................................................................................................................... 45 4.3.3 Foreign Encryption Standards.................................................................................. 46 4.3.4 Next-Generation Security Alternatives..................................................................... 48
4.4 COMPARISON SCENARIO .......................................................................................... 48
5 SURVEY FINDINGS ............................................................................................................ 50
5.1 INTRODUCTION ........................................................................................................... 50
5.2 PUBLISHED SOURCES OF DOWNSTREAM BENEFITS ........................................... 51
6 QUANTITATIVE ANALYSIS .............................................................................................. 54
6.1 ESTIMATING COST AVOIDANCE BENEFITS FROM FCA DATA........................... 54 6.1.1 Historical Reconstruction of Cost Avoidance Benefits .............................................. 54
6.2 COST AVOIDANCE BENEFITS TO U.S. RETAIL BANKING.................................... 59
6.3 NIST & “OTHER AGENCY” EXPENDITURES............................................................. 60
6.4 MEASURES OF ECONOMIC IMPACT........................................................................ 60
APPENDIX A: DES ALGORITHM—EVOLUTION AND OPERATION........................... A-1
APPENDIX B: COMMERCIAL BANKING “PRODUCT LINES”..................................... B-1
APPENDIX C: SOURCE DATA ON ESTIMATES OF ELECTRONIC AND NON-ELECTRONIC TRANSACTIONS .......................................................................................... C-1
APPENDIX D: ECONOMIC IMPACT METRICS................................................................D-1
v
List of Figures
Figure 1. DES Market Development and Selected Standards Implementations, 1977-Present ................................................................................................22
Figure 2. Supply Chain for Cryptographic Infratechnology.............................................24 Figure 3. Historical Tends in Number and Size of Retail Banks ......................................26 Figure 4. The DES Algorithm......................................................................................A-5 Figure 5. Data Input/Output System and Encryption....................................................A-6
List of Tables
Table 1. Estimates of Economic Impact..........................................................................3 Table 2. Variations Among Encryption Algorithms..........................................................6 Table 3. Factors Influencing Encryption Product Selection..............................................7 Table 4. Chronology of Major DES Events..................................................................12 Table 5. FIPS 46 Reaffirmation....................................................................................19 Table 6. FIPS PUB 46 Validations by Year (1977-1998) ............................................31 Table 7. Selected Patent Awards 1975-1998 (Patent Class 380.29) ............................34 Table 8. Major Product Sub-Markets..........................................................................35 Table 9. Economic Analysis Framework ......................................................................38 Table 10. Sample Encryption Algorithms Presently in Use...............................................47 Table 11. “National Average” Bank Transactions, 1977-1982........................................55 Table 12. Ratios of FCA Electronic to Non-Electronic Item Costs (1997-1998).............56 Table 13. Average Item Cost of Bank Transactions, 1977-1982 ....................................57 Table 14. Estimated Electronic and Non-Electronic Item Costs (1977-1982)..................57 Table 15. Historical Estimates of Per-Transaction Cost Avoidance, 1977-1982..............58 Table 16. Estimates of Annual Cost Avoidance for Large Banks, 1977-1982 (Nominal
Dollars).........................................................................................................58 Table 17. Estimates of Annual Cost Avoidance for Small Banks, 1977-1982 (Nominal
Dollars).........................................................................................................58 Table 18. Cost Avoidance Benefits to U.S. Retail Banks, 1977-1982 (Nominal $) ........59 Table 19. NIST & NSA Expenditures to Develop DES (Nominal $) .............................60 Table 20. Constant Dollar (Yr. 2000) Benefits and Costs, 1973-1982*..........................61 Table 21. Estimates of Economic Impact........................................................................61 Table 22. Estimated Ratios of Electronic/Total Bank Transactions (1975-1998)............C-1 Table 23. Growth Rates: Various Forms Electronic Banking Transactions (1975-
1999)..........................................................................................................C-2
ES-1
EXECUTIVE SUMMARY
The Brooks Act of 1965 (Public Law 89-306) authorized NIST, then the National
Bureau of Standards (NBS), to develop standards governing the purchase and use of
computers by the Federal government and to implement standards throughout the Federal
government. These developments were concurrent with rising concerns about the security of
sensitive but unclassified information within the government. Both industry and government felt
the need to develop means of assuring the security of information passing through still-emerging
electronic channels.
Numerous technologies that would become commonplace over the next 20 years in
financial transactions, Internet-based communications, and electronic commerce (e-commerce)
had their origins in this era. In the early 1970s, however, markets for encryption products were
just emerging and fragmented. No industry-wide standard existed to guide industry development
efforts. This led to multiple and incompatible products, a situation that discouraged their
widespread use.
In 1972, NIST launched a computer security program under the auspices of its Institute
for Computer Sciences and Technology (ICST), a precursor of today’s Information Technology
Laboratory (ITL), to develop a single, standard cryptographic algorithm that could be tested
and certified. This encryption algorithm would be readily available, support cryptographic
equipment interoperability, and be less costly to implement than traditional approaches to
computer security.
In the May 15, 1973 Federal Register, NIST issued a public request for proposals for
a standard cryptographic algorithm with relatively sophisticated design criteria that demanded a
high level of security, complete specification, availability to all users, adaptability to diverse
applications, efficiency, and validation. Failing to identify an acceptable candidate, NIST issued
a second request in the August 27, 1974 Federal Register. Eventually a promising candidate
emerged based on work that had been conducted by IBM during the early 1970s. IBM agreed
ES-2
to grant nonexclusive, royalty-free license to make, use, and sell equipment that implemented the
algorithm.
Following its collaborative assessment with the National Security Agency (NSA), NIST
adopted the Data Encryption Standard (DES) as a federal standard on November 23, 1976,
and authorized it for securing all sensitive, unclassified government data from unauthorized
access and for encrypting information transferred through communications. The official
description of the standard, Federal Information Processing Standard Publication 46 (FIPS
PUB 46), “Data Encryption Standard,” was published on January 15, 1977 and became
effective six months later. DES was reaffirmed without significant changes in 1983 and 1988,
spanning the first 10 years of its implementation. In 1993, FIPS 46-1 was reaffirmed as FIPS
46-2 with allowances for software implementation. In 1999, FIPS 46-3 (“Triple DES”) was
approved.
As a result of NIST’s efforts, the market for encryption hardware and software
expanded, developers of these products faced lower technical and market risks, and users of
encryption systems (banks in particular) enjoyed operational efficiencies from their enhanced
ability to substitute secure electronic transactions for more costly paper-based and face-to-face
transactions.
To aid in the evaluation of NIST’s DES program, it was hypothesized that industry
would have found a way to reach a consensus on an effective encryption algorithm, but that
such a consensus would have occurred some time after NIST’s initial publication of DES as
FIPS 46. Assuming that industry would have reached a consensus on a data encryption
standard three to six years after initial publication of DES, the economic impact results
presented in Table 1 indicate that it was far more effective and efficient for NIST to develop
and implement DES than it would have been to wait for the results of industry cooperation. Two
scenarios are presented. One posits that industry would have organized itself to produce an
effective standard encryption algorithm in three years. The other posits a scenario in which
industry consensus would have emerged after 6 years.
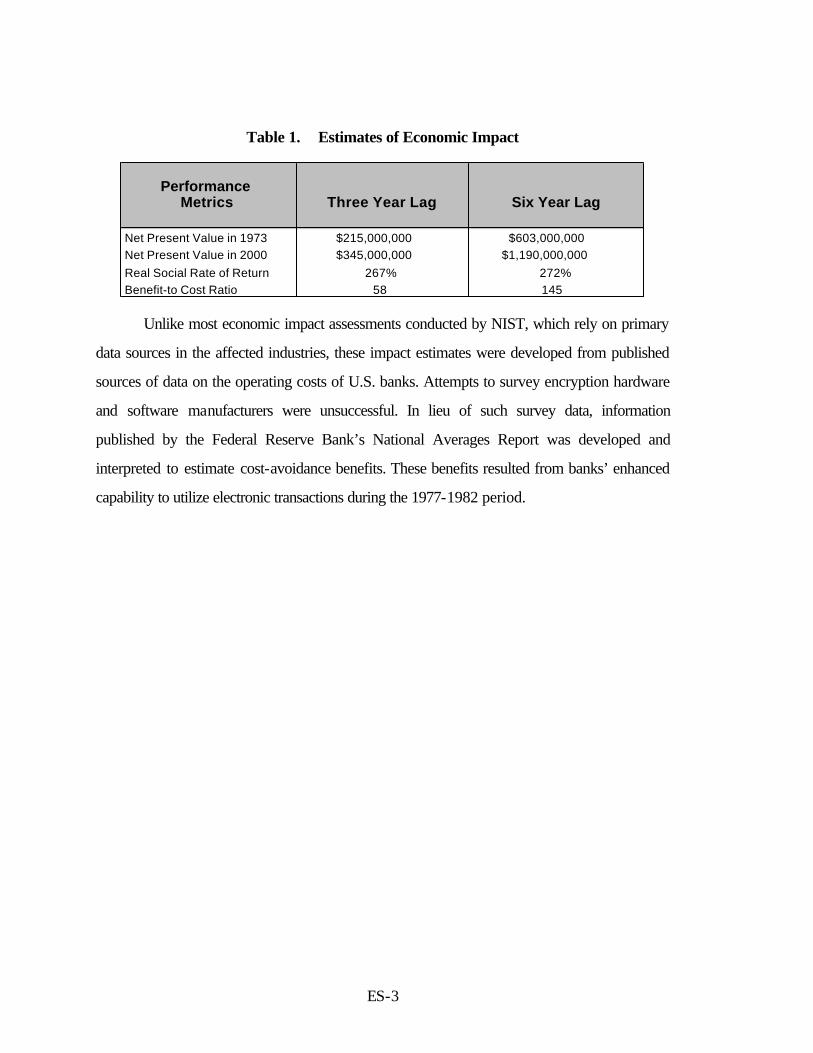
ES-3
Table 1. Estimates of Economic Impact
PerformanceMetrics Three Year Lag Six Year Lag
Net Present Value in 1973 $215,000,000 $603,000,000Net Present Value in 2000 $345,000,000 $1,190,000,000Real Social Rate of Return 267% 272%Benefit-to Cost Ratio 58 145
Unlike most economic impact assessments conducted by NIST, which rely on primary
data sources in the affected industries, these impact estimates were developed from published
sources of data on the operating costs of U.S. banks. Attempts to survey encryption hardware
and software manufacturers were unsuccessful. In lieu of such survey data, information
published by the Federal Reserve Bank’s National Averages Report was developed and
interpreted to estimate cost-avoidance benefits. These benefits resulted from banks’ enhanced
capability to utilize electronic transactions during the 1977-1982 period.
1
1 INTRODUCTION
The electronic transactions occurring routinely today in businesses and households have their
basis in technological developments of just a few decades ago. These include vastly improved
computing power, increased accessibility to communications through the development of the Internet
and World Wide Web, and the implementation of “behind the scenes” technologies that assure the
privacy and security of these various transactions. Encryption algorithms and methods are among those
technologies that are less apparent to casual or business users, but are central to virtually every funds
transfer, business-to-business data transfer or internal company data input and output today. This report
examines the evolution and economic significance of NIST’s Data Encryption Standard (DES)
Program. DES was developed by the National Institute of Standards and Technology (NIST, formerly
the National Bureau of Standards, NBS) for protecting sensitive, unclassified government information
and has become a standard for much of industry in the United States and across the world.
1.1 NIST/ITL ROLE IN DES
In 1977, the National Institute of Standards and Technology formally issued the Data
Encryption Standard (DES) as Federal Information Processing Standard Publication 46 (FIPS PUB
46). The original motivation was to provide an encryption algorithm for use in protecting sensitive,
unclassified federal information from unauthorized disclosure or undetected modification during
transmission or while in storage. However, the standard could also be implemented and used by those
outside the Federal government. NIST also developed and implemented conformance tests for DES
users to help assure correct functioning of their DES implementations.
DES is based on work of the International Business Machines Corp. (IBM) which agreed to
make this technology available publicly on a royalty-free basis. DES has also been adopted as an
American National Standard, a commercial version that has benefited financial services and other U.S.
industries. DES has been built into a wide array of hardware and software products and has been used
as a security building block in ways not envisioned at the time of its initial issuance.
2
The standard included a requirement for NIST to conduct a review every five years to
determine whether the cryptographic algorithm specified by the standard should be reaffirmed, revised
or withdrawn. The first review resulted in the reaffirmation of the standard in 1983; the standard was
reviewed and reaffirmed in 1988 and 1993. FIPS PUB 46-2, which was issued following the third
review, reaffirmed the DES until 1998, but indicated NIST’s intention to replace the algorithm after that
point. In 1999, FIPS 46-3 was approved to provide for the use of Triple DES.1
Originally, the scope of this impact assessment was to include NIST resource investments in the
development and promulgation of FIPS 46 and FIPS 46-2. Due to practical difficulties in securing
industry survey data an alternative evaluation strategy was adopted that focuses on some of the initial
economic impacts of FIPS 46. While various activities surrounding the development FIPS 46 and FIPS
46-2 are discussed, only the economic impact of FIPS 46 is estimated. NIST’s activities in developing
and promulgating FIPS 46-3 (“Triple DES”) in 1998 are beyond the scope of this investigation.
1.2 THE INDUSTRIAL RESPONSE TO DES
Hardware manufacturers and software producers have implemented DES in commercially
available products. Through early standardization of an open encryption algorithm, NIST largely
eliminated duplication and general confusion regarding encryption. This helped stabilize emerging
markets and increased market demand for security products in general and standardized encryption-
based products in particular. As a result, the industry sectors providing such products (and encryption
products generally) grew at a faster rate than would have occurred otherwise.
1 These updates did not affect the basic specifications of the DES algorithm; they were more administrative and implementation-oriented (e.g., allowing software instead of just hardware implementations). The original standard was outlined in Federal Information Processing Standard (FIPS) 46. With the first reaffirmation in 1983, this was superceded by FIPS 46-1. The standard was reaffirmed in 1988 without change. FIPS 46-2 superceded FIPS 46-1 when the standard was reaffirmed in 1993. The principal changes resulting from these updates were a) the provision for software-based implementations of DES; b) reference to the additional requirement for crypto-module validation under FIPS 140-1; and c) the indication that 1998 would be the last year of reaffirmation of single DES. Triple DES would continue to be approved.
3
DES was widely implemented in a range of financial transactions; spurred secure connectivity in
computer networks throughout industry; and played a role in the general development of e-commerce.
1.3 CASE STUDY OBJECTIVES
This case study has several objectives:
− Describe the evolution of the Data Encryption Standard and the role of NIST in its development, diffusion, and implementation
− Characterize the market barriers that gave rise to NIST’s investments in the development and diffusion of encryption technology
− Determine the areas in which DES had a significant economic impact on commercial industry and markets; describe those markets, their evolution and the role of DES in their development
− Present time series of the economic costs and benefits of NIST’s investments in DES infratechnology
− Develop and estimate metrics of the economic impacts of NIST’s DES program.
1.4 REPORT OVERVIEW
This report begins with a discussion of the basics of data encryption, including a brief
description of encryption technologies and the development of the Data Encryption Standard. Early
recognition by government and industry of the need for a robust and common encryption algorithm is
identified. NIST activities in catalyzing articulation of those needs are discussed.
An important theme emerging from this research is that during the period in which the NIST
DES program was initiated, industry had invested in various encryption technologies. However, they
were not being fully utilized because of costs and incompatibilities resulting from the proliferation of
multiple industry approaches. NIST’s role in establishing an algorithm based on work performed by
IBM as a standard for the government, and providing free access to it throughout the private sector,
brought stability to otherwise highly uncertain markets. It is doubtful that essential security systems
would have been implemented as quickly had NIST not eliminated these barriers by establishing the
encryption standard.
4
The technical background and evolution of DES set the stage for the report’s examination of its
use and diffusion. This includes its adoption by voluntary standards making bodies. Further diffusion of
DES-based products and technologies is demonstrated through patent activity over the two decades
following the publication of DES. An important element in this discussion is the importance of the
standard in “making the water safe” for entry by other firms, even those offering competing standards,
approaches or products. The market stabilizing function has spanned the lifetime of DES.
Chapter 3 describes the supply chain that has utilized the outputs of NIST’s DES program. The
flow of NIST’s infratechnology through a three-tiered supply chain is characterized and the major
segments of each tier are discussed. We have found that consistent, reliable, and detailed estimates of
the scale and structure of markets for cryptographic products are not available from published sources.
We have, therefore, relied upon interviews with industry representatives; DES program documents and
databases; and patent data to describe the evolving structure of the cryptographic equipment
manufacturing industry and its primary end-use markets.
Chapter 4 discusses the economic assessment framework for examining the impact of DES. We
examine NIST’s DES program in the context of market barriers. Chapter 5 discusses survey findings
and describes the novel use of published data to estimate “downstream” economic impacts in the retail
banking industry. Chapter 6 presents the quantitative assessment of the economic impacts of the DES
program and derives economic performance metrics, internal rate of return (IRR), Benefit-Cost ratio
(B/C), and net present value (NPV) according to NIST Program Office standards.
5
2 BACKGROUND
2.1 ENCRYPTION BASICS
An encryption system generally performs two functions: encryption and decryption.
Encryption’s fundamental purpose is to ensure privacy and data integrity. Encryption involves converting
data from plaintext (or normal text) into ciphertext, which makes data unintelligible to any
unauthorized parties. Decryption reverses the encryption process, restoring the data to its original form.
A system’s user must have a unique key in order to send or receive an encrypted message. The strength
of an encryption system depends both upon the strength of its algorithm and, often, on the length of the
keys used for encryption and decryption. A key is a mathematical value used in conjunction with a
cryptographic algorithm. Longer key lengths (that is, more digits) usually mean greater security because
there are more possible combinations for an unauthorized observer to examine.2 In a symmetric (secret-
key) cryptosystem, a single key is used to perform both encryption and decryption.3 Asymmetric
(public-key) cryptosystems use different keys for encryption and decryption.
Symmetric algorithms can be divided into two categories. Some operate on the plaintext a single
bit (or sometimes byte) at a time. These are called stream algorithms or stream ciphers. Others
operate on the plaintext in groups of bits. The groups of bits are called blocks, and the algorithms are
called block algorithms or block ciphers. For DES era computer algorithms, a typical block size is 64
bits.
Asymmetric algorithms (or public-key algorithms) are designed so that the key used for
encryption is different from the key used for decryption. Furthermore, the decryption key cannot (at
least in any reasonable amount of time) be calculated from the encryption key. The decryption key is
often called the private key. These algorithms are called “public-key” because the encryption key can
2 Lance J. Hoffman, Faraz A. Ali, Steven L. Heckler, Ann Huybrechts, Cryptography: Policy and Technology Trends, http://www.cpsr.org/cpsr/conferences/cfp94/papers/hoffman.txt; Paul Fahn, Answers To Frequently Asked Questions About Today's Cryptography, http://www.cs.wcu.edu/~russkiy/texts/misc/cryptfaq.txt.
6
be made widely available; i.e., to the public. A complete stranger can use the encryption key to encrypt
a message, but only specific persons with the corresponding decryption key can decrypt the message. It
is important to note that sometimes messages will be encrypted by the secret key and decrypted with
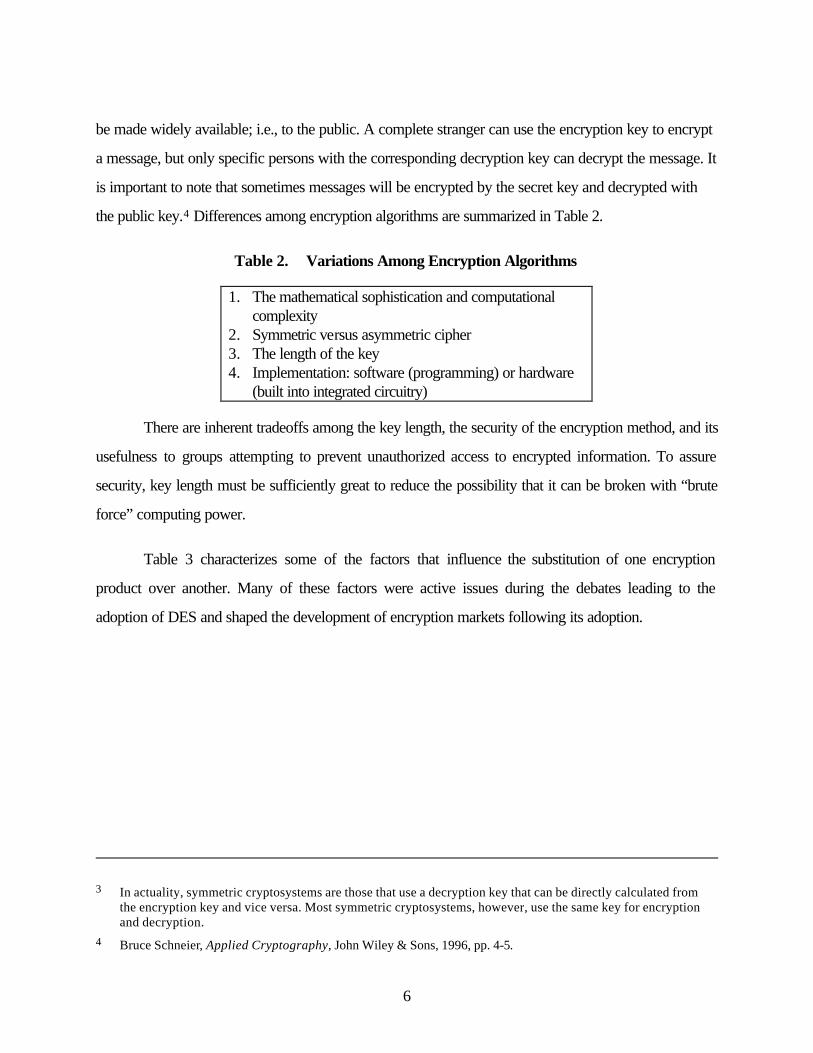
the public key.4 Differences among encryption algorithms are summarized in Table 2.
Table 2. Variations Among Encryption Algorithms
1. The mathematical sophistication and computational complexity
2. Symmetric versus asymmetric cipher 3. The length of the key 4. Implementation: software (programming) or hardware
(built into integrated circuitry)
There are inherent tradeoffs among the key length, the security of the encryption method, and its
usefulness to groups attempting to prevent unauthorized access to encrypted information. To assure
security, key length must be sufficiently great to reduce the possibility that it can be broken with “brute
force” computing power.
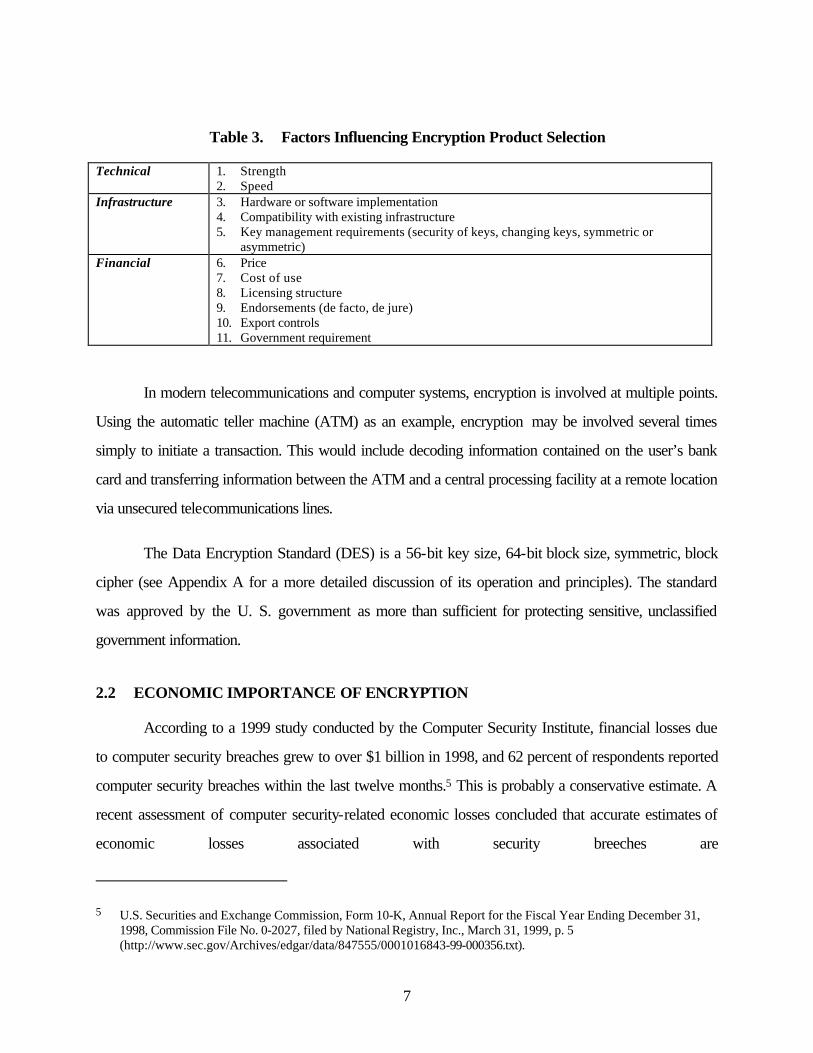
Table 3 characterizes some of the factors that influence the substitution of one encryption
product over another. Many of these factors were active issues during the debates leading to the
adoption of DES and shaped the development of encryption markets following its adoption.
3 In actuality, symmetric cryptosystems are those that use a decryption key that can be directly calculated from the encryption key and vice versa. Most symmetric cryptosystems, however, use the same key for encryption and decryption.
4 Bruce Schneier, Applied Cryptography, John Wiley & Sons, 1996, pp. 4-5.
7
Table 3. Factors Influencing Encryption Product Selection
Technical 1. Strength 2. Speed
Infrastructure 3. Hardware or software implementation 4. Compatibility with existing infrastructure 5. Key management requirements (security of keys, changing keys, symmetric or
asymmetric) Financial 6. Price
7. Cost of use 8. Licensing structure 9. Endorsements (de facto, de jure) 10. Export controls 11. Government requirement
In modern telecommunications and computer systems, encryption is involved at multiple points.
Using the automatic teller machine (ATM) as an example, encryption may be involved several times
simply to initiate a transaction. This would include decoding information contained on the user’s bank
card and transferring information between the ATM and a central processing facility at a remote location
via unsecured telecommunications lines.
The Data Encryption Standard (DES) is a 56-bit key size, 64-bit block size, symmetric, block
cipher (see Appendix A for a more detailed discussion of its operation and principles). The standard
was approved by the U. S. government as more than sufficient for protecting sensitive, unclassified
government information.
2.2 ECONOMIC IMPORTANCE OF ENCRYPTION
According to a 1999 study conducted by the Computer Security Institute, financial losses due
to computer security breaches grew to over $1 billion in 1998, and 62 percent of respondents reported
computer security breaches within the last twelve months.5 This is probably a conservative estimate. A
recent assessment of computer security-related economic losses concluded that accurate estimates of
economic losses associated with security breeches are
5 U.S. Securities and Exchange Commission, Form 10-K, Annual Report for the Fiscal Year Ending December 31, 1998, Commission File No. 0-2027, filed by National Registry, Inc., March 31, 1999, p. 5 (http://www.sec.gov/Archives/edgar/data/847555/0001016843-99-000356.txt).
8
difficult to establish because organizations are reluctant to report losses in fear of dampening customer
confidence in the safety of their systems.6 The costs of such losses can be characterized in three areas:
− Direct costs—These include expenditures for such products as firewalls or anti-virus software, the incremental costs of products offering superior safety features or assurances, and training
− Indirect costs—These include such costs as higher computer system prices as a result of more powerful CPUs needed to implement security algorithms or from deferred sales due to consumer concerns about security trustworthiness
− System failure costs—These include the costs or losses resulting from fraud, sabotage or similar direct attacks on the security of a system.
The potential and real losses in these and other areas have driven the market for security
products. This is particularly true for encryption once DES was approved in 1977. A recent survey by
the International Data Corp. (IDC) of 300 commercial U.S. companies with revenue over $100 million
concluded that expenditures for security products have grown with increased use of Internet
communications by firms. The company found that the worldwide Internet security software market
grew 67 percent, from 1996 revenues of $1.2 billion to 1997 sales of $2.0 billion, and that revenues
continued to grow to an estimated $3.1 billion in 1998. Moreover, this market was expected to reach
$4.2 billion in 1999 and $7.4 billion by 2002, according to IDC estimates.7 The survey also concluded
that encryption was second only to user authentication in potential growth. Finally, it concluded that
three industries—financial services, telecommunications and transportation—were expected to exceed a
40 percent adoption rate for user authentication by the year 2000.
6 Fred B. Schneider, ed., Trust in Cyberspace (Washington, D.C.: National Academy Press, 1999), pp. 180-186. 7 PR Newswire, “Worldwide Market for Internet Security Software Will Top $7.4 Billion in 2002,” March 30, 1999.
IDC splits the overall Internet security software market into several sub-markets, including firewalls, encryption software, antiviral software, and authorization, authentication, and administration software. Firewalls, which enforce security restrictions and restrict unauthorized access, will experience the fastest growth. Worldwide revenues in this market will increase 40 percent compounded annually through 2002, compared with an overall market growth rate of 30 percent.
9
The value of transactions that take place using cryptographic algorithms in general and DES in
particular is another way to understand the economic importance of cryptography. The U.S. Treasury
alone, for example, transfers billions of dollars daily in the normal conduct of its business. These
transactions affect everyone from a Social Security recipient waiting for a direct deposit of a monthly
payment to huge corporations providing goods and services. Daily international transactions dwarf U.S.
government transactions in scale. Fedwire and the Clearing House Interbank Payment System, which
process over 350,000 messages daily valued at $1-2 trillion, use DES to protect messages from
unauthorized modification.8 Encryption is silent, behind-the-scenes, and pervasive.
The figures and characterizations above only provide a glimpse of the total economic
importance of encryption today. Regardless of the actual magnitude or taxonomy of costs, the potential
economic losses or privacy violations that could occur due to the failure of secure systems is clear and
sets the stage for an examination of the market for encryption products.
The economic importance of cryptography can also be gauged by the scale of the industry that
provides cryptographic products and services. Cryptographic products and services are themselves
only a relatively small part of the much larger market for information security.
Unfortunately, there is no consistent source of time series data on world markets or domestic
markets for cryptographic products. Alternative estimates are offered below to provide a sense of the
market size:
− A 1991 estimate, for example, put the worldwide market for encryption products at $695 million9
− Perhaps the most authoritative estimate of the worldwide demand for encryption products is a 1995 Department of Commerce/National Security Agency study, A Study of the International Market for Computer Software with Encryption.
8 U.S. General Accounting Office, “Communications Privacy: Federal Policy and Actions,” Letter Report, November 4, 1993, GAO/OSI-94-2, Appendix II: 2-1, http://frwebgate.access.gpo.gov/cgi-bin/useftp.cgi?IPaddress=162.140.64.21&filename=os94002.txt&directory=/diskb/wais/data/gao.
9 Cited in, A Study of the International Market for Computer Software with Encryption, U.S. Department of Commerce and the National Security Agency, July 1995, p. III-1. Referred to hereafter as DOC/NSA, 1995.
10
Based on survey data, this study estimated worldwide sales of hardware and software encryption products at $3.3 billion, adding that the bulk of that figure was accounted for by the sale of general purpose software with encryption as a minor feature and that the security-specific sales figures available totaled only $55 million
− Another assessment estimated that by 1996, the worldwide market for encryption products—hardware and software—was in the range of $1-2 billion dollars with an annual growth rate projected at 57 percent annually10
− The United States accounts for roughly half the global market.
2.3 EVOLUTION OF DES
In 1977, NIST (then the National Bureau of Standards) published the Data Encryption
Standard (DES). The path by which DES came into being involved both industry and government
contributions. The issuance of DES, however, was central to introducing a larger number of derivative
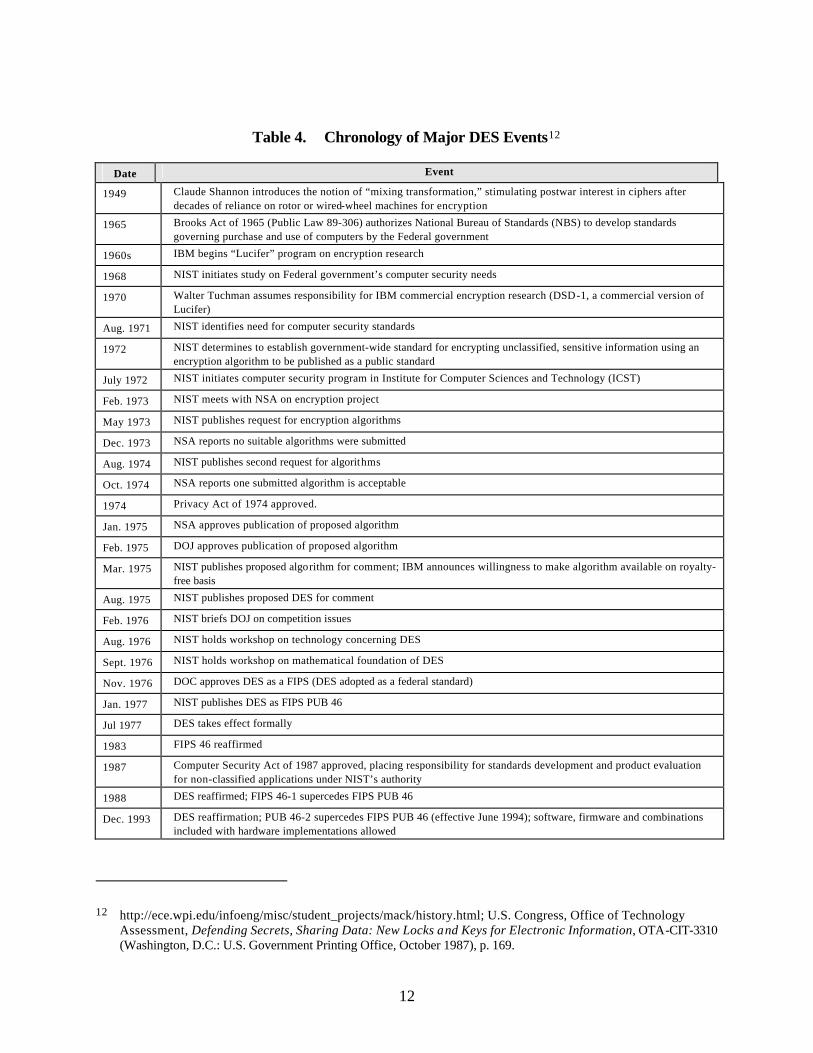
standards that enabled growth of the encryption industry and the services that rely upon it. Table 4
describes the major events in the development and diffusion of the DES.
2.3.1 Identifying Government Security Needs
NIST had been involved in issues that ultimately led to the formation of a data encryption
standard at least as early as the mid-1960s. The Brooks Act of 1965 (Public Law 89-306) authorized
NIST to develop standards governing the purchase and use of computers by the Federal government.
In addition, this act authorized research to support the development of these standards and for
implementing them throughout the Federal government. These developments were concurrent with rising
concerns over the security of sensitive but unclassified information within the government. Both industry
and government felt the need to develop means of assuring the security of information that passed
through still emerging electronic channels.11
10 Erik R. Olbeter and Christopher Hamilton, Finding the Key: Reconciling National and Economic Security Interests in Cryptographic Policy (Washington, D.C.: Economic Strategy Institute, March 1998), p. 1; DOC/NSA, 1995.
11 OTA, Defending Secrets, Sharing Data: New Locks and Keys for Electronic Information, pp. 168-169.
11
NIST initiated a study in 1968 of government security needs with the anticipation of developing
a new data security standard for the Federal government. This resulted in a 1972 decision to develop a
government-wide standard for encrypting unclassified government information using an encryption
algorithm that would also become a public standard. NIST launched a computer security program under
the auspices of its Institute for Computer Sciences and Technology (ICST) in 1972. The development
of a single, standard cryptographic algorithm was one objective in the ICST program. A single algorithm
could be tested and certified, and different cryptographic equipment using it could interoperate. It would
also be less costly to implement and readily available.
12
Table 4. Chronology of Major DES Events12
Date Event
1949 Claude Shannon introduces the notion of “mixing transformation,” stimulating postwar interest in ciphers after decades of reliance on rotor or wired-wheel machines for encryption
1965 Brooks Act of 1965 (Public Law 89-306) authorizes National Bureau of Standards (NBS) to develop standards governing purchase and use of computers by the Federal government
1960s IBM begins “Lucifer” program on encryption research
1968 NIST initiates study on Federal government’s computer security needs
1970 Walter Tuchman assumes responsibility for IBM commercial encryption research (DSD-1, a commercial version of Lucifer)
Aug. 1971 NIST identifies need for computer security standards
1972 NIST determines to establish government-wide standard for encrypting unclassified, sensitive information using an encryption algorithm to be published as a public standard
July 1972 NIST initiates computer security program in Institute for Computer Sciences and Technology (ICST)
Feb. 1973 NIST meets with NSA on encryption project
May 1973 NIST publishes request for encryption algorithms
Dec. 1973 NSA reports no suitable algorithms were submitted
Aug. 1974 NIST publishes second request for algorithms
Oct. 1974 NSA reports one submitted algorithm is acceptable
1974 Privacy Act of 1974 approved.
Jan. 1975 NSA approves publication of proposed algorithm
Feb. 1975 DOJ approves publication of proposed algorithm
Mar. 1975 NIST publishes proposed algorithm for comment; IBM announces willingness to make algorithm available on royalty-free basis
Aug. 1975 NIST publishes proposed DES for comment
Feb. 1976 NIST briefs DOJ on competition issues
Aug. 1976 NIST holds workshop on technology concerning DES
Sept. 1976 NIST holds workshop on mathematical foundation of DES
Nov. 1976 DOC approves DES as a FIPS (DES adopted as a federal standard)
Jan. 1977 NIST publishes DES as FIPS PUB 46
Jul 1977 DES takes effect formally
1983 FIPS 46 reaffirmed
1987 Computer Security Act of 1987 approved, placing responsibility for standards development and product evaluation for non-classified applications under NIST’s authority
1988 DES reaffirmed; FIPS 46-1 supercedes FIPS PUB 46
Dec. 1993 DES reaffirmation; PUB 46-2 supercedes FIPS PUB 46 (effective June 1994); software, firmware and combinations included with hardware implementations allowed
12 http://ece.wpi.edu/infoeng/misc/student_projects/mack/history.html; U.S. Congress, Office of Technology Assessment, Defending Secrets, Sharing Data: New Locks and Keys for Electronic Information, OTA-CIT-3310 (Washington, D.C.: U.S. Government Printing Office, October 1987), p. 169.
13
2.3.2 Identified Market Limitations
By the early 1970s, private sector research was progressing on methods of securing personal
identification numbers as they were transmitted to remote locations for verification—a key step in
assuring security in a financial transaction such as a credit card charge or a cash withdrawal from an
ATM. Advances were being made in encrypting messages and data transmissions across unsecured
telecommunications networks in anticipation of the need for secure systems. Industry therefore
recognized the increasing need for security and cryptographic products. One of IBM’s DES algorithm
pioneers articulated this need:
During the early 1970s, it became apparent that the commercial sector also has a legitimate need for cryptography. Corporate secrets must be transmitted between distant sites without the possibility of eavesdropping by industrial spies. Personal data on databases need to be protected against espionage and alteration. A familiar example is the communication between an automatic teller machine (ATM) and a central computer.13
Numerous technologies that would become commonplace over the next 20 years in financial
transactions, Internet-based communications, and electronic commerce (e-commerce) had their origins
in this era. However, companies also identified other deficiencies in the development of the market.
While only a handful of companies were active in these research areas, companies recognized that
markets in the early 1970s were fragmented. No industry-wide standard existed to guide industry
development efforts. This led to multiple and incompatible products, a situation that discouraged their
widespread use. Atalla Technovation Corp.14 described this situation in its patent application for an
encoded card reader:
13 D. Coppersmith, “The Data Encryption Standard (DES) and its Strength Against Attacks,” IBM Journal of Research & Development, Vol. 38, No. 3, May 1994.
14 Atalla Technovations was the predecessor of Atalla Corp., now a part of Compaq Computer’s Tandem Division. An early competitor of IBM in this field, it was awarded a patent in 1976 for a system that utilized encryption techniques to assure telephone link security while entering personal ID information that was transmitted to a remote location for verification (U.S. Patent No. 3,938,091, issued Feb. 10, 1976). Due to the integration of Atalla and Tandem with Compaq, the parent now holds the intellectual property rights to at least 19 different cryptography patents awarded from 1981 through 1994.
14
Card readers are relatively expensive devices. As a result, the prior systems have been too costly to implement, especially when a relatively large number of verifiers are required such as would be contemplated by widespread use of credit cards. That is, each merchant, filling station operator, or the like would be required to have a number of such units. Therefore, the cost of the prior devices has heretofore been considered prohibitive.15
This passage describes one of the important market barriers addressed by DES. Multiple
systems increased costs to potential users and discouraged them from adopting any system. The
diffusion of technology was hampered and the potential benefits associated with widespread use of
services dependent on secure transactions were denied. It is important to note that industry recognized
the need for security in these transactions, and that competing technical approaches prevented
widespread application of encryption technologies.
Thus, there was an emerging consensus within industry—even among competing firms—that an
encryption standard was needed to promote the use of encryption products throughout the wide range
of applications that were identified at the time and would be used in systems that today are
commonplace. Researchers recognized the potential benefits to be derived from a standard in such
forms as market expansion and interoperability:
For the ease of hardware and software implementation of the [encryption] transformation, [public disclosure and dissemination] may encourage common adoption of the transformation as a standard. In this way, plaintexts can be received and transmitted as ciphertexts among different units, devices, or terminals, making communications among heterogeneous computer systems possible.16
2.3.3 Proposal Solicitations
A fledgling commercial encryption industry was evolving in the decade prior to the publication of
DES in 1977. At least two approaches to commercial encryption were in development preceding the
publication of DES: IBM’s, which ultimately became DES; and the public key algorithm developed by
15 U.S. Patent No. 3,938,091, issued Feb. 10, 1976, pp. 1:25~1:36. 16 David K. Hsiao, Douglas S. Kerr, and Stuart E. Madnick, Computer Security (New York: Academic Press, 1979),
pp. 138-139.
15
MIT researchers Whitfield Diffie and Martin E. Hellman, which eventually became the basis for the
RSA algorithm in the early 1980s. While other companies may have been operating at the time (as
indicated by patent activity), none offered products of sufficient quality to meet NIST’s performance
requirements. In the May 15, 1973 Federal Register, NIST issued a public request for proposals for a
standard cryptographic algorithm. A series of design criteria were specified. The algorithm must:
− Provide a high level of security
− Be completely specified and easy to understand
− Have its security resident in the key; the security should not depend on the secrecy of the algorithm
− Be available to all users
− Be adaptable for use in diverse applications
− Be economically implementable in electronic devices
− Be efficient to use
− Be able to be validated
− Be exportable.
Public response indicated a considerable interest in a cryptographic standard. However, none of the
submissions came close to meeting the requirements. NIST issued a second request in the August 27,
1974 Federal Register. Eventually a promising candidate emerged: an algorithm based on one
developed by IBM during the early 1970s as part of its broader research on encryption methods called
Lucifer.17 The algorithm, although complicated, was straightforward. It used only simple logical
operations on small groups of bits and could be implemented fairly efficiently in hardware.
IBM granted a nonexclusive, royalty-free license to make, use, and sell equipment that
implemented the algorithm. IBM had already filed for a patent, which was issued on June 8, 1976, as
17 Early approaches and outcomes in Lucifer were described in Horst Feistel, “Cryptography and Computer Privacy,” Scientific American, Vol. 228, No. 5, May 1973, pp. 16-23. The development of the encryption algorithm that eventually became DES is also examined in Steven Levy, Crypto, Viking, 2001.
16
U.S Patent No. 3,962,539, but was willing to make its intellectual property available to others for
manufacture, implementation, and use. IBM’s decision was not a simple one to make. Driven in part by
demand from the financial services industry, IBM had developed what it believed was a high quality
crypto-algorithm. By maintaining the algorithm as IBM proprietary intellectual property, it could
conceivably raise investment costs for potential competitors to develop comparable capabilities for
online networks. This would have provided IBM an important competitive advantage in such areas as
automated teller machines (ATMs) and other products and services requiring strong encryption
algorithms.
Others within IBM, however, viewed the nascent standard as one that could provide the
foundation for the development of businesses dependent on secure electronic transactions. By offering
the sense of safety that would come with the encryption standard, the industry as a whole would
prosper and IBM’s fortunes would be elevated with it. The analogy offered at that time and repeated
since in our interviews with industry was one of a safety belt in a passenger car: the very existence of the
device and its widespread availability to the industry as a whole would assure equally widespread
acceptance by users and would stimulate its further development and utilization. Another important
element in IBM’s thinking was that it had developed a commercially viable VLSI chip that could
incorporate the encryption algorithm efficiently. By making the IBM algorithm a government standard, it
presumably would have a competitive edge in the production of encryption chips using its VLSI
technology.18
NIST published both the details of the algorithm and IBM’s statement granting a nonexclusive,
royalty-free license for the algorithm, and requested comment in the March 17, 1975 Federal
Register.19 Another notice, in the August 1, 1975 Federal Register, again requested comments from
18 Personal communication with Walter Tuchman, June 28, 1999; see also Walter Tuchman, “A Brief History of the Data Encryption Standard,” Chapter 17 in Dorothy E. Denning and Peter J. Denning, eds., Internet Besieged: Countering Cyberspace Scofflaws (New York: Addison-Wesley, 1998), pp. 277-278.
19 “International Business Machines Corp., License Under Patents,” Federal Register Doc. 75-6789, filed March 14, 1975, Federal Register, Vol. 40, No. 52, March 17, 1975, pp. 12138-12139.
17
agencies and the general public.20 In 1976, NIST held two workshops to evaluate the proposed
standard.21 DES was adopted as a federal standard on November 23, 1976 and authorized for
securing all sensitive, unclassified government data from unauthorized access and for encrypting
information in transferred through communications.22 The official description of the standard, Federal
Information Processing Standard Publication 46 (FIPS PUB 46), “Data Encryption Standard,” was
published on January 15, 1977, and became effective six months later.23
2.3.4 NIST’s Investment in Promulgating DES
Development and Publication. The administrative and technical workloads associated with
the development and promulgation of DES for NIST, other Federal agencies and the private sector
(including vendors, the banking community, university researchers, and others) were substantial.
Although exact statistics were not compiled, these interactions included a conference at NIST and some
20 NIST requested help from the National Security Agency (NSA) in evaluating the algorithm’s security and determining its suitability as a federal standard. Concerns were expressed over the NSA’s “invisible hand” in the development of the algorithm, specifically that a “trapdoor” may have been installed. Critics also warned that the reduced key length—from the original 128 bits to the proposed 56 bits—would make it vulnerable to brute force attacks soon after its adoption. See, Whitfield Diffie and Martin E. Hellman, “Exhaustive Cryptanalysis of the NBS Data Encryption Standard,” Computer, Vol. 10, No. 6, June 1977, pp. 74-84.
21 The first workshop discussed the mathematics of the algorithm and the possibility of a trapdoor. The second workshop discussed the possibility of increasing the algorithm’s key length. The algorithm’s designers, evaluators, implementers, vendors, users, and critics were invited.
22 “Data encryption (cryptography) is utilized in various applications and environments. The specific utilization of encryption and the implementation of the DES will be based on many factors particular to the computer system and its associated components. In general, cryptography is used to protect data while it is being communicated between two points or while it is stored in a medium vulnerable to physical theft. Communication security provides protection to data by enciphering it at the transmitting point and deciphering it at the receiving point. File security provides protection to data by enciphering it when it is recorded on a storage medium and deciphering it when it is read back from the storage medium. In the first case, the key must be available at the transmitter and receiver simultaneously during communication. In the second case, the key must be maintained and accessible for the duration of the storage period” (FIPS PUB 46-2, “Data Encryption Standard,” as reprinted by DataPro, p. 3).
23 Other FIPS deal with the specifics of implementing DES. FIPS PUB 81, “DES Modes of Operation,” was published in 1980. This defines the four methods or modes (Electronic Codebook—ECB; Cipher Block Chaining—CBC; Cipher Feedback—CFB; and Output Feedback—OFB) in which the DES may be implemented. FIPS PUB 74, “Guidelines for Implementing and Using the NBS Data Encryption Standard,” was published in 1981. This discusses a broad range of issues such as conditions under which encryption/decryption may be required. NIST also published FIPS PUB 112, specifying DES for password encryption (it discusses threats and vulnerabilities and describes technical security services and security mechanisms), and FIPS PUB 113, specifying DES use and guidelines for computer data authentication.

18
2,000 technical and policy meetings, telephone discussions, and mail contacts. Dates of FIPS 46
reaffirmation are shown in Table 5.
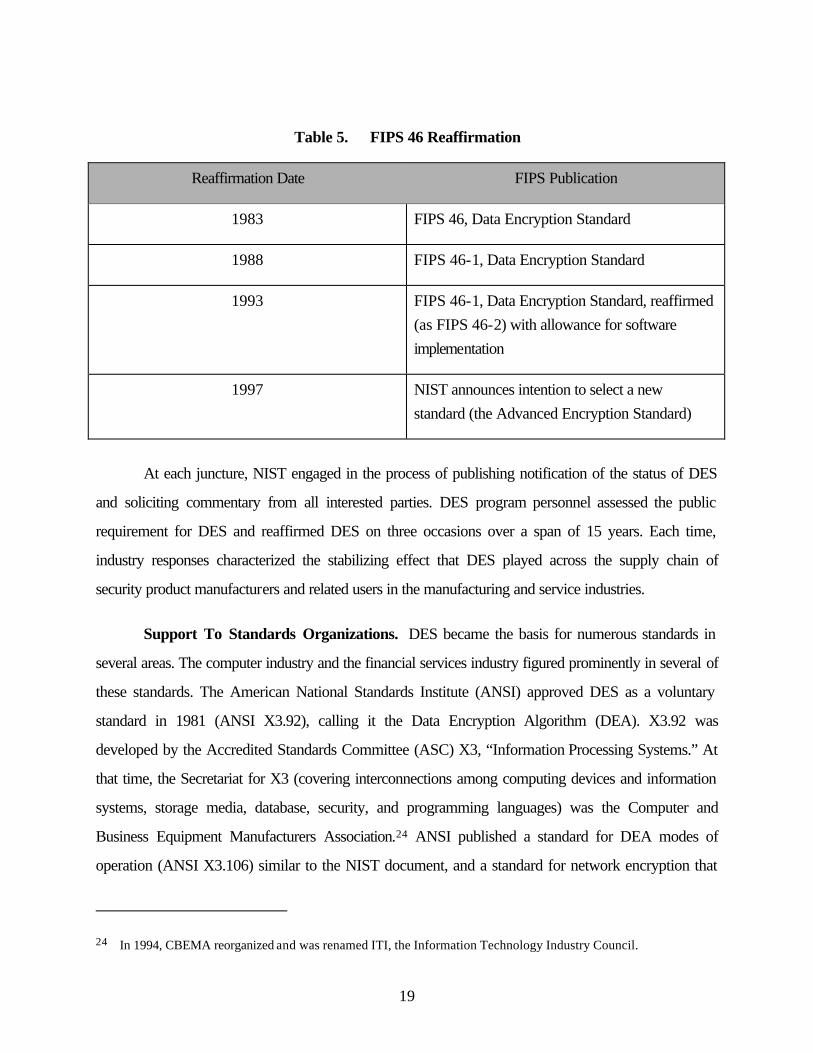
19
Table 5. FIPS 46 Reaffirmation
Reaffirmation Date FIPS Publication
1983 FIPS 46, Data Encryption Standard
1988 FIPS 46-1, Data Encryption Standard
1993 FIPS 46-1, Data Encryption Standard, reaffirmed (as FIPS 46-2) with allowance for software implementation
1997 NIST announces intention to select a new standard (the Advanced Encryption Standard)
At each juncture, NIST engaged in the process of publishing notification of the status of DES
and soliciting commentary from all interested parties. DES program personnel assessed the public
requirement for DES and reaffirmed DES on three occasions over a span of 15 years. Each time,
industry responses characterized the stabilizing effect that DES played across the supply chain of
security product manufacturers and related users in the manufacturing and service industries.
Support To Standards Organizations. DES became the basis for numerous standards in
several areas. The computer industry and the financial services industry figured prominently in several of
these standards. The American National Standards Institute (ANSI) approved DES as a voluntary
standard in 1981 (ANSI X3.92), calling it the Data Encryption Algorithm (DEA). X3.92 was
developed by the Accredited Standards Committee (ASC) X3, “Information Processing Systems.” At
that time, the Secretariat for X3 (covering interconnections among computing devices and information
systems, storage media, database, security, and programming languages) was the Computer and
Business Equipment Manufacturers Association.24 ANSI published a standard for DEA modes of
operation (ANSI X3.106) similar to the NIST document, and a standard for network encryption that
24 In 1994, CBEMA reorganized and was renamed ITI, the Information Technology Industry Council.
20
uses DES (ANSI X3.105).25 The financial services industry was also an important early implementor of
DES-based standards. The American Bankers Association, the ANSI ASC X9 Secretariat, worked
closely with NIST and the ANSI ASC X3 Secretariat in formulating guidelines and standards for
message authentication, PIN management and security, key management, and financial messages.
NIST’s DES also appears to have been influential in the e-commerce standards community. Its
impact in this community began in the late-1980s. Industry representatives contend that DEA (the DES-
derivative used in relevant ANSI X3 and X9 standards) was the starting point for such security-related
standards as ANSI X12.42 (1991) and ANSI X12.58 (1991). These standards focus on, among other
things, matching remittances to electronic invoices. Finally, many Internet Engineering Task Force
(IETF) standards (known as RFCs) reference DES including TLS – RFC 2246 (TLS Protocol),
IPSEC – RFC 2451 (ESP CBC-Mode Cipher Algorithms), IPEC – RFC 2405 (ESP DES-CBC
Cipher Algorithms with Explicit IV), IPEC – RFC 2406 (IP Encapsulating Security Payload), and
SMIME – RFC 2630 (Cryptographic Message Syntax).
2.4 SUMMARY: THE ECONOMIC IMPORTANCE OF NIST’S DES PROGRAM
This chapter briefly described the technology underlying DES and examined the evolution of the
DES program. Several points emerge from that discussion:
− The need for increased data and telecommunications security was clear in the late 1960s and particularly in the early 1970s
− DES was implemented to meet the needs of government users
− The public availability of DES encouraged its adoption in a range of commercial products
− DES remains an important encryption standard even as alternatives for its replacement are being considered.
In the early 1970s, both industry and government recognized the need to provide greater
information security through the development of a standard for data encryption. The promulgation of the
25 DES and DEA have four different operational modes. Different modes are suitable for different applications. FIPS 81 describes these modes in greater detail.
21
Data Encryption Standard helped assure the protection of sensitive, unclassified information in
government, but its impact extended beyond government. DES helped stabilize markets to encourage
more entrants and encouraged the introduction of interoperable hardware. This stimulated the
acceptance of encryption products and services in domestic and international markets.
Early NIST contributions were evident in at least two areas:
− The initial publication of DES and the activities leading up to it involved a significant economic contribution in terms of developing a consensus around a single standard, and subsequently educating federal and potential commercial users about the standard. This, in turn, contributed to the growth and stability of the market for cryptographic products
− Through NIST participation in voluntary standards-making activities, DES became the basis for numerous other standards (e.g., X3, X9, X12, IEFT) used by government and industry. These included international standards, broadening the reach of DES and its acceptance in domestic and international markets. This helped stabilize markets at a critical juncture and encouraged broader use of encryption products, particularly those incorporating the DES algorithm.
As illustrated in Figure 1, markets for encryption products in general, and DES-based products
in particular, have evolved over the last 20 years from a situation in which a few DES-based devices
were available to one in which a variety of devices, interoperable equipment, and software products are
available worldwide.
Evidence of DES’ acceptance can be seen not only through the number of standards based on
it, but also through increased cryptographic patenting activity. In fact, a new subclass of the U.S. patent
system was created specifically for DES applications. New patents in this class have increased in
number since the creation of this subclass—reflecting a growth in products incorporating DES. The
following chapter will review these and other data to describe the evolving structure of the market
encryption products.

22
Figure 1. DES Market Development and Selected Standards Implementations, 1977-Present
23
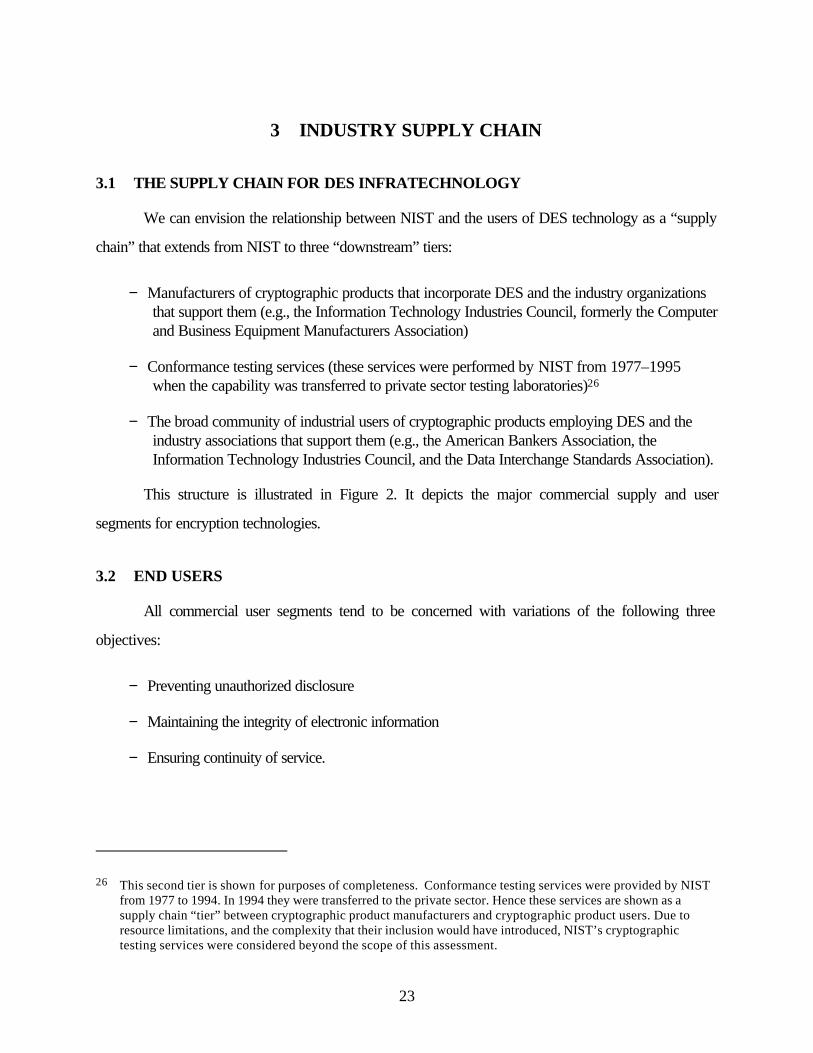
3 INDUSTRY SUPPLY CHAIN
3.1 THE SUPPLY CHAIN FOR DES INFRATECHNOLOGY
We can envision the relationship between NIST and the users of DES technology as a “supply
chain” that extends from NIST to three “downstream” tiers:
− Manufacturers of cryptographic products that incorporate DES and the industry organizations that support them (e.g., the Information Technology Industries Council, formerly the Computer and Business Equipment Manufacturers Association)
− Conformance testing services (these services were performed by NIST from 1977–1995 when the capability was transferred to private sector testing laboratories)26
− The broad community of industrial users of cryptographic products employing DES and the industry associations that support them (e.g., the American Bankers Association, the Information Technology Industries Council, and the Data Interchange Standards Association).
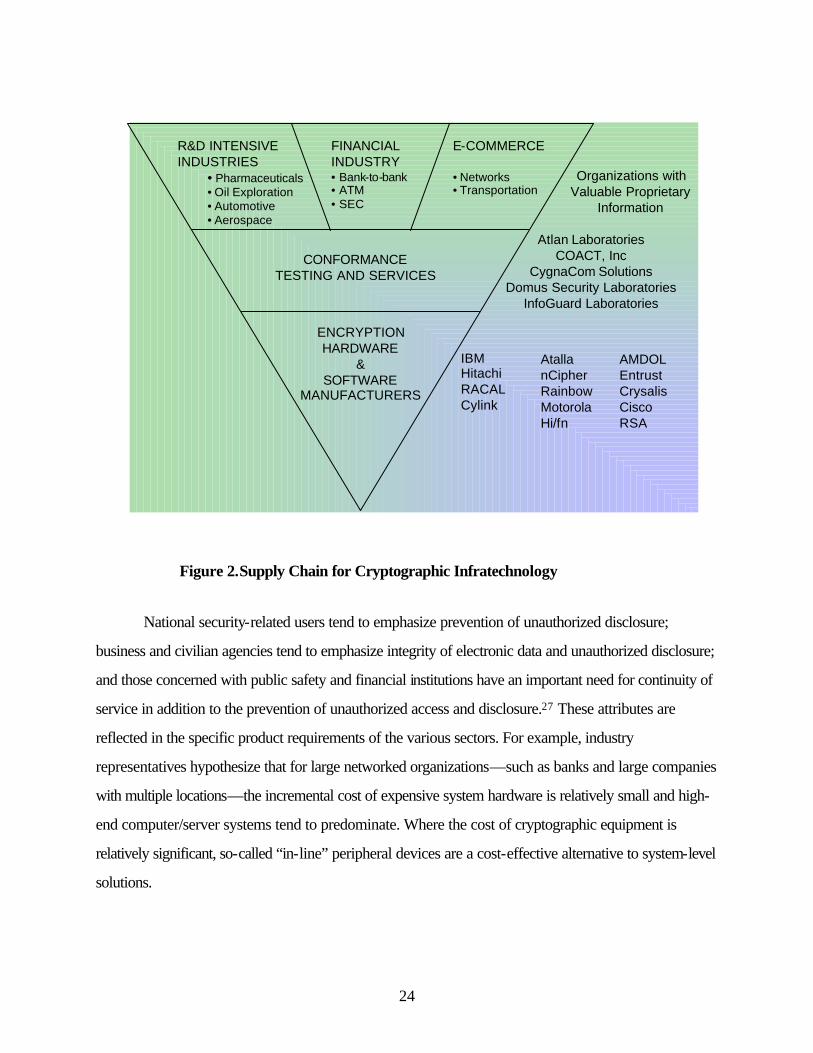
This structure is illustrated in Figure 2. It depicts the major commercial supply and user
segments for encryption technologies.
3.2 END USERS
All commercial user segments tend to be concerned with variations of the following three
objectives:
− Preventing unauthorized disclosure
− Maintaining the integrity of electronic information
− Ensuring continuity of service.
26 This second tier is shown for purposes of completeness. Conformance testing services were provided by NIST from 1977 to 1994. In 1994 they were transferred to the private sector. Hence these services are shown as a supply chain “tier” between cryptographic product manufacturers and cryptographic product users. Due to resource limitations, and the complexity that their inclusion would have introduced, NIST’s cryptographic testing services were considered beyond the scope of this assessment.
24
Figure 2. Supply Chain for Cryptographic Infratechnology
National security-related users tend to emphasize prevention of unauthorized disclosure;
business and civilian agencies tend to emphasize integrity of electronic data and unauthorized disclosure;
and those concerned with public safety and financial institutions have an important need for continuity of
service in addition to the prevention of unauthorized access and disclosure.27 These attributes are
reflected in the specific product requirements of the various sectors. For example, industry
representatives hypothesize that for large networked organizations—such as banks and large companies
with multiple locations—the incremental cost of expensive system hardware is relatively small and high-
end computer/server systems tend to predominate. Where the cost of cryptographic equipment is
relatively significant, so-called “in-line” peripheral devices are a cost-effective alternative to system-level
solutions.
R&D INTENSIVEINDUSTRIES
• Pharmaceuticals• Oil Exploration• Automotive• Aerospace
FINANCIALINDUSTRY• Bank-to-bank• ATM• SEC
E-COMMERCE
• Networks• Transportation
CONFORMANCETESTING AND SERVICES
ENCRYPTIONHARDWARE
&SOFTWARE
MANUFACTURERS
Organizations withValuable Proprietary
Information
Atlan LaboratoriesCOACT, Inc
CygnaCom SolutionsDomus Security Laboratories
InfoGuard Laboratories
IBMHitachiRACALCylink
AtallanCipherRainbowMotorolaHi/fn
AMDOLEntrustCrysalisCiscoRSA
25
The explosion of networking technologies and the pervasiveness of distributed computing across
the industrial landscape has greatly expanded the demand for software encryption. The banking industry
was among the earliest and most significant users of encryption but it has also been regarded as just one
example of a widespread requirement for commercial encryption services. Various published sources
and interviews with industry representatives active in the market for encryption products indicate that
while the financial industry was among the first to seek commercial uses of encryption technology, many
Fortune 500 companies were early adopters as well.
A recent analysis of the demand for cryptography products (hardware and software) breaks out
the users of these products and services in five areas and estimates the segment’s share of total revenue:
28
− Data networks/remote access (26%)
− Voice communication (23%)
− Generic software/hardware (19%)
− Internet applications (12%)
− Other (19%).
3.3 THE STRUCTURE OF SELECTED END-USE MARKETS
The end users groups identified in Figure 2 are too vast and complex to be adequately
described here. Since the benefit estimates described later in this report are drawn solely from the retail
banking segment of the financial industry, a description of the size and growth of the retail banking
industry is provided. Banking services that rely on encryption are also discussed.
27 OTA, Defending Secrets, Sharing Data: New Locks and Keys for Electronic Information, p. 96. 28 E. Olbeter and C. Hamilton, Finding the Key: Reconciling National and Economic Security Interests in
Cryptographic Policy, Economic Strategy Institute, 1998, p. 12.
26
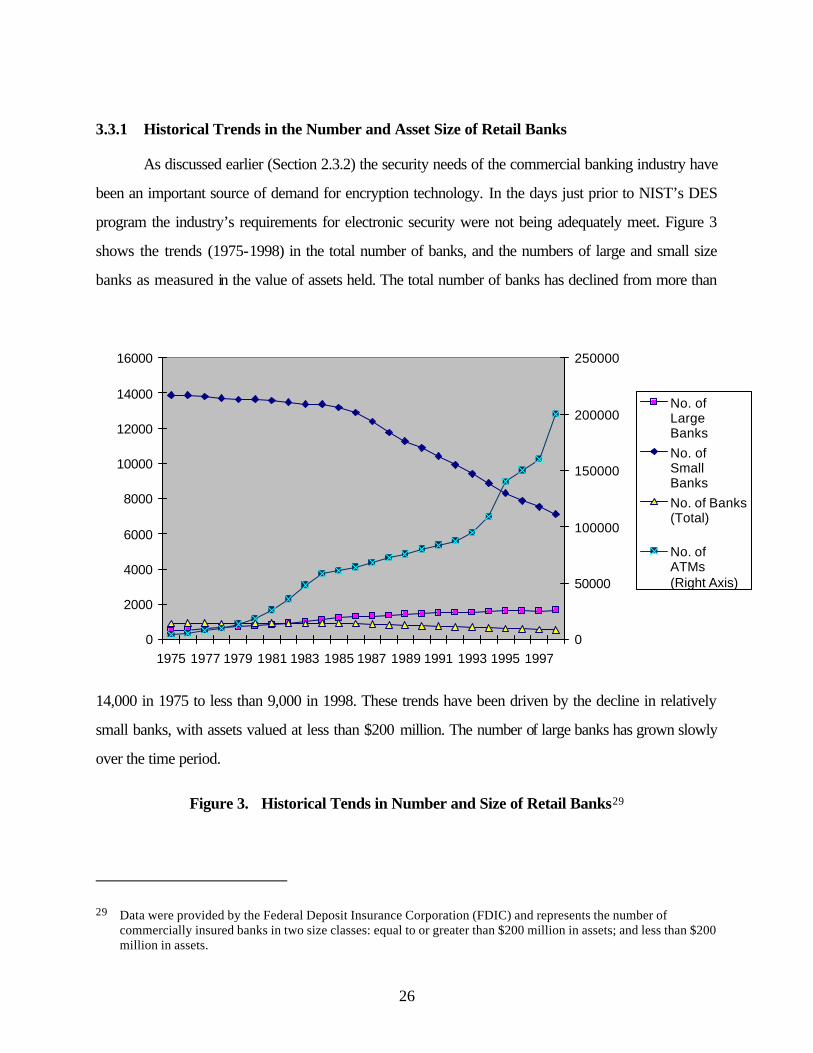
3.3.1 Historical Trends in the Number and Asset Size of Retail Banks
As discussed earlier (Section 2.3.2) the security needs of the commercial banking industry have
been an important source of demand for encryption technology. In the days just prior to NIST’s DES
program the industry’s requirements for electronic security were not being adequately meet. Figure 3
shows the trends (1975-1998) in the total number of banks, and the numbers of large and small size
banks as measured in the value of assets held. The total number of banks has declined from more than
14,000 in 1975 to less than 9,000 in 1998. These trends have been driven by the decline in relatively
small banks, with assets valued at less than $200 million. The number of large banks has grown slowly
over the time period.
Figure 3. Historical Tends in Number and Size of Retail Banks29
29 Data were provided by the Federal Deposit Insurance Corporation (FDIC) and represents the number of commercially insured banks in two size classes: equal to or greater than $200 million in assets; and less than $200 million in assets.
0
2000
4000
6000
8000
10000
12000
14000
16000
1975 1977 1979 1981 1983 1985 1987 1989 1991 1993 1995 19970
50000
100000
150000
200000
250000
No. of LargeBanksNo. of SmallBanksNo. of Banks(Total)
No. ofATMs(Right Axis)
27
According to banking experts, this dramatic transformation has been caused primarily by two
overriding factors: regulatory change and technological innovation. The growth and development of
electronic funds transfer has been an important aspect of technological innovation in the banking
industry.30
3.3.2 Major Forms of Electronic Transactions in Retail Banking
To a large extent, the efficiency of transactions in a market economy is determined by the
efficiency of the payments system. Payment services are not cheap. According to experts, five percent
or more of the value of an average consumer's purchase goes to payment costs while the total cost of a
country's payment system may account for about three percent of the value of its GDP. Electronic
payments usually cost only one-third to one-half that of paper-based transactions, substantial savings in
social costs can be realized in shifting from paper to electronic payments.31
The U.S. payments systems is comprised of multiple forms of payment: cash and checks; credit
cards and debit cards; wire transfers and Automated Clearing House (ACH) funds transfers, and, most
recently, e-money. All forms of payment have been significantly affected by electronic technologies,
including encryption technologies. Cash and checks are the dominant forms of payment in the U.S.
While cash is non-electronic, the dispensing of cash by automated teller machines (ATMs) has
increased dramatically. The total number of ATM transactions more than doubled from 1989 to 1999
and the total number of ATM terminals tripled over the same time period.32 ATM transactions rely on
an extensive communications system that has long included encryption technology as a crucial
component. As discussed earlier (Section 2.3.2) a major impetus for commercial encryption
technologies was the enabling of ATM transactions.
30 A. Berger, et al, “The Transformation of the U.S. Banking Industry: What a Long, Strange Trip It’s Been,” Brookings Papers on Economic Activity, Vol. 2, 1995, pp. 55-218.
31 D. Hancock and D. Humphrey, “Payment Transactions, Instruments, and Systems: A Survey,” Journal of Banking and Finance, Vol. 21, No. 11-12, December 1997, pp. 1573-1624.
32 S. Weiner, “Electronic Payments in the U.S. Economy: An Overview,” Economic Review, 4th Quarter 1999, Federal Reserve Bank of Kansas City. www.kc.frb.org.
28
Paper checks are another important form of payment for the U.S. economy. In terms of the
number of transactions, checks are the most important form of non-cash payment. In 1997, 66 billion
checks were written in the U.S., accounting for 72 percent of the total number of non-cash transactions.
While, by definition, checks are not a form of electronic transaction, the clearing and settling of check
transactions—electronic check presentment (ECP)—is increasingly electronic.
Credit cards and debit cards are the most familiar forms of electronic payment. They account
for nearly a quarter of all non-cash transactions in the U.S. There were 17 billion credit card
transactions in 1997. While accounting for only four percent of all non-cash transactions in 1997, debit
card use is growing faster than credit card use. ATM, credit card, and debit card transactions are all
made possible through an elaborate communications network that relies on encryption.
While the vast majority of the number of electronic transactions are conducted through ATMs,
credit cards, and debit cards, in terms of the dollar value of electronic transactions, the U.S. payment
system is dominated by wholesale funds transfer systems. There are two types of funds transfer in the
U.S.—wire transfer and ACH.
Wire transfers are high-value payments made among banks and other financial institutions.
While they account for less than one percent of all non-cash transactions in terms of volume, they
account for almost 90 percent of their dollar value share.
There are two wire transfer networks in the U.S., Fedwire and CHIPS (Clearling House
Interbank Payment System). Fedwire, operated by the Federal Reserve System, is used to settle
interbank transactions. CHIPS is used primarily to settle foreign exchange transactions. CHIPS is
operated by the New York Clearing House Association, a consortium of New York banks. The
average size of a Fedwire transaction is $3 million. The average size of a CHIPS transaction is $6
million. Both Fedwire and CHIPS each transfer more than $1 trillion a day.33
33 “Fedwire Annual Volume and Value Statistics,” February 9, 1999; Clearing House Interbank Payments Company, 1998.
29
While Fedwire and CHIPS are considered “wholesale” funds transfer systems, ACH can be
thought of as the “retail” funds transfer system in the U.S. There are four ACH operators in the U.S.—
the Federal Reserve, Electronic Payments Network, American Clearing House Association, and
VisaNet ACH. ACH transfers average about $3000. ACH network instructions are exchanged among
participating financial institution on behalf of consumers, businesses, and governments to facilitate payroll
deposits (direct deposit transactions), automatic bill payments (e.g., mortgage and utility payments), and
corporate tax payments.
3.4 DES-BASED PRODUCT MANUFACTURERS
3.4.1 Market Entry and Growth
There are two sources of systematic information concerning the structure of the market for
DES-specific products: the FIPS validation list and the U.S. patent system. These sources, in
conjunction with industry interviews, are used to characterize the structure of the market for DES
products and identify important market trends.
Prior to the 1970s, the market for cryptography was virtually non-existent, comprised largely of
classified work for the Department of Defense, the National Security Agency specifically. In the early
1970s, IBM and a few other firms were developing encryption technology for the banking sector. There
is a general consensus that DES was significantly responsible for the expansion of the commercial
encryption market. According to one source involved in IBM’s early commercial encryption efforts,
without DES, even IBM would not have been eager to implement its algorithm.34
Based on interviews with industry representatives active in current and early encryption markets,
NIST’s FIPS validation lists can be used to approximate the patterns of market entry over time. From
1977 to 1994, NIST offered conformance-testing services to encryption hardware manufacturers and
software producers. If products were found to be in conformance with various cryptographic standards,
34 Communication with IBM Corp., June 22, 1999; All About Data Encryption Devices, DataPro, June, 1985; and Data Encryption Devices: Overview, DataPro, March, 1993 provide information concerning the initial sales dates of numerous products.
30
their products are listed as “validated.” In this way, government buyers, in particular, are assured that
their purchases are in compliance with federal purchasing standards. While the conformance testing
services were transferred to the private sector in 1995, NIST still maintains the validation list and it can
be used to approximate the entry of firms (and their products) into the cryptographic market.35
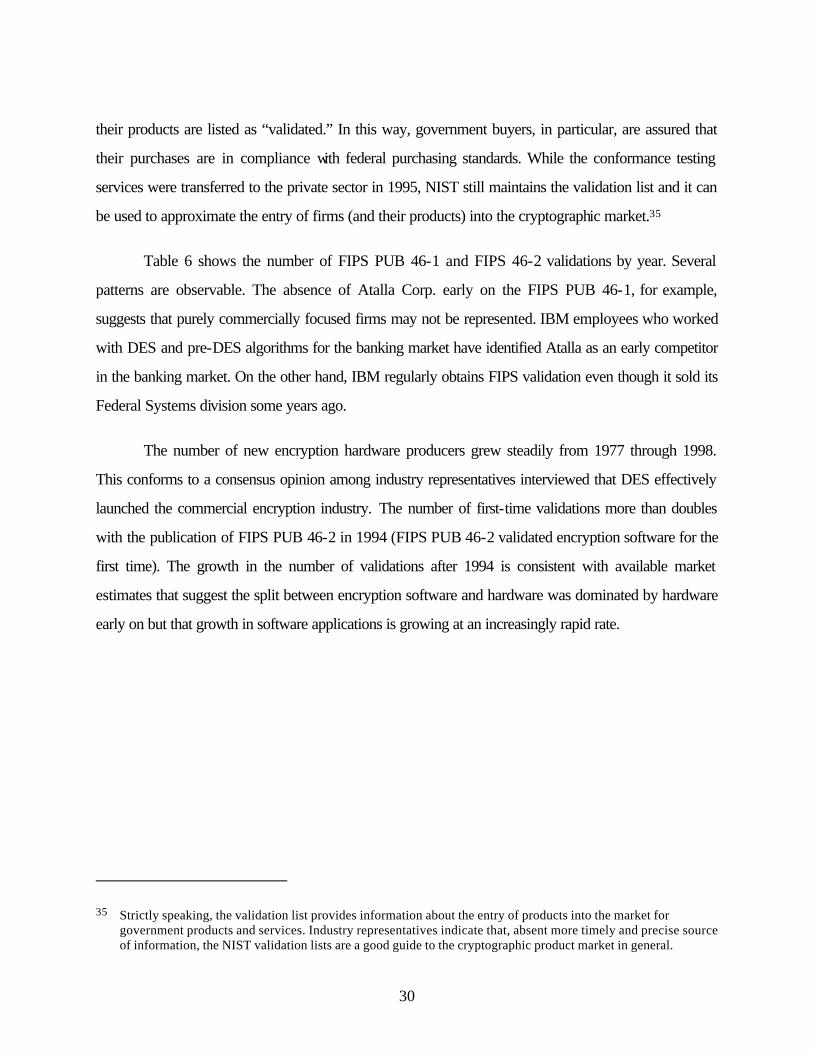
Table 6 shows the number of FIPS PUB 46-1 and FIPS 46-2 validations by year. Several
patterns are observable. The absence of Atalla Corp. early on the FIPS PUB 46-1, for example,
suggests that purely commercially focused firms may not be represented. IBM employees who worked
with DES and pre-DES algorithms for the banking market have identified Atalla as an early competitor
in the banking market. On the other hand, IBM regularly obtains FIPS validation even though it sold its
Federal Systems division some years ago.
The number of new encryption hardware producers grew steadily from 1977 through 1998.
This conforms to a consensus opinion among industry representatives interviewed that DES effectively
launched the commercial encryption industry. The number of first-time validations more than doubles
with the publication of FIPS PUB 46-2 in 1994 (FIPS PUB 46-2 validated encryption software for the
first time). The growth in the number of validations after 1994 is consistent with available market
estimates that suggest the split between encryption software and hardware was dominated by hardware
early on but that growth in software applications is growing at an increasingly rapid rate.
35 Strictly speaking, the validation list provides information about the entry of products into the market for government products and services. Industry representatives indicate that, absent more timely and precise source of information, the NIST validation lists are a good guide to the cryptographic product market in general.
31
Table 6. FIPS PUB 46 Validations by Year (1977-1998)
1st Validation Year (FIPS PUB 46-1)
No. of Validation
s
First Validation by a Company Observations
1977 2 IBM, Collins Communication Chips and cards are being validated by computer and semiconductor firms.
1978 3 Borroughs Corporation, Fairchild Semiconductor, Intel
1979 3 Western Digital Corp, GTE Sylvania
1980 3 UNIVAC, Nixdorf Computer, Racal Computer modules and stand-alone equipment are being introduced
1981 3 Motorola, Advanced Micro Devices
1982 3 TI, Docutel/Olivetti
1983 1 ATT Bell Labs
1984 3 Chase Manhattan Bank, Lexicon Banks and bank- specific devices; earlier entrants validating more complex and sophisticated technologies .
1985 1 General Electric Co Mobile radio application
1986 3 John Holt & Assoc., Frontline Software IBM compatible devices
1987 2 Cylink , Western Digital Corp.
1988
1989
4 Wells Fargo, Arkansas Systems Inc., Secur-Data Systems Inc, The Exchange
Intrusion detection companies enter for the first time; new bank-specific applications
1990 4 ADT, LSI Logic, Micro Card Technologies
1991
7 GEMPLUS CARD Intl, Matsushita, Newnet, Rothenbuhler, Tundra Semiconductor
Foreign entry for the first time (Argentina, Japan, Canada); ISO compliant
1992 5 Datakey Inc., Glenco Engineering, VSLI Technology Triple DES validated; NIST partner (Datakey Inc.) enters
1993 6 Global Technologies, Jones Futurex PC oriented, cryptocard validated
1994 (FIPS PUB 46-2)
12 TASC, Cottonwood Software, GE Mobile Comm, Information Security Corp., Logimens Inc., Northern Telecom (Entrust), Research In Motion, Secure Computing, Timestep Corp., Transcript Intl., Virtual Open Network
June 1994, FIPS PUB 46-2 becomes effective; software predominates; library application; voice encryption between mobile phones;
1995 9 Motorola, Engineering Concepts, Algorithmic Research, Bolker Software Corp., Data Critical, Logix (hardware micro-controller that goes between telephone and wall jack), Vobach Systems
1996 5 Kimchuk, PenWare
1997 19 Chrysalis-ITS, Hitachi Data Systems, Digital Video Express,
Hitachi introduces module that integrates into its mainframe system, like early IBM validations
32
1998 16 Hi/fn, Chrysalis-ITS, Pitney Bowes, Certifax Corp.
Software continues to dominate; validation of ASIC technology as earlier entrants move to more advanced technologies; IBM introduction of multi-encryption algorithms (RSA and DES).
The split between the market for cryptographic hardware and software products is difficult to
gauge. In 1995, the U.S. Department of Commerce said only that “a major portion” of the demand for
encryption products was for hardware and that the demand for software was growing rapidly.36
Regarding DES-specific cryptographic products, of approximately 1,619 encryption products available
worldwide in 1997, DES was employed in 46 percent. 37
Manufacturers of validated products appear to follow a path from less sophisticated to more
sophisticated technology as they progress from first-time validation to multiple validations. IBM’s first
validation in 1977, for example, was for a card used in terminal equipment. Later validations were for
so-called “in-line” or “channel” devices, and the more recent validations are for server encryption
modules.
Over time we also observe the entry of “downstream” producers of DES-based products. Until
the mid-1980s, validations tended to be sought by computer, semiconductor, and communications
firms. By the mid-to-late 1980s, we observe the entry of companies from further downstream, such as
banks (e.g., Chase Manhattan) and intrusion detection firms (e.g., Wells Fargo, ADT). In the early
1990s we first see validation of foreign firms’ products and with the addition of software validation in
1994 (FIPS PUB 46-2) software companies begin to dominate the list of first-time validations.
Finally, over time validated hardware and software increasingly employed non-DES encryption
algorithms. A 1992 survey of the encryption hardware market found 39 percent of models supported
DES-only and an additional 20 percent supported DES plus non-DES. Thirty-five percent supported
36 The 1995 DoC/NSA survey said the long-term market for encryption software “defies any attempt to quantify.” 37 Worldwide Survey of Cryptographic Products, Trusted Information Systems,
http://www.tis.com/research/crypto/crypt_surv.html.
33
non-DES only.38 The increased incidence of DES plus non-DES appears evident in the validation list
over time. Clearly, this mirrors the growth and development of the encryption industry, the consequent
entry of new firms, and the proliferation of encryption products.
U.S. patent records provide a complementary window on the growth and structure of the DES-
specific cryptographic market. As indicated by patenting activity in the broad cryptographic class (class
380), a significant amount of basic and applied cryptographic research is conducted by government
organizations, universities, and industry.39 Conceptually, this research occurs “upstream” from NIST’s
infratechnology function. Obviously there is some correspondence between activity in the product
market and technology development activity, in the sense that patented technology is often implemented
as product modifications and upgrades.40 Patent class 380/29 was established specifically for
cryptographic technologies incorporating DES. The first patent in this class is the IBM patent upon
which DES is based. Since the IBM patent was issued in 1976, an additional 126 patents were
awarded in this subclass through 1997. As shown in Table 7, IBM has the largest share of patents in
this subclass but firms such as AT&T, Borroughs, Motorola, Pitney Bowes, Northern Telecom and
RACAL, which also appear on NIST’s DES validation list, have also engaged in significant patenting
activity.41
38 Data Encryption Devices: Overview, DATAPRO, March, 1993. 39 There were 2,757 patents awarded to organizations in Class 380 between 1973 and February 1998. The growth of
patents awarded in this class over the last 15 years demonstrates the corresponding rise in the number and variety of organizations offering encryption products and services. Applications have grown from just a handful in 1973 to several hundred annually by the early 1990s.
40 See, M. Trajtenberg, Economic Analysis of Product Innovation, Harvard University Press, 1990, 41 We define “significant” to be more than one patent over the time period. A large number of companies and
individuals have received one patent in sub-class 380.29 between 1975 and 1998.
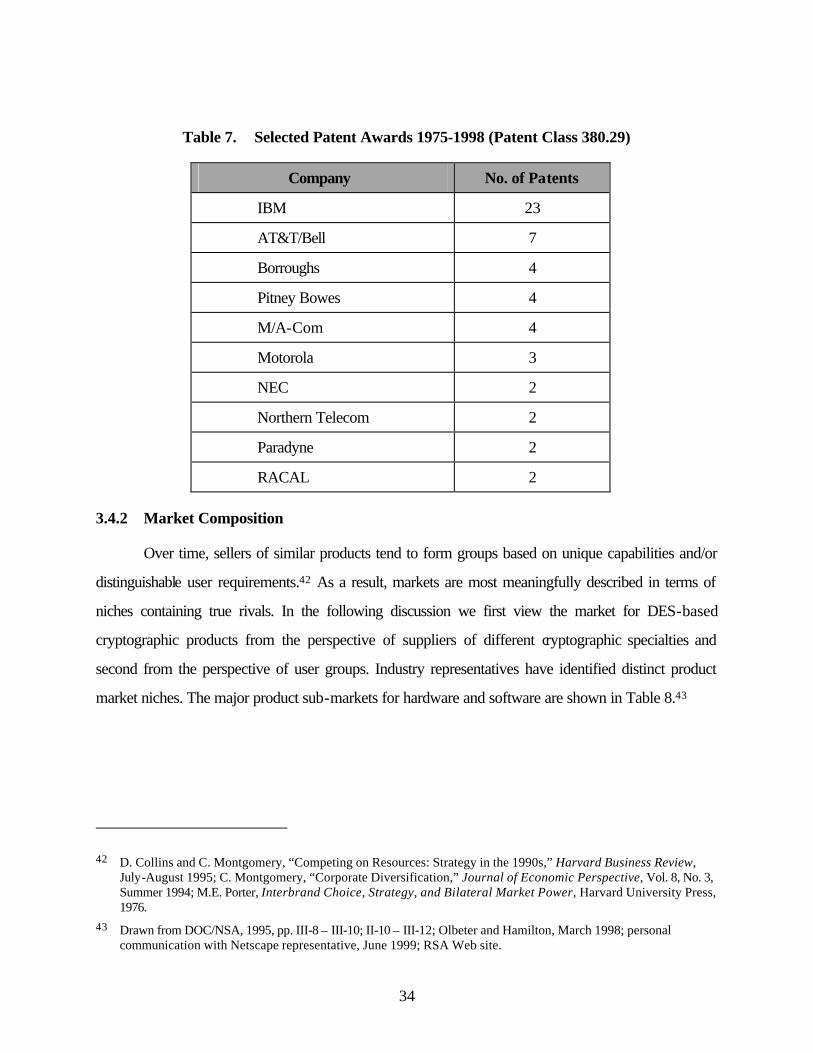
34
Table 7. Selected Patent Awards 1975-1998 (Patent Class 380.29)
Company No. of Patents
IBM 23
AT&T/Bell 7
Borroughs 4
Pitney Bowes 4
M/A-Com 4
Motorola 3
NEC 2
Northern Telecom 2
Paradyne 2
RACAL 2
3.4.2 Market Composition
Over time, sellers of similar products tend to form groups based on unique capabilities and/or
distinguishable user requirements.42 As a result, markets are most meaningfully described in terms of
niches containing true rivals. In the following discussion we first view the market for DES-based
cryptographic products from the perspective of suppliers of different cryptographic specialties and
second from the perspective of user groups. Industry representatives have identified distinct product
market niches. The major product sub-markets for hardware and software are shown in Table 8.43
42 D. Collins and C. Montgomery, “Competing on Resources: Strategy in the 1990s,” Harvard Business Review, July-August 1995; C. Montgomery, “Corporate Diversification,” Journal of Economic Perspective, Vol. 8, No. 3, Summer 1994; M.E. Porter, Interbrand Choice, Strategy, and Bilateral Market Power, Harvard University Press, 1976.
43 Drawn from DOC/NSA, 1995, pp. III-8 – III-10; II-10 – III-12; Olbeter and Hamilton, March 1998; personal communication with Netscape representative, June 1999; RSA Web site.
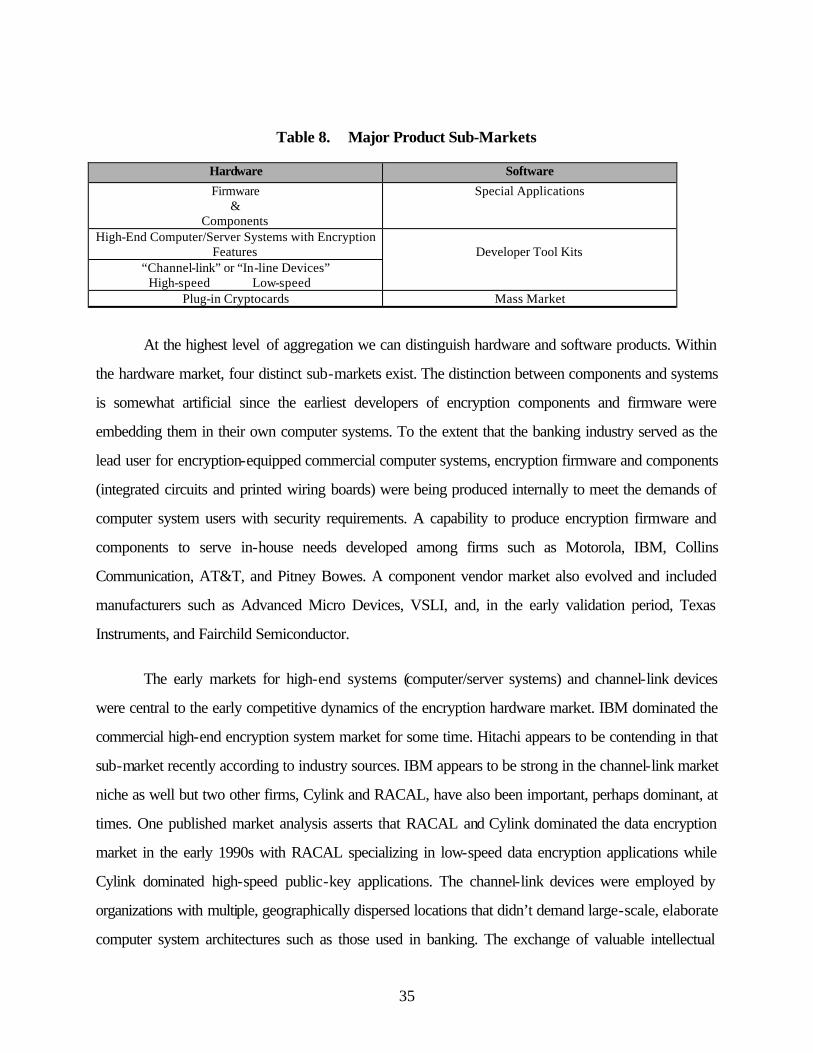
35
Table 8. Major Product Sub-Markets
Hardware Software
Firmware &
Components
Special Applications
High-End Computer/Server Systems with Encryption Features
Developer Tool Kits
“Channel-link” or “In-line Devices” High-speed Low-speed
Plug-in Cryptocards Mass Market
At the highest level of aggregation we can distinguish hardware and software products. Within
the hardware market, four distinct sub-markets exist. The distinction between components and systems
is somewhat artificial since the earliest developers of encryption components and firmware were
embedding them in their own computer systems. To the extent that the banking industry served as the
lead user for encryption-equipped commercial computer systems, encryption firmware and components
(integrated circuits and printed wiring boards) were being produced internally to meet the demands of
computer system users with security requirements. A capability to produce encryption firmware and
components to serve in-house needs developed among firms such as Motorola, IBM, Collins
Communication, AT&T, and Pitney Bowes. A component vendor market also evolved and included
manufacturers such as Advanced Micro Devices, VSLI, and, in the early validation period, Texas
Instruments, and Fairchild Semiconductor.
The early markets for high-end systems (computer/server systems) and channel-link devices
were central to the early competitive dynamics of the encryption hardware market. IBM dominated the
commercial high-end encryption system market for some time. Hitachi appears to be contending in that
sub-market recently according to industry sources. IBM appears to be strong in the channel-link market
niche as well but two other firms, Cylink and RACAL, have also been important, perhaps dominant, at
times. One published market analysis asserts that RACAL and Cylink dominated the data encryption
market in the early 1990s with RACAL specializing in low-speed data encryption applications while
Cylink dominated high-speed public-key applications. The channel-link devices were employed by
organizations with multiple, geographically dispersed locations that didn’t demand large-scale, elaborate
computer system architectures such as those used in banking. The exchange of valuable intellectual
36
property among multiple divisions of the same company is a typical application of channel-link devices.
Small banks, with limited computing capabilities, might also employ channel-link devices for
communicating valuable information in lieu of large-scale computer systems.
The newest sub-market is for “plug-in crypto-cards.” These emerged as a complement to the
personal computer market. Industry sources indicate that this facet of the market has experienced
strong, early expansion in the European market for so-called SMARTCARDS.
The other major facet of the encryption market is software. The technical press and numerous
policy studies have discussed the explosiveness of the software facet of the encryption market.44
Nevertheless, detailed analyses of the supply-side structure of the encryption software market appear
unavailable, according to market experts. One government-sponsored market analysis (published in
1995) concluded that concrete estimates of market shares for security-specific encryption software are
difficult to obtain.45 In 1997, approximately 948 types of encryption products were sold in the U.S.,
459 of which incorporated DES. We estimate that approximately half of these products are software
products.46 Based on the available literature and industry interviews, little can be said about the detailed
structure of the encryption software market, especially the market structure prior to the publication of
FIPS 46-2.
The encryption software market is comprised of three broad sub-markets:
− Security-specific applications
− ToolKits (programmer packages for developing encryption applications)
− Mass-market products.
44 For example, L. Hoffman, et al, Growing Development of Foreign Encryption Products in the Face of U.S. Export Regulations, June 10, 1999, Cyberspace Policy Institute, George Washington University; Olbeter and Hamilton, March 1998; http://www.cosc.georgetown.edu/~denning/crypto/Trends.html#table1; “Increased use of the Internet is a boon to electronic commerce and a danger to internal security,” PRNewswire, March 30, 1999.
45 DOC/NSA, 1995, p. III-10. 46 Olbeter and Hamilton, March 1998, p. 17.
37
3.5 SUMMARY
The example of retail banking services demonstrates that requirements for encryption
technology are growing. In a recent NIST study of the U.S. service sector’s technological needs, retail
banking was typical of other service sector industries in expressing anticipated needs for cryptographic
standards and other technologies that facilitate electronic communication and commerce. Cryptographic
technologies have been fundamental to the growth and expansion of the service sector. While among the
most visible early users of cryptographic technology, the experience of the retail-banking sector is in
other ways typical of service sector consumers and developers of technology.47 Cryptographic
hardware and software vendors and users are increasing in numbers, and DES-based products remain
an important element of those markets.
47 D. Leech, A. Link, J. Scott, The Economics of a Technology-Based Service Sector, NIST Planning Report 98-2, 1997.
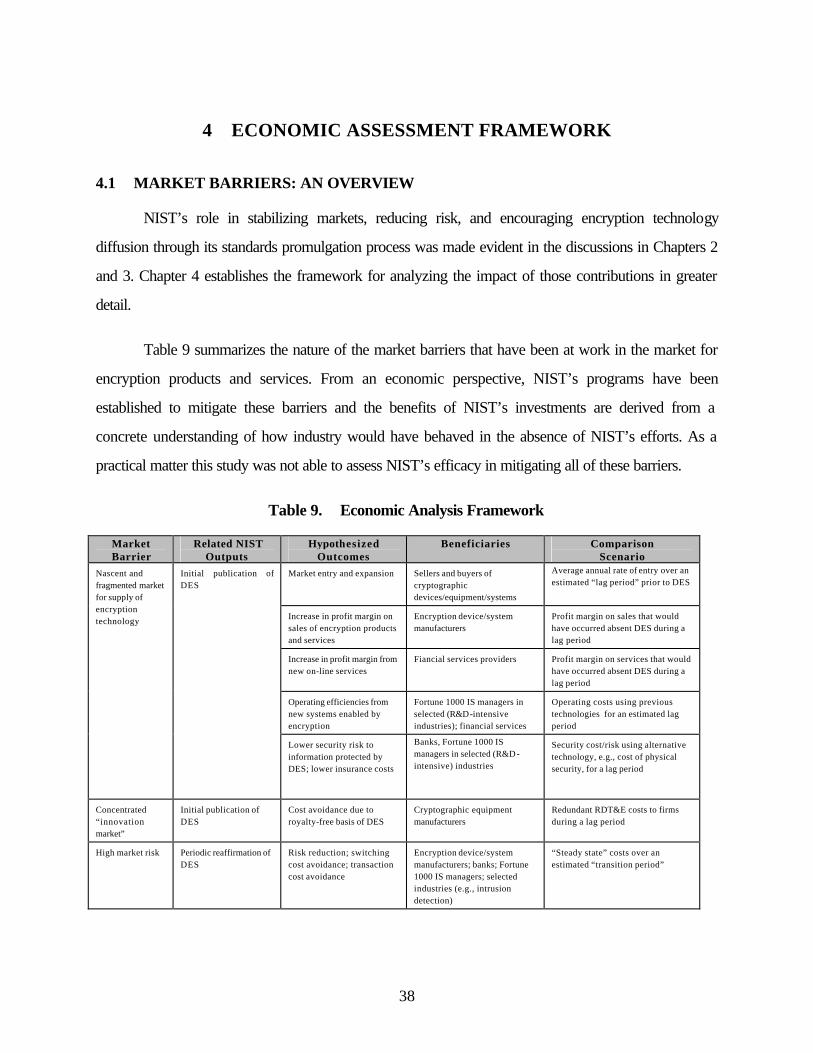
38
4 ECONOMIC ASSESSMENT FRAMEWORK
4.1 MARKET BARRIERS: AN OVERVIEW
NIST’s role in stabilizing markets, reducing risk, and encouraging encryption technology
diffusion through its standards promulgation process was made evident in the discussions in Chapters 2
and 3. Chapter 4 establishes the framework for analyzing the impact of those contributions in greater
detail.
Table 9 summarizes the nature of the market barriers that have been at work in the market for
encryption products and services. From an economic perspective, NIST’s programs have been
established to mitigate these barriers and the benefits of NIST’s investments are derived from a
concrete understanding of how industry would have behaved in the absence of NIST’s efforts. As a
practical matter this study was not able to assess NIST’s efficacy in mitigating all of these barriers.
Table 9. Economic Analysis Framework
Market Barrier
Related NIST Outputs
Hypothesized Outcomes
Beneficiaries Comparison Scenario
Market entry and expansion Sellers and buyers of cryptographic devices/equipment/systems
Average annual rate of entry over an estimated “lag period” prior to DES
Increase in profit margin on sales of encryption products and services
Encryption device/system manufacturers
Profit margin on sales that would have occurred absent DES during a lag period
Increase in profit margin from new on-line services
Fiancial services providers Profit margin on services that would have occurred absent DES during a lag period
Operating efficiencies from new systems enabled by encryption
Fortune 1000 IS managers in selected (R&D-intensive industries); financial services
Operating costs using previous technologies for an estimated lag period
Nascent and fragmented market for supply of encryption technology
Initial publication of DES
Lower security risk to information protected by DES; lower insurance costs
Banks, Fortune 1000 IS managers in selected (R&D -intensive) industries
Security cost/risk using alternative technology, e.g., cost of physical security, for a lag period
Concentrated “innovation market”
Initial publication of DES
Cost avoidance due to royalty-free basis of DES
Cryptographic equipment manufacturers
Redundant RDT&E costs to firms during a lag period
High market risk Periodic reaffirmation of DES
Risk reduction; switching cost avoidance; transaction cost avoidance
Encryption device/system manufacturers; banks; Fortune 1000 IS managers; selected industries (e.g., intrusion detection)
“Steady state” costs over an estimated “transition period”
39
4.2 NIST’S OUTPUTS AND THEIR IMPLICATIONS
NIST helped shape discussions on potential data encryption standards when industry and
government articulated specific needs for such assurances. As described in section 2.4, NIST has
provided two specific services that are the focus of this economic impact assessment:
− Initial publication of DES (FIPS PUB 46)
− Periodic reaffirmation/expansion of DES-based standards (FIPS PUB 46-1 and 46-2)
As a result of these services, the following benefits accrued to industry:
− Market expansion by bringing a technology that had previously been kept from the commercial market by national secrecy procedures into the commercial market
− Risk reduction and cost avoidance for developers of encryption equipment & software
− Operational efficiencies among users of cryptographic equipment made possible by standardization.
Only benefits in the form of operational efficiencies of major users of encryption technology could be
estimated. Based on interviews with industry representative, it is likely that other benefits accrued as
well.
4.2.1 Market Expansion
The publication of DES opened previously classified algorithm research to the public and
resulted in substantial R&D cost avoidance savings to encryption product market entrants, allowing their
entry far earlier than otherwise would have been possible. A former IBM employee who was intimately
familiar with the company’s DES-related efforts has estimated that had NIST not “opened” the IBM
algorithm it would likely have taken potential competitors between six months and two years to develop
comparable products for the market.48
48 This estimate of 6 months to two years focuses on the calendar time it would have taken firms to develop products. This should not be confused with the estimates of the time it could have taken industry to develop a standard for implementing cryptographic standards in the banking industry. The latter is used as the basis for estimating the economic benefits of the DES program to the retail banking industry.
40
In the mid-1970s IBM held a strong position in the market for commercial encryption
hardware. In part this was due to IBM’s cumulative experience in the national security “market.” IBM
had also experienced early success in the banking market and held many encryption-related patents.
Yet the market was perceived as very risky even to IBM. According to some of those who participated
in the IBM’s decision to make its encryption technology available to NIST on a royalty-free basis, the
commercial market for encryption hardware may even have been too risky for IBM at the time.49
Periodic reaffirmation of FIPS Publication 46-1 (and its extension to software in FIPS
Publication 46-2) encouraged firms to compete more on the basis of cost and performance and less in
terms of R&D. In 1992 a leading encryption device manufacturer observed that, despite 16 years of
availability, it had only been in recent years that large corporations began to understand DES value in
protecting information assets, and to make commitments to system-wide security implementation. This,
in turn, led to meaningful competition and affordable prices.50 Another prominent manufacturer argued
that large encryption system expenditures by end users in the banking industry and elsewhere could only
be justified on the basis of the renewal of DES.51
The initial publication of the DES cryptographic algorithm stimulated those few firms active in
the commercial market for cryptographic products and encouraged the entry of new firms. These firms
offered products and services to buyers that represented improved levels of security and lower costs of
operation than previously offered.
4.2.2 Market Risk Mitigation & Cost Avoidance
In addition to stimulating entry and enhancing user awareness of the need for encryption in the
commercial sector, DES also appears to have reduced market risk. During the periodic reaffirmations of
DES, industry representatives observed that DES was responsible for substantially reducing risks to
suppliers in what they called a “fragile market.” A leading encryption expert and businessman, Martin
49 Personal communication with Walter Tuchman, June 28, 1999. 50 Correspondence from RACAL to NIST, November 1992. 51 Correspondence from IBM to NIST, December 1992.
41
Hellman, observed in 1992 that the encryption market had been much slower to “take off” than was
warranted by the extent of the security threats to industry. He felt that the slow take-off was due in part
to user confusion. He concluded that a failure to reaffirm DES would likely have thrown the market
back into confusion and slowed the development of encryption technology.52
Industry associations have also confirmed this effect. During a period of significant technological
change in computing technology, according to the Information Technology Association of America
(ITAA), DES provided a reliable reference point for industry. FIPS PUB 46-1 caused commercial
applications based on DES to grow.53 Similarly, individual cryptographic product manufacturers argued
that failure to reaffirm FIPS 46-1 would have resulted in a major setback to the slowly evolving
implementation of security in the U.S., and that it would have significantly impinged on the introduction
of e-commerce.54
The risk associated with R&D was also affected by the introduction and periodic reaffirmation
of DES. Industry communications with NIST during periodic reviews of FIPS PUB 46 indicated that
DES reduced large development risks to designers of encryption products and services.55
R&D projects are notoriously risky on two fronts. First is the issue of technical risk—the
probability that a particular research effort will come to fruition from a technical standpoint. The second
type of risk is market risk—the probability that sufficient revenues will be captured (appropriated) by
the company to assure a sufficient return on the firm’s investment. According to one published source,
IBM alone spent several million dollars in the development of the encryption technology that preceded
the DES algorithm.56 The publication of the DES algorithm significantly reduced the cost and risk of
52 Correspondence from Martin Hellman to NIST, December 1992. 53 Correspondence from ITAA to NIST, December 1992. 54 Correspondence from Litronic Industries to NIST, November 1992. 55 Correspondence from ADT to NIST, November 1992; correspondence from Beaver Computer Corporation to
NIST, December 1992; and correspondence from IBM to NIST, December 1992. 56 OTA, Defending Secrets, Sharing Data: New Locks and Keys for Electronic Information, pp. 168-169, p. 171.
42
new product development to firms who would otherwise made those investments to enter the
commercial encryption market.
In addition to the initial benefits of DES, associated with R&D cost-avoidance, industry
representatives have argued that, absent the periodic reaffirmation of FIPS 46 (in 1983, 1988, 1993,
and 1997), a plethora of algorithms would have emerged and both interoperability and security would
have suffered. In 1993-94, FIPS 46-1 was significantly enhanced by authorizing the implementation of
DES in software. FIPS 46-1 was replaced by FIPS 46-2.57
A representative of a computer system manufacturer that incorporates DES in its systems
argued that, in the absence of NIST’s re-affirmations of DES, manufacturers themselves would have
been required to promote DES as the standard by developing and circulating white papers explaining
the usefulness and security of DES. If customers were uneasy about continuing to use DES,
manufactures would have been forced to modify products to include alternative algorithms. This, in turn,
would add complexity to systems, requiring interoperability of various encryption schemes. According
to industry representatives, if new hardware implementations of alternative encryption algorithms were
necessitated (that is, if, in the absence of NIST’s FIPS 46-2, implementing DES in software), millions of
dollars would have been required to develop new system architectures and to re-design, test, and
incorporate new capabilities.
4.2.3 Operational Efficiency for Users of DES-Based Encryption
The formal objective of FIPS is to reduce the transaction costs and increase the interoperability
of information technology purchased by the U.S. government. The FIPS often serve as commercial
standards of quality and interoperability as well. Clearly, this has been the case for FIPS 46-1 and 46-
2. Not only have these been used by the commercial sector to assure the quality of their encryption
algorithms but, in addition, they have served as the foundations for other FIPS and for national voluntary
57 Because DES was an open and powerful cryptographic algorithm, DES was routinely implemented in software from 1977 forward. However, prior to the publication of DES 46-2, in 1994, DES-based software was not validated by NIST.
43
standards. Communications between industry and NIST during the reaffirmation process indicate that
DES-based FIPS have indeed served this function. A leading designer and producer of high-end
personal computers, for example, argued that the withdrawal of FIPS would create a situation where
both manufacturers and users of commercial encryption devices would be in a vacuum in trying to make
purchasing decisions without FIPS 46.58
According to ANSI representatives, the financial services industry uses DES extensively and
exclusively for retail transactions, plastic card networks, point-of-sale, and large dollar wholesale
transactions. DES is also called out in many international security standards.59 The banking industry
invested extensively in DES-related systems. When periodic re-affirmations occurred they argued that
the industry would suffer severe injury if DES were not reaffirmed.60
4.3 MARKET SUBSTITUTES FOR DES
Section 4.1 and 4.2 discuss the barriers to industry adoption of an encryption standard and the
benefits associated with the DES program. Section 4.3 addresses the question of alternative
technologies that may have been available at the time of DES’ development and since its promulgation.
From a technical perspective, the alternatives discussed here may not have been perfect functional
substitutes for DES. Nevertheless, examining the alternative technologies provides a sense of the
historical situation that would have been faced by industry decision-makers over the course of the DES
program’s lifetime. There are three important points that emerge from the discussion:
− Few, if any, viable alternatives existed to the IBM algorithm that became DES when the NIST criteria for DES were established
− DES stabilized markets in a manner that encouraged the introduction of new, alternative encryption algorithms that emerged after its promulgation
58 Correspondence from Beaver Computer Corporation to NIST, December 1992. 59 Correspondence from ANSI’s X.9 Committee to NIST, December 1992. 60 Correspondence from First National Bank to NIST, October 1992.
44
− Even after the passage of twenty years, DES remains an important and trusted algorithm in the eyes of industry and occupies an important position in encryption markets.
4.3.1 Early Alternatives to DES
Few, if any, viable alternatives for a robust encryption standard existed in the mid-1970s when
deliberations were made that led to the issue of FIPS PUB 46. Recall that many of the specific
criticisms of the proposed DES dealt with details such as key length and block sizes, not over entirely
different algorithms offering superior benefits. Furthermore, these suggestions did pose potential
technical problems in terms of implementation (slower transmission speeds due to longer key lengths, for
example). Alternative encryption designs were being researched at the time, but had not progressed
sufficiently to be a viable option to the work already completed by IBM that served as the basis for
DES.61
With the development and widespread implementation of accepted encryption standards, means
of assuring the security of sensitive, unclassified data have proliferated. Those methods now include
encryption algorithms imbedded in hardware or software, personal identification and user verification
techniques, access control software and audit trails, and computer architectures and communications
linkage safeguards.
In the context of DES’ development and acceptance, none of the alternatives mentioned above
could be considered true alternatives or substitutes for DES, particularly when it first was adopted in
1977. Many of the technologies developed, such as access controls and network firewalls, deal with
other aspects of overall security and have been developed following DES’ promulgation.62 Continued
improvements in computing power have increased public debate over the continued utility of DES in
61 John B. Kam and George I. Davida, “A Structured Design of Substitution-Permutation Encryption Network,” in Richard A. DeMillo, et al, eds., Foundations of Secure Computation (New York: Academic Press, 1978), pp. 95-113.
62 For a more complete discussion of the relationship of encryption with other elements in information security, see Ravi S. Sandhu and Pierangela Samarati, “Authentication, Access Control and Intrusion Detection,” and Steven Bellovin, “Network and Internet Security,” in Allen B. Tucker, ed., The Computer Science and Engineering Handbook (Boca Raton, FL: CRC Press, 1992), Chapter p. 91, pp. 1929-1948 and Chapter 92, pp. 1949-1961, respectively.
45
assuring the security of sensitive information. This trend, however, was anticipated when NIST first
began considering candidate standards.
4.3.2 RSA
The RSA (Rivest-Shamir-Adelman) algorithm, for example, is a popular algorithm at the heart
of many asymmetric cryptographic systems, but it emerged after DES was adopted.63 The algorithm
was the proprietary algorithm of RSA Data Security, founded in 1982 by the inventors of the RSA
Public Key Cryptosystem. The company asserts that more than 400 million copies of its encryption and
authentication technologies are installed globally. It is embedded in such familiar products as Microsoft
Windows, Netscape Navigator, Intuit’s Quicken and Lotus Notes. Security Dynamics Technologies,
Inc. acquired the company in 1996.64 RSA Data Security holds the licensing rights to algorithms known
as RC2, RC4 and RC5—all variable key length ciphers. RC5 has been proposed as an Internet
security standard.65 While widely utilized, the RSA algorithm does not have the benefits that accrue with
the royalty-free availability of DES.
Encryption algorithms that emerged shortly after the adoption of DES were not viewed as totally
acceptable alternatives for a variety of reasons. In some cases, their originators would not agree to
provide them on a royalty-free basis as IBM had in the DES case. The 56-bit length of the DES key
has been viewed as sufficient for virtually all commercial transactions. The longer DES remained a
standard, the more widely diffused it became in government and commercial applications, justifying its
continuation if proposed alternatives failed to meet other criteria. The widespread support for DES was
evident in the 1987-88 reaffirmation of the standard, when 31 of 33 respondents to NIST’s solicitation
63 In addition to providing strong security, RSA is used for digital signatures. The U.S. government opposed adoption of RSA as a digital signature standard out of a concern that its widespread adoption would result in an infrastructure that could not support the easy and convenient distribution of DES keys. Furthermore, the U.S. government sought a standard that would be royalty free and would contribute to reduce system costs for digital signatures. For details, see Kenneth W. Dam and Herbert S. Lin, eds., Cryptography’s Role in Securing the Information Society (Washington, D.C.: National Academy Press, 1996), pp. 226-228.
64 http://www.rsa.com/ 65 Dam and Lin, eds., Cryptography’s Role in Securing the Information Society, p. 229.
46
for comments endorsed its continuation (one respondent neither opposed nor endorsed its continuation;
the other proposed minor modifications).66
4.3.3 Foreign Encryption Standards
Foreign encryption standards also are emerging as significant players in global encryption
markets. For example, IDEA (International Data Encryption Algorithm), a block cipher developed by
the Swiss Federal Institute of Technology (ETH) in Zurich is implemented in the PGP (“Pretty Good
Privacy”) application software, one of the most widely used e-mail security systems on the Internet
today.67 The patent rights to IDEA are held by Ascom Systec AG, a Swiss firm.68 IDEA is a
symmetrical block cipher algorithm with a 64-bit block length and a 128-bit key (twice as long as for
DES). It is implemented in a VLSI chip that has a ciphering capacity that Ascom Systec touts as
“clearly [exceeding] even the best DES chips.”69 IDEA has been entered into the ISO/IEC register for
encryption algorithms.
Even though IDEA has been offered as an alternative to DES, it has not been available until
recently. The inventors of the algorithm did not file for patent protection until January 1992, almost
fifteen years after DES was implemented formally as a U.S. government standard.70
Many firms continue developing and supporting products and services based on multiple
encryption standards. These include DES, RSA and foreign standards such as GDSES (Gretacoder
Data Systems Encryption Standard). There are several reasons for this. First is that different standards
may be appropriate for different commercial or government markets. Many companies feel, for
example, that since DES has been accepted by NIST and ANSI, it has emerged as the accepted
encryption algorithm for commercial and non-classified government applications in the U.S. as well as
66 Smid and Branstad, “The Data Encryption Standard: Past and Future,” pp. 556-557. 67 Dam and Lin, eds., Cryptography’s Role in Securing the Information Society, p. 164. 68 Dam and Lin, eds., Cryptography’s Role in Securing the Information Society, p. 229. 69 http://www.ascom.ch/infosec/idea.html 70 Massey, et. al., U.S. Patent #5,214,703, issued May 25, 1993.
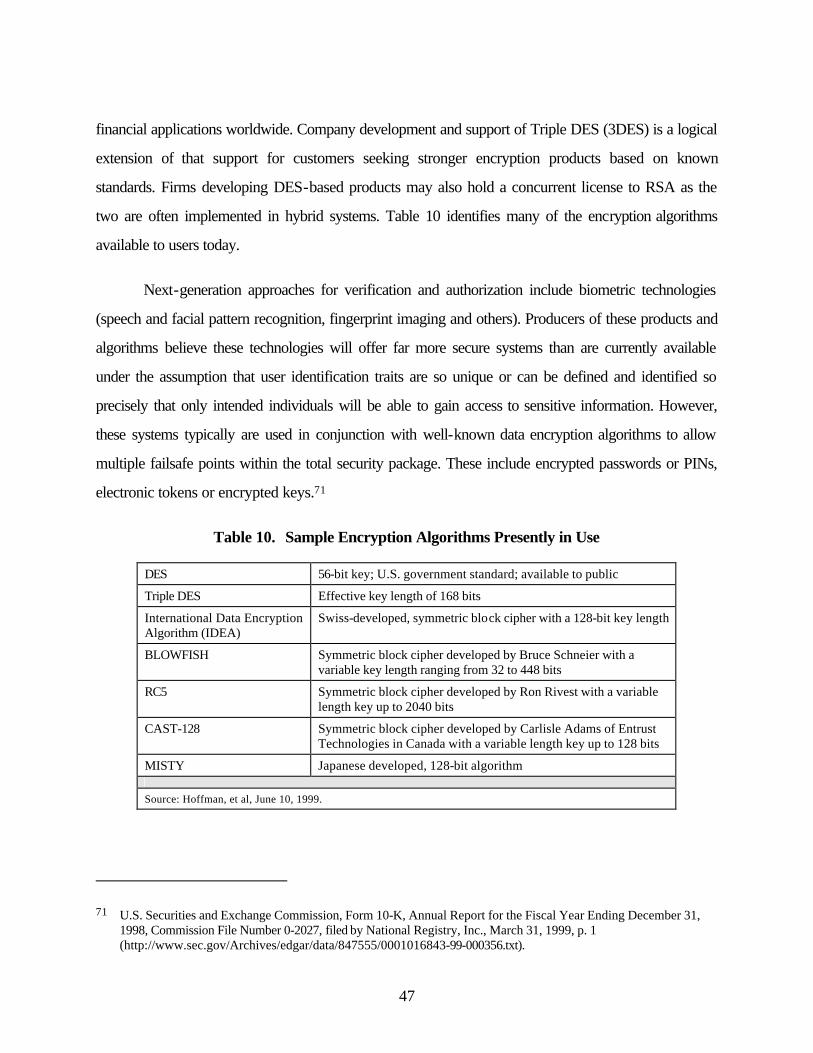
47
financial applications worldwide. Company development and support of Triple DES (3DES) is a logical
extension of that support for customers seeking stronger encryption products based on known
standards. Firms developing DES-based products may also hold a concurrent license to RSA as the
two are often implemented in hybrid systems. Table 10 identifies many of the encryption algorithms
available to users today.
Next-generation approaches for verification and authorization include biometric technologies
(speech and facial pattern recognition, fingerprint imaging and others). Producers of these products and
algorithms believe these technologies will offer far more secure systems than are currently available
under the assumption that user identification traits are so unique or can be defined and identified so
precisely that only intended individuals will be able to gain access to sensitive information. However,
these systems typically are used in conjunction with well-known data encryption algorithms to allow
multiple failsafe points within the total security package. These include encrypted passwords or PINs,
electronic tokens or encrypted keys.71
Table 10. Sample Encryption Algorithms Presently in Use
DES 56-bit key; U.S. government standard; available to public
Triple DES Effective key length of 168 bits
International Data Encryption Algorithm (IDEA)
Swiss-developed, symmetric block cipher with a 128-bit key length
BLOWFISH Symmetric block cipher developed by Bruce Schneier with a variable key length ranging from 32 to 448 bits
RC5 Symmetric block cipher developed by Ron Rivest with a variable length key up to 2040 bits
CAST-128 Symmetric block cipher developed by Carlisle Adams of Entrust Technologies in Canada with a variable length key up to 128 bits
MISTY Japanese developed, 128-bit algorithm
Source: Hoffman, et al, June 10, 1999.
71 U.S. Securities and Exchange Commission, Form 10-K, Annual Report for the Fiscal Year Ending December 31, 1998, Commission File Number 0-2027, filed by National Registry, Inc., March 31, 1999, p. 1 (http://www.sec.gov/Archives/edgar/data/847555/0001016843-99-000356.txt).
48
4.3.4 Next-Generation Security Alternatives
As noted earlier, these developments should be kept in appropriate historical context.
Standards drafters in the mid-1960s recognized at the time that a new data encryption standard would
have a fixed lifetime due to rising computing power. Eventually, lower cost and greater computational
power would make a standard obsolete at some point. However, DES is not an example of a single
approach emerging from a group of competing alternatives to become an imposed or de facto standard.
While specifics surrounding the standard were debated (contributing to its reliability), there was no
“Beta” that lost out to the DES “VHS” due to factors unrelated to technological superiority. As markets
for cryptographic products evolved, users faced more choices so the economic benefits of DES can be
expected to diminish in downstream markets among firms that opted for alternatives to DES from the
start; switched from DES-based to alternative systems; or used DES as a complement to non-DES
cryptographic systems, such as public key systems. As discussed above, however, re-affirmations of
DES continued to supply benefits to the large groups of beneficiaries that continued to rely upon DES.
4.4 COMPARISON SCENARIO
Evaluations of program costs and benefits must answer the question, “Compared to what?” To
assess the value of NIST programs to society, a counterfactual hypothesis is formulated which poses the
question of how, hypothetically, industry would have solved the technical and economic problems
addressed by NIST’s DES program, if NIST had not provided the services or products that it did.72
Two comparison scenarios were formulated. The first focused on two aspects of industry dynamics:
hypothetical research, development, testing, and evaluation (RDT&E) costs that would have been
incurred by encryption hardware manufactures and users had NIST not developed and diffused DES;
72 It has been argued that this “counterfactual approach” to assessing NIST program benefits is the preferred approach to assessing the economic role of government investments. (See A. Link and J. Scott, Public Accountability: Evaluating Technology-Based Institutions, Kluwer Academic Publishers, 1998.) Others argue that this approach is only used when a time series of industry performance that directly reveals the impact of the “intervention” (i.e., “before” and “after” performance trends) is not available. (See, G. Tassey, “Lessons Learned about the Methodology of Economic Impact Studies: The NIST Experience”, Evaluation and Program Planning 22 (1999), pp. 113-119.)
49
and calendar time saved in organizing and implementing a private sector encryption standard in the
absence of NIST’s efforts.
The second comparison scenario focused on the DES re-affirmation process. This scenario
posited switching costs, transaction costs, process costs, and, potentially, RDT&E costs that could have
been borne by encryption hardware and software manufacturers (as well as their users), had NIST not
engaged in the process of re-affirming DES in FIPS 46-1 and 46-2.
50
5 SURVEY FINDINGS
5.1 INTRODUCTION
The survey’s developed for this project distinguished two time periods. The first time period
focused on the mid-1970s to the mid-1980s. For this period encryption hardware manufactures and
users, active in the market at the time, were asked to estimate: 1) a hypothetical time interval in which
industry would have established an encryption standard, in the absence of NIST’s effort; 2) company
research, development, test and evaluation costs for those who would have entered or stayed in the
commercial market for encryption hardware and software, absent NIST’s efforts; and 3) costs that
would have been incurred by users (especially transaction costs and service process costs) in the
absence of NIST’s DES program.
The second overlapping time period focused the mid-1980s to the late 1990’s. Over this period
of time NIST evaluated and reaffirmed DES in FIPS 46-1 and 46-2. Manufacturers of encryption
hardware and software were asked to describe the nature, and estimate the costs, of activities that their
firms would have borne had NIST not re-affirmed DES in any of the relevant years (1983, 1988, 1993,
and 1997).
Two survey instruments were developed, one for each time period. Securing responses from a
representative sample of firms dominant in the industry at each time period was essential to the survey’s
success. Due to the small number of firms active in the early commercial market, securing the
participation of the largest firms was especially important for the initial survey. Unfortunately, during pre-
survey testing, companies that were essential to the survey’s success argued that they could not respond
to survey questions. Corporate “memories” were inadequate to provide responses to the key questions
and, due to the survey’s narrow focus on DES-related equipment, any records that might exist were too
aggregated—in terms of system products or product grouping—to prove useful. The industry
representatives contacted were unable to formulate the estimates requested.
51
The second survey pre-tests were positive. A small number of questions were formulated and
tested. In consultation with NIST’s ITL, a target audience was identified and surveyed.73 No useful
responses were received from the second survey despite positive indications during the pre-test period
that the survey questions were reasonable.74
5.2 PUBLISHED SOURCES OF DOWNSTREAM BENEFITS
In lieu of survey data from “upstream” beneficiaries of DES technology, published sources were
identified that allow for an estimate of “downstream” benefits in the retail banking industry.75 In
numerous interviews with representatives of encryption hardware manufacturers and banking industry
representatives, there was wide agreement that DES was critical to the rise and proliferation of
electronic banking practices. Published data, gathered by the Federal Reserve System, allow a unit cost
comparison between physical and electronic banking transactions. Our counterfactual hypothesis is that
without a guarantee of security, electronic transactions that have become an increasingly important part
of retail banking would not have taken place at the levels that they did. Rather, the majority of electronic
transactions would have continued to be paper-based.
Informal interviews with encryption industry and financial industry representatives indicate that in
the hypothetical absence of NIST’s DES initiative, industry would have established an encryption
standard at a later date. Representatives of the financial sector believe that industry pressures demanded
such a standard, and the industry would have organized itself to reach a consensus on such a standard.
The time saved in bringing secure financial transactions to the financial sector by NIST’s DES initiative
has been estimated between 6 months and six years. This time lag would have occurred between 1977
73 Survey population for the second survey consisted of ~ 45 individuals representing ~40 companies (or company divisions). The companies were identified from a listing maintained by NIST of manufacturers who recently received FIPS-140 validation for their companies’ cryptographic modules.
74 We hypothesize that two factors account for poor response rates on both surveys. First, industry representatives tend to be very focused on present and future issues. The DES survey focused on the past, even though the second survey focused on the recent past. Second, we suspect that personnel turnover in computer hardware and software firms generally, and encryption hardware and software firms in particular, may be very rapid, making “historical memory” especially hard to access.
52
and 1982 when DES was first being adopted by industry. Thus, social benefits accruing to the financial
sector from the early adoption of DES technology in the lag period can be attributed directly to NIST.
Since 1957, the Federal Reserve System has managed the Functional Cost and Profit Analysis
(FCA) Program, a survey and analysis of commercial banks and credit unions.76 The FCA provides
analysis of income and cost data, by product, product line, and other banking areas, and compares
these data within each institution from year to year and with groups of other institutions on an annual
basis. According to a recent National Average Report:77
Cost accounting for financial institutions is not an exact science. Because of the differences in methodologies and automation, it can be very difficult to compare with confidence one institution’s costs to those of another, and at times impractical to compare year-to-year results within an individual institution. By presenting a standard approach, FCA helps ease this problem.
The FCA is performed separately for commercial banks and credit unions. Because the cost of
financial products and services is strongly affected by the scale of operations, the FCA program
provides separate results for large (assets > $200 million) and small (assets < $200 million)
institutions.78 The primary purpose of the FCA is to assess the profitability of individual banking
services. In the vernacular of the FCA, these services are referred to as “products.” Products, in turn,
are aggregated into “product lines.” Product lines and their product components are presented in
Appendix B.
The product line called “demand deposit accounts” is the exclusive focus of our analysis. Within
this product line, two basic types of processes occur: deposits and withdrawals. The processing costs of
75 Unless otherwise specified, the term “retail banking industry” refers to federally insured retail banks and credit unions.
76 Though the name of the Functional Cost Analysis Report changed to the National Average Report, in the mid-to-late 1990s, it is still widely referred to by it’s former title.
77 National Average Report, 1998 Commercial Bank Product Line Comparison, Federal Reserve Banks, 1999. 78 Bauer, P. W., and D. Hancock, 1995, “Scale Economies and Technical Change in the Federal Reserve Automated
Clearinghouse Payment Processing,” Federal Reserve Bank of Cleveland Economic Review, Vol. 31, Third Quarter, pp. 14-29, 1995; Bauer, P. W., and G. D. Ferrier, “Scale Economies, Cost Efficiencies, and Technological Change in Federal Reserve Payments Processing,” Journal of Money, Credit and Banking, Vol. 28, November, Part II, pp.1004-1039, 1996.
53
deposits and withdrawals differ considerably. Beginning in 1997, the FCA surveys began to distinguish
the volume of electronic and non-electronics transactions (deposits and withdrawals) and estimate their
per-transaction costs (referred to in FCA documents as “item costs”) according to a standard, full cost
accounting method.79 In addition to item cost data, the FCA also reports on electronic cost centers
(costs associated with the processing of ATM, EFT, and ACH transactions) and the allocation of these
costs to product lines.80 These data are sufficient to estimate the numbers of electronic and non-
electronic demand deposits and the processing cost differences between them. According to specialists
in banking economics, the FCA is the only published source of per-item costs of transactions that
distinguishes between electronic and non-electronic transactions.
79 By definition, electronic deposits include EFT and ACH transactions but exclude ATM transactions. Electronic withdrawals include EFT, ACH, and ATM transactions.
80 More than 90 percent of electronic cost center costs are allocated to the demand deposits product line.
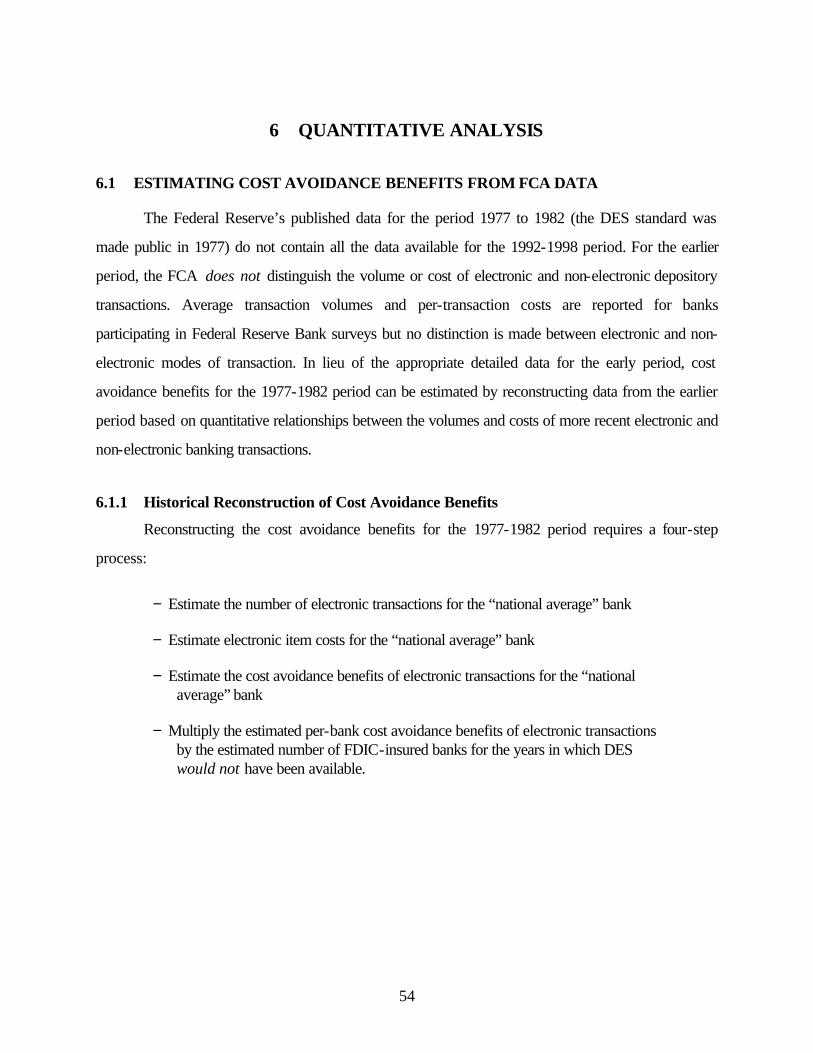
54
6 QUANTITATIVE ANALYSIS
6.1 ESTIMATING COST AVOIDANCE BENEFITS FROM FCA DATA
The Federal Reserve’s published data for the period 1977 to 1982 (the DES standard was
made public in 1977) do not contain all the data available for the 1992-1998 period. For the earlier
period, the FCA does not distinguish the volume or cost of electronic and non-electronic depository
transactions. Average transaction volumes and per-transaction costs are reported for banks
participating in Federal Reserve Bank surveys but no distinction is made between electronic and non-
electronic modes of transaction. In lieu of the appropriate detailed data for the early period, cost
avoidance benefits for the 1977-1982 period can be estimated by reconstructing data from the earlier
period based on quantitative relationships between the volumes and costs of more recent electronic and
non-electronic banking transactions.
6.1.1 Historical Reconstruction of Cost Avoidance Benefits
Reconstructing the cost avoidance benefits for the 1977-1982 period requires a four-step
process:
− Estimate the number of electronic transactions for the “national average” bank
− Estimate electronic item costs for the “national average” bank
− Estimate the cost avoidance benefits of electronic transactions for the “national average” bank
− Multiply the estimated per-bank cost avoidance benefits of electronic transactions by the estimated number of FDIC-insured banks for the years in which DES would not have been available.
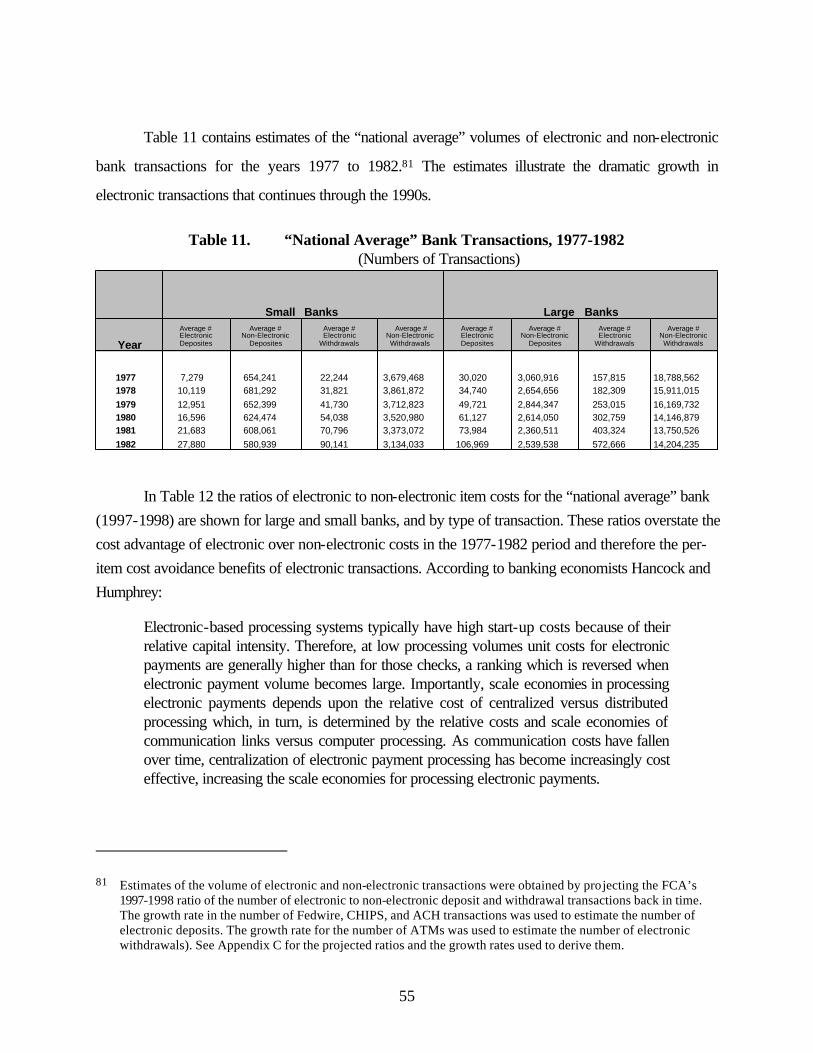
55
Table 11 contains estimates of the “national average” volumes of electronic and non-electronic
bank transactions for the years 1977 to 1982.81 The estimates illustrate the dramatic growth in
electronic transactions that continues through the 1990s.
Table 11. “National Average” Bank Transactions, 1977-1982 (Numbers of Transactions)
Small Banks Large Banks
Year
Average #ElectronicDeposites
Average #Non-Electronic
Deposites
Average #Electronic
Withdrawals
Average #Non-ElectronicWithdrawals
Average #ElectronicDeposites
Average #Non-Electronic
Deposites
Average #Electronic
Withdrawals
Average #Non-ElectronicWithdrawals
1977 7,279 654,241 22,244 3,679,468 30,020 3,060,916 157,815 18,788,5621978 10,119 681,292 31,821 3,861,872 34,740 2,654,656 182,309 15,911,0151979 12,951 652,399 41,730 3,712,823 49,721 2,844,347 253,015 16,169,7321980 16,596 624,474 54,038 3,520,980 61,127 2,614,050 302,759 14,146,8791981 21,683 608,061 70,796 3,373,072 73,984 2,360,511 403,324 13,750,5261982 27,880 580,939 90,141 3,134,033 106,969 2,539,538 572,666 14,204,235
In Table 12 the ratios of electronic to non-electronic item costs for the “national average” bank (1997-1998) are shown for large and small banks, and by type of transaction. These ratios overstate the cost advantage of electronic over non-electronic costs in the 1977-1982 period and therefore the per-item cost avoidance benefits of electronic transactions. According to banking economists Hancock and Humphrey:
Electronic-based processing systems typically have high start-up costs because of their relative capital intensity. Therefore, at low processing volumes unit costs for electronic payments are generally higher than for those checks, a ranking which is reversed when electronic payment volume becomes large. Importantly, scale economies in processing electronic payments depends upon the relative cost of centralized versus distributed processing which, in turn, is determined by the relative costs and scale economies of communication links versus computer processing. As communication costs have fallen over time, centralization of electronic payment processing has become increasingly cost effective, increasing the scale economies for processing electronic payments.
81 Estimates of the volume of electronic and non-electronic transactions were obtained by projecting the FCA’s 1997-1998 ratio of the number of electronic to non-electronic deposit and withdrawal transactions back in time. The growth rate in the number of Fedwire, CHIPS, and ACH transactions was used to estimate the number of electronic deposits. The growth rate for the number of ATMs was used to estimate the number of electronic withdrawals). See Appendix C for the projected ratios and the growth rates used to derive them.
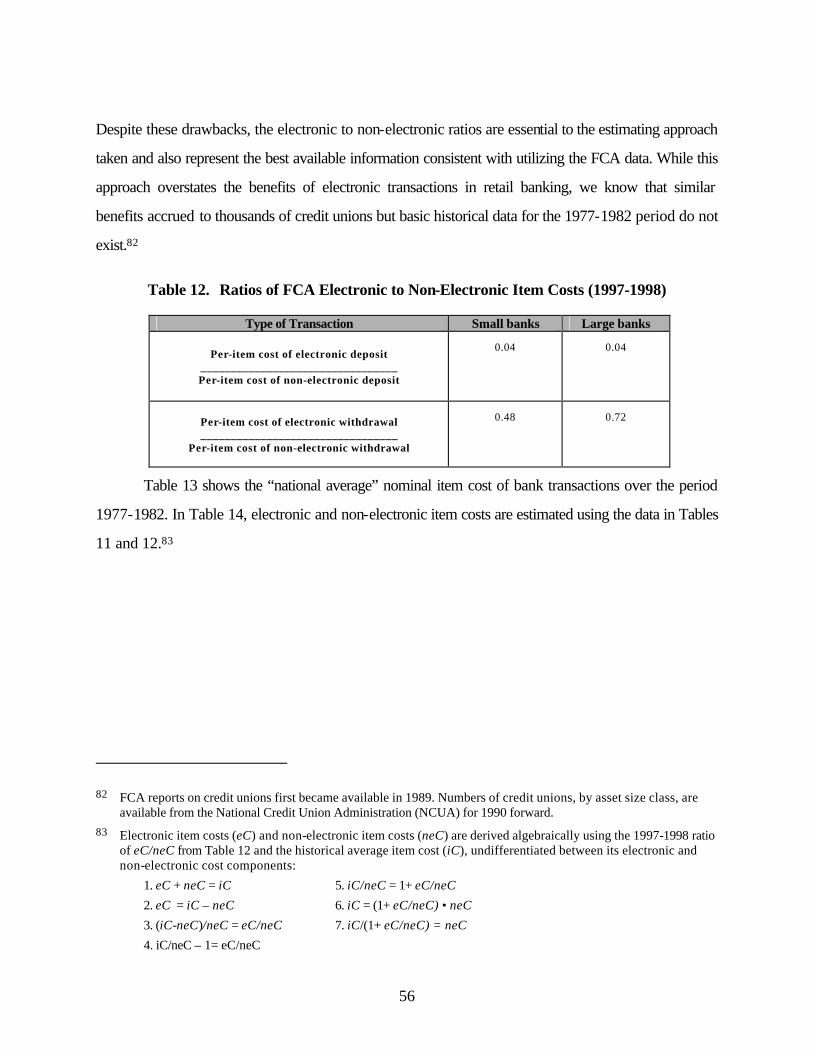
56
Despite these drawbacks, the electronic to non-electronic ratios are essential to the estimating approach
taken and also represent the best available information consistent with utilizing the FCA data. While this
approach overstates the benefits of electronic transactions in retail banking, we know that similar
benefits accrued to thousands of credit unions but basic historical data for the 1977-1982 period do not
exist.82
Table 12. Ratios of FCA Electronic to Non-Electronic Item Costs (1997-1998)
Type of Transaction Small banks Large banks
Per-item cost of electronic deposit _________________________________ Per-item cost of non-electronic deposit
0.04 0.04
Per-item cost of electronic withdrawal _________________________________
Per-item cost of non-electronic withdrawal
0.48 0.72
Table 13 shows the “national average” nominal item cost of bank transactions over the period
1977-1982. In Table 14, electronic and non-electronic item costs are estimated using the data in Tables
11 and 12.83
82 FCA reports on credit unions first became available in 1989. Numbers of credit unions, by asset size class, are available from the National Credit Union Administration (NCUA) for 1990 forward.
83 Electronic item costs (eC) and non-electronic item costs (neC) are derived algebraically using the 1997-1998 ratio of eC/neC from Table 12 and the historical average item cost (iC), undifferentiated between its electronic and non-electronic cost components:
1. eC + neC = iC 5. iC/neC = 1+ eC/neC
2. eC = iC – neC 6. iC = (1+ eC/neC) • neC
3. (iC-neC)/neC = eC/neC 7. iC/(1+ eC/neC) = neC
4. iC/neC – 1= eC/neC
57
Table 13. Average Item Cost of Bank Transactions, 1977-1982 (Nominal Dollars)
Large U.S. Banks Small U.S. Banks
Year
HistoricalItem Cost ($)(Deposits)
HistoricalItem Cost ($)
(Withdrawals)
HistoricalItem Cost ($)(Deposits)
HistoricalItem Cost ($)(Withdrawals)
1977 0.24 0.12 0.18 0.091978 0.22 0.11 0.20 0.101979 0.27 0.13 0.22 0.111980 0.31 0.15 0.24 0.121981 0.31 0.15 0.26 0.121982 0.36 0.15 0.31 0.13
Table 14. Estimated Electronic and Non-Electronic Item Costs (1977-1982) (Nominal Dollars)
Large U.S. Banks Small U.S. Banks
Year
ElectronicItem Cost
(Deposites)
Non-ElectronicItem Cost
(Deposites)
ElectronicItem Cost
(Withdrawals)
Non-ElectronicItem Cost
(Withdrawals)
ElectronicItem Cost
(Deposites)
Non-ElectronicItem Cost
(Deposites)
ElectronicItem Cost
(Withdrawals)
Non-ElectronicItem Cost
(Withdrawals)
1977 0.01 0.23 0.05 0.07 0.01 0.17 0.03 0.061978 0.01 0.21 0.05 0.06 0.01 0.19 0.03 0.061979 0.01 0.26 0.05 0.08 0.01 0.21 0.03 0.071980 0.01 0.30 0.06 0.09 0.01 0.23 0.04 0.081981 0.01 0.30 0.06 0.09 0.01 0.23 0.04 0.081982 0.01 0.30 0.06 0.09 0.01 0.25 0.04 0.08
Net cost avoidance benefits of replacing non-electronic transactions with electronic transactions
are simply the non-electronic item cost that would have been incurred less the cost of the electronic
transactions actually incurred:
itemCAB = neC(1977-1982) - eC(1977-1982)
where itemCAB = per item cost avoidance benefit; neC(1977-1982) = non-electronic cost per item, 1977-
1982, and eC(1977-1982) = electronic cost per item, 1977-1982.
Table 15 shows the estimated per item cost avoidance (in nominal dollars) that accrued to
banks due to their adoption of DES as the basis for secure electronic transactions. The timeframe,
1977-1982, corresponds the maximum gap of 6 years between the formal publication of DES and
when industry representatives hypothesize they would have developed a suitable encryption standard
had NIST not gotten involved.
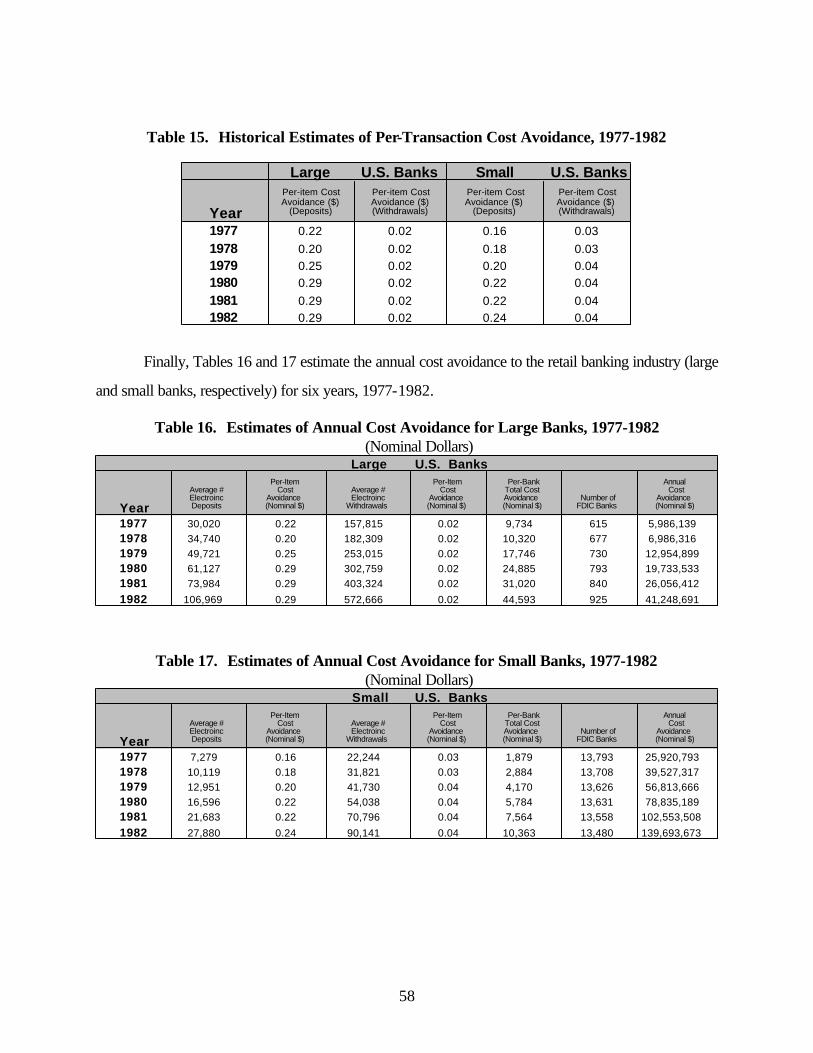
58
Table 15. Historical Estimates of Per-Transaction Cost Avoidance, 1977-1982
Large U.S. Banks Small U.S. Banks
Year
Per-item Cost Avoidance ($)
(Deposits)
Per-item Cost Avoidance ($)(Withdrawals)
Per-item Cost Avoidance ($)
(Deposits)
Per-item Cost Avoidance ($)(Withdrawals)
1977 0.22 0.02 0.16 0.031978 0.20 0.02 0.18 0.031979 0.25 0.02 0.20 0.041980 0.29 0.02 0.22 0.041981 0.29 0.02 0.22 0.041982 0.29 0.02 0.24 0.04
Finally, Tables 16 and 17 estimate the annual cost avoidance to the retail banking industry (large
and small banks, respectively) for six years, 1977-1982.
Table 16. Estimates of Annual Cost Avoidance for Large Banks, 1977-1982 (Nominal Dollars)
Large U.S. Banks
Year
Average #ElectroincDeposits
Per-ItemCost
Avoidance(Nominal $)
Average #Electroinc
Withdrawals
Per-ItemCost
Avoidance(Nominal $)
Per-BankTotal CostAvoidance(Nominal $)
Number ofFDIC Banks
AnnualCost
Avoidance(Nominal $)
1977 30,020 0.22 157,815 0.02 9,734 615 5,986,1391978 34,740 0.20 182,309 0.02 10,320 677 6,986,3161979 49,721 0.25 253,015 0.02 17,746 730 12,954,8991980 61,127 0.29 302,759 0.02 24,885 793 19,733,5331981 73,984 0.29 403,324 0.02 31,020 840 26,056,412
1982 106,969 0.29 572,666 0.02 44,593 925 41,248,691
Table 17. Estimates of Annual Cost Avoidance for Small Banks, 1977-1982
(Nominal Dollars) Small U.S. Banks
Year
Average #ElectroincDeposits
Per-ItemCost
Avoidance(Nominal $)
Average #Electroinc
Withdrawals
Per-ItemCost
Avoidance(Nominal $)
Per-BankTotal CostAvoidance(Nominal $)
Number ofFDIC Banks
AnnualCost
Avoidance(Nominal $)
1977 7,279 0.16 22,244 0.03 1,879 13,793 25,920,7931978 10,119 0.18 31,821 0.03 2,884 13,708 39,527,3171979 12,951 0.20 41,730 0.04 4,170 13,626 56,813,6661980 16,596 0.22 54,038 0.04 5,784 13,631 78,835,1891981 21,683 0.22 70,796 0.04 7,564 13,558 102,553,508
1982 27,880 0.24 90,141 0.04 10,363 13,480 139,693,673
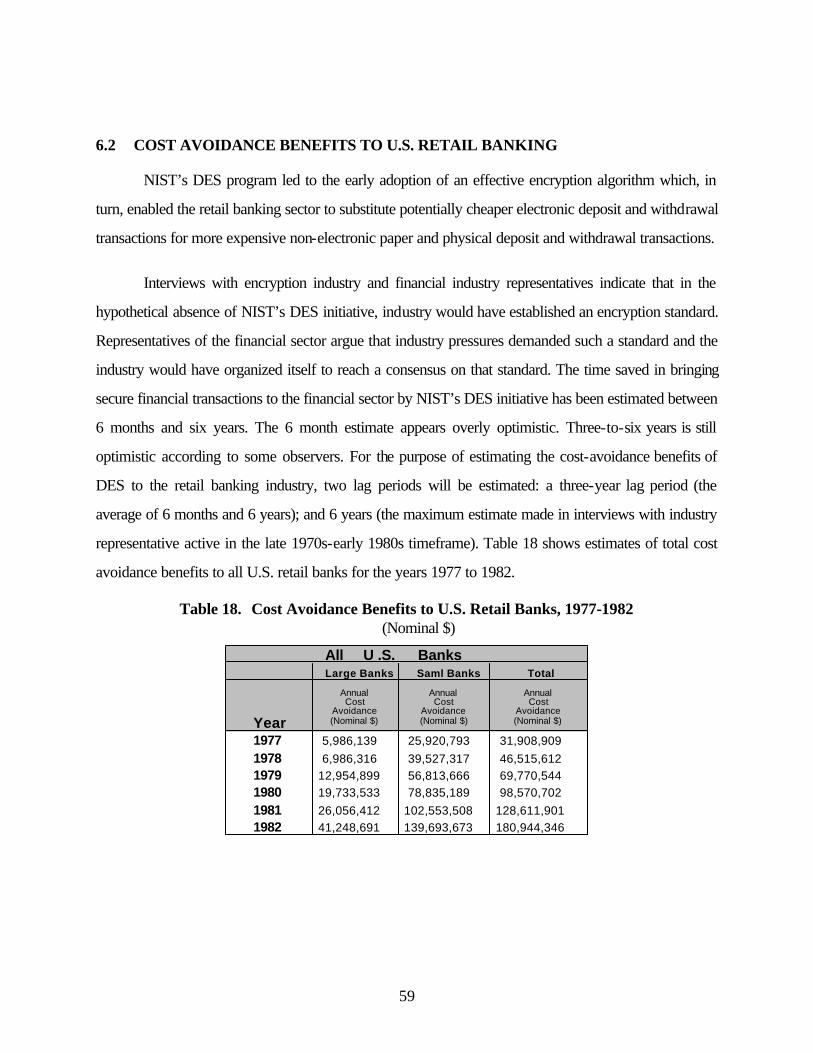
59
6.2 COST AVOIDANCE BENEFITS TO U.S. RETAIL BANKING
NIST’s DES program led to the early adoption of an effective encryption algorithm which, in
turn, enabled the retail banking sector to substitute potentially cheaper electronic deposit and withdrawal
transactions for more expensive non-electronic paper and physical deposit and withdrawal transactions.
Interviews with encryption industry and financial industry representatives indicate that in the
hypothetical absence of NIST’s DES initiative, industry would have established an encryption standard.
Representatives of the financial sector argue that industry pressures demanded such a standard and the
industry would have organized itself to reach a consensus on that standard. The time saved in bringing
secure financial transactions to the financial sector by NIST’s DES initiative has been estimated between
6 months and six years. The 6 month estimate appears overly optimistic. Three-to-six years is still
optimistic according to some observers. For the purpose of estimating the cost-avoidance benefits of
DES to the retail banking industry, two lag periods will be estimated: a three-year lag period (the
average of 6 months and 6 years); and 6 years (the maximum estimate made in interviews with industry
representative active in the late 1970s-early 1980s timeframe). Table 18 shows estimates of total cost
avoidance benefits to all U.S. retail banks for the years 1977 to 1982.
Table 18. Cost Avoidance Benefits to U.S. Retail Banks, 1977-1982 (Nominal $)
All U .S. BanksLarge Banks Saml Banks Total
Year
AnnualCost
Avoidance(Nominal $)
AnnualCost
Avoidance(Nominal $)
AnnualCost
Avoidance(Nominal $)
1977 5,986,139 25,920,793 31,908,9091978 6,986,316 39,527,317 46,515,6121979 12,954,899 56,813,666 69,770,5441980 19,733,533 78,835,189 98,570,7021981 26,056,412 102,553,508 128,611,9011982 41,248,691 139,693,673 180,944,346
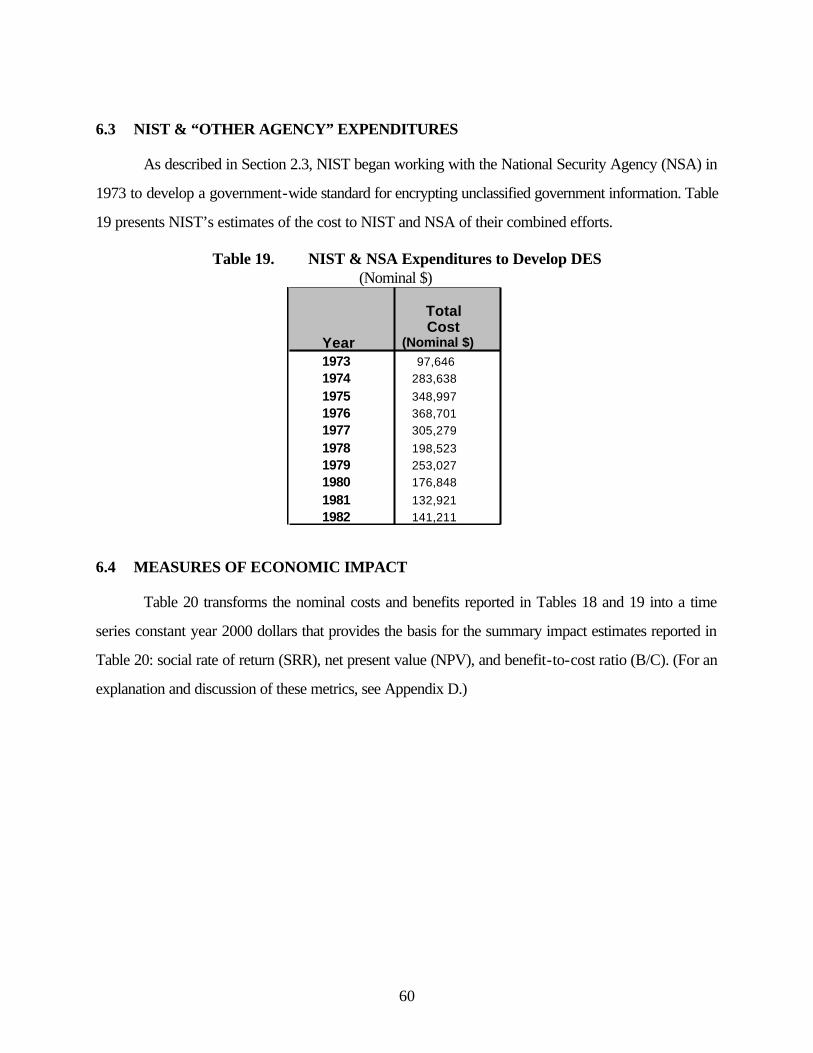
60
6.3 NIST & “OTHER AGENCY” EXPENDITURES
As described in Section 2.3, NIST began working with the National Security Agency (NSA) in
1973 to develop a government-wide standard for encrypting unclassified government information. Table
19 presents NIST’s estimates of the cost to NIST and NSA of their combined efforts.
Table 19. NIST & NSA Expenditures to Develop DES (Nominal $)
Year
Total Cost
(Nominal $)1973 97,6461974 283,6381975 348,9971976 368,7011977 305,2791978 198,5231979 253,0271980 176,8481981 132,9211982 141,211
6.4 MEASURES OF ECONOMIC IMPACT
Table 20 transforms the nominal costs and benefits reported in Tables 18 and 19 into a time
series constant year 2000 dollars that provides the basis for the summary impact estimates reported in
Table 20: social rate of return (SRR), net present value (NPV), and benefit-to-cost ratio (B/C). (For an
explanation and discussion of these metrics, see Appendix D.)
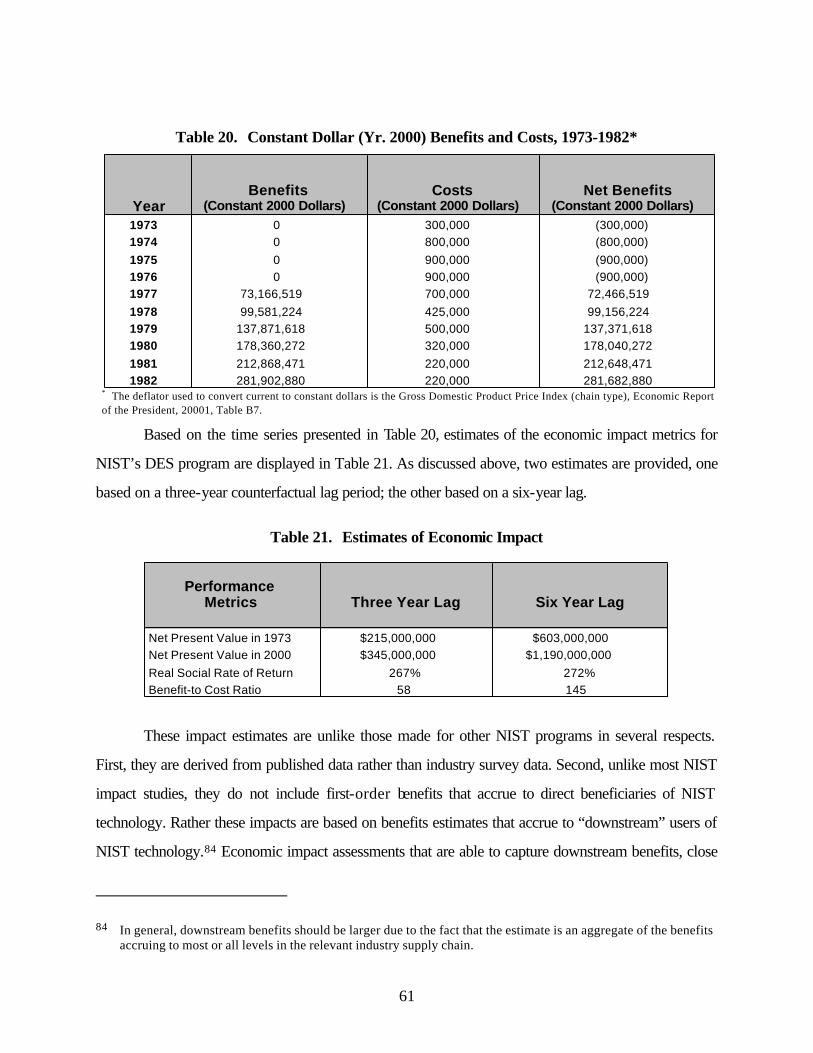
61
Table 20. Constant Dollar (Yr. 2000) Benefits and Costs, 1973-1982*
YearBenefits
(Constant 2000 Dollars)Costs
(Constant 2000 Dollars)Net Benefits
(Constant 2000 Dollars)1973 0 300,000 (300,000)1974 0 800,000 (800,000)1975 0 900,000 (900,000)1976 0 900,000 (900,000)1977 73,166,519 700,000 72,466,5191978 99,581,224 425,000 99,156,2241979 137,871,618 500,000 137,371,6181980 178,360,272 320,000 178,040,2721981 212,868,471 220,000 212,648,4711982 281,902,880 220,000 281,682,880
* The deflator used to convert current to constant dollars is the Gross Domestic Product Price Index (chain type), Economic Report of the President, 20001, Table B7.
Based on the time series presented in Table 20, estimates of the economic impact metrics for
NIST’s DES program are displayed in Table 21. As discussed above, two estimates are provided, one
based on a three-year counterfactual lag period; the other based on a six-year lag.
Table 21. Estimates of Economic Impact
PerformanceMetrics Three Year Lag Six Year Lag
Net Present Value in 1973 $215,000,000 $603,000,000Net Present Value in 2000 $345,000,000 $1,190,000,000Real Social Rate of Return 267% 272%Benefit-to Cost Ratio 58 145
These impact estimates are unlike those made for other NIST programs in several respects.
First, they are derived from published data rather than industry survey data. Second, unlike most NIST
impact studies, they do not include first-order benefits that accrue to direct beneficiaries of NIST
technology. Rather these impacts are based on benefits estimates that accrue to “downstream” users of
NIST technology.84 Economic impact assessments that are able to capture downstream benefits, close
84 In general, downstream benefits should be larger due to the fact that the estimate is an aggregate of the benefits accruing to most or all levels in the relevant industry supply chain.
62
to end users will tend to be larger than assessments that concentrate “upstream.” For these reasons, the
impact estimates presented would tend to be optimistic.
Counterbalancing these considerations, the impacts reported in Table 21 understate the impact
of DES on the financial services industry because they do not include benefits that have accrued to
credit unions. If data on credit unions were included in the calculations of economic impact, the
estimates would be considerably larger.
A-1
Appendix A: DES Algorithm—Evolution And Operation85
Security in the Pre-DES World
To appreciate the importance of encryption in today’s commerce, it is necessary to review
conditions prior to the development of the standard as well as the broader role it has today. When
information was submitted to central mainframe computers manually through punch cards, the only
security issue was access to individual mainframes or centralized computing facilities. Security was
provided by limiting access to these facilities/computers through physical means (securing the equipment
behind locked doors). More sophisticated means of assuring security came through issuance of pass
cards with encoded information to allow access to facilities by the holder. Pass cards with electronic
combination keys enhanced security an additional level.
Although dramatic transformations were evident, the market for encryption services and
products was very different from today when NIST first published DES in 1977. The era of mainframe
databanks, punch cards, and steno pools was just winding down. During the 1970s, the computer
industry began to move away from its reliance on mainframes. Minicomputers with prepackaged
software and then personal computers assumed greater importance in information systems. This rise of
stand-alone computing power created a larger, less regulated demand for encryption goods and
services. Needs grew as this large new mass of computers increasingly became networked and
interconnected. LANs, WANs, and bulletin board services became commonplace. The introduction of
the Universal Resource Locator (URL) in 1990 and with it the World Wide Web spawned a revolution
in computer connectivity. The variety and quantity of electronic transactions in this environment
multiplied accordingly.
Various security alternatives were available prior to the adoption of DES but were directed at
different sorts of concerns (mainly the secure transmission of messages carrying sensitive or classified
information). The principles of coded text messages had been understood for decades. Ciphering
systems introduced from the late 1930s through the early- to mid-1940s—including early ciphering
85 Drawn from Applied Cryptography, Bruce Schneier, p. 265-267.
A-2
wheel devices that encrypted and decrypted messages—implemented these techniques. Product
cipher—the successive application of two or more distinctly different kinds of message symbol
transformations—was introduced in the late 1940s.86
The use of remote access terminals linked via communications lines to central computing
facilities or other data banks required security methods and systems to protect data as it was transferred
over these communications lines or networks. Early security for communications was achieved through
stream bit generator sequences or the coding of the electrical signals themselves.87 Electrical signals
could be coded to prevent jamming or unauthorized tapping of a communications channel. These
approaches were not suitable for the emerging computer-based communications needs, however. Such
systems were prohibitively expensive and cumbersome to use. The time required to scramble signals
slows total transaction time unacceptably. Finally, this approach did not necessarily guarantee secure
transactions. Inventors at the time recognized that “there still remains the problem of obtaining a highly
secure system applicable to a data processing environment which is not susceptible to analysis by an
unauthorized individual notwithstanding the fact that the unauthorized person has knowledge of the
structure of the system.”88 Furthermore, ciphers could be revealed by sending carefully structured test
86 The evolution of these innovations can be traced through U.S. Patents awarded during these periods. See, for example, Patents #2,964,856 and #2,984,700, filed March 10, 1941 and September 22, 1944, respectively; and #3,798,359, filed June 30, 1971, p. 1:55~67; 2-11 ~ 17.
87 Stream bit generator sequences substitute part of message with a coded sequence that makes the text impossible to understand without prior knowledge of the stream bit generator sequence (the “key”). Key generators were patented in early 1960s. IBM’s encryption work leading to DES cited such prior art, including #3,250,855 & 3,364,308, filed May 23, 1962 & Jan. 23, 1963, respectively. Several electrical signal anti-jamming patents were filed between 1962-1965.
88 U.S. Patent No. 3,798,359, filed June 30, 1971, p. 2--50~55. A good description of the state of the world in the late 1960s is available through these records:
“At the present state of technology, data processing networks rely on various identification techniques to limit the availability of the network to certain restricted personnel. However, as data communications networks continue to proliferate, it has become … increasingly difficult to limit the number of individuals that are capable of communicating with the central processing and data file equipment within the computer network.” (U.S. Patent No. 3,798,359, filed June 30, 1971, p. 1:39~49).
“…Prior attempts to solve the privacy or secrecy problem have only offered partial solutions. One approach taken in the prior art is to associate with stored segments of data or information a unique combination of binary digits usually referred to as a protection key. Then, whenever this block of data is accessed by a computer instruction it must have a similar protection key in order to execute the operation, and upon a mismatch some check interrupt is recorded. This technique has been incorporated both internal to the central computer operations and within input/output devices of the data store type.” (U.S. Patent No. 3,798,605, filed June 30 1971,
A-3
messages through such systems. “None of the prior art systems have utilized the advantages of a digital
processor and its inherent speed in developing a cryptographic system which produces cipher
particularly useful in a computer system network, and not susceptible to ‘cracking’ notwithstanding the
possibility that the cryptanalyst has knowledge of the structure of the cryptographic device.”89
The use of access cards and identification cards in commercial services (such as ATM cards)
offered enhanced security for “hard-wired” financial transactions. A typical approach was through PIN
(personal identification number) verification by comparing the PIN with a random sequence of numbers
embedded on the card.90 Telecommunications links with remote service centers or ATMs added a layer
of complexity, however. The same fundamental principle existed within large government organizations
where increasing amounts of sensitive information was being accessed remotely. The critical security
consideration at this time was to introduce a method and system of assuring secrecy within the data
processing environment. Furthermore, it was necessary to develop a method by which an unauthorized
user could not gain access by trying possible key combinations through repeated trial and error (made
possible with increased processing speeds and computing power) or through reading ciphertext in a
manner that would reveal information about the key (such as sending a structured test message to reveal
key combinations).
DES Operating Principles
The Data Encryption Standard was the approved symmetric algorithm for protection of sensitive but unclassified information by government agencies. DES is a block cipher that encrypts data in 64-bit blocks. (The key length for DES is 56 bits, typically expressed as a 64-bit number with every eighth bit being ignored.91) The DES algorithm is symmetric? meaning that
p. 1:32~46. An example of this technique is described in U.S. Pat. No. 3,377,624 issued Apr. 9, 1968 and also in U.S. Pat. No. 3,368,207 issued Feb. 6, 1968).
89 U.S. Patent No. 3,798,359, filed June 30, 1971, p. 2-61~69. 90 Patents of this sort were issued in early 1970s. See, for example, U.S. Patent Nos. 3,609,690, issued September
1971, and 3,588,499, issued June 1971. 91 These ignored bits are used for parity checking and are considered the least significant bits of the key.
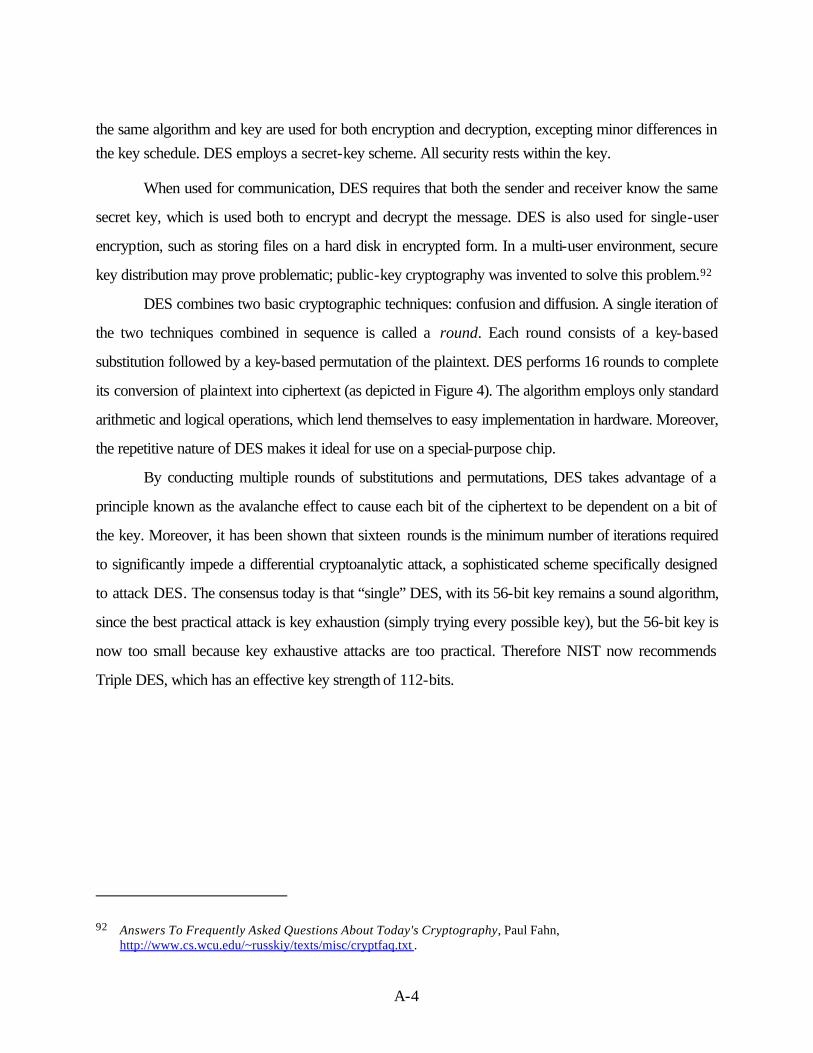
A-4
the same algorithm and key are used for both encryption and decryption, excepting minor differences in the key schedule. DES employs a secret-key scheme. All security rests within the key.
When used for communication, DES requires that both the sender and receiver know the same
secret key, which is used both to encrypt and decrypt the message. DES is also used for single-user
encryption, such as storing files on a hard disk in encrypted form. In a multi-user environment, secure
key distribution may prove problematic; public-key cryptography was invented to solve this problem.92
DES combines two basic cryptographic techniques: confusion and diffusion. A single iteration of
the two techniques combined in sequence is called a round. Each round consists of a key-based
substitution followed by a key-based permutation of the plaintext. DES performs 16 rounds to complete
its conversion of plaintext into ciphertext (as depicted in Figure 4). The algorithm employs only standard
arithmetic and logical operations, which lend themselves to easy implementation in hardware. Moreover,
the repetitive nature of DES makes it ideal for use on a special-purpose chip.
By conducting multiple rounds of substitutions and permutations, DES takes advantage of a
principle known as the avalanche effect to cause each bit of the ciphertext to be dependent on a bit of
the key. Moreover, it has been shown that sixteen rounds is the minimum number of iterations required
to significantly impede a differential cryptoanalytic attack, a sophisticated scheme specifically designed
to attack DES. The consensus today is that “single” DES, with its 56-bit key remains a sound algorithm,
since the best practical attack is key exhaustion (simply trying every possible key), but the 56-bit key is
now too small because key exhaustive attacks are too practical. Therefore NIST now recommends
Triple DES, which has an effective key strength of 112-bits.
92 Answers To Frequently Asked Questions About Today's Cryptography, Paul Fahn, http://www.cs.wcu.edu/~russkiy/texts/misc/cryptfaq.txt .
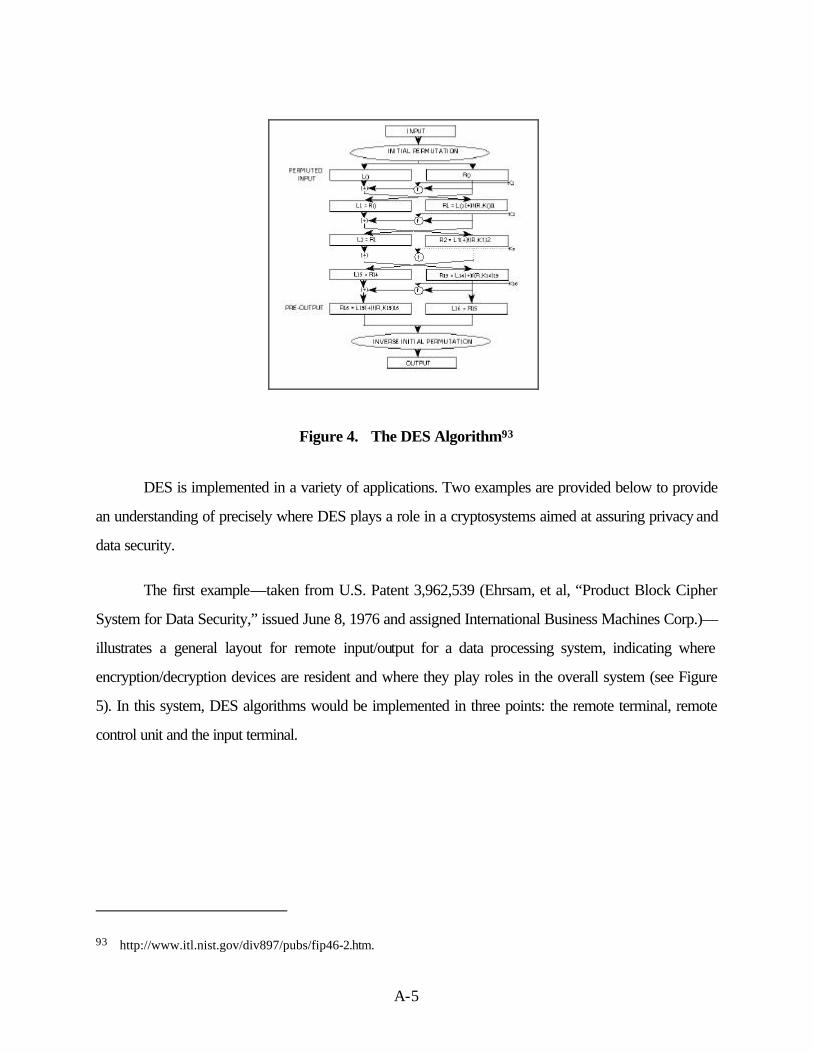
A-5
Figure 4. The DES Algorithm93
DES is implemented in a variety of applications. Two examples are provided below to provide
an understanding of precisely where DES plays a role in a cryptosystems aimed at assuring privacy and
data security.
The first example—taken from U.S. Patent 3,962,539 (Ehrsam, et al, “Product Block Cipher
System for Data Security,” issued June 8, 1976 and assigned International Business Machines Corp.)—
illustrates a general layout for remote input/output for a data processing system, indicating where
encryption/decryption devices are resident and where they play roles in the overall system (see Figure
5). In this system, DES algorithms would be implemented in three points: the remote terminal, remote
control unit and the input terminal.
93 http://www.itl.nist.gov/div897/pubs/fip46-2.htm.
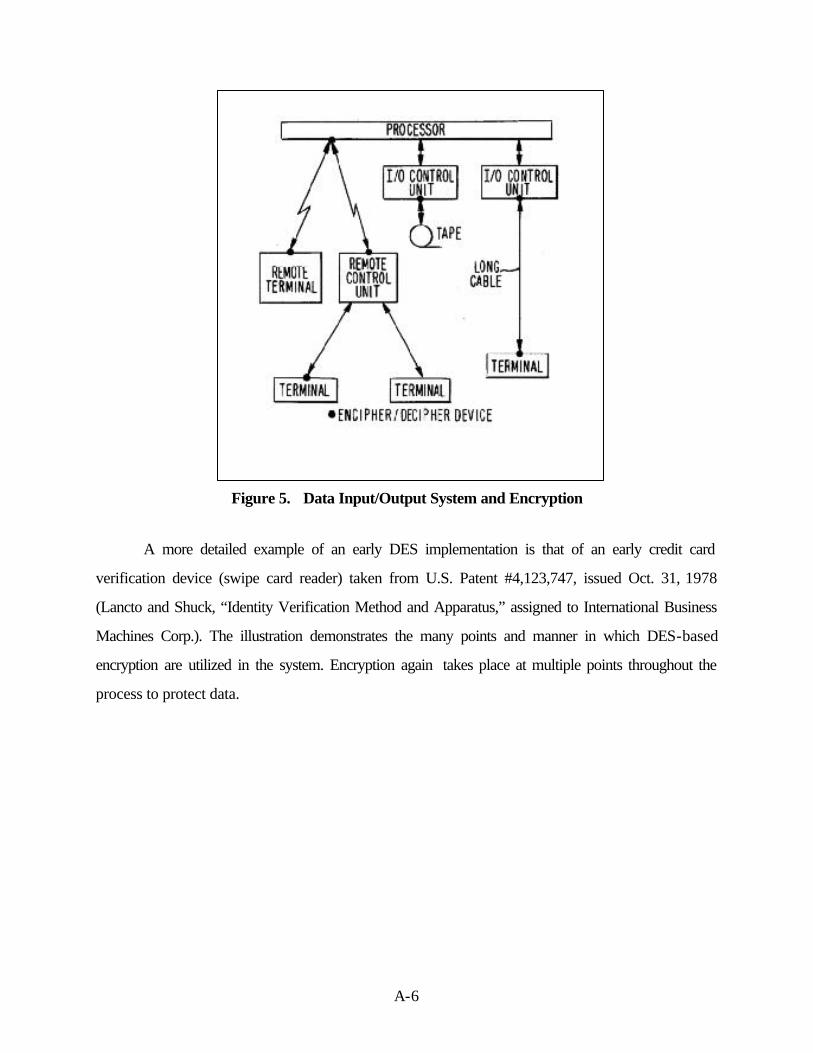
A-6
Figure 5. Data Input/Output System and Encryption
A more detailed example of an early DES implementation is that of an early credit card
verification device (swipe card reader) taken from U.S. Patent #4,123,747, issued Oct. 31, 1978
(Lancto and Shuck, “Identity Verification Method and Apparatus,” assigned to International Business
Machines Corp.). The illustration demonstrates the many points and manner in which DES-based
encryption are utilized in the system. Encryption again takes place at multiple points throughout the
process to protect data.
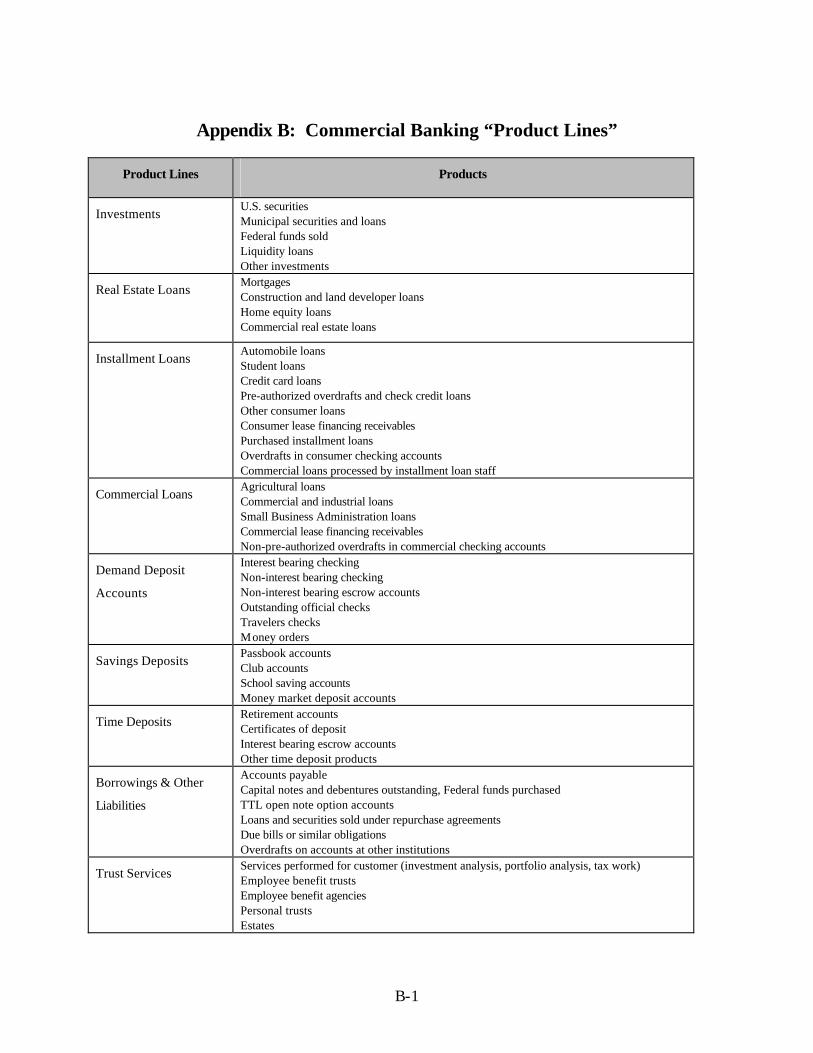
B-1
Appendix B: Commercial Banking “Product Lines”
Product Lines Products
Investments U.S. securities Municipal securities and loans Federal funds sold Liquidity loans Other investments
Real Estate Loans Mortgages Construction and land developer loans Home equity loans Commercial real estate loans
Installment Loans Automobile loans Student loans Credit card loans Pre-authorized overdrafts and check credit loans Other consumer loans Consumer lease financing receivables Purchased installment loans Overdrafts in consumer checking accounts Commercial loans processed by installment loan staff
Commercial Loans Agricultural loans Commercial and industrial loans Small Business Administration loans Commercial lease financing receivables Non-pre-authorized overdrafts in commercial checking accounts
Demand Deposit
Accounts
Interest bearing checking Non-interest bearing checking Non-interest bearing escrow accounts Outstanding official checks Travelers checks Money orders
Savings Deposits Passbook accounts Club accounts School saving accounts Money market deposit accounts
Time Deposits Retirement accounts Certificates of deposit Interest bearing escrow accounts Other time deposit products
Borrowings & Other
Liabilities
Accounts payable Capital notes and debentures outstanding, Federal funds purchased TTL open note option accounts Loans and securities sold under repurchase agreements Due bills or similar obligations Overdrafts on accounts at other institutions
Trust Services Services performed for customer (investment analysis, portfolio analysis, tax work) Employee benefit trusts Employee benefit agencies Personal trusts Estates

B-2
Other Services Safe deposit box rental Data processing for customers and other institutions Travel agency services Non-fiduciary farm management Non-credit life insurance sales
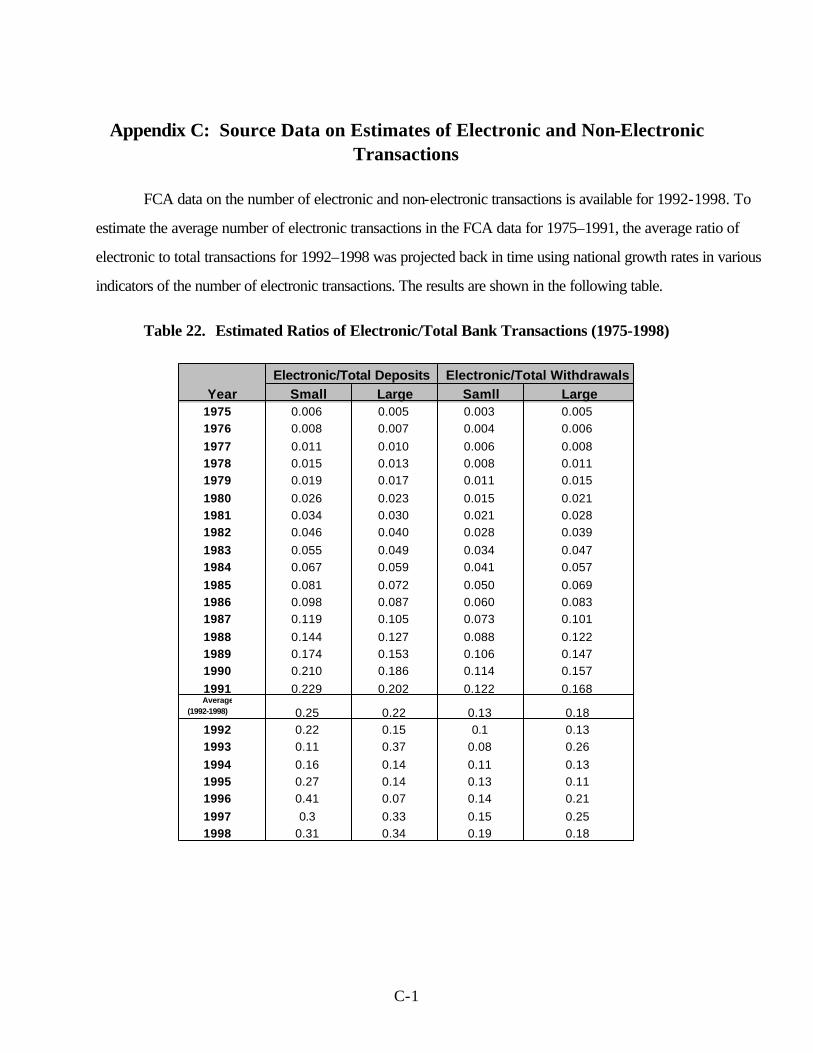
C-1
Appendix C: Source Data on Estimates of Electronic and Non-Electronic Transactions
FCA data on the number of electronic and non-electronic transactions is available for 1992-1998. To
estimate the average number of electronic transactions in the FCA data for 1975–1991, the average ratio of
electronic to total transactions for 1992–1998 was projected back in time using national growth rates in various
indicators of the number of electronic transactions. The results are shown in the following table.
Table 22. Estimated Ratios of Electronic/Total Bank Transactions (1975-1998)
Electronic/Total Deposits Electronic/Total WithdrawalsYear Small Large Samll Large
1975 0.006 0.005 0.003 0.0051976 0.008 0.007 0.004 0.0061977 0.011 0.010 0.006 0.0081978 0.015 0.013 0.008 0.0111979 0.019 0.017 0.011 0.0151980 0.026 0.023 0.015 0.0211981 0.034 0.030 0.021 0.0281982 0.046 0.040 0.028 0.0391983 0.055 0.049 0.034 0.0471984 0.067 0.059 0.041 0.0571985 0.081 0.072 0.050 0.0691986 0.098 0.087 0.060 0.0831987 0.119 0.105 0.073 0.1011988 0.144 0.127 0.088 0.1221989 0.174 0.153 0.106 0.1471990 0.210 0.186 0.114 0.1571991 0.229 0.202 0.122 0.168Average
(1992-1998) 0.25 0.22 0.13 0.181992 0.22 0.15 0.1 0.131993 0.11 0.37 0.08 0.261994 0.16 0.14 0.11 0.131995 0.27 0.14 0.13 0.111996 0.41 0.07 0.14 0.211997 0.3 0.33 0.15 0.251998 0.31 0.34 0.19 0.18
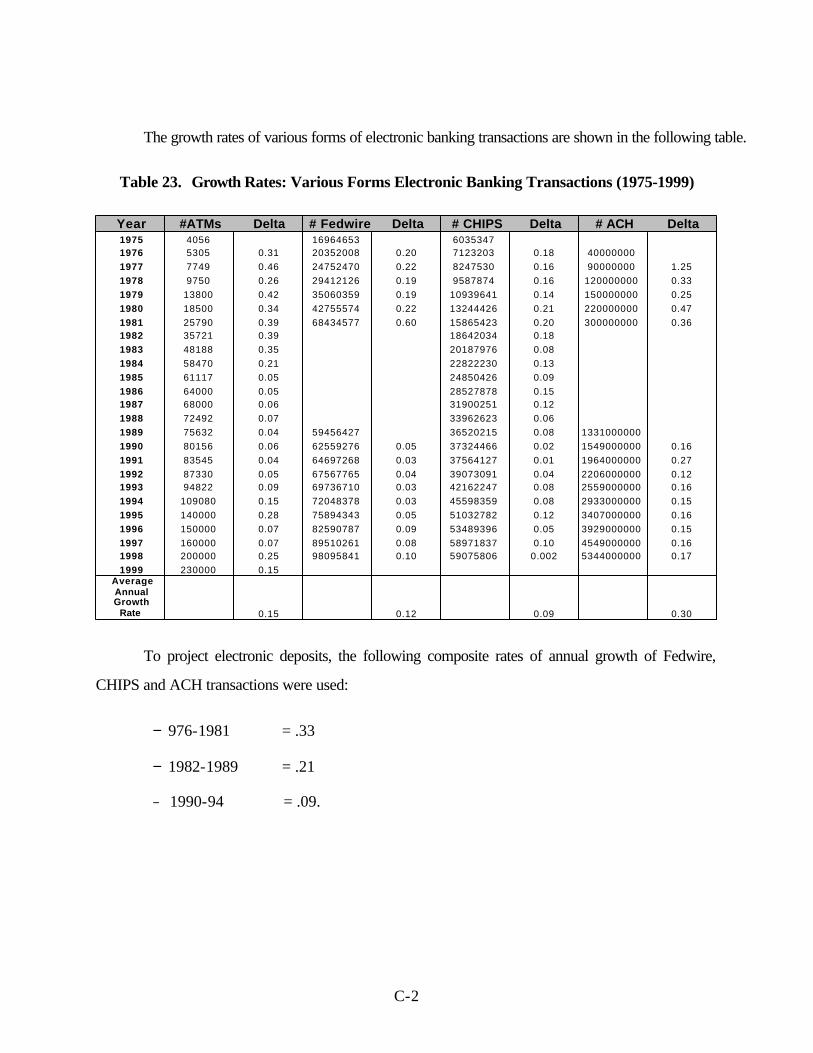
C-2
The growth rates of various forms of electronic banking transactions are shown in the following table.
Table 23. Growth Rates: Various Forms Electronic Banking Transactions (1975-1999)
Year #ATMs Delta # Fedwire Delta # CHIPS Delta # ACH Delta1975 4056 16964653 60353471976 5305 0.31 20352008 0.20 7123203 0.18 400000001977 7749 0.46 24752470 0.22 8247530 0.16 90000000 1.251978 9750 0.26 29412126 0.19 9587874 0.16 120000000 0.331979 13800 0.42 35060359 0.19 10939641 0.14 150000000 0.251980 18500 0.34 42755574 0.22 13244426 0.21 220000000 0.471981 25790 0.39 68434577 0.60 15865423 0.20 300000000 0.361982 35721 0.39 18642034 0.181983 48188 0.35 20187976 0.081984 58470 0.21 22822230 0.131985 61117 0.05 24850426 0.091986 64000 0.05 28527878 0.151987 68000 0.06 31900251 0.121988 72492 0.07 33962623 0.061989 75632 0.04 59456427 36520215 0.08 13310000001990 80156 0.06 62559276 0.05 37324466 0.02 1549000000 0.161991 83545 0.04 64697268 0.03 37564127 0.01 1964000000 0.271992 87330 0.05 67567765 0.04 39073091 0.04 2206000000 0.121993 94822 0.09 69736710 0.03 42162247 0.08 2559000000 0.161994 109080 0.15 72048378 0.03 45598359 0.08 2933000000 0.151995 140000 0.28 75894343 0.05 51032782 0.12 3407000000 0.161996 150000 0.07 82590787 0.09 53489396 0.05 3929000000 0.151997 160000 0.07 89510261 0.08 58971837 0.10 4549000000 0.161998 200000 0.25 98095841 0.10 59075806 0.002 5344000000 0.171999 230000 0.15
Average Annual Growth
Rate 0.15 0.12 0.09 0.30
To project electronic deposits, the following composite rates of annual growth of Fedwire,
CHIPS and ACH transactions were used:
− 976-1981 = .33
− 1982-1989 = .21
− 1990-94 = .09.
C-3
To project the number of electronic withdrawals the rate of growth in the number of ATMs
(nationally) was employed.94
These ratios were multiplied by the total number of deposit and withdrawal transactions
reported in the FCA to estimate the “national average” volume of electronic transactions per-bank
reported in Table 11.
94 Sources: number of ATMs (1975-1982), Electronic Fund Transfer and Crime , Bureau of Justice Statistics (Special Report), February 1984; number of ATMs (1979-1994), A. Berger, et al, "The Transformation of the U.S. Banking Industry," Brookings Papers on Economic Activity, Vol. 2, 1995; number of Fedwire transactions (1975-1981) were derived by subtracting the volume of CHIPS transactions (taken from an independent source) from the total of "wire transfers" (CHIPS plus Fedwire) reported in Bureau of Justice Statistics (1984); Fedwire transactions (1989-1998), Federal Reserve Board of Governors, Fedwire Web site, 1999; CHIPs transactions reported at www.chips.org/stats; ACH transactions (1989-1998) www.nacha.org/Facts/1998achstats.htm.
D-1
Appendix D: Economic Impact Metrics
The two evaluation metrics used customarily by NIST's Program Office are the internal (social)
rate of return and the ratio of benefits-to-costs. A third metric, net present value, is readily derived from
the information developed for the benefit-to-cost ratio.
The metrics in this report are calculated from a time series of costs and benefits in constant
dollars. Therefore, "real" rates of return are presented based on this time series of constant dollars. In
contrast, several previous economic impact assessments conducted by TASC for NIST's Program
Office presented "nominal" rates of return that were based on time series of current dollars (the dollars
of the year in which the benefits were realized or the costs were incurred).
Internal Rate of Return (IRR)95
The IRR is the value of the discount rate, i, that equates the net present value (NPV) of a stream
of net benefits associated with a research project to zero. The time series runs from the beginning of the
research project, t = 0, to a milestone terminal point, t = n. Net benefits refer to total benefits (B) less
total costs (C) in each time period. Mathematically,
(1) NPV = [(B0 - C0) / (1 + i)0] + … + [(Bn - Cn) / (1 + i)
n] = 0
where (Bt - Ct) represents the net benefits associated with the project in year t, and n represents the
number of time periods (years in most cases) being considered in the evaluation. For unique solutions of
i, from equation (1), the IRR can be compared to a value, r, that represents the opportunity cost of
funds invested by the technology-based public institution. Thus, if the opportunity cost of funds is less
than the internal rate of return, the project was worthwhile from an ex post social perspective.
95 The characterization of the three metrics follows Chapter 4 of Albert N. Link and John T. Scott, Public Accountability: Evaluating Technology-Based Institutions (Boston: Kluwer Academic Publishers) 1998.
D-2
Benefit-to-Cost Ratio
The ratio of benefits-to-costs is precisely that, the ratio of the present value of all measured
benefits to the present value of all costs. Both benefits and costs are referenced to the initial time period,
t = 0, as:
B / C = [? t=0 to t=n Bt / (1 + r)t] / [? t=0 to t=n Ct / (1 + r)t]
A benefit-to-cost ratio of 1 implies a break-even project. Any project with B / C > 1 is a
relatively successful project.
Fundamental to implementing the ratio of benefits-to-costs is a value for the discount rate, r.
While the discount rate representing the opportunity cost for public funds could differ across a portfolio
of public investments, the calculated metrics in this report follow the guidelines set forth by the Office of
Management and Budget:
Constant-dollar benefit-cost analyses of proposed investments and regulations should report net present value and other outcomes determined using a real discount rate of 7 percent.96
Net Present Value (NPV)
The information developed to determine the benefit-to-cost ratio can be used to determine net
prevent value as:
NPV = B - C
Note that NPV allows in principle one means of prioritizing among several projects ex post.
96 “Guidelines and Discount Rates for Benefit-Cost Analysis of Federal Programs,” Office of Management and Budget (OMB), Circular No. A-94, 29 October 1992.