planning your dashboard project · pdf fileidashboards.com planning your dashboard project use...
TRANSCRIPT

iDashboards.com
PLANNING YOUR DASHBOARD PROJECT
Use of dashboards has allowed us to identify adverse trends quickly and implement corrective actions to address the problems. This has allowed us to improve efficiency within the plant and drive incremental improvement in overall performance.
–Ray Snell, IS Director, Drake Extrusion, Inc.
An iDashboards Whitepaper
“

iDashboards.com
Planning Your Dashboard ProjectAn iDashboards Whitepaper
Contents
1. Overview 32. Why Dashboards? 33. Nurture the Correct Environment with Dashboards 3 Communicate Strategy 4 Increase Visibility 4 Foster Coordination 4 Increase Motivation 4 Deliver Actionable Information 44. The Challenges of Creating an Effective Dashboards Solution 5 Collecting Data 5 Developing KPIs and Metrics 5 Designing the Visual Component 6 Establishing a Post Deployment Strategy 6
2.
iDashboards.com
C O M M U N I C A T E S T R A T E G Y
I N C R E A S E V I S I B I L I T Y
F O S T E R C O O R D I N A T I O N
I N C R E A S E M O T I V A T I O N
D E L I V E R A C T I O N A B L E
I N F O R M AT I O N
1. OverviewBusiness Intelligence (BI) is a massive industry and the implementation of BI systems in organizations has spread across a broad spectrum. Dashboards are often times the focal point of mechanisms that build up a data source and produce a visual composition to end users. The previous reporting era generated overwhelming reports and spreadsheets that were difficult to read, and cumbersome to interpret. The human mind is unique in the way it is able to translate height, shape and color much faster than it can process a series of numbers. When colors, shapes and spaces are used to represent information, efficiency and comprehension dramatically increases.
There are numerous ways to implement a dashboard solution; however, not all of them are efficient or effective. Before starting a dashboard initiative, organizations should plan out their project and address it from every context possible. Strategically planning a dashboard project helps organizations focus on their goals and ensure their dashboards are effective.
2. Why Dashboards?Dashboards create insight with the opportunity to better judge performance and predict results early on. Efficient dashboards will help an organization transition from simply measuring performance to managing it.
People tend to naturally associate the word “dashboard” with technology and IT, but that is not necessarily what dashboards are about. Dashboards are meant to drive business processes and nurture the correct environment, ultimately enabling the organization to measure, monitor and manage business performance accurately.
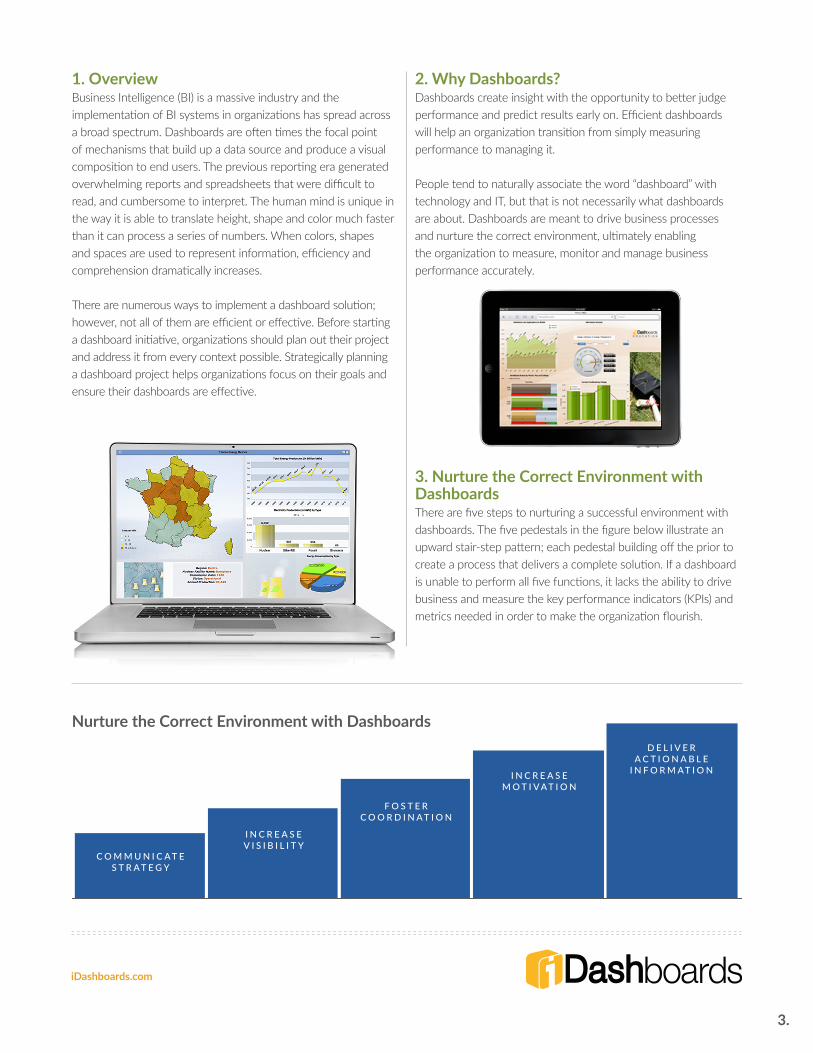
3. Nurture the Correct Environment with DashboardsThere are five steps to nurturing a successful environment with dashboards. The five pedestals in the figure below illustrate an upward stair-step pattern; each pedestal building off the prior to create a process that delivers a complete solution. If a dashboard is unable to perform all five functions, it lacks the ability to drive business and measure the key performance indicators (KPIs) and metrics needed in order to make the organization flourish.
Nurture the Correct Environment with Dashboards
3.

iDashboards.com
When a dashboard solution is implemented the organization is often seeking a cultural change. One of the greatest ways to influence this change is to become proactive instead of reactive. Dashboards deliver an upfront approach which enables users to see the direction they are heading, viewing results long before problems occur, and allowing ample reaction time.
Communicate StrategyBy implementing dashboards, an organization is able to communicate strategy across their business. Dashboards enable organizations to successfully broadcast information such as goals and targets by establishing thresholds for each department.
Increase VisibilityBy communicating strategy, visibility within the company will increase. This increase in visibility provides insight into each individual employee’s performance. As the performance metrics and KPIs start to decline, they can drilldown on those metrics and discover why the decrease occurred. As the data becomes more visible, employees become more responsible as everyone is held accountable for the organization’s success.
Foster CoordinationFor an accurate view of metrics, the organization must foster coordination through every department. If each department’s performance is exposed, then departments with similar metrics will be able to start working together. For example, the total revenue of an organization affects everyone. If only three out of four departments are performing well, the performance of the entire organization will suffer. However, it may be possible the fourth department’s poor performance is actually caused by the actions of another division. Dashboards must be developed with KPIs and metrics that engage coordination based upon the increased visibility of performance results.
Increase Motivation With increased visibility, and the development of enhanced coordination comes increased motivation - not only for the individual employee, but for the entire department. When organizations are able to hold people accountable for their actions, results and work performed or not performed, they become self-motivated. Employees are able to analyze their own performance using real-time dashboards, gaining visibility into how their performance affects the organization.
Displaying real-time information increases motivation as users are able to visualize how every effort directly impacts at least one metric or KPI.
Ideally, every organization would deeply root dashboards throughout the business, but most initiatives start small and expand with time. However, the organization should think at a larger scale, so as they grow, they are able to root the solution through every department and effectively handle the load associated with implementing dashboards.
Deliver Actionable InformationAs the dashboard project grows, it may become difficult to deliver actionable information. When only a segment of the organization is monitoring the data, there is less actionable information available for consideration. However, when dashboards are rooted in every department, with metrics that span the entire organization, there must be a coordinated effort to deliver actionable information. The organization will again have to foster a coordinated effort to determine what data is important, based upon performance. During this process, it is important to keep the initial goals of the dashboards in mind; ensuring the right information is produced to help achieve the desired result.
When these actions are performed correctly, the organization is able to nurture an environment that provides greater insight needed for optimal organizational performance. An organization’s collected data, and discovered performance benchmarks, are priceless in the development of a successful business. When examined from many angles, businesses are able to ensure resources are used wisely, jobs are being done correctly and departmental goals are on target.
When organizations are proactive they are able to predict results and act early. For example, if you are driving a car on a snowy road and hit an icy patch, you begin to slide. If you spin out and proceed to whip the steering wheel in the opposite direction, you make the situation worse because you overcompensated the reaction. However, if you were more prepared, you would have been able to make a minor correction and avoid the spin out all together. Just like driving a car, if the organization transitions from simply measuring performance to managing it, they can avoid catastrophe. Rather than determining what happened after, organizations should manage in real-time for optimal results.
4.

iDashboards.com
4. The Challenges of Creating an Effective Dashboard SolutionThere are a million ways to roll out dashboards, but the common goal is always to make them as efficient as possible. In order to manage the results effectively to increase organizational performance, users should be able to easily understand the data represented in the dashboard. However, there are several challenges when implementing an effective dashboard solution. Four key areas of focus are: collecting data, developing KPIs and metrics, designing the visual component and establishing a post deployment strategy. With proper planning, all of these challenges can be addressed, and planned for, accordingly.
Collecting Data While collecting data, it is vital that an organization has access to relevant and reliable information while still avoiding data collusion. Despite how impeccable the dashboard design may look, if false data is represented, the dashboards will be ineffective. This is why it is essential that the proper policies are adopted to prevent the tampering of data and misrepresentation of performance. Automated systems, responsible for collecting information on a routine basis, can restrict access and ensure the metrics are pristine while still promoting transparency.
Other data issues that frequently arise include aggregating data and maximizing efficiency. Aggregating 500 million rows of data can be time consuming, inefficient and produce results that are far from real-time. Solutions need to be put into place such as a data warehouse or nightly batch job, that are able to output information and maximize efficiency. Certain informational steps allow for more real-time outputs than others, due to the processing time of data aggregation. New solutions may need to be implemented to provide quick turn-around times for daily activities versus weekly or monthly metrics.
Developing KPIs and MetricsEvery organization has metrics and KPIs related to performance that should be monitored and managed. A single metric can be looked at in many ways, so it is important to establish the right metrics and display them in the most productive way. By compartmentalizing and using incremental steps, an organization is able to select the most relevant key metrics. The best way to accomplish this is to ask questions, engage the right people, set expectations and determine the implications of these metrics. For example, if you look at sales, this data can be displayed in several different contexts. It is essential to establish how, when and what sales metrics make the most sense for your organization. Along with sales comes finance and accounting. In order to display the best data possible, it may be necessary to engage the accounting department to ensure the sales and financial data is accurate.
When an organization sets the right expectations, context is added to what is being measured, making the data more relatable for the end user. Once the user understands what to expect, they are able to better comprehend the meanings and repercussions of the results. For instance, there are different implications associated with selling $50,000 versus $500,000,000. If $50,000 is below the sales goals and $500,000,000 is well above the sales
C O L L E C T I N G D A T A
D E V E L O P I N G K P I s A N D M E T R I C S
D E S I G N I N G T H E V I S U A L C O M P O N E N T
E S T A B L I S H I N G A P O S T D E P L O Y M E N T S T R A T E G Y
P R O D U C T
G R O U P I N G
T I M E F R A M E
M E T R I C
5.
iDashboards.com
goal, this should be indicated on the dashboard. This can be easily conveyed using color; red for values below the sales goal, green for above and yellow for any metrics in between.
The significance of the metrics need to relate to the organization’s goals and should be communicated to the users adopting the dashboards. Simply put, what gets measured gets done. When an organization overlooks downfalls, the main issues are not being addressed. The goal of a dashboard is to expose the information collected across every system, and examine it from every angle, so the data can be translated into charts and graphs for enhanced comprehension and understanding.
Designing the Visual Component One of the most important aspects of a dashboard project is designing the visual component; after all, this is what the end user is going to see. Inefficient reports are becoming obsolete because of their complex nature and complicated analysis. Dashboards are driven by efficiency and provide a tool that allows data to be easily analyzed; however, when designing the visual component of a dashboard there are three major concerns to address.
The first is to monitor the overall performance of metrics and display them in an efficient and accurate manner. You would not use a pie chart to display a year’s worth of sales information because it would not be able to depict the trending nature of the data as well as a column or line chart. The human eye is able to translate height differences in the columns, bars and lines in a very short amount of time and make quick decisions regarding the data set.
Dashboards should allow for analysis in many different contexts. Sales, for example, are a core metric and are distilled down by the way they are viewed; monthly sales, year-to-date sales or annual sales. Each metric can then be broken down, analyzed and correlated with other information. One of the ways iDashboards is able to accomplish this is with patented Interactive Intelligence,
which allows common data sets to be linked together. This functionality enables a user to look at state revenue across the organization, as well as, state budgets throughout the United States. The user can then hover over the state of Michigan, not only seeing the revenue in Michigan but all of the associated budgets in the state. By looking at both information sets simultaneously, hidden links between the varying department budgets and the eventual revenue that is accrued within that state become apparent. The analysis should be examined in many contexts allowing for correlating results, not only from different angles but with other metrics and KPIs so unique connections can be uncovered and organizational performance can be driven even further.
The most important task is managing the results. Managing the results is essentially communicating an action plan so the organization is able to perform at its optimal level. When performance is poor, the organization needs to manage results and supplement performance to once again ensure efficiency. The same methodology applies to performance; just because the company appears to be performing well overall does not mean that performance should not be examined on a departmental or individual basis.
Establishing a Post Deployment Strategy Even after an organization has followed these steps, the process is not over and they should now develop a post deployment plan. Ideally, the post deployment strategy would be developed at the start of a dashboard project, and addressed throughout each step of the implementation process. In order for the dashboard initiative to be successful, a plan of action for the organization to follow based on the results needs to be available. For example, if sales begin to plummet, the vice president of sales should be informed so he or she can start drilling down into the data to determine why sales are down. The organization is then able to analyze and address the problem and create a repeatable model in case a similar event occurs in the future.
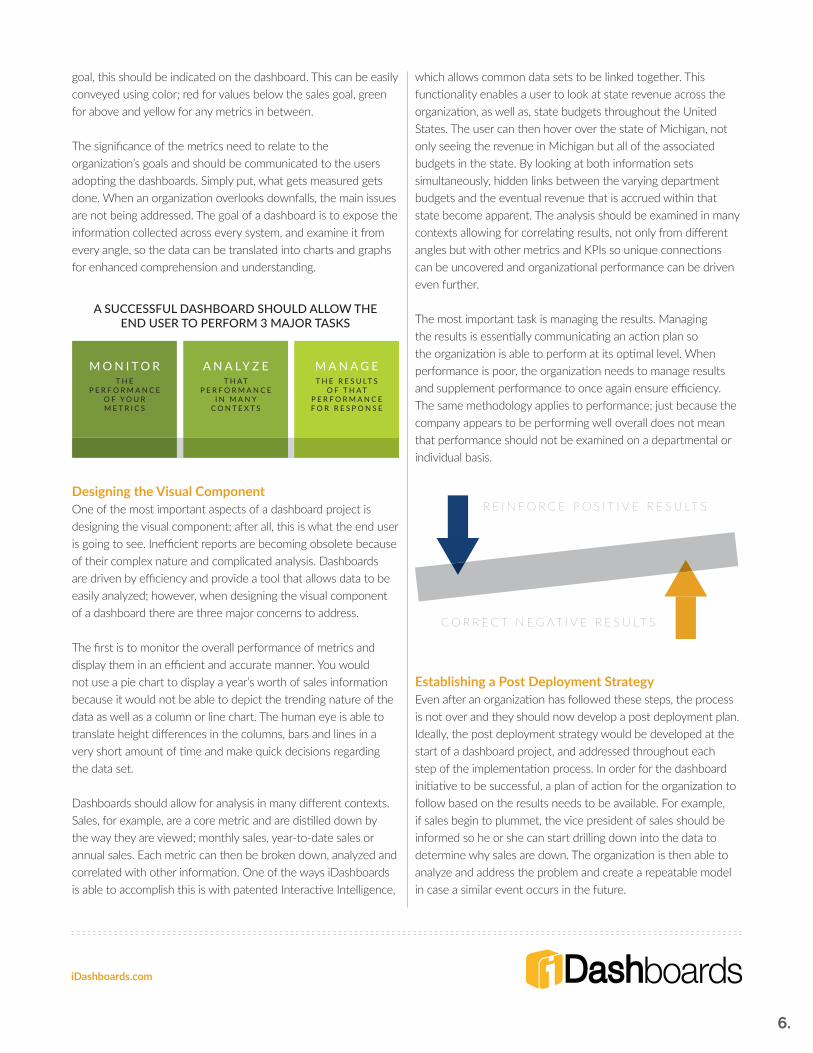
A SUCCESSFUL DASHBOARD SHOULD ALLOW THE END USER TO PERFORM 3 MAJOR TASKS
6.
M O N I T O RT H E
P E R F O R M A N C E O F Y O U R M E T R I C S
A N A LY Z ET H A T
P E R F O R M A N C E I N M A N Y
C O N T E X T S
M A N A G ET H E R E S U LT S
O F T H A T P E R F O R M A N C E F O R R E S P O N S E
C O R R E C T N E G AT I V E R E S U LT S
R E I N F O R C E P O S I T I V E R E S U LT S

iDashboards.com
This process should promote accountability throughout the organization, identifying and recognizing both expletory and inadequate behaviors. This will reinforce and motivate members of the organization to achieve the next goal or target.
Additionally, change controls should be developed so that changes cannot be made on a whim, without analyzing the consequences. The key for an effective post deployment strategy is thinking through the process fully before taking action.
In summary, organizations should think about a plan of action and keep goals in mind long before designing their dashboards. It is always best to slow down and plan out the solution allowing for wise, strategic decisions to be made throughout the process. Implementing a dashboard solution should be much like building a home. No one would start building a house without first hiring an architect to design and create a strategic plan for the project. Your dashboard solution should be treated in this same way.
The overall goal of a dashboard should be to change the way an organization operates by anticipating challenges, making minor adjustments and avoiding major over corrections. Every organization, regardless of size, wants to be nimble and agile in their business space. If dashboards are rooted in an organization, with the right policies and accountability in place, they can retain nimble agility. With the use of dashboards, organizations are able to start spotting trends early, before they become major problems and make corrections quickly.
Anticipate and make minor adjustments along the way. Avoid major over corrections.
7.