planting date effects on growth, development and yield of
TRANSCRIPT

Planting date effects on growth, development and yield of selected agronomic crops at Makhathini
Irrigation scheme
by
WALTER TOM
Submitted in fulfilment of the academic requirements of Master of Science in Agriculture
Crop Science
School of Agricultural, Earth & Environmental Sciences
College of Agriculture, Engineering and Science
University of KwaZulu-Natal
Pietermaritzburg
South Africa
November, 2014
i
PREFACE
The research contained in this thesis was completed by the candidate while based in
the Discipline of Crop Science, School of Agricultural, Earth and Environmental
Sciences, in the College of Agriculture, Engineering and Science, University of
KwaZulu-Natal, Pietermaritzburg Campus, South Africa.
The contents of this work have not been submitted in any form to another university
and, except where the work of others is acknowledged in the text, the results
reported are due to investigations by the candidate.
_________________________
Signed: Professor Albert T. Modi
Date: 21 November, 2014
ii
DECLARATION I, Walter Tom, declare that:
(i) the research reported in this dissertation, except where otherwise indicated or
acknowledged, is my original work;
(ii) this dissertation has not been submitted in full or in part for any degree or examination
to any other university;
(iii) this dissertation does not contain other persons’ data, pictures, graphs or other
information, unless specifically acknowledged as being sourced from other persons;
(iv) this dissertation does not contain other persons’ writing, unless specifically
acknowledged as being sourced from other researchers. Where other written sources
have been quoted, then:
a) their words have been re-written but the general information attributed to them
has been referenced;
b) where their exact words have been used, their writing has been placed inside
quotation marks, and referenced;
(v) where I have used material for which publications followed, I have indicated in detail
my role in the work;
(vi) this dissertation is primarily a collection of material, prepared by myself, published as
journal articles or presented as a poster and oral presentations at conferences. In
some cases, additional material has been included;
(vii) this dissertation does not contain text, graphics or tables copied and pasted from the
Internet, unless specifically acknowledged, and the source being detailed in the
dissertation and in the References sections.
______________________
Signed: Walter Tom
Date: 21 November 2014

iii
ABSTRACT Agriculture, as a source of rural livelihood, is currently faced with challenges such as
increasing temperatures, floods, and drought frequency associated with climate change and
variability. Climate change is associated with shifting rainfall patterns and distribution,
thereby affecting the conventional planting dates. Seasonal variability of rainfall, through
uneven distribution and variable amounts, places subsistence farmers at greater risk as they
are unable to cope. Simple decision making strategies such as choice of planting date and
crop selection could help farmers mitigate some of these impacts. Therefore, the objective of
this study was to evaluate the effect of planting date selection on growth and yield of three
crops, namely, maize (cereal), dry beans (legume) and sweet potato (root crop). Four
planting dates were selected starting from November, 2013 through to February, 2014 and
field trials were established at Makhathini Research Station, Northern KwaZulu-Natal. The
choice of planting date significantly impacted on growth and yield of crops, especially during
critical developmental stages where crops needed sufficient water and optimum
temperatures. Dry mass accumulation was greater in the first planting date followed by the
third planting date and lastly the second planting date. Water and heat stress were not the
only climate characteristics affecting crop growth and yield of all the crops. Flash floods led
to significant yield losses, and in some cases, crop failure. Based on the results, planting
date selection can be used as a management tool for managing water stress under rainfed
conditions. Optimal planting dates varied for the different crops. Maize performed better in
the first and third planting dates. Sweet potato was successful only in the second planting
date although there were no marketable storage roots. Sweet potato showed high sensitivity
to water stress and high temperatures particularly during early establishment and vegetative
phases. Dry beans performed better during the fourth planting date. The findings suggest
that the crops can be planted at different times of the season. This can improve household
food security through broadening on-farm diversity and spreading the risk of crop failure.

iv
ACKNOWLEDGMENTS
I would like to thank God in the name of Jesus Christ of Nazareth.
My supervisor, Prof Albert Thembinkosi Modi, for making this research
possible. Thank you for your support, guidance and advice throughout the
research project.
Dr Mabhaudhi for rendering support, guidance, encouragement and critical
thinking skills from the conception of the study, implementation and final write
up of this dissertation.
Mrs Fikile N.P. Qwabe (Makhathini Research Station) for supporting my
application of research land and supplying me with sweet potato vines.
Mr Simon De Beer and Mr Mthunzi Nzuza (Makhathini Research Station) for
providing tillage machinery.
Mr Nkululeko Ntokozo, for his support and technical assistance in soil
sampling and crop inputs.
I also thank fellow postgraduate students: Tendai Chibarabada, Nyasha
Chiuraise, Kudakwashe Muchirigo and others that I have not mentioned by
name for their support and assistance whenever I needed it.
Doreen Mnyulwa for providing moral support during the course of my study.
Simon and all the support staff at Makhathini Research Station.
Last but not least, I would like to thank my family for providing moral support
throughout the study period.
v
DEDICATION
This thesis is dedicated to my mother, Miriam Kutsonga, son Herbert and daughter
Ingah Tom who inspired me.

vi
TABLE OF CONTENTS
PREFACE .................................................................................................................... i
DECLARATION ........................................................................................................... ii
ABSTRACT ................................................................................................................ iii
ACKNOWLEDGMENTS ............................................................................................. iv
DEDICATION .............................................................................................................. v
TABLE OF CONTENTS ............................................................................................. vi
LIST OF TABLES ....................................................................................................... ix
LIST OF FIGURES ...................................................................................................... x
CHAPTER 1: INTRODUCTION ................................................................................... 1
1.1 Introduction and Rationale ................................................................................. 1
1.2 Justification ........................................................................................................ 2
1.3 Aims and Objectives .......................................................................................... 3
CHAPTER 2: LITERATURE REVIEW ......................................................................... 5
2.1 Maize ................................................................................................................. 5
2.1.1 Origin and history ........................................................................................ 5
2.1.2 Botany and ecology ..................................................................................... 6
2.1.3 Importance of maize .................................................................................... 8
2.2 Dry beans ........................................................................................................ 10
2.2.1 Origin and history ...................................................................................... 10
2.2.2 Botany and ecology ................................................................................... 11
2.2.3 Importance of Dry beans ........................................................................... 13
2.3 Sweet Potatoes ................................................................................................ 14
2.3.1 Origin and history ...................................................................................... 14
2.3.2 Botany and ecology ................................................................................... 15
2.3.3 Importance of sweet potato ....................................................................... 17
2.4 Plant Growth and Development ....................................................................... 17

vii
2.4.1 Factors affecting plant growth and development ....................................... 18
2.4.1.1 Temperature ....................................................................................... 18
2.4.1.2 Water .................................................................................................. 19
2.5 Drought and Water Scarcity ............................................................................. 21
2.6 Crop Responses to Water Stress .................................................................... 22
2.6.1. Plant growth responses ............................................................................ 22
2.7 Mitigating Water Stress: Planting Date Selection ............................................. 23
2.8 Conclusion ....................................................................................................... 24
CHAPTER 3: Materials and methods ........................................................................ 25
3.1 Plant Material ................................................................................................... 25
3.1.1 Maize ......................................................................................................... 25
3.1.2 Dry beans .................................................................................................. 25
3.1.3 Sweet potatoes ......................................................................................... 26
3.2 Description of Experimental Site ...................................................................... 26
3.3 Experimental Design ........................................................................................ 26
3.4 Land Preparation and Crop Management ........................................................ 27
3.5 Data Collection ................................................................................................ 29
3.5.1 Maize ......................................................................................................... 29
3.5.2 Sweet potatoes ......................................................................................... 30
3.5.3 Dry beans .................................................................................................. 30
3.6 Statistical Analyses .......................................................................................... 31
Chapter 4: Results ..................................................................................................... 32
4.1. Weather Parameters ....................................................................................... 32
4.2 Maize ............................................................................................................... 34
4.2.1 Emergence and Growth ............................................................................ 34
4.2.2 Phenology ................................................................................................. 38
4.2.3 Harvest Parameters .................................................................................. 39
4.3 Sweet potatoes ................................................................................................ 42
viii
4.3.1 Growth and phenology .............................................................................. 42
4.3.2 Harvest parameters ................................................................................... 43
4.4 Dry beans ........................................................................................................ 44
4.4.1 Emergence and growth ............................................................................. 44
4.4.2 Phenology ................................................................................................. 48
4.4.3 Yield and yield parameters ........................................................................ 49
4.5 Discussion ....................................................................................................... 50
Chapter 5: Conclusions and Recommendations ....................................................... 54
5.1 Introduction ...................................................................................................... 54
5.2 Challenges ....................................................................................................... 54
5.3 Future Lessons and Research Possibilities ..................................................... 55
5.4 Final Comments and Summary Conclusions ................................................... 55
References ................................................................................................................ 57
List of Appendices ..................................................................................................... 73
Appendix 1: Maize ................................................................................................. 73
Appendix 2: Dry beans .......................................................................................... 75
Appendix 3: Sweet potatoes .................................................................................. 78

ix
LIST OF TABLES
Table 3.1: Results of soil fertility analyses for Makhathini Research Station. .............. 28
Table 4.1: Phenology of maize when planted on four different planting dates (first –
20th of November 2013, second – 18th of December 2013, third – 16 of January 2014
and fourth – 19th of February 2014). 39
Table 4.2: Yield and yield parameters of maize when planted on four different
planting dates (first – 20th of November 2013; second – 18th of December 2013; third
– 16 of January 2014 and fourth – 19th of February 2014). 41
Table 4.3: Yield and yield parameters of sweet potato plants planted on the second
planting date (second – 18th of December 2013). 43
Table 4.4: Phenology of dry beans planted on four different planting dates (first – 20th
of November 2013; second – 18th of December 2013; third – 16 of January 2014; and
fourth – 19th of February 2014). 49
Table 4.5: Yield and yield parameters of dry beans plants planted on the third and
fourth planting dates (third – 16 of January 2014 and fourth – 19th of February 2014).
50
x
LIST OF FIGURES
Figure 2.1: Morphology of the maize plant (Source:
http://www.jonesfamilyfarms.wordpress.com/2011/7/2011/sweet-corn). Accessed: 16
August 2014. ............................................................................................................................. 7
Figure 2.2: Main maize kernel components. (Source:
http://www.bealldeg.com/introraw.html). Accessed: 16 August 2014. ............................ 8
Figure 2.3: Life cycle and morphology of the bean plant (Source:
http://pixgood.com/search.html) Accessed: 27 October 2014. ....................................... 13
Figure 4.1: Changes in daily weather parameters (Tmax, Tmin and rain) observed
during the four planting dates: A – Planting date 1; B – Planting date 2; C – Planting
date 3; and D – Planting date 4 at Makhathini Research Station. ................................. 33
Figure 4.2: Weekly emergence of maize seeds planted on four different planting
dates (first – 20th of November 2013; second – 18th of December 2013; third – 16 of
January 2014; and fourth – 19th of February 2014). ......................................................... 34
Figure 4.3: Weekly plant height of maize planted on four different planting dates (first
– 20th of November 2013; second – 18th of December 2013; third – 16 of January
2014; and fourth – 19th of February 2014). ........................................................................ 35
Figure 4.4: Weekly leaf number of maize planted on four different planting dates (first
– 20th of November 2013, second – 18th of December 2013, third – 16 of January
2014 and fourth – 19th of February 2014). ......................................................................... 36
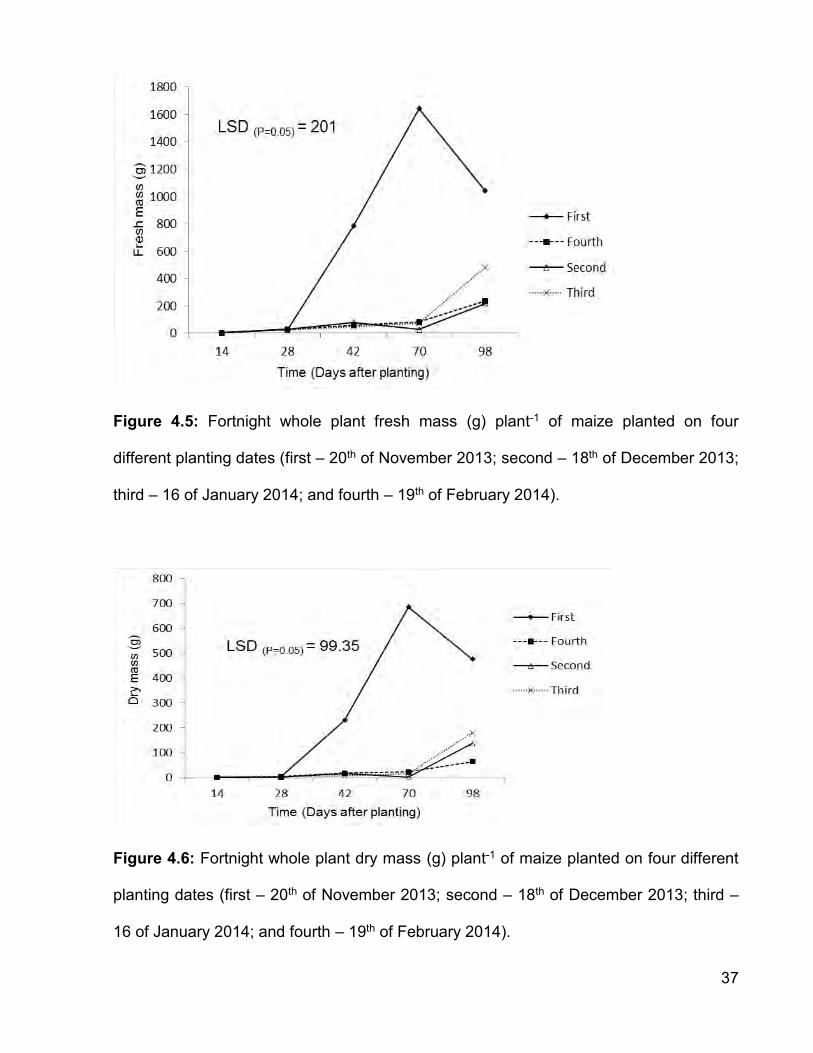
Figure 4.5: Fortnight whole plant fresh mass (g) plant-1 of maize planted on four
different planting dates (first – 20th of November 2013; second – 18th of December
2013; third – 16 of January 2014; and fourth – 19th of February 2014). ....................... 37
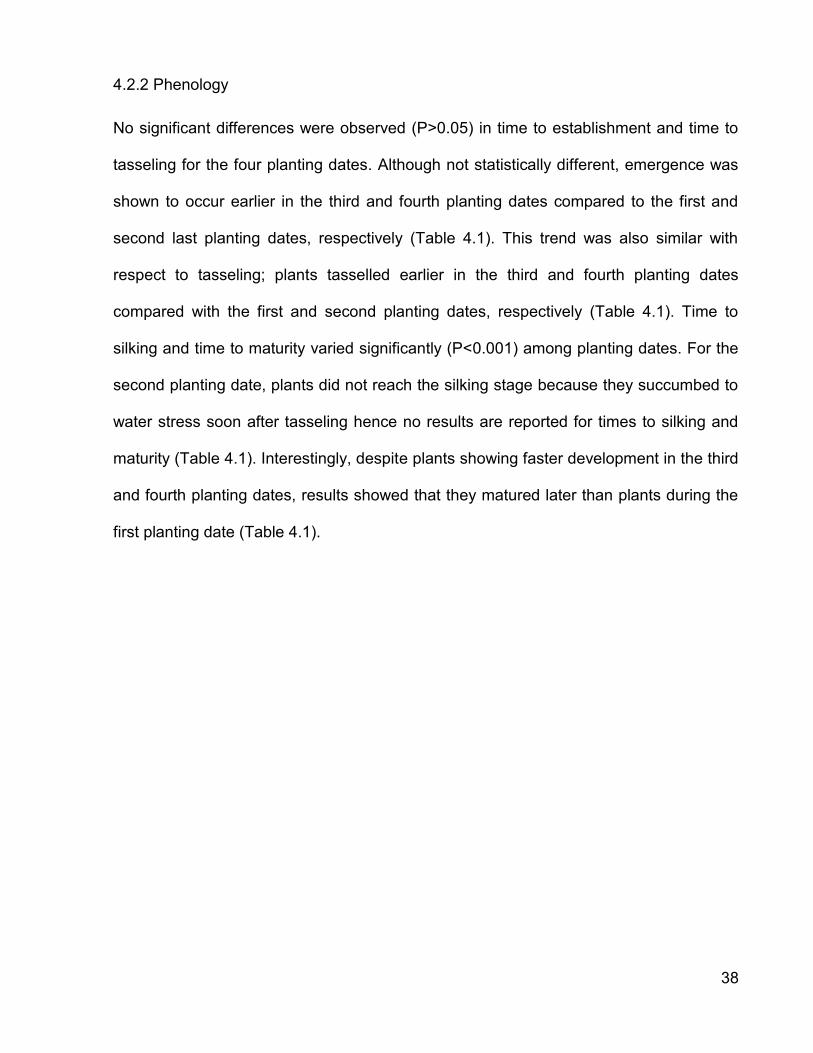
Figure 4.6: Fortnight whole plant dry mass (g) plant-1 of maize planted on four
different planting dates (first – 20th of November 2013; second – 18th of December
2013; third – 16 of January 2014; and fourth – 19th of February 2014). ....................... 37
Figure 4.7: Weekly leaf number of sweet potato plants planted on two different
planting dates (first – 20th of November 2013 and second – 18th of December 2013).
.................................................................................................................................................. 42

xi
Figure 4.8: Weekly plant height of sweet potato plants planted on two different
planting dates (first – 20th of November 2013 and second – 18th of December 2013)
.................................................................................................................................................. 43
Figure 4.9: Yield sweet potato plants planted on the second planting date (second –
18th of December 2013). ....................................................................................................... 44
Figure 4.10: Weekly emergence of dry beans seeds planted on four different planting
dates (first – 20th of November 2013; second – 18th of December 2013; third – 16 of
January 2014; and fourth – 19th of February 2014). ......................................................... 45
Figure 4.11: Weekly plant height of dry beans planted on four different planting dates
(first – 20th of November 2013, second – 18th of December 2013, third – 16 of
January 2014 and fourth – 19th of February 2014). .......................................................... 46
Figure 4.12: Weekly leaf number of dry beans planted on four different planting dates
(first – 20th of November 2013; second – 18th of December 2013; third – 16 of
January 2014; and fourth – 19th of February 2014). ......................................................... 46
Figure 4.13: Fortnightly whole plant fresh mass of dry beans planted on four different
planting dates (first – 20th of November 2013; second – 18th of December 2013; third
– 16 of January 2014; and fourth – 19th of February 2014). ........................................... 47
Figure 4.14: Fortnightly whole plant dry mass of dry beans planted on four different
planting dates (first – 20th of November 2013; second – 18th of December 2013; third
– 16 of January 2014; and fourth – 19th of February 2014). ........................................... 48

1
CHAPTER 1
INTRODUCTION
1.1 Introduction and Rationale
Agricultural productivity is believed to be under threat due to global climate change
(IPCC 2007). This is predominantly so in developing countries where the impacts of
climate change are felt especially amongst the rural communities. Agriculture as a
source of livelihood is partly faced with challenges such as excessive heat, floods and
drought caused by climate change (Matarira and Mantasa. 2009). Africa depends
greatly on rain-fed agriculture hence the economic vulnerability is higher than that of the
developed world (Parry et al. 2001). The degree of risk in African countries is worsened
by the unavailability of funds to develop climate change adaptation strategies (Fischer et
al. 2005). Their vulnerability to climate change comes both from being located mainly in
the tropics, and from the various socioeconomic, demographic, and policy trends limiting
their capacity to adapt to the changes.
South Africa, being part of the Southern African community is not unique; the
majority of the poor (72%) are situated in such areas where they depend on dry land
farming (Ortmann and Machete. 2003). According to Davis (2008), challenges in
subsistence farming are imposed by the perpetual risk caused by seasonal variability of
rainfall through both uneven distribution and variable precipitation quantities in South
Africa. The vulnerability to a range of climate change stressors is exacerbated by the
intrinsic nature of their farming environment and the complexity of the location specificity
which makes standardised recommendations on climate adaptation strategies difficult.
2
Subsistence farming, as a low input and mostly rain-fed farming system, is threatened
by climate change. More so, most subsistence farmers are situated in marginal areas
where poor yields may occur in consecutive seasons leaving them economically poorer
(Mutekwa 2009). The greater rural population of South African farmers derive income
from rain-fed agriculture, of which crop yields are anticipated to decrease due to climate
change impacts (Ellis 2000, Downing 1992).
One of the challenges brought about by climate change is believed to be the shifting
of rainfall patterns and distribution (Droogers et al. 2001). The rainy season either states
early or much later than the traditional dates that subsistence farmers have been
accustomed to. This has challenged subsistence farmers’ traditionally known planting
dates. In most cases, farmers still plant early, only for the rains to come later often
resulting in massive crop failure, something most subsistence farmers lack the
resources to recover from (Mabhaudhi et al. 2014). This therefore threatens the
resilience of their cropping systems. The choice of planting date and crop to grow
becomes a challenge to the subsistence farmer. Some subsistence farmers have even
reduced planted area due to high crop failure.
1.2 Justification
Subsistence farmers rely on knowledge of previous seasons’ planting dates,
observations of natural vegetation changes together with the first effective rainfall by
either dry planting before or after the rainfall. Some farmers split planting or stagger
within one season to avoid absolute risk (Traore et al. 2007, Lemos and Dilling 2007).
The shifting rainfall patterns due to climate change affects the forecast based on such
3
traditional meteorological knowledge as these lack detail and accuracy, resulting in
compromised credibility (James et al. 2011).
The shift in planting dates also implies that some crops that have been traditionally
cultivated by the farmers may no longer be suited to the new season durations. As such,
there is also a need to diversify the crop base utilised by subsistence farmers as an
effort to increase on–farm agro–biodiversity and resilience. Strategies to achieve this
should also pay attention to challenges of food and nutritional insecurity that persist in
rural households. This suggests that any new crops suggested should be nutritious
crops that can address protein and mineral deficiencies. In addition, such crops should
have high yield potential such that farmers may transition from subsistence to semi-
commercial farmers. This will aid in efforts to achieve Millennium Development Goal
1(UN Millennium Development Goals Website).
The choice of planting dates could significantly impact on growth and yields of crops,
particularly during the critical development phases where plants require adequate
moisture and ideal temperatures at planting, seedling establishment, flowering and fruit
formation (Passioura 2007). Poor planting date selection may subject crops to water and
heat stress during dry spells at critical growth stages resulting in reduced yield. In order
to minimize farming risk, a need arises to ascertain planting dates and good crop
choices among subsistence farmers.
1.3 Aims and Objectives
This study seeks to contribute to addressing the problem of yield loss and crop failure
due to uninformed planting date selection practices among subsistence farmers of

4
Makhathini rural district, KwaZulu–Natal, South Africa. The study area of Makhathini was
selected as a study area as it is predicted to experience climate change and variability
hence affecting food security of vulnerable farmers. While some farmers in Makhathini
rely on the irrigation scheme, a majority still rely on rainfed agriculture. The study
explores the planting time which provides the most economic yield outputs and that
could form part of the strategy for staggering the planting of various dry land crops. The
commonly grown crops among subsistence farmers in this area (maize and sweet
potatoes and dry beans) will be explored in this study. The selection of crops was based
on commonly cultivated crops within area; further consideration was given to represent a
cereal, legume and root crop with a view to contributing towards improved nutrition
within the community. The aim of the study was to determine the effect of planting dates
as a drought management tool, on growth, phenology and yield of the three crops. It
was hypothesized that choice of planting date does not have an effect on growth,
phenology and yield of sweet potatoes, dry beans and maize.
The specific objectives of the study were:
1. to determine the effect of planting date (Nov, Dec, Jan and Feb) on growth,
phenology and yield of maize under rainfed conditions;
2. to determine the effect of planting date (Nov, Dec, Jan and Feb) on growth,
phenology and yield of sweet potatoes under rain-fed conditions; and
3. to determine the effect of planting date (Nov, Dec, Jan and Feb) on growth,
phenology and yield of dry beans under rain-fed conditions.
5
CHAPTER 2
LITERATURE REVIEW
2.1 Maize
2.1.1 Origin and history
Maize (Zea mays) (Fanadzo et al. 2009) is also known as umbila in IsiZulu, cingoma
(seTswana), mahea, majs (seSotho), mielies (Afrikaans) and chibage or chibere in
Zimbabwe (Kay. 2011). It belongs to the grass family (Poaceae), tribe Andropogoneae
and genus “Zea” (Zela) which is a derivative term from the Greek name for food grass.
Other species are referred to as teosintes, tripsacum and coix which are wild species
closely related to domesticated maize. The wild species are unique to domesticated
maize due to them being found in restricted and contrasting ecological sites (Hufford et
al. 2012). It originated from the Americas around Mexico in the Mesoamerican region.
Archaeological records and phylogenetic analysis suggest that domestication began at
least 4 000 – 10 000 years ago (Matsuoka 2005). Maize is believed to have been
brought into Africa by the early Portuguese sailors who probably had trading motives on
the continent in the 17th Century (Miracle 2009). Due to maize growth under diverse
environments and storability it rapidly spread to almost every province replacing
sorghum (Sorghum bicolour (L.) Moench) and millet (Eleusine coracana Gartner)
becoming the staple food such that approximately eight million tonnes are produced
yearly in South Africa (du Plessis 2003). According to Ofori and Kyei-Baffour (2004), in
sub-Saharan Africa, maize is the main food which provides 50% of basic calories to 50%
of the population.
6
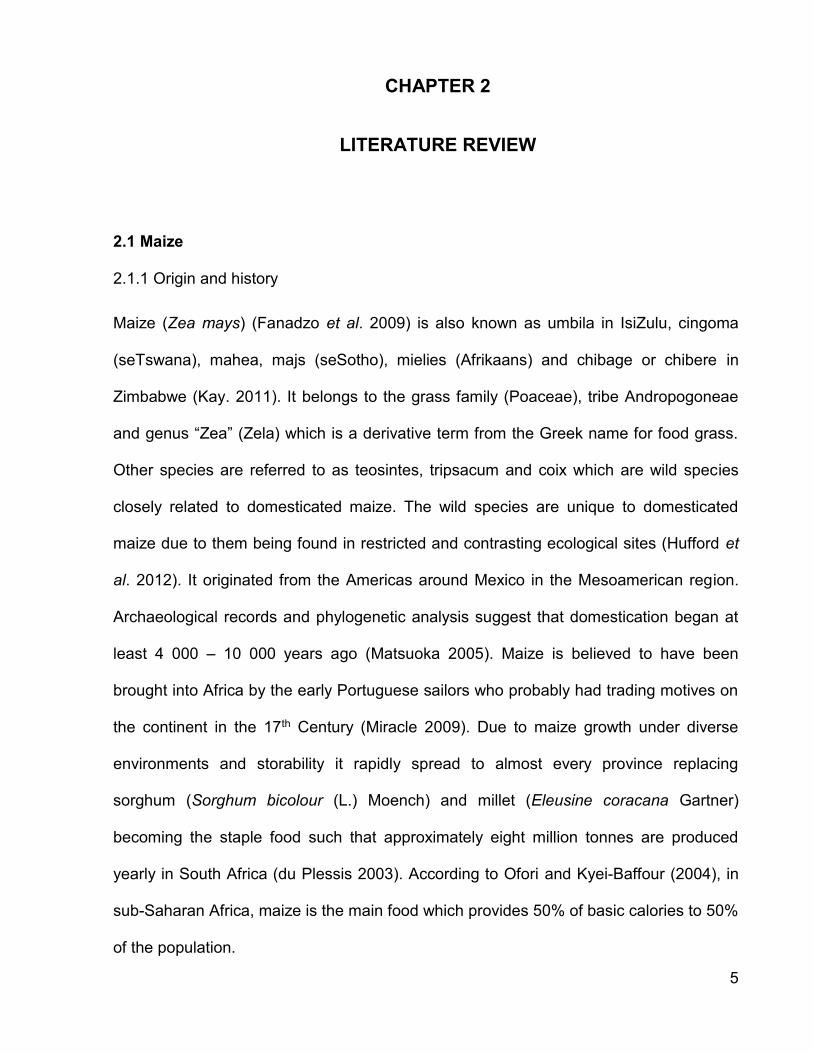
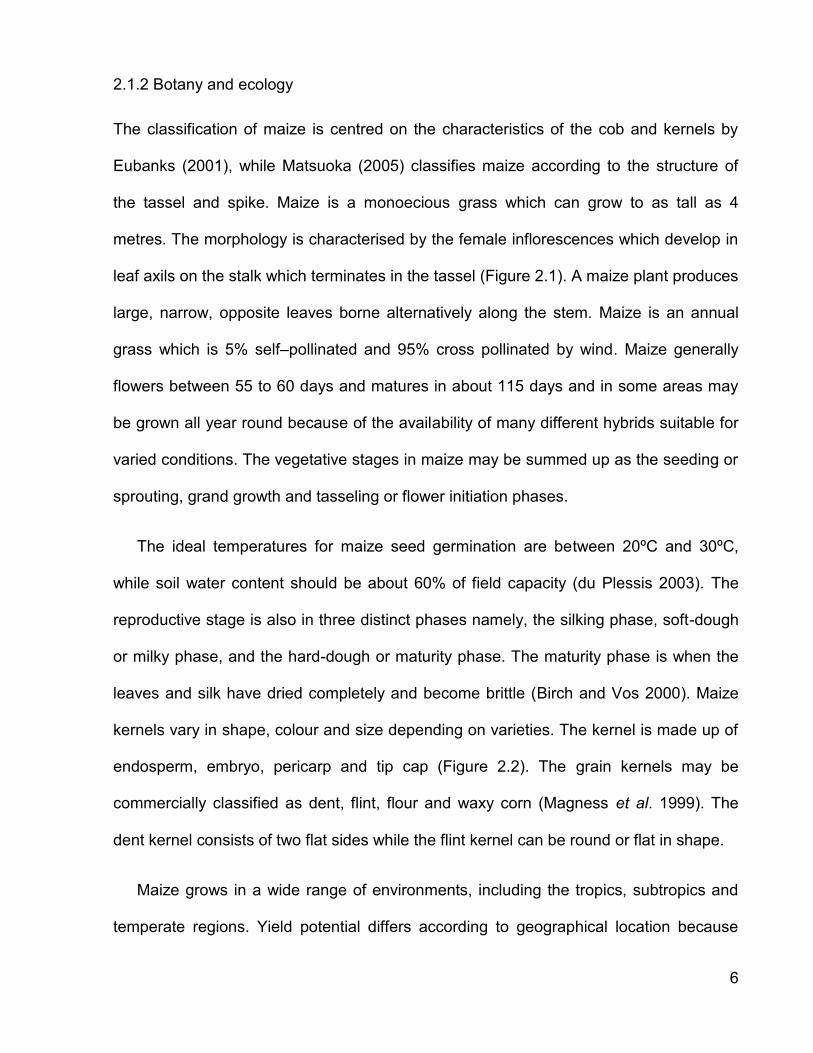
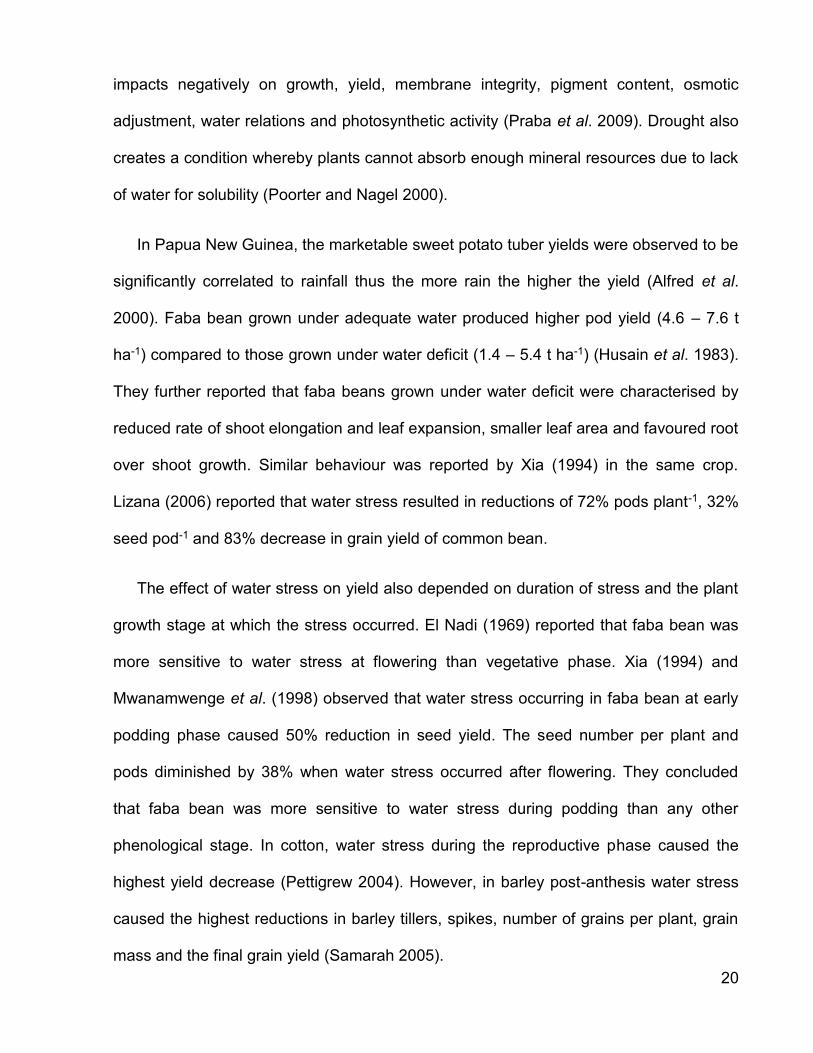
2.1.2 Botany and ecology
The classification of maize is centred on the characteristics of the cob and kernels by
Eubanks (2001), while Matsuoka (2005) classifies maize according to the structure of
the tassel and spike. Maize is a monoecious grass which can grow to as tall as 4
metres. The morphology is characterised by the female inflorescences which develop in
leaf axils on the stalk which terminates in the tassel (Figure 2.1). A maize plant produces
large, narrow, opposite leaves borne alternatively along the stem. Maize is an annual
grass which is 5% self–pollinated and 95% cross pollinated by wind. Maize generally
flowers between 55 to 60 days and matures in about 115 days and in some areas may
be grown all year round because of the availability of many different hybrids suitable for
varied conditions. The vegetative stages in maize may be summed up as the seeding or
sprouting, grand growth and tasseling or flower initiation phases.
The ideal temperatures for maize seed germination are between 20ºC and 30ºC,
while soil water content should be about 60% of field capacity (du Plessis 2003). The
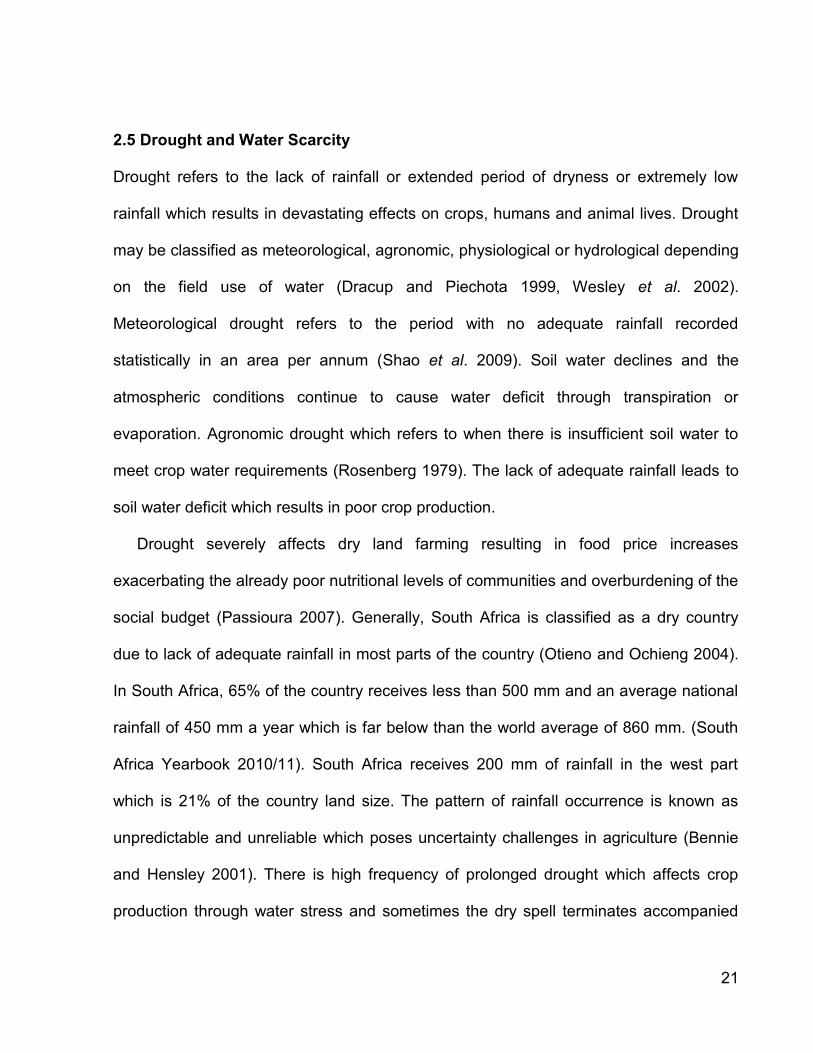
reproductive stage is also in three distinct phases namely, the silking phase, soft-dough
or milky phase, and the hard-dough or maturity phase. The maturity phase is when the
leaves and silk have dried completely and become brittle (Birch and Vos 2000). Maize
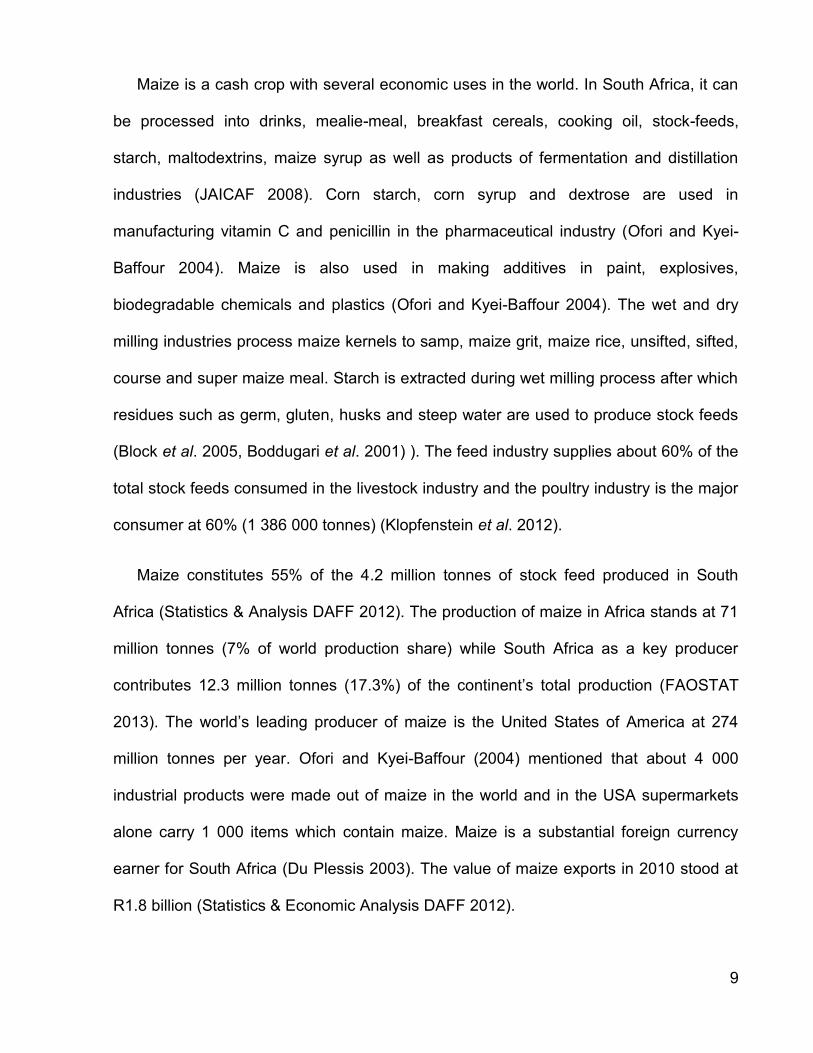
kernels vary in shape, colour and size depending on varieties. The kernel is made up of
endosperm, embryo, pericarp and tip cap (Figure 2.2). The grain kernels may be
commercially classified as dent, flint, flour and waxy corn (Magness et al. 1999). The
dent kernel consists of two flat sides while the flint kernel can be round or flat in shape.
Maize grows in a wide range of environments, including the tropics, subtropics and
temperate regions. Yield potential differs according to geographical location because

7
radiation, temperature and rainfall conditions vary (Birch et al. 2003). Yield is also
greatly dependent on soil fertility, plant population management, altitude and air
temperature, occurrence of pests and diseases, cultivar choice and planting time
(Fanadzo 2007). Maize yields at present in Africa range between 1.5 to 1.8 tonnes ha-1
while in America yield exceeds 7 tonnes ha-1 (FAOSTAT 2013). The average maize
yield obtained under small-scale production in the Eastern Cape, South Africa was 1.8
tonnes ha-1. Southern Africa is considered the highest consumer of maize (85 kg capita-1
year-1) when comparing with East Africa which stands at 27 kg capita-1 year-1. Maize
generally covers 25 million hectares in sub-Saharan Africa with an output of 38 million
metric tonnes (Smale et al. 2011). Wada (2008) projected that the global demand for
maize will rise from 558 million metric tonnes to 837 million tonnes by 2020.
Figure 2.1: Morphology of the maize plant (Source:
http://www.jonesfamilyfarms.wordpress.com/2011/7/2011/sweet-corn). Accessed: 16
August 2014.

8
Figure 2.2: Main maize kernel components. (Source:
http://www.bealldeg.com/introraw.html). Accessed: 16 August 2014.
2.1.3 Importance of maize
Maize plays a major role in food security especially in Southern Africa. It is a major
staple food in the form of mealie-meal, samp, mealie-rice or as boiled or roasted on the
cob. Maize seed contains crude protein (9.6%), crude fibre (2%), carbohydrates (70.8%)
and micronutrients recommended by the World Health Organisation (George et al.
1989). The traditional social-cultural use of maize is for making alcohol for rituals and
social gatherings in rural areas. Maize, as the staple crop in most sub-Saharan
countries, gives the largest output per man-hour spent on it than any other crop
(Mashingaidze 2012). Maize per-capita consumption in Southern Africa is the highest in
the world, hence the need for high maize productivity in the region. It is a water use
efficient crop suitable for rotations with legumes and also intercropping in water stressed
environments which make up most of the maize production areas in southern Africa
(Department of Agriculture 2007). Intercropping maize and molasses or Sudan grass
provides natural control of stemborers and increases parasitism (Khan et al. 1997).
9
Maize is a cash crop with several economic uses in the world. In South Africa, it can
be processed into drinks, mealie-meal, breakfast cereals, cooking oil, stock-feeds,
starch, maltodextrins, maize syrup as well as products of fermentation and distillation
industries (JAICAF 2008). Corn starch, corn syrup and dextrose are used in
manufacturing vitamin C and penicillin in the pharmaceutical industry (Ofori and Kyei-
Baffour 2004). Maize is also used in making additives in paint, explosives,
biodegradable chemicals and plastics (Ofori and Kyei-Baffour 2004). The wet and dry
milling industries process maize kernels to samp, maize grit, maize rice, unsifted, sifted,
course and super maize meal. Starch is extracted during wet milling process after which
residues such as germ, gluten, husks and steep water are used to produce stock feeds
(Block et al. 2005, Boddugari et al. 2001) ). The feed industry supplies about 60% of the
total stock feeds consumed in the livestock industry and the poultry industry is the major
consumer at 60% (1 386 000 tonnes) (Klopfenstein et al. 2012).
Maize constitutes 55% of the 4.2 million tonnes of stock feed produced in South
Africa (Statistics & Analysis DAFF 2012). The production of maize in Africa stands at 71
million tonnes (7% of world production share) while South Africa as a key producer
contributes 12.3 million tonnes (17.3%) of the continent’s total production (FAOSTAT
2013). The world’s leading producer of maize is the United States of America at 274
million tonnes per year. Ofori and Kyei-Baffour (2004) mentioned that about 4 000
industrial products were made out of maize in the world and in the USA supermarkets
alone carry 1 000 items which contain maize. Maize is a substantial foreign currency
earner for South Africa (Du Plessis 2003). The value of maize exports in 2010 stood at
R1.8 billion (Statistics & Economic Analysis DAFF 2012).

10
2.2 Dry beans
2.2.1 Origin and history
Dry beans (Phaseolus vulgaris) originated along with maize in Mexico, Central and
South America over 7 000 years ago (Myers 1999). The family of the Dry beans is
Fabaceae, sub-family Papilionoideae and genus Phaseolus sensu stricto. Within the
genus Phaseolus, there are three species which are agronomically important in South
Africa (Manjeru et al. 2007). These are Phaseolus acutifolius (Tepary beans), Phaseolus
coccineus (large white kidney beans) and Phaseolus vulgaris (dry or common beans)
(Liebenberg 2002; Manjeru et al. 2007). However, large seeded lima beans are
classified as tender perennials, but they are grown as annual crops. The genus
Phaseolus is now planted around the world and in different cultivars, such as, common
green beans, kidney beans, french bean, runner bean, black beans, among others
(Manjeru et al. 2007). Within each species there are many seed types which differ in
size, shape and colour. In each type there are different cultivars and the seeds of these
cultivars differ very little from one another. However, considerable differences may occur
in adaptability, growth habit, disease resistance and many other characteristics
(Schwartz et al. 2004).
It was grown mainly as a source of protein and 55 species of bean are known. The
largest producer of dry beans is Latin America at about 50% capacity of the world
market followed by Africa at 25% (Beebe et al. 2013). Dry beans is currently grown in
many regions including northeast Brazil and southern Africa where water stress
frequently occurs thereby putting to test the genetic diversity for drought response
(Williams et al. 2007). Kenya being the largest producer of dry beans in the region, the
per capita consumption annually can be as high as 60 kg capita-1 year-1 (Beebe et al.

11
2013). Smallholder farmers traditionally dominated the production of dry beans in mostly
intercropping cropping systems in rotation with maize, sorghum or other crops
particularly in Africa (Broughton et al. 2003). The leading world producer of dry beans in
2013 was Myanmar at 3.8 million tonnes a year. Dry beans production in Africa amounts
to 4.9 million tonnes while South Africa stands at 48 000 tonnes (0.9%) of the
continent’s aggregate production status (FAOSTAT 2013). South Africa exports
approximately 25 000 tonnes per year while import amounts to 75 000 tonnes (Statistics
& Economic Analysis, DAFF 2011).
2.2.2 Botany and ecology
The flowers are hermaphroditic, have both the stamen and pistil on the same flower,
which enables self‒fertilization. However, this floral morphology has the disadvantage
that it may lead to diminishing genetic diversity. However, hybridization occurs frequently
in nature due to this characteristic, as any plant can pollinate another due to the
hermaphroditic properties enabling the pollination process from one plant to another
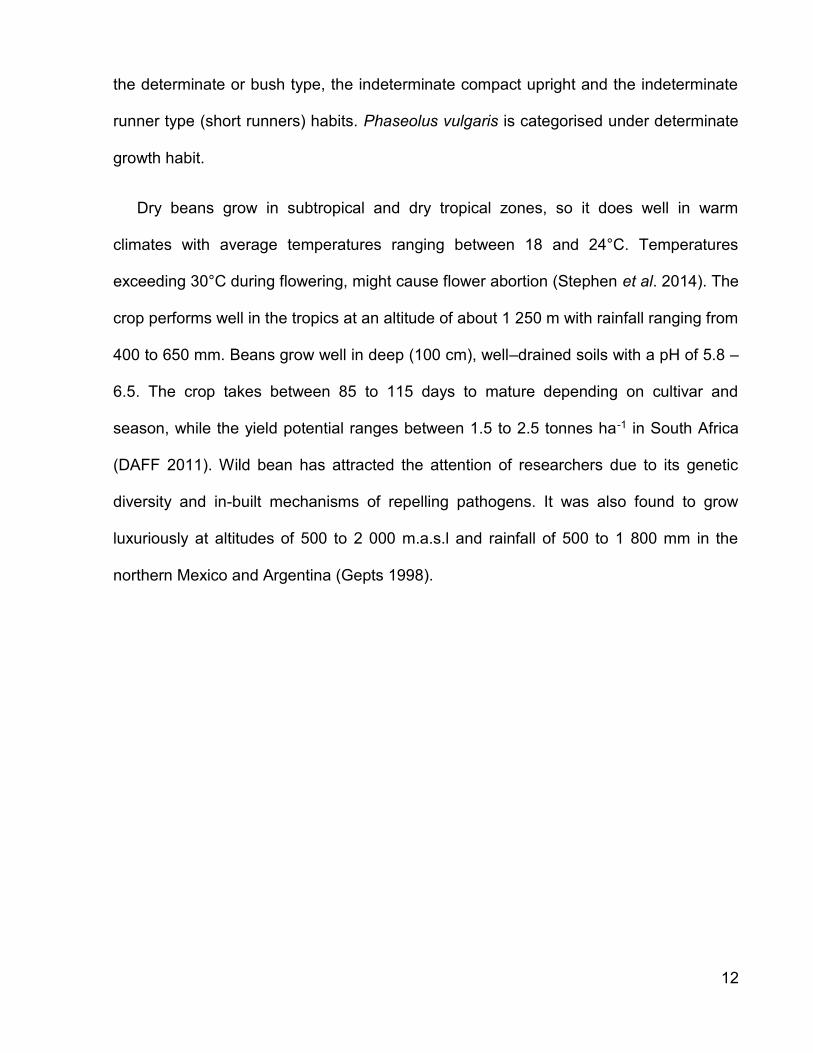
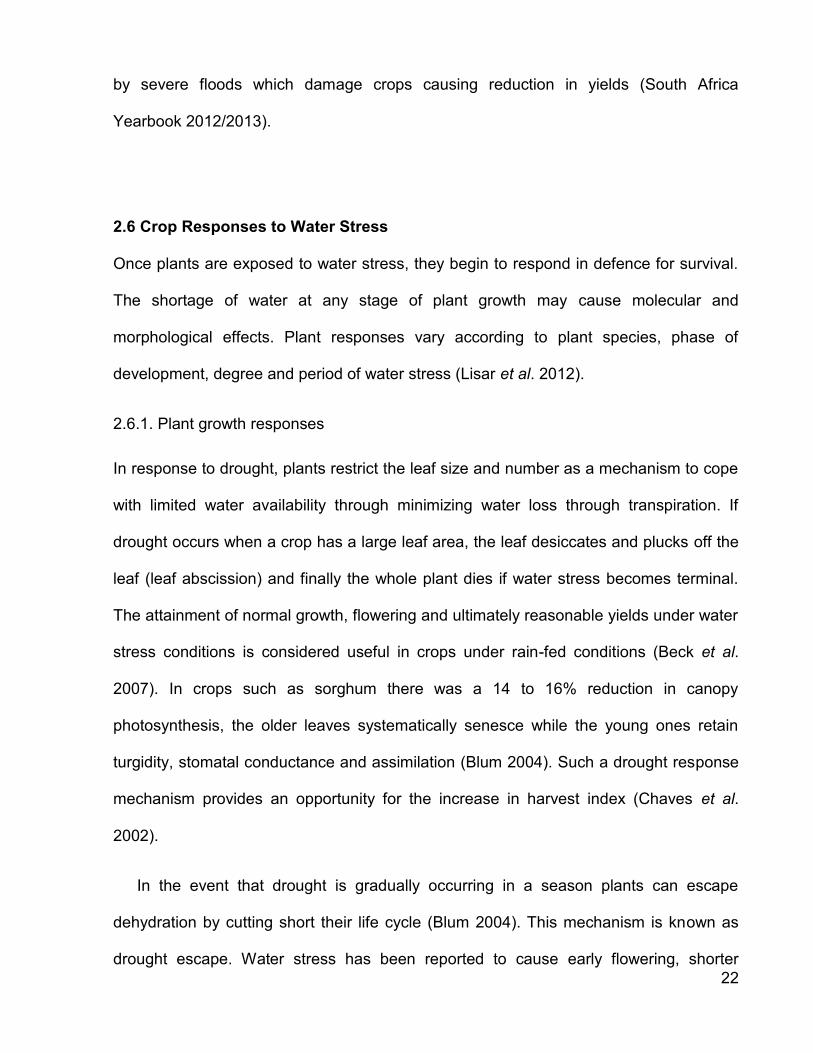
(Gepts 1998). The crop has four major growth stages starting from emergence until
maturity (Schwartz et al. 2004). The first growth stage is emergence (elongation of
hypocotyl through the soil and then straightens out with unfolding cotyledons), and early
vegetative growth (Figure 2.3). Secondly the branching and rapid vegetative growth,
whereby branches develop on the leaf axes and rapid growth occurs as new nodes
develop on the main stem and on branches (Figure 2.3). Thirdly, the flowering and pod
formation occurs. Lastly, pod fill and physical maturity take place, and at this point 80%
pods have changed colour. Growth habit of the bean species is categorised into three:
12
the determinate or bush type, the indeterminate compact upright and the indeterminate
runner type (short runners) habits. Phaseolus vulgaris is categorised under determinate
growth habit.
Dry beans grow in subtropical and dry tropical zones, so it does well in warm
climates with average temperatures ranging between 18 and 24°C. Temperatures
exceeding 30°C during flowering, might cause flower abortion (Stephen et al. 2014). The
crop performs well in the tropics at an altitude of about 1 250 m with rainfall ranging from
400 to 650 mm. Beans grow well in deep (100 cm), well–drained soils with a pH of 5.8 –
6.5. The crop takes between 85 to 115 days to mature depending on cultivar and
season, while the yield potential ranges between 1.5 to 2.5 tonnes ha-1 in South Africa
(DAFF 2011). Wild bean has attracted the attention of researchers due to its genetic
diversity and in-built mechanisms of repelling pathogens. It was also found to grow
luxuriously at altitudes of 500 to 2 000 m.a.s.l and rainfall of 500 to 1 800 mm in the
northern Mexico and Argentina (Gepts 1998).

13
Figure 2.3: Life cycle and morphology of the bean plant (Source:
http://pixgood.com/search.html) Accessed: 27 October 2014.
2.2.3 Importance of dry beans
Bean seed can be consumed raw or cooked, dried or boiled and it is one of the major
food security crops in South Africa. It can be processed into flour or spices and oil
(Halley and Taylor 1996). Dry beans is a high protein content crop which has the
capacity to substitute meat as a protein source for resource lacking people (Sidik et al.
2005). In Africa beans occupy 40% of produced market value crops. An increase is likely
as health organisations are encouraging its consumption as it decreases the risk of
cancerous, diabetic and cardiovascular diseases (David et al. 2000). Dry beans contains
crude protein (22.6%), crude fibre (4.2%), carbohydrate (57%) and micronutrients
recommended for a good diet by the World Health Organisation (FAOSTAT 2013).
14
Dry beans is a leguminous crop, implying that it has the capacity to fix atmospheric
nitrogen and does not require rhizobium inoculum at planting (Marco et al. 2006). This
biological aspect makes dry beans a good fit in crop rotations and intercropping
systems. The high producer prices for beans mean that it can be used as a cash crop,
thereby alleviating poverty in poor rural households.
2.3 Sweet Potatoes
2.3.1 Origin and history
Sweet potato originated from north western South America where it is commonly called
by names such as batata, camote, boniato, kumara and several others (Huaman 1992).
In IsiZulu, sweet potato is called mbatata and mbambaira in Zimbabwe (Kay 2011).
Linnaeus named the sweet potato species as Convolvulus batatas in the year 1753 and
later in 1791 a botanist named Lamarck then classified sweet potato using stigma shape
and surface of the pollen grains which then resulted in change of the name to Ipomoea
batatas (L) Lam. Thirteen wild species are identified in same genus with sweet potato,
among them are I. grandifolia, I. tabascana, I. trifida, I. triloba, I. tiliacea and I. lacunose.
Sweet potato was discovered by Christopher Columbus in Cuba and Hispaniola in
the year 1492 and introduced the crop to Europe through Spain. The Portuguese traders
introduced sweet potato to Africa from the Atlantic coast regions of America (Woolfe
1992). Africa on average produces 19.5 million tonnes of sweet potato which is 17.6%
world production share and South Africa 56 000 tonnes which represents 0.3% of the
total continent production (FAOSTAT 2013). The leading world producer is China
standing at 78 million tonnes as of 2012 (Statistics & Economic Analysis, DAFF 2012).
15
South Africa exports about 1 683 tonnes of sweet potato per year which is 0.48% of
world export and ranks at number 21 in the world according to Statistics and Economic
Analysis of Department of Agriculture Forestry and Fisheries of South Africa (2012).
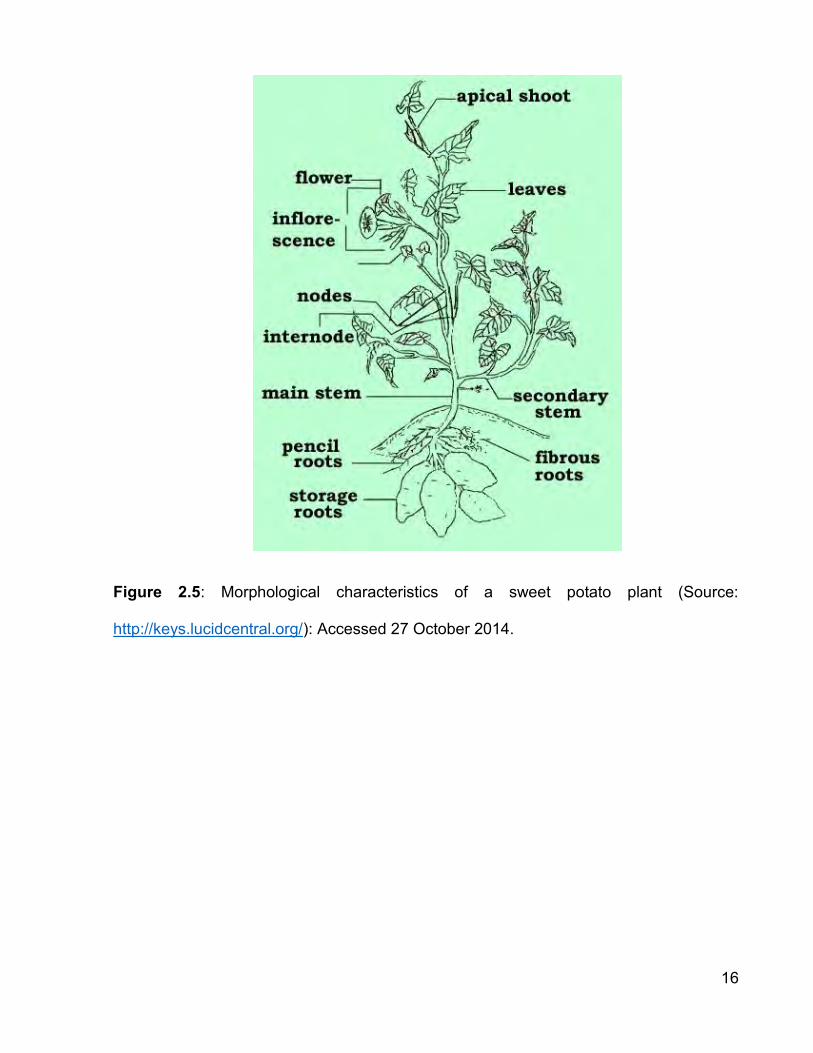
2.3.2 Botany and ecology
Sweet potato (Ipomoea batatas) is an herbaceous and perennial plant which is grown
through vegetative propagation using storage roots or stem cuttings. The growth habits
of a typical sweet potato plant are erect, semi-erect, horizontally spreading and widely
spreading types. The root system of sweet potato is characterised by storage roots and
fibrous roots which absorb water soluble nutrients and also provide anchorage to the
plant (Huaman 1992) (Figure 2.5).
Depending on sweet potato cultivar, flowering varies from no flower, to few and to
many (Figure 2.5). The flower is bisexual, containing the androecium and gynoecium.
Pollination occurs usually in the mornings, facilitated by bees. The crop takes between
90 to 180 days to mature depending on cultivar and climatic conditions under dry land
farming (DAFF 2011). Sweet potato is produced in the tropical climatic areas of the
world, the leading countries being in Asia, including China, producing above 80% of the
world crop (Titus 2008). In South Africa, the major sweet potato producing provinces are
Limpopo, Mpumalanga, KwaZulu Natal and Western Cape. (Department of Agriculture,
Forestry and Fisheries 2009).
16
Figure 2.5: Morphological characteristics of a sweet potato plant (Source:
http://keys.lucidcentral.org/): Accessed 27 October 2014.
17
2.3.3 Importance of sweet potato
Sweet potato can be made use of in several forms, with the tuber being consumed raw,
boiled, as porridge or pounded into flour. Sweet potato varies in flesh and skin colour,
texture, leaf shape and vine length. The orange flesh type sweet potato contains high
vitamins A and C, and fibre, while vitamin B and minerals are found more in white
fleshed type. The purple sweet potato contains more of antioxidants than vitamin A
(Pleasant 2014). Sweet potato contains crude protein (1.5%), crude fibre (0.8%),
carbohydrates (25.6%) and micronutrients essential for human health as recommended
by the World Health Organisation (FAOSTAT 2013). The leaves are also consumed as
vegetable relish. It is ranked as the third staple food in seven countries of Eastern and
Central Africa after cassava and maize (International Potato Center 2013). It has a long
shelf life of about two to three months which is advantageous for resource poor people
who have no specialised food storage equipment (Wang et al. 1999). It is generally a
high yielding crop (i.e. gives more tonnage per unit area of land) as compared to most
crops grown by small-scale farmers in southern Africa. Sweet potato can be processed
into starch for industrial products due to its high starch content. The vines or herbage is
a source of high protein animal feed. Some of the products of sweet potato are flour,
dried chips, juice, bread, noodles, candy, biodegradable automobile plastics parts,
liquors and pectin (Srisuwan et al. 2006, International Potato Center 2013).
2.4 Plant Growth and Development
Plant growth is defined as the irreversible increase in mass that results from cell division
and cell expansion (Anjum et al. 2011). Meristematic cell divisions give rise to daughter

18
cells which result in growth through the multiplication of many young cells (Nonami
1998). Plant growth and yield traits are determined by the level of mitosis (Hussain et al.
2008). Plant growth contributes wholly to the increase of fresh and dry matter (Zhao et
al. 2006). Development on the other hand is the sum of all changes that the plant goes
through in its life cycle. It is as a result of growth and differentiation. Plant growth and
development are controlled by three factors which are genetic control, hormonal control
and lastly environmental stimuli (Xiong et al. 2006).
2.4.1 Factors affecting plant growth and development
In Africa major crop losses and reduction in crop yields are usually caused by extremes
in environmental factors. Studies on effects of planting dates on crop growth and
development reported that temperature and water were the most important
environmental factors influencing success or failure of the cropping season (Tsimba et
al. 2013). Subsistence farmers are the most affected as they lack resources to create
micro-climate structures to counter temperature and water stresses (Coe and Stern
2011).
2.4.1.1 Temperature
Temperature is known to affect growth and development processes but optimum
atmospheric temperature varies with processes. Seedling emergence and establishment
are critical stages in crop production which when plants are subjected to either
extremely low temperatures, germination may be delayed or extremely high
temperatures seedling mortality can occur due to seedbed dryness caused by too much
heat (Johnson and Asay 1993). Awal and Ikeda (2001) reported that the rate of peanut
19
seedling emergence increased by approximately 1.4 calendar days for every 1°C rise in
soil temperature. Temperatures may also have an effect on vegetative growth for
example in maize.
Al-Darby and Lowery (1987) reported that low temperatures experienced during early
planting resulted in shorter maize plants with fewer leaves. Temperatures below 18ºC
and above 25ºC reduced leaf area index, in the same crop. A study in New Zealand
showed similar result that temperature ranges of approximately 15 – 17 ºC under early
planting conditions reduced leaf area index. Temperatures below 8°C or over 40°C may
result in cessation of crop development (Fournier and Andrieu 2000).
According to Grant et al. (1989), grain yield is related to kernel number at harvest
and it is a yield component which relies on the physiological condition of the crop during
flowering. The latter has been observed by (Rattalino Edreira and Otegui 2013) where
heat stress before silking reduced potential kernel number per plant than after silking. In
maize, high temperatures reduced the period from silking to physiological maturity,
speeding up leaf senescence thereby restricting grain formation resulting in low grain
mass (Birch et al. 2003). Generally, when maize plants were grown under high
temperatures there was a decrease in whole plant dry matter accumulation (Badu-
Apraku et al. 1983).
2.4.1.2 Water
Water being one of the major requirements for plant growth and development can cause
losses to crop yields if water deficits occur. The water deficit can be temporary or
permanent severely hindering plant growth greater than any other environmental factor
(Anjum et al. 2011). A crop can be affected by water stress when water becomes
unavailable to the roots or transpiration rate exceeds plant water uptake rate which
20
impacts negatively on growth, yield, membrane integrity, pigment content, osmotic
adjustment, water relations and photosynthetic activity (Praba et al. 2009). Drought also
creates a condition whereby plants cannot absorb enough mineral resources due to lack
of water for solubility (Poorter and Nagel 2000).
In Papua New Guinea, the marketable sweet potato tuber yields were observed to be
significantly correlated to rainfall thus the more rain the higher the yield (Alfred et al.
2000). Faba bean grown under adequate water produced higher pod yield (4.6 – 7.6 t
ha-1) compared to those grown under water deficit (1.4 – 5.4 t ha-1) (Husain et al. 1983).
They further reported that faba beans grown under water deficit were characterised by
reduced rate of shoot elongation and leaf expansion, smaller leaf area and favoured root
over shoot growth. Similar behaviour was reported by Xia (1994) in the same crop.
Lizana (2006) reported that water stress resulted in reductions of 72% pods plant-1, 32%
seed pod-1 and 83% decrease in grain yield of common bean.
The effect of water stress on yield also depended on duration of stress and the plant
growth stage at which the stress occurred. El Nadi (1969) reported that faba bean was
more sensitive to water stress at flowering than vegetative phase. Xia (1994) and
Mwanamwenge et al. (1998) observed that water stress occurring in faba bean at early
podding phase caused 50% reduction in seed yield. The seed number per plant and
pods diminished by 38% when water stress occurred after flowering. They concluded
that faba bean was more sensitive to water stress during podding than any other
phenological stage. In cotton, water stress during the reproductive phase caused the
highest yield decrease (Pettigrew 2004). However, in barley post-anthesis water stress
caused the highest reductions in barley tillers, spikes, number of grains per plant, grain
mass and the final grain yield (Samarah 2005).
21
2.5 Drought and Water Scarcity
Drought refers to the lack of rainfall or extended period of dryness or extremely low
rainfall which results in devastating effects on crops, humans and animal lives. Drought
may be classified as meteorological, agronomic, physiological or hydrological depending
on the field use of water (Dracup and Piechota 1999, Wesley et al. 2002).
Meteorological drought refers to the period with no adequate rainfall recorded
statistically in an area per annum (Shao et al. 2009). Soil water declines and the
atmospheric conditions continue to cause water deficit through transpiration or
evaporation. Agronomic drought which refers to when there is insufficient soil water to
meet crop water requirements (Rosenberg 1979). The lack of adequate rainfall leads to
soil water deficit which results in poor crop production.
Drought severely affects dry land farming resulting in food price increases
exacerbating the already poor nutritional levels of communities and overburdening of the
social budget (Passioura 2007). Generally, South Africa is classified as a dry country
due to lack of adequate rainfall in most parts of the country (Otieno and Ochieng 2004).
In South Africa, 65% of the country receives less than 500 mm and an average national
rainfall of 450 mm a year which is far below than the world average of 860 mm. (South
Africa Yearbook 2010/11). South Africa receives 200 mm of rainfall in the west part
which is 21% of the country land size. The pattern of rainfall occurrence is known as
unpredictable and unreliable which poses uncertainty challenges in agriculture (Bennie
and Hensley 2001). There is high frequency of prolonged drought which affects crop
production through water stress and sometimes the dry spell terminates accompanied
22
by severe floods which damage crops causing reduction in yields (South Africa
Yearbook 2012/2013).
2.6 Crop Responses to Water Stress
Once plants are exposed to water stress, they begin to respond in defence for survival.
The shortage of water at any stage of plant growth may cause molecular and
morphological effects. Plant responses vary according to plant species, phase of
development, degree and period of water stress (Lisar et al. 2012).
2.6.1. Plant growth responses
In response to drought, plants restrict the leaf size and number as a mechanism to cope
with limited water availability through minimizing water loss through transpiration. If
drought occurs when a crop has a large leaf area, the leaf desiccates and plucks off the
leaf (leaf abscission) and finally the whole plant dies if water stress becomes terminal.
The attainment of normal growth, flowering and ultimately reasonable yields under water
stress conditions is considered useful in crops under rain-fed conditions (Beck et al.
2007). In crops such as sorghum there was a 14 to 16% reduction in canopy
photosynthesis, the older leaves systematically senesce while the young ones retain
turgidity, stomatal conductance and assimilation (Blum 2004). Such a drought response
mechanism provides an opportunity for the increase in harvest index (Chaves et al.
2002).
In the event that drought is gradually occurring in a season plants can escape
dehydration by cutting short their life cycle (Blum 2004). This mechanism is known as
drought escape. Water stress has been reported to cause early flowering, shorter
23
flowering duration and ultimately early maturity. Similar effect was observed in potato by
Heuer and Nadlet (1995) and also reported on soya bean by (Specht et al. 2001). When
bean plants were grown under adequate water they favoured vegetative growth instead
of yield formation, while plants grown under water stress flowered earlier. The tendency
to favour vegetative growth had negative implications on harvest yield where dry matter
accumulation was observed in the vegetative parts compared to yield components (De
Costa et al. 1996). Drought escape mechanism was adopted by breeders were they
bred for short season varieties which flower early and produce an economic yield in the
peak of a doubtful rainfall season before rain peters off (Araus et al. 2002). The short
season crop practice has been widely adopted in dry arid regions with substantial results
(Kumar and Abbo 2001).
2.7 Mitigating Water Stress: Planting Date Selection
According to Blum (1982) the effects of drought can be mitigated by various
management practices including crop diversification and proper selection of planting
date. In drought prone area, maximum grain yields are attained when maize is planted
early season thus avoiding the flowering and grain filling phases coinciding with mid-
season drought (Khokhar et al. 2010). In environments with dry summers the effects of
extreme drought events were masked by early planting; early planting allows roots to
develop to depth before soil water reserves become limiting (Kgasago 2006, Hu and
Wiatrak 2012, Tsimba et al. 2013). However this is affected by climate change and
changes in seasonal patterns of rainfall (Pathak et al. 2012) hence there is need for a
24
recent study in Makhathini assessing the possibility of mitigating drought through
planting date selection.
2.8 Conclusion
Sweet potato, maize and dry beans are important crops in Africa. They contribute to
food and nutritional security, especially amongst subsistence farmers in semi and arid
parts of the continent. The challenge still remains of low crop yield and sometimes crop
failure due to poor choice of planting date. Traditionally known planting dates have been
affected by shifting rainfall patterns, changes in rainfall distribution and temperatures.
Crop yield is influenced by water availability of which the review has shown drought is a
major threat in South Africa. There is a need to evaluate the performance of the three
crops under different planting dates in order to minimize the effects of temperature and
drought associated with planting dates. It would generate information useful in advising
farmers on optimal planting dates for the different crops in order to maximize yield.

25
CHAPTER 3
Materials and methods
3.1 Plant Material
3.1.1 Maize
Seed of maize variety SC701 (Seed Co, Zimbabwe) was sourced from Pongola. SC701
is a medium to late maturing variety which may be grown for green maize or grain
depending on the farmer’s target market. The grain is white in colour with a yield
potential of 3 - 7 tonnes per hectare. SC701 takes 150 days to physiological maturity
temperate areas. The maize variety also takes 78 days to 50%. SC701 has high prolific
and disease resistance especially to common rust and diplodia.
3.1.2 Dry beans
Speckled dry beans locally named Ukulinga was purchased from Pietermaritzburg. The
cultivar was jointly bred by McDonald seeds and Pro-Seed Company. Ukulinga is a late
maturing (120 days) upright bushy variety of high yielding and remarkable disease
resistance character and has large seed size of 52 g per 100 seed. The variety is also
resistant to lodging, shattering, mosaic virus and fungal diseases such as rust and
angular leaf spot. When mature, the large pods show red markings in appearance. The
Ukulinga bean is a dry field bean which is a medium to long season cultivar.
26
3.1.3 Sweet potatoes
Sweet potato A40 cultivar (University of KwaZulu Natal, South Africa) was propagated
by cuttings sourced from Makhathini Agricultural Research station. The sweet potato has
white skin with white flesh and is a medium to long season variety which reaches
maturity at about 120 days. It has a yield potential of 35 tonnes ha-1. It is also resistant to
Alternaria blight.
3.2 Description of Experimental Site
Field trials were conducted at Makhathini Research Station (27°24’ S; 32°11’E; 69 m
a.s.l) in the irrigation scheme of Umkhanyakude district of KwaZulu–Natal province
during the summer season of 2013/2014. The average rainfall of the area is 500 mm per
annum with average temperatures of 34°C and extremes of around 48°C in summer.
The area is flat land with fluvisols located in alluvium deposits and naturally fertile soils
with minimal drainage and runoff. The soils are 22% clay content with a pH value of 5.52
and 1% acid saturation. The soils have deficiencies of nitrogen and phosphorus for
bean, maize and sweet potato production. Weather parameters were monitored by an
automatic weather station (AWS) (ARC – Institute for Soil, Climate and Water) situated
within the research station.
3.3 Experimental Design
The experimental design was split-plot design arranged in a randomised complete block
design (RCBD) with three replications. Main plots were allocated to the planting dates
27
and there were three crops treated separately. The experiments included three crops:
maize, sweet potato and dry beans. The experiment was conducted under rain-fed
conditions. There were four planting dates as follows: first – 20th of November 2013,
second – 18th of December 2013, third – 16 of January 2014 and fourth – 19th of
February 2014. The selection of the four planting dates was based on the existing
cropping practice by the subsistence farmers at Makhathini area. For each planting date,
the main plot size was 18 m x 18 m (324 m2) and individual plots, for all crops, were 5 m
x 5 m (25 m2). Spacing between plots was 1.5 m. Plant populations used for each crop
were based on recommended populations under rain-fed farming maize 22 500 plants
ha-1, beans 115 000 plants ha-1 and sweet potato 30 000 plants ha-1. Therefore; for
maize plant spacing was 0.75 m between rows and 0.5 m within rows translating to 77
plants per plot, 45 plants being experimental units. For sweet potatoes, plant spacing
was 0.90 m between rows and 0.3 m within rows translating to 102 plants per plot, 60
plants being experimental units. For dry beans, plant spacing was 0.75 m between rows
and 0.15 m within rows translating to 238 plants per plot, 170 plants being experimental
units.
3.4 Land Preparation and Crop Management
Land preparation for all three crops involved disking and rotovating the fields to achieve
a fine seedbed. Prior to planting, soil samples were taken and submitted for soil textural
and fertility analyses at KZN Department of Agriculture and Environmental Affairs; Soil
Analytical Services, Pietermaritzburg. Results of soil fertility analysis revealed that there
was need for fertiliser application to meet all the crops’ requirements for macro and
28
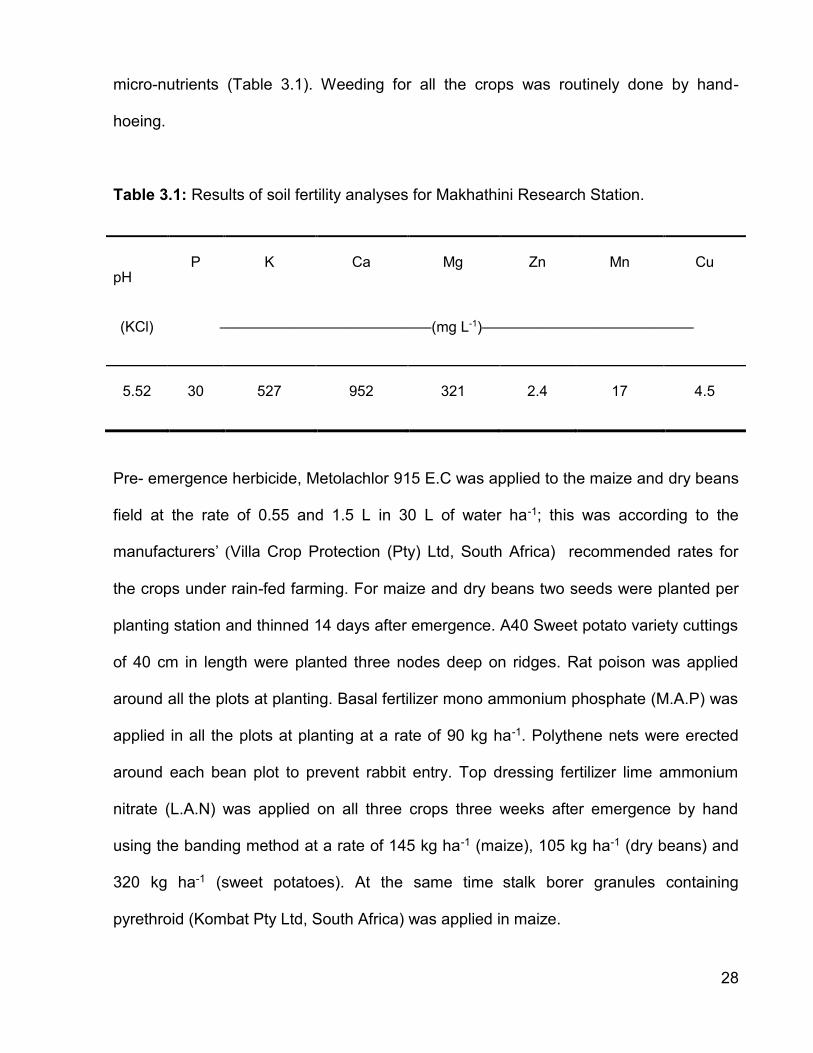
micro-nutrients (Table 3.1). Weeding for all the crops was routinely done by hand-
hoeing.
Table 3.1: Results of soil fertility analyses for Makhathini Research Station.
pH
(KCl)
P K Ca Mg Zn Mn Cu
––––––––––––––––––––––––––(mg L-1)––––––––––––––––––––––––––
5.52 30 527 952 321 2.4 17 4.5
Pre- emergence herbicide, Metolachlor 915 E.C was applied to the maize and dry beans
field at the rate of 0.55 and 1.5 L in 30 L of water ha-1; this was according to the
manufacturers’ (Villa Crop Protection (Pty) Ltd, South Africa) recommended rates for
the crops under rain-fed farming. For maize and dry beans two seeds were planted per
planting station and thinned 14 days after emergence. A40 Sweet potato variety cuttings
of 40 cm in length were planted three nodes deep on ridges. Rat poison was applied
around all the plots at planting. Basal fertilizer mono ammonium phosphate (M.A.P) was
applied in all the plots at planting at a rate of 90 kg ha-1. Polythene nets were erected
around each bean plot to prevent rabbit entry. Top dressing fertilizer lime ammonium
nitrate (L.A.N) was applied on all three crops three weeks after emergence by hand
using the banding method at a rate of 145 kg ha-1 (maize), 105 kg ha-1 (dry beans) and
320 kg ha-1 (sweet potatoes). At the same time stalk borer granules containing
pyrethroid (Kombat Pty Ltd, South Africa) was applied in maize.

29
3.5 Data Collection
3.5.1 Maize
Data collected during the trials included seedling emergence, weekly plant height and
leaf number after establishment and fortnight biomass accumulation. Timing of key
phenological events (days to seedling establishment, tasselling, silking and maturity)
were monitored weekly. Emergence was defined as protrusion (20 mm) of the coleoptile
through the soil. Plant height (cm) was measured from the base of the plant to where the
tassel branching begins. A leaf was counted when it was fully expanded with visible leaf
collar. Biomass accumulation (g) was measured using a digital scale GM-500 (Lutron
Electronic, USA) on a plant destructively sampled (8 plants per plot) from the border
rows. Time to establishment was defined as the number of days from planting taken for
90% of the plants in a plot to emerge. Time to tasseling was defined as number of days
taken from planting to when 50% of the plants in a plot had emerged tassels. Time to
silking was defined as the number of days from planting to when 50% of the plants in a
plot had emerged silks. Maturity was defined on the basis of harvest maturity (when
plants seemed to be sufficiently dry) not physiological maturity. Data collected at harvest
were; total biomass, grain biomass (economic yield), ear size characteristics, kernel
rows per ear and kernel number per row. Thereafter, harvest index was obtained by
dividing economic yield with total above ground biomass.

30
3.5.2 Sweet potatoes
Sweet potato plants were allowed two weeks for establishment (growth of fibrous roots)
before data collection commenced. Data collected during the trial were weekly, leaf
number and vine length (cm). Timing of key phenological events (days to flowering and
maturity) was monitored weekly during the trial. Vine length was measured from the
base of the plant to the apex of the longest vine. A leaf was counted after it was fully
expanded. Time to flowering was defined as when 50% of the plants in the plot had at
least one open flower. Maturity was defined as when total leaf area stayed constant and
then began to decline. At harvest data collected were; whole plant biomass (g), above
ground biomass (g) as well below ground biomass (g) (marketable yield). Thereafter,
harvest index was determined as the ratio between marketable yield and whole plant
biomass.
3.5.3 Dry beans
Emergence will be defined as protrusion of the coleoptile through the soil. This was
carried out daily, until 90% emergence or until there was no new emergence. Data
collected during the trial were plant height (cm), leaf number and biomass accumulation.
Timing of key phenological events (days to flowering, podding and maturity) was
monitored weekly. Plant height was measured from the ground to the highest point of
the crop. A leaf was counted when the trifoliate was fully developed and expanded. At
harvest yield data collected included total biomass (g) and grain yield (g). Thereafter,
harvest index was determined as the ratio between grain yield and whole plant biomass.
31
3.6 Statistical Analyses
Data collected were subjected to analysis of variance (ANOVA) using GenStat® Version
16 (VSN International Ltd, UK) at the 5% level of significance (see Appendix section).
Means of significantly different variables were separated using the least significant
difference (LSD) test.
32
Chapter 4
Results
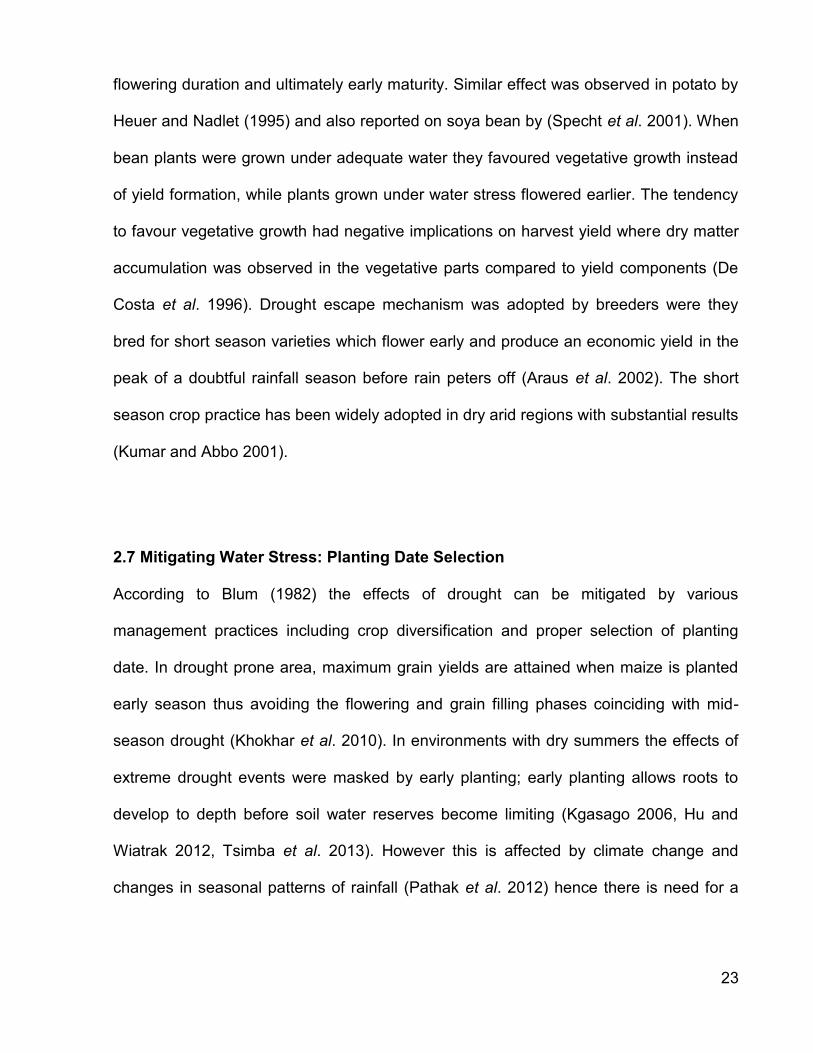
4.1. Weather Parameters
Observed weather data for the duration of the trials showed that temperatures were
relatively high. During the first planting date, minimum temperatures were ≈15°C while
maximum temperatures ranged between 25°C and 40°C. During the first 40 days after
planting, between 5 mm and 20 mm of rainfall were received over a period of five days.
Thereafter, there was a dry period between 40 and 60 days after planting and also
between 80 and 95 days after planting. At the end of the first growing season (between
100 and 105 days after planting) 50 mm of rainfall had been received.
The second planting date season received less than 50 mm of rainfall during the first
two months. There was a hailstorm 82 days after planting during which 110 mm of
rainfall were received. A heavy downpour also occurred 52 days after planting during the
third growing season. The third planting date experienced an extremely dry period (< 5
mm) 68 days after planting up to the end of the growing season. During the fourth
planting date, a flash flood (110 mm in a day) was experienced 17 days after planting.
Thereafter, from 32 days after planting up to the end of the trial, only 5 mm cumulative
rainfall was recorded. Minimum temperatures during this period also dropped from
≈15°C to ≈10°C (Figure 4.1).

33
Figure 4.1: Changes in daily weather parameters (Tmax, Tmin and rain) observed
during the four planting dates: A – Planting date 1; B – Planting date 2; C – Planting
date 3; and D – Planting date 4 at Makhathini Research Station.

34
4.2 Growth, development and yield of maize as affected by planting date
4.2.1 Emergence and Growth
Significant differences (P<0.05) were observed between planting dates with respect to
emergence. The interaction between planting dates and time was highly significantly
different (P<0.001) (Fig 4.2). The highest emergence (98%) was observed in the third
planting date while the lowest seedling emergence (86%) was observed in the second
planting date.
Figure 4.2: Weekly emergence of maize seeds planted on four different planting dates
(first – 20th of November 2013; second – 18th of December 2013; third – 16 of January
2014; and fourth – 19th of February 2014).
35
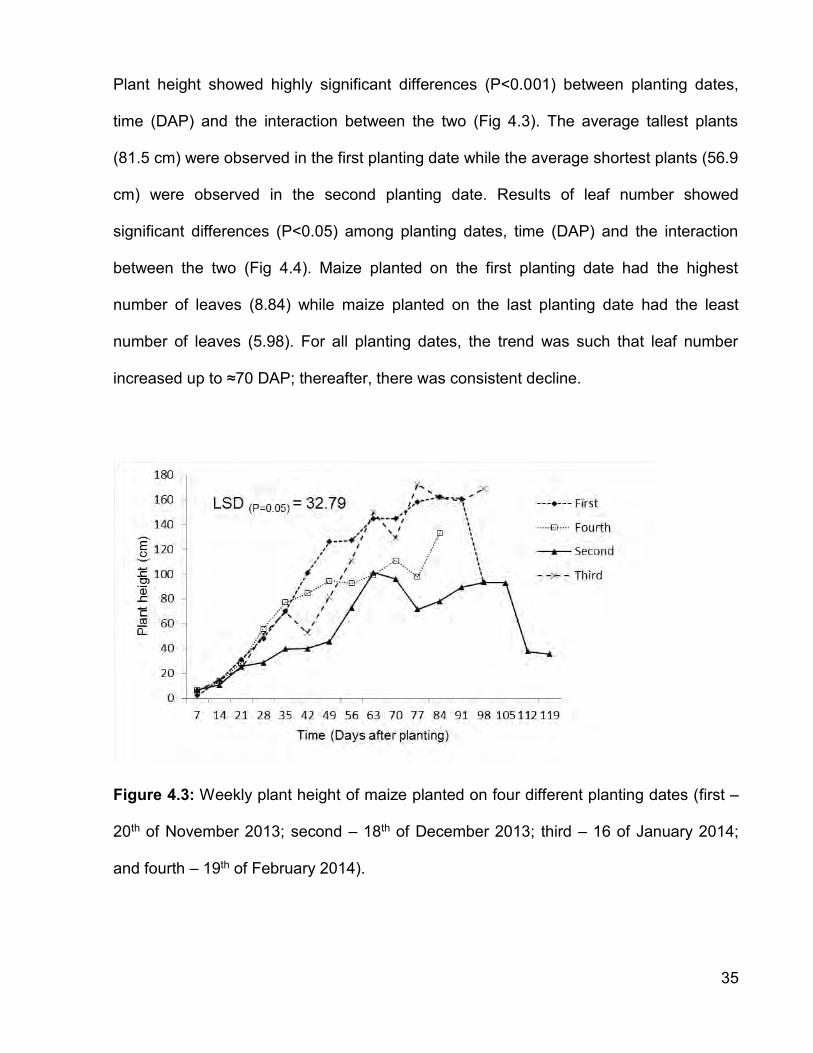
Plant height showed highly significant differences (P<0.001) between planting dates,
time (DAP) and the interaction between the two (Fig 4.3). The average tallest plants
(81.5 cm) were observed in the first planting date while the average shortest plants (56.9
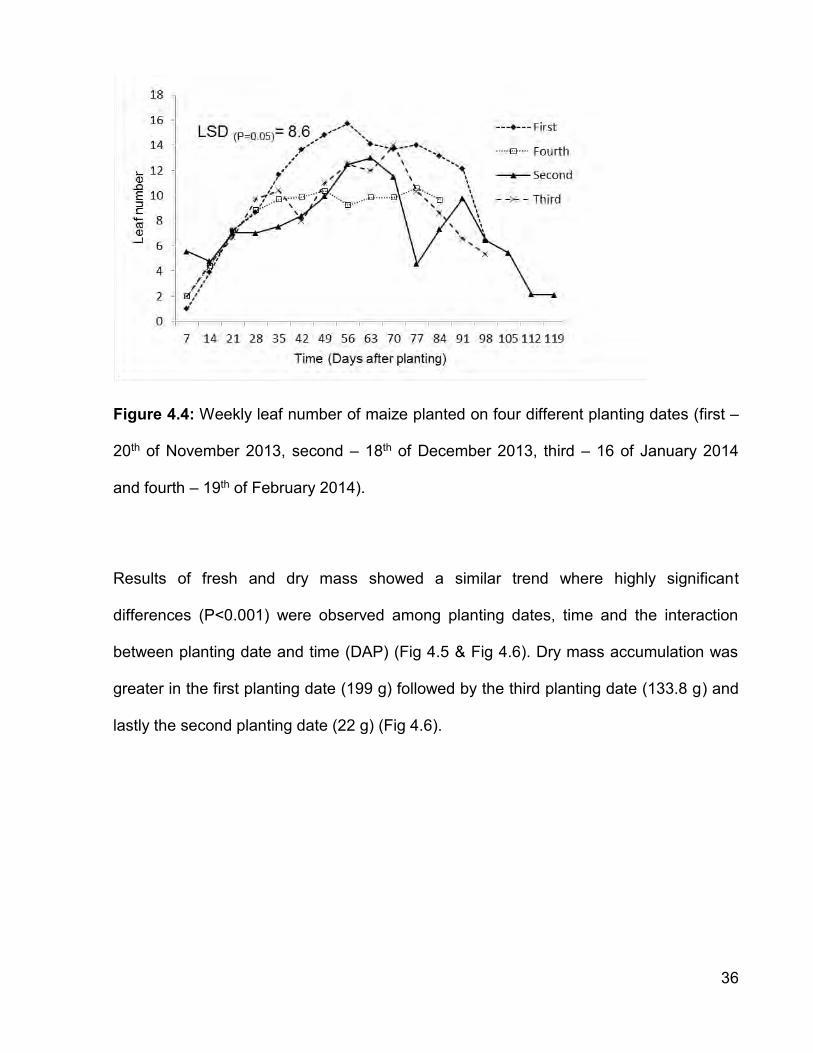
cm) were observed in the second planting date. Results of leaf number showed
significant differences (P<0.05) among planting dates, time (DAP) and the interaction
between the two (Fig 4.4). Maize planted on the first planting date had the highest
number of leaves (8.84) while maize planted on the last planting date had the least
number of leaves (5.98). For all planting dates, the trend was such that leaf number
increased up to ≈70 DAP; thereafter, there was consistent decline.
Figure 4.3: Weekly plant height of maize planted on four different planting dates (first –
20th of November 2013; second – 18th of December 2013; third – 16 of January 2014;
and fourth – 19th of February 2014).
36
Figure 4.4: Weekly leaf number of maize planted on four different planting dates (first –
20th of November 2013, second – 18th of December 2013, third – 16 of January 2014
and fourth – 19th of February 2014).
Results of fresh and dry mass showed a similar trend where highly significant
differences (P<0.001) were observed among planting dates, time and the interaction
between planting date and time (DAP) (Fig 4.5 & Fig 4.6). Dry mass accumulation was
greater in the first planting date (199 g) followed by the third planting date (133.8 g) and
lastly the second planting date (22 g) (Fig 4.6).
37
Figure 4.5: Fortnight whole plant fresh mass (g) plant-1 of maize planted on four
different planting dates (first – 20th of November 2013; second – 18th of December 2013;
third – 16 of January 2014; and fourth – 19th of February 2014).
Figure 4.6: Fortnight whole plant dry mass (g) plant-1 of maize planted on four different
planting dates (first – 20th of November 2013; second – 18th of December 2013; third –
16 of January 2014; and fourth – 19th of February 2014).
38
4.2.2 Phenology
No significant differences were observed (P>0.05) in time to establishment and time to
tasseling for the four planting dates. Although not statistically different, emergence was
shown to occur earlier in the third and fourth planting dates compared to the first and
second last planting dates, respectively (Table 4.1). This trend was also similar with
respect to tasseling; plants tasselled earlier in the third and fourth planting dates
compared with the first and second planting dates, respectively (Table 4.1). Time to
silking and time to maturity varied significantly (P<0.001) among planting dates. For the
second planting date, plants did not reach the silking stage because they succumbed to
water stress soon after tasseling hence no results are reported for times to silking and
maturity (Table 4.1). Interestingly, despite plants showing faster development in the third
and fourth planting dates, results showed that they matured later than plants during the
first planting date (Table 4.1).
39
Table 4.1: Phenology of maize when planted on four different planting dates (first – 20th
of November 2013, second – 18th of December 2013, third – 16 of January 2014 and
fourth – 19th of February 2014).
Planting date
Time to establishment
Time to tasseling Time to silking
Time to maturity
–––––––––––––––––––––––(days)–––––––––––––––––––––––
First 6a 60a 67a 100a
Second 7.67a 65.3b – –
Third 5.67a 56a 63a 130b
Fourth 5.67a 58a 65a 108a
LSD(P=0.05) 1.91 7.73 5.31 9.99
F Pr. 0.117 0.106 <0.001 <0.001
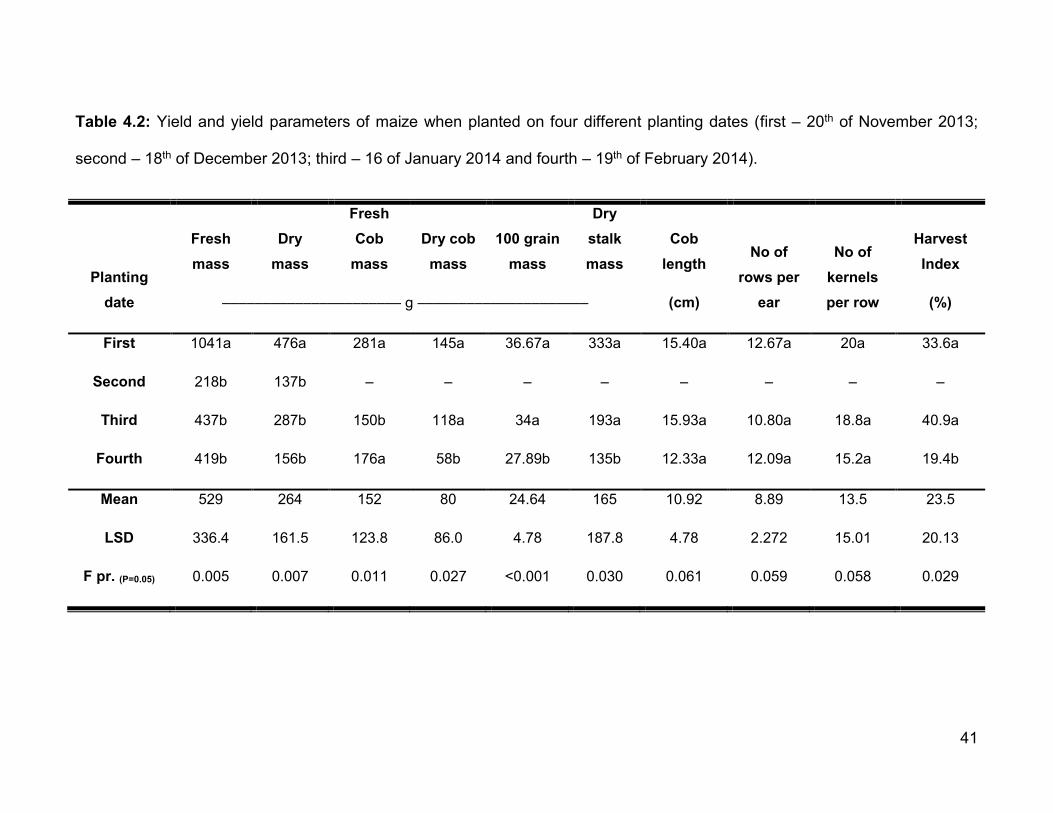
4.2.3 Harvest Parameters
Results of fresh mass, dry mass, fresh cob mass, dry cob mass and dry stalk mass
differed significantly (P<0.05) among planting dates (Table 4.2). Fresh and dry mass
accumulation was more than 100% in the first planting date compared to the other
planting dates. Whole plant fresh and dry mass were the only parameters measured for
the second planting date; there was no economic yield. Fresh cob mass was 281 g per
plant in the first planting date, 150 g in the fourth planting date and 150 g in the third
planting date, respectively (Table 4.2). Dry cob mass did not follow the same pattern; the
trend was such that first planting > third planting > fourth planting. Cob length also had a
different pattern; longer cobs were observed in the third planting (15.93 cm) followed by
the first planting (15.40 cm) then lastly the fourth planting (12.33 cm). Results of 100
40
grain mass and number of kernel rows per ear showed highly significant differences
(P<0.001) among planting dates. The 100 grain mass was such that the first planting
date (36.67 g) > the third planting date (34 g) > the fourth planting date (27.89 g).
Number of kernels per row showed no significant differences between the planting
dates. Lastly, harvest index differed significantly (P<0.05) among planting dates. Results
showed that harvest index was higher for the third planting date (40.9%), followed by the
first planting date (33.6%) and lastly the fourth planting date (19.4%).
41
Table 4.2: Yield and yield parameters of maize when planted on four different planting dates (first – 20th of November 2013;
second – 18th of December 2013; third – 16 of January 2014 and fourth – 19th of February 2014).
Planting date
Fresh mass
Dry mass
Fresh Cob
mass Dry cob
mass 100 grain
mass
Dry stalk mass
Cob length
No of rows per
ear
No of kernels per row
Harvest Index
–––––––––––––––––––––– g ––––––––––––––––––––– (cm) (%)
First 1041a 476a 281a 145a 36.67a 333a 15.40a 12.67a 20a 33.6a
Second 218b 137b – – – – – – – –
Third 437b 287b 150b 118a 34a 193a 15.93a 10.80a 18.8a 40.9a
Fourth 419b 156b 176a 58b 27.89b 135b 12.33a 12.09a 15.2a 19.4b
Mean 529 264 152 80 24.64 165 10.92 8.89 13.5 23.5
LSD 336.4 161.5 123.8 86.0 4.78 187.8 4.78 2.272 15.01 20.13
F pr. (P=0.05) 0.005 0.007 0.011 0.027 <0.001 0.030 0.061 0.059 0.058 0.029

42
4.3 Growth, development and yield of sweet potato as affected by planting date
4.3.1 Growth and phenology
Results of sweet potato weekly leaf number showed significant differences (P<0.05)
among planting dates, time (DAP) and the interaction between the two (Fig 4.7). The
first planting date trial failed 35 days after planting while the third and fourth planting
date trials failed immediately after planting. Only the second planting date trial
survived; therefore results reported here are for the second planting date only. Leaf
number increased with time reaching up to 280 leaves at the end of the experiment.
During the second planting, plant height increased over time mimicking the sigmoid
growth curve. During the second planting season, the time taken to flowering was
102 days after planting while the time taken to maturity was 154 days after planting.
Figure 4.7: Weekly leaf number of sweet potato plants planted on two different
planting dates (first – 20th of November 2013 and second – 18th of December 2013).
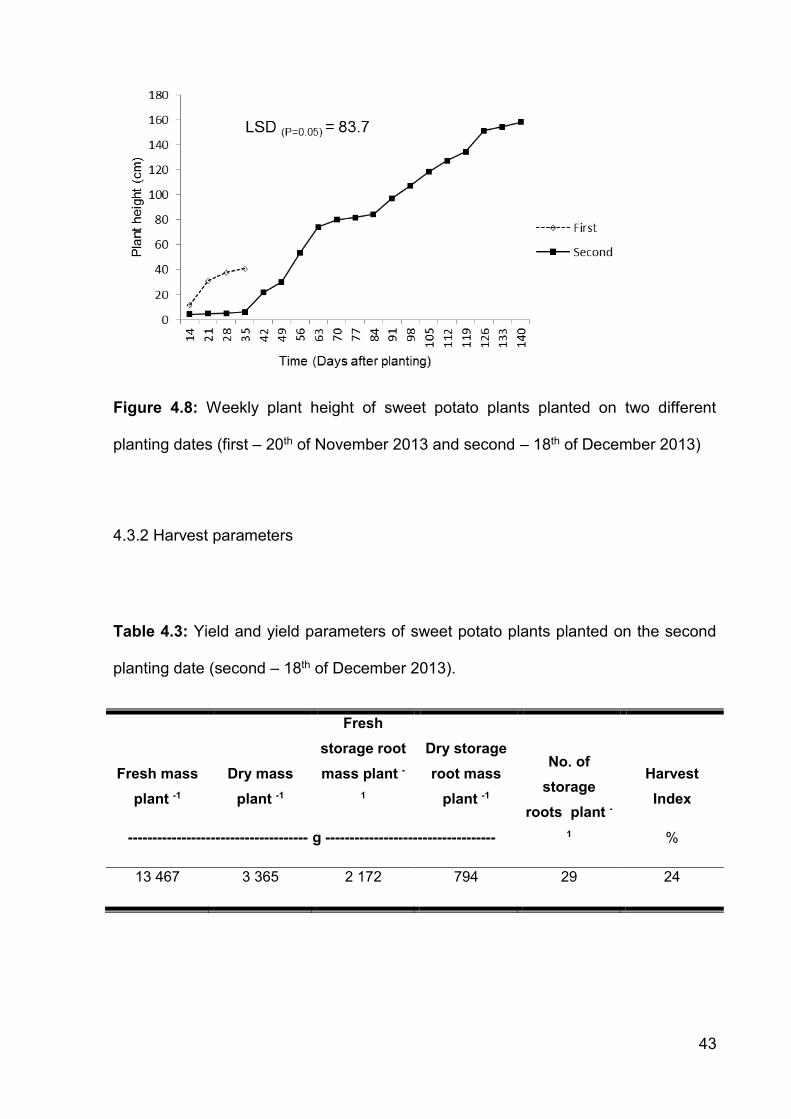
43
Figure 4.8: Weekly plant height of sweet potato plants planted on two different
planting dates (first – 20th of November 2013 and second – 18th of December 2013)
4.3.2 Harvest parameters
Table 4.3: Yield and yield parameters of sweet potato plants planted on the second
planting date (second – 18th of December 2013).
Fresh mass plant -1
Dry mass plant -1
Fresh storage root mass plant -
1
Dry storage root mass
plant -1
No. of storage
roots plant -1
Harvest Index
------------------------------------- g ----------------------------------- %
13 467 3 365 2 172 794 29 24
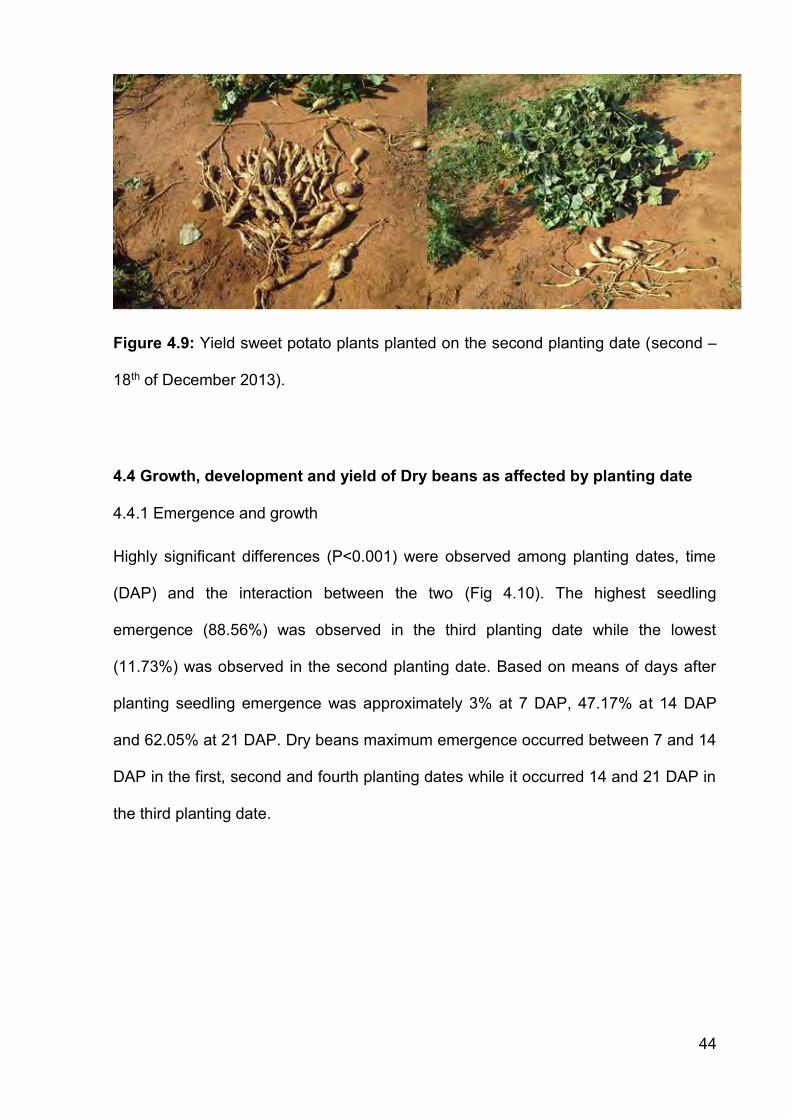
44
Figure 4.9: Yield sweet potato plants planted on the second planting date (second –
18th of December 2013).
4.4 Growth, development and yield of Dry beans as affected by planting date
4.4.1 Emergence and growth
Highly significant differences (P<0.001) were observed among planting dates, time
(DAP) and the interaction between the two (Fig 4.10). The highest seedling
emergence (88.56%) was observed in the third planting date while the lowest
(11.73%) was observed in the second planting date. Based on means of days after
planting seedling emergence was approximately 3% at 7 DAP, 47.17% at 14 DAP
and 62.05% at 21 DAP. Dry beans maximum emergence occurred between 7 and 14
DAP in the first, second and fourth planting dates while it occurred 14 and 21 DAP in
the third planting date.
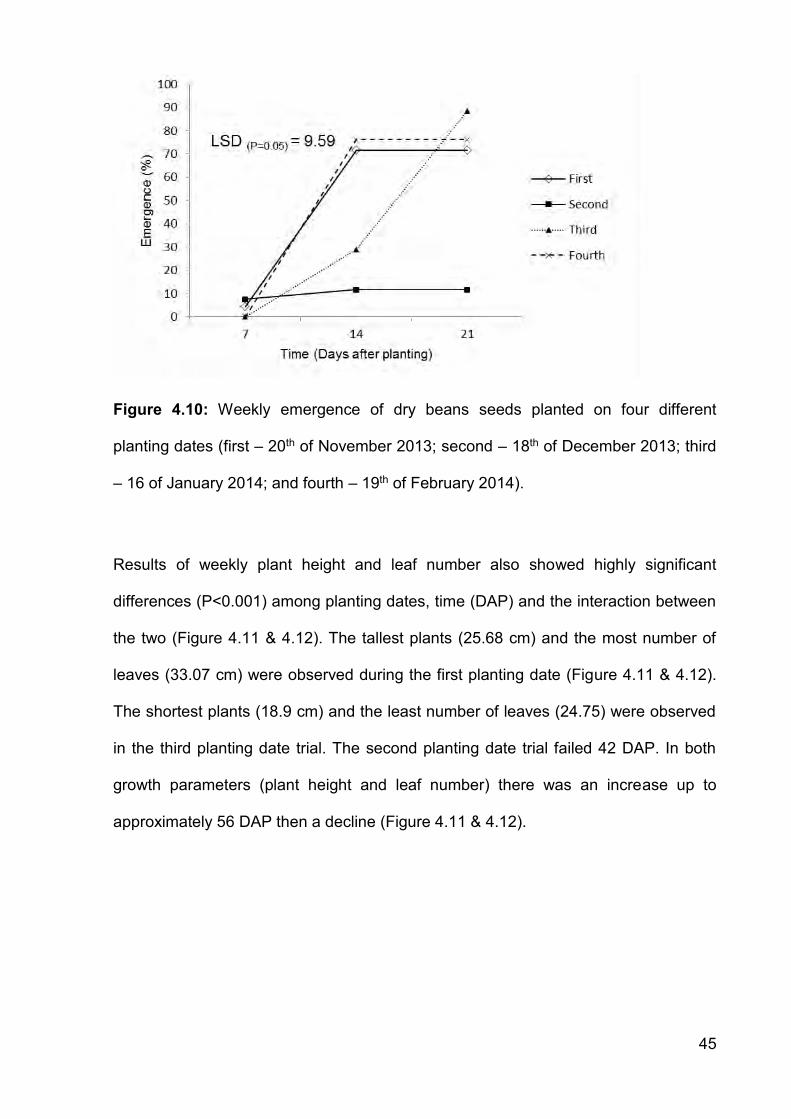
45
Figure 4.10: Weekly emergence of dry beans seeds planted on four different
planting dates (first – 20th of November 2013; second – 18th of December 2013; third
– 16 of January 2014; and fourth – 19th of February 2014).
Results of weekly plant height and leaf number also showed highly significant
differences (P<0.001) among planting dates, time (DAP) and the interaction between
the two (Figure 4.11 & 4.12). The tallest plants (25.68 cm) and the most number of
leaves (33.07 cm) were observed during the first planting date (Figure 4.11 & 4.12).
The shortest plants (18.9 cm) and the least number of leaves (24.75) were observed
in the third planting date trial. The second planting date trial failed 42 DAP. In both
growth parameters (plant height and leaf number) there was an increase up to
approximately 56 DAP then a decline (Figure 4.11 & 4.12).

46
Figure 4.11: Weekly plant height of dry beans planted on four different planting dates
(first – 20th of November 2013, second – 18th of December 2013, third – 16 of
January 2014 and fourth – 19th of February 2014).
Figure 4.12: Weekly leaf number of dry beans planted on four different planting
dates (first – 20th of November 2013; second – 18th of December 2013; third – 16 of
January 2014; and fourth – 19th of February 2014).

47
Results of fortnightly fresh and dry mass differed significantly (P<0.05) among
planting dates, time and the interaction between planting dates and time (Fig 4.13 &
Fig 4.14). Means of planting dates did not follow the same trend as plant growth
parameters. The highest fresh (FM) (32 g) and dry mass (DM) (10.21 g) were
observed during the fourth planting date followed by the first planting date (FM = 22.6
g; DM = 4.63 g) and then lastly the third planting date (FM = 12.8 g; DM = 3.61 g).
Figure 4.13: Fortnightly whole plant fresh mass of dry beans planted on four different
planting dates (first – 20th of November 2013; second – 18th of December 2013; third
– 16 of January 2014; and fourth – 19th of February 2014).
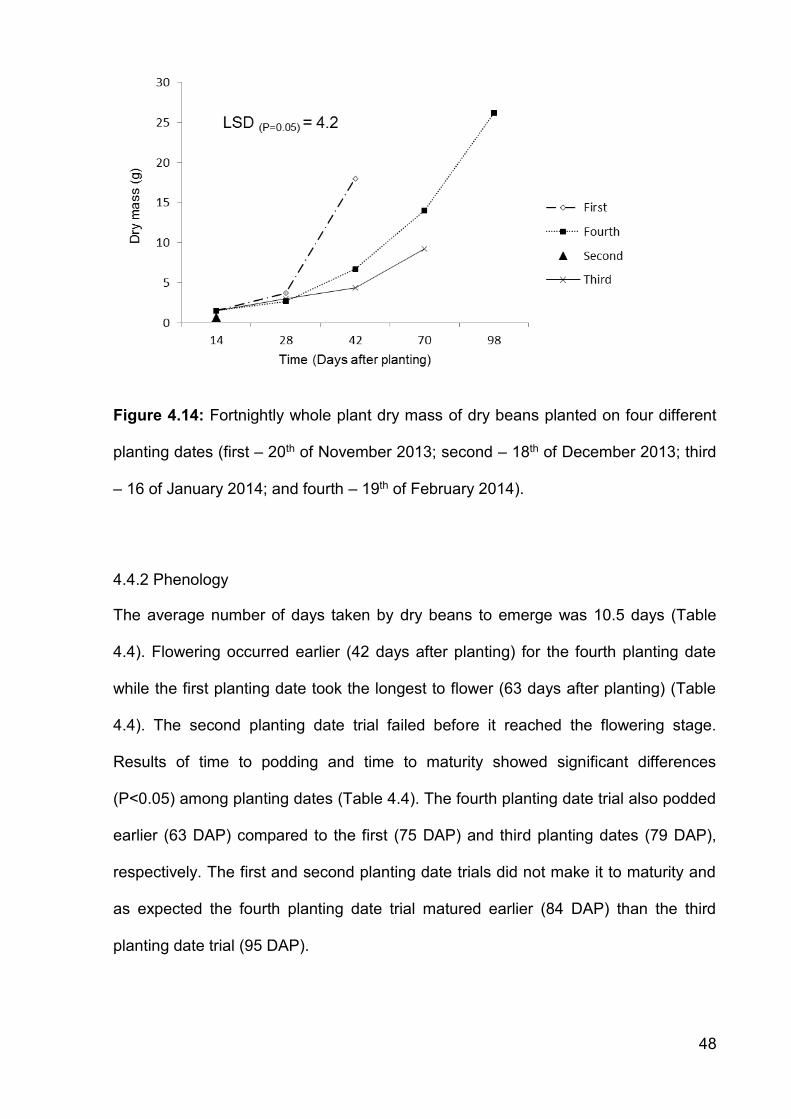
48
Figure 4.14: Fortnightly whole plant dry mass of dry beans planted on four different
planting dates (first – 20th of November 2013; second – 18th of December 2013; third
– 16 of January 2014; and fourth – 19th of February 2014).
4.4.2 Phenology
The average number of days taken by dry beans to emerge was 10.5 days (Table
4.4). Flowering occurred earlier (42 days after planting) for the fourth planting date
while the first planting date took the longest to flower (63 days after planting) (Table
4.4). The second planting date trial failed before it reached the flowering stage.
Results of time to podding and time to maturity showed significant differences
(P<0.05) among planting dates (Table 4.4). The fourth planting date trial also podded
earlier (63 DAP) compared to the first (75 DAP) and third planting dates (79 DAP),
respectively. The first and second planting date trials did not make it to maturity and
as expected the fourth planting date trial matured earlier (84 DAP) than the third
planting date trial (95 DAP).
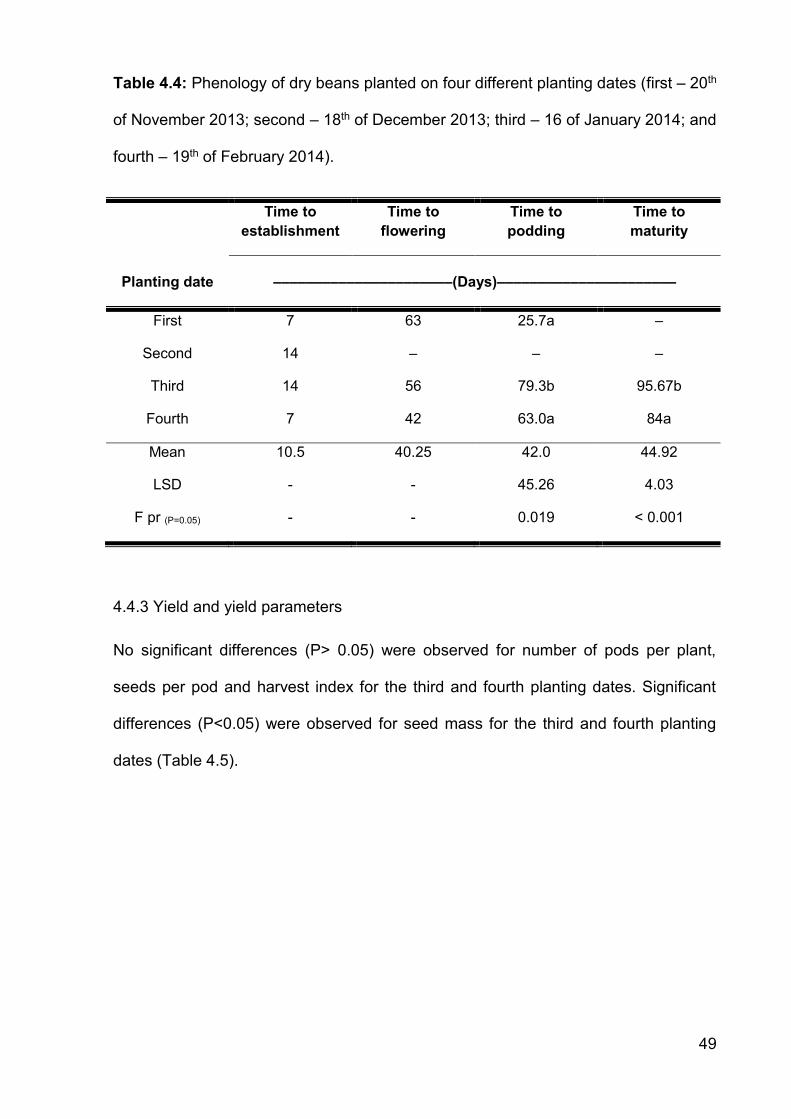
49
Table 4.4: Phenology of dry beans planted on four different planting dates (first – 20th
of November 2013; second – 18th of December 2013; third – 16 of January 2014; and
fourth – 19th of February 2014).
Planting date
Time to establishment
Time to flowering
Time to podding
Time to maturity
––––––––––––––––––––––(Days)––––––––––––––––––––––
First 7 63 25.7a –
Second 14 – – –
Third 14 56 79.3b 95.67b
Fourth 7 42 63.0a 84a
Mean 10.5 40.25 42.0 44.92
LSD - - 45.26 4.03
F pr (P=0.05) - - 0.019 < 0.001
4.4.3 Yield and yield parameters
No significant differences (P> 0.05) were observed for number of pods per plant,
seeds per pod and harvest index for the third and fourth planting dates. Significant
differences (P<0.05) were observed for seed mass for the third and fourth planting
dates (Table 4.5).
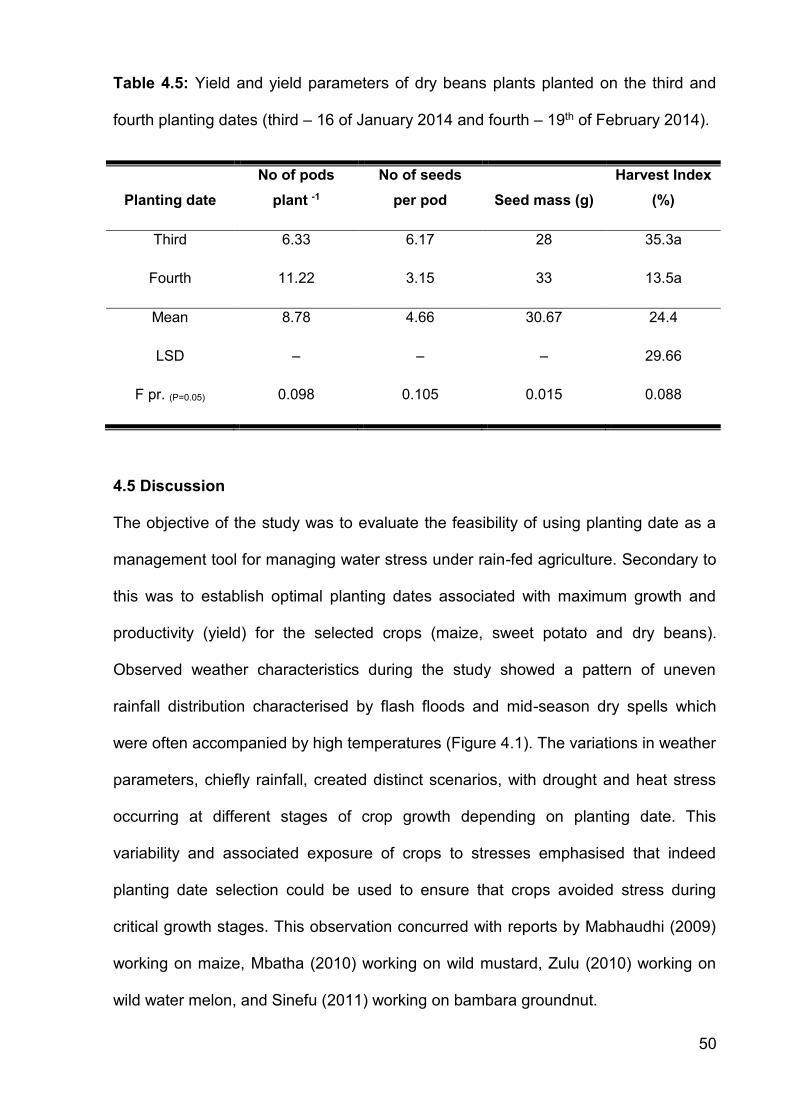
50
Table 4.5: Yield and yield parameters of dry beans plants planted on the third and
fourth planting dates (third – 16 of January 2014 and fourth – 19th of February 2014).
Planting date No of pods
plant -1 No of seeds
per pod Seed mass (g) Harvest Index
(%)
Third 6.33 6.17 28 35.3a
Fourth 11.22 3.15 33 13.5a
Mean 8.78 4.66 30.67 24.4
LSD – – – 29.66
F pr. (P=0.05) 0.098 0.105 0.015 0.088
4.5 Discussion
The objective of the study was to evaluate the feasibility of using planting date as a
management tool for managing water stress under rain-fed agriculture. Secondary to
this was to establish optimal planting dates associated with maximum growth and
productivity (yield) for the selected crops (maize, sweet potato and dry beans).
Observed weather characteristics during the study showed a pattern of uneven
rainfall distribution characterised by flash floods and mid-season dry spells which
were often accompanied by high temperatures (Figure 4.1). The variations in weather
parameters, chiefly rainfall, created distinct scenarios, with drought and heat stress
occurring at different stages of crop growth depending on planting date. This
variability and associated exposure of crops to stresses emphasised that indeed
planting date selection could be used to ensure that crops avoided stress during
critical growth stages. This observation concurred with reports by Mabhaudhi (2009)
working on maize, Mbatha (2010) working on wild mustard, Zulu (2010) working on
wild water melon, and Sinefu (2011) working on bambara groundnut.
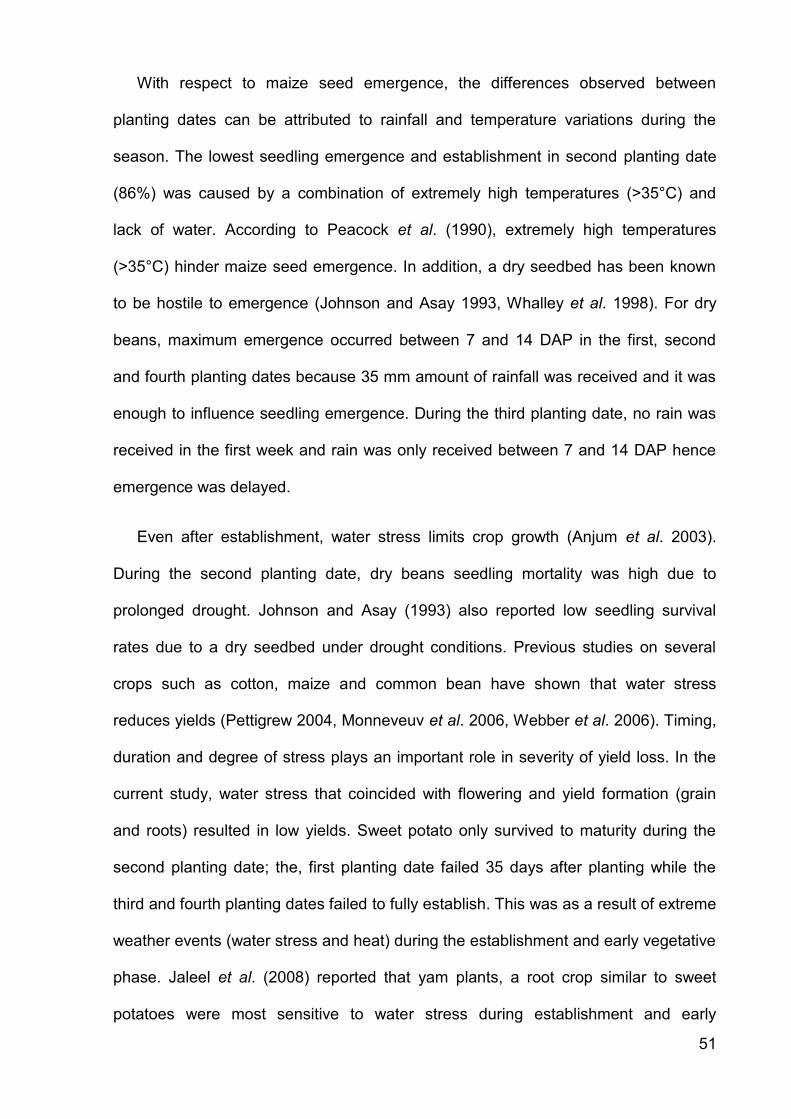
51
With respect to maize seed emergence, the differences observed between
planting dates can be attributed to rainfall and temperature variations during the
season. The lowest seedling emergence and establishment in second planting date
(86%) was caused by a combination of extremely high temperatures (>35°C) and
lack of water. According to Peacock et al. (1990), extremely high temperatures
(>35°C) hinder maize seed emergence. In addition, a dry seedbed has been known
to be hostile to emergence (Johnson and Asay 1993, Whalley et al. 1998). For dry
beans, maximum emergence occurred between 7 and 14 DAP in the first, second
and fourth planting dates because 35 mm amount of rainfall was received and it was
enough to influence seedling emergence. During the third planting date, no rain was
received in the first week and rain was only received between 7 and 14 DAP hence
emergence was delayed.
Even after establishment, water stress limits crop growth (Anjum et al. 2003).
During the second planting date, dry beans seedling mortality was high due to
prolonged drought. Johnson and Asay (1993) also reported low seedling survival
rates due to a dry seedbed under drought conditions. Previous studies on several
crops such as cotton, maize and common bean have shown that water stress
reduces yields (Pettigrew 2004, Monneveuv et al. 2006, Webber et al. 2006). Timing,
duration and degree of stress plays an important role in severity of yield loss. In the
current study, water stress that coincided with flowering and yield formation (grain
and roots) resulted in low yields. Sweet potato only survived to maturity during the
second planting date; the, first planting date failed 35 days after planting while the
third and fourth planting dates failed to fully establish. This was as a result of extreme
weather events (water stress and heat) during the establishment and early vegetative
phase. Jaleel et al. (2008) reported that yam plants, a root crop similar to sweet
potatoes were most sensitive to water stress during establishment and early

52
vegetative stages. During the second planting date there was vegetative and root
growth but without marketable storage root yield. This was caused by prolonged dry
spells which followed after the crop establishment. The crop developed a ramified
root system, possibly as an effort to enhance soil water capture. The growth of roots,
at the expense of shoot growth, is a widespread plant response to declining soil
water availability (Blum 1996, 2005).
In maize, temperature ranges of 25°C to 40°C favour vigorous vegetative growth.
This concurs with Awal and Ikeda’s (2001) findings in groundnuts. However, this
trend was only true when high temperatures were not coupled with water stress.
During the fourth planting date, the maize plants shed off some leaves when there
was a prolonged dry period. According to Farooq et al. (2008), enhanced leaf
senescence is a plant dehydration avoidance mechanism in order to mitigate water
loss through transpiration. Gross and Kigel (1994) and Konsens et al. (1991)
observed that dry beans exposed to high temperatures during flowering reduced pod
and seed set. This was possibly due to flower abortion or failure of fertilisation at high
temperatures. The occurrence of high temperatures during the third planting would
thus account for the reduced pod number observed in dry beans.
Water stress and heat were not the only climate characteristics affecting crop
growth and yield of all the crops. The flash floods which were experienced led to a
significant loss of yield and in some cases crop mortality. Floods cause water
saturation in the soil restricting oxygen availability to plant roots for growth (Whitmore
and Whalley 2009). Water logging is a challenge during crop growth and like water
stress, crop sensitivity to water logging is also dependant on timing, duration and
severity. Maize is most sensitive to water logging during establishment (Dickin and
Wright 2008). Based on observed weather data (Figure 4.1), all the planting dates
53
were affected by floods; however, the effect of the floods on crop growth and yield
varied depending on timing and crop sensitivity to aeration stress. The crops showed
stagnant and retarded growth, particularly in maize and dry beans. Stalk lodging was
also observed during and after floods showing that crop stand was greatly
compromised; this also created a conducive environment for termites to attack the
crop. Floods also contributed to the decline in leaf number as crops never recovered,
especially young crops in second planting dates.
Based on the four planting dates, maize performed better in the first and third
planting dates. Sweet potato was successful only in the second planting date though
there were no marketable storage roots. Sweet potato showed high sensitivity to
water stress and high temperatures particularly during early establishment and
vegetative phases. Dry beans performed better during the fourth planting date. This
shows that planting date selection could be explored to mitigate the effects of water
stress occurring at critical growth stages under rainfed farming. It also provides an
option for subsistence farmers under rainfed farming to plant these different crops at
different times in order to maximize yield. Testing only four planting dates in one
season cannot be conclusive so further serial experiments are important to ascertain
the best planting date.
54
Chapter 5
Conclusions and Recommendations
5.1 Introduction
Farmers residing in marginal agricultural production areas continue to face increased
risk to their crop production. While conditions in these areas have never been optimal
for crop production, climate change and variability is now placing farmers’ livelihoods
at greater risk. Already, farmers are struggling to cope with the seasonal shifts in
traditionally known onset of rainy season dates (Mabhaudhi 2012). This is also
worsened by increased unevenness of rainfall distribution during the season. Under
these conditions, crops are often exposed to water, heat and aeration stress at any
time during their growth cycle; this often results in massive crop failure. It is known
that certain crop growth stages are more sensitive to water stress than others.
Therefore, hypothetically, selecting a planting date that can ensure that critical crop
growth stages do not coincide with stresses could help ensure harvests. It was on the
basis of this hypothesis that this study was conducted to evaluate the effect of
planting date and crop selection on yield attainability.
5.2 Challenges
During flood times it was not easy to carry out weeding and other operations
as the plots were inaccessible due to muddy clay soil.
There was a high incidence of maize stalkborer as a result of prolonged dry
spells.

55
There were incidents of hare / wild rabbits attacking dry beans plants. Nets
had to be erected around the sub-plots.
5.3 Future Lessons and Research Possibilities
The need to select the right planting time for best yields is unarguable hence
further study to investigate and determine the range of time period of planting
in Makhathini is necessary.
Research to understand further mechanisms of water use by these crops (dry
beans, maize and sweet potato) strengthen this experiment.
The investigation of other agronomic crops and how they perform in
Makhathini is another beneficial avenue in pursuit of improved yields in
relation to planting date selection.
The use of validated crop models could save on the cost and time of lengthy
agronomic trials and be used as a decision support tool for assisting farmers.
The training of undergraduate and postgraduate students, as well as
extension officers on the use of decision support tools could prove beneficial
to farmers.
5.4 Final Comments and Summary Conclusions
The study highlighted the economic importance of planting date selection as a
management tool for maize, sweet potato and dry beans crop production in
subsistence farming. The results of the present study will contribute in addressing the
problem of yield loss and crop failure due to uninformed planting date selection
practices among subsistence farmers of Makhathini community of Umkhanyakude
district, KZN, South Africa. Planting at the right date enhances resource utilization
56
and can benefit subsistence farmers when fertilizers such as nitrogen can only
effectively be put to use by the crop during availability of water (Braunack et al.
2012). Lauer et al. (1999) reported that altering planting dates can be useful to
manage water stress under rain-fed conditions with minimal yield loss. However,
predicting planting dates in low latitudes is complex when only using climate data of
South Africa (Sacks et al. 2010).
This study confirmed that variation in planting dates has an effect on growth,
phenology and yield of maize, sweet potato and dry beans. The present study
therefore recommends early planting of maize in order to escape yield losses due to
drought stress. The study recommends a late season planting for dry beans in order
to optimize yields. Supplementary irrigation is recommended for sweet potato during
early establishment stage. Farmers should also be advised about exploiting drought
tolerant varieties as a drought mitigation strategy. Rain harvesting during flash floods
is recommended; harvested water could then be used to provide supplementary
irrigation during dry spells. Rain harvesting technologies are low cost interventions
which require minimum maintenance as opposed to dam construction. The use of
climate smart agriculture principles is encouraged to prevent soil degradation due to
erosion occurring during flash floods.
57
References
Al-Darby AM, Lowery B. 1987. Seed zone temperature and early corn growth with
three conservation tillage systems. Soil Science Society American Journal 51:768-
774.
Alfred E, Hartemink S, Poloma M, Maino KS, Powell J, Egenae, O'Sullivan JN. 2000.
Yield decline of sweet potato in the humid lowlands of Papua New Guinea.
Agriculture Ecosystems and Environment 01/2000; 79: 259-269.
DOI: 10.1016/S0167-8809(00)00139-0.
Angus JF, Moncur MW. 1997. Water stress and Phenology in wheat. Aust. Journal.
Agric. Res. 28: 77-181
Anjum F, Yaseen M, Rasul A, Anjum WS. 2003. Water stress in barley (Hordeum
vulgare L), effect on morphological characters. Pakistan Journal of Agricultural
Science 40: 43-44.
Anjum SA, Xie XY, Wang LC, Saleem MF, Man C, Lei W. 2011. Morphological,
physical and biochemical response of plants to drought stress. African Journal of
Agricultural Research 6: 2026–2032.
Araus JL, Slafer GA, Reynolds MP, Royo C. 2002. Plant breeding and drought in C3,
cereals: what should we breed for? Analytical Botany 89: 925-940.
Awal MA, Ikeda T. 2001. Effects of changes in soil temperature on seedling
emergence and phenological development in field-grown stands of peanut (Arachis
hypogaea). Environmental and Experimental Botany 47: 101–113.
58
Badu-Apraku B, Hunter RB, Tollenaar M. 1983. Effect of temperature during grain
filling on whole plant and grain yield in maize (Z. mays L.). Canadian Journal of Plant
Sciences 63:357-363.
Beck EH, Fettig S, Knake C, Hartig K, Bhattarai T. 2007. Specific and unspecific
responses of plants to cold and drought stress. Journal of. Biosciences 32: 501–510.
Beebe SE, Rao IM, Blair MW, Acosta-Gallegos JA. 2013. Phenotyping common
beans for adaptation to drought. Frontiers in Physiology 4: 1-20.
Bennie ATP, Hensley M. 2001. Maximizing precipitation utilization in dry land
agriculture in South Africa- a review. Journal Hydrology 241: 124–139.
Birch CJ, Robertson MJ, Hamphreys E, Hitch N. 2003. Agronomy of maize in
Australia: A Review and prospect. Maize – Golden Opportunities: 5th Australian
Maize Conference, City Golf Club, Toowoomba pg. 45–57.
Birch CJ, Vos J. 2000. Advancing modelling of leaf production by maize. Pg. 145.
International crop science congress, Hamburg, Germany.
Block HC, Macken CN, Klopfenstein TJ, Erickson GE, Stock RA. 2005. Optimal wet
corn glutein and protein levels in steam-flaked corn-based finishing diets for steer
calves. Journal of Animal Science. 83: 2798-2805.
Blum A. 1982. Methods of Selection for plant tolerance to environmental stresses.
Paper presented at the Joint FAOIAEA Division of Isotope and Radiation Applications
of Atomic Energy for Food and Agricultural Development, Vienna. 21 -25.
Blum A. 1996. Crop responses to drought and the interpretation of adaptation. Plant
Growth Regulation. 20: 135–148.
59
Blum A. 2004. Sorghum Physiology. In 'Physiology and biotechnology integration for
plant breeding'. (Eds HT Nguyen, A Blum) pp. 141–223.
Blum A. 2005. Drought resistance, water use efficiency, and yield potential- are they
compatible, dissonant or mutually exclusive? Australian Journal of Agricultural
Research 56: 1159–1168.
Blum A. undated. The mitigation of drought stress.
http://www.plantstress.com/articles/drought_m/drought_m.htm. Accessed 14 October
2014.
Boddugari K, Grant RJ, Stock R, Lewis M. 2001. Maximal replacement of forage and
concentrate with a new wet milling product for lactating dairy cows. Journal of Dairy
Science 84: 873-884.
Braunack MV, Bange MP, Johnston DB. 2012. Can planting date and cultivar
selection improve resource use efficiency of cotton systems? Field Crops Research
137: 1–11.
Broughton WJ, Hernandez G, Blair M, Beebe S, Gepts P, Vanderleyden J. 2003.
Bean (Phaseolus spp). Model food legumes. Plant Soil 252: 55–128.
Chaves MM, Pereira JS, Moroco J, Rodrigues ML, Ricardo CPP, Osorio ML,
Carvalho l, Faria T and Pinheiro C. 2002. How plants cope with stress in the field.
Photosynthesis and Growth. Annals of Botany 89: 907- 916.
Coe R, Stern RD. 2011. Assessing and addressing climate-induced risk in Sub
Saharan rainfed agriculture: Lessons learned. Experimental Agriculture: 395-410.
60
DAFF (Department of Agriculture, Forestry and Fisheries). 2011. Production
guideline for Bambara groundnuts. Directorate Agriculture Information Services.
Pretoria, South Africa.
David S, Kirkby and Kasozi S. 2000. Assessing the Impact of Bush Bean Varieties on
Poverty Reduction in sub-Saharan Africa: Evidence from Uganda. Network on Bean
Research in Africa, Occassional Publication series NO.31, CIAT, Kampala, Uganda.
Davis C. 2008. Predicted changes in the savanna ecosystems of South Africa as a
result of climate change induced carbon dioxide, temperature and rainfall anomalies.
Honours Research, University of the Witwatersrand, South Africa
De Costa WAJM, Dennett MD, Ratnaweera U, Nyalemegbe K. 1996. Effects of
different water regimes on field-grown determinate and indeterminate faba bean
(Vicia faba L.). II. Yield, yield components and harvest index. Field Crops Research
52: 169-178.
Department of Agriculture. 2007. Abstract of agricultural statistics, Maize production.
National Department of Agriculture, Pretoria, South Africa. Government Printers
Dickin E, Wright D. 2008. The effects of winter waterlogging and summer drought on
the growth and yield of winter wheat (Triticum aestivum L). European Journal of
Agronomy 28: 234-244.
Downing TE .1992. Climate Change and Vulnerable Places: Global Food Security
and Country Studies in Zimbabwe, Kenya, Senegal and Chile Oxford, UK:
Environmental Change Unit, Oxford University.
Dracup JA, Piechota TC.1999. Long-range Streamflow Forecasting using El Nino-
Southern Oscillation Indicators ASCE. Journal of Hydrologic Engineering 4: 144-151.
61
Droogers P, Seckler D, Makin I. 2001. Estimating the potential of rain-fed agriculture.
Working Paper 20 Colombo Sri Lanka: International Water Management Institute
du Plessis J. 2003. Maize production, Department: Agriculture Republic of South
Africa, Directorate Agricultural Information Services, ARC-Grain Crops Institute,
Potchefstroom.
El Nadi AH. 1969. Water relations of beans I. Effects of water stress on growth and
flowering. Experimental Agriculture 5: 195-207.
Ellis F. 2000. The Determinants of Rural Livelihood Diversification in Developing
Countries. Journal of Agricultural Economics 51: 289–302.
Eubanks MW. 2001. The Mysterious Origin of Maize. Economics Botany 55: 6.
Fanadzo M. 2007. Weed management by small-scale irrigation farmers – the story of
Zanyokwe. SA Irrigation 29: 20–24.
Fanadzo M, Chiduza C, Mnkeni PNS. 2009. Investigation of agronomic factors
constraining productivity of grain maize (Zea mays L) at Zanyokwe irrigation scheme,
Eastern Cape, South Africa. Journal of Applied Biosciences 17: 948-958.
Farooq M, Wahid A, Kobayashi N, Fujita D, Basra SMA. 2008. Plant drought stress:
effects, mechanisms and management. Journal of Agronomy and Sustainability.
Development 2: 185-212.
Fischer G, Shah M, Tubiello FN, Van Velhuizen H. 2005. Socio-economic and
climatic change impacts on agriculture: integrated assessment. Philos Trans R Soc
Lond B Biol Sci. 360: 2067–2083.
Food and Agriculture Organization (FAOSTAT) 2013.
Faostat.fao.org/site/339/default.aspx. Accessed 20 July 2014.
62
Fournier C, Andrieu B. 2000. Dynamics of the elongation of internodes in maize (Zea
mays L) Analysis of phases of elongation and their relationships to phytomer
development. Annals of Botany 86: 551–563.
George G, Graham MD, Jorge LMD, Enrique BS, Enrique MMD. 1989. Quality
Protein Maize, Digestibility and Utilization by Recovering Malnourishes infants.
Gepts P. 1998. Origin and Evolution of Common Bean: Past Events and Recent
Trends. Horticultural Science 33: 1124–1130.
Grant R, Jackson B, Kiniry J, Arkin G. 1989. Water deficit timing effects on yield
components in maize. Agronomy Journal 81: 61-65.
Gross Y, Kigel J. 1994. Differential sensitivity to high temperature of stages in the
reproduction development of common beans (Phaseolus vulgaris L.). Field Crops
Research 36: 201-212.
Halley A, Taylor B. 1996. Classification and Botanical Description of Legumes.
Heuer B, Nadler A. 1995. Growth, development and yield of potatoes under salinity
and water deficit. Australian Journal of Agriculture Research 46: 1477 - 1486.
Hu M, Wiatrak P. 2012. Effect of planting date on soybean growth, yield, and grain
quality: Review. Agronomy Journal 104: 785-790.
Huaman Z. 1992. Systematic Botany and Morphology of the Sweet potato plant,
Technical Information Bulletin 25, International Center (CIP), Lima, Peru.
Hufford MB, Martinez–Meyer E, Gaut BS, Eguiarte LE, Tenaillon MI. 2012.
Inferences from the Historical Distribution of Wild and Domesticated Maize Provide
Ecological and Evolutionary Insight, New York State Museum, United States of
America.
63
Husain MM, Gallagher JN, Hill GD, Othman H. 1983. The non-existence of moisture
sensitive phases in Vicia faba. L. grown under irrigation in Canterbury. Proc. Agron.
Soc. N.Z. 13: 82 - 94.
Hussain M, Malik MA, Farooq M, Ashraf MY, Cheema MA. 2008. Improving Drought
tolerance by exogenous application of glycinebetaine and salicylic acid in sunflower,
Journal of Agronomy 194: 193 – 199.
International Potato Center, Agricultural research for development, Av La Molina
1895, La Molina, 2013.
IPCC (Intergovernmental Panel on Climate Change). 2007. Climate change impacts,
adaptation and vulnerability. Contribution of Working Group 2 to the Fourth
Assessment. In Parry ML, Canziani OF, Palutikof JP, van der Linden PJ, Hanson CE
(Eds.). Cambridge and New York: JAICAF.
Jaleel CA, Gopi R, Panneerselvam R. 2008. Biochemical alterations in white yam
(Dioscorea rotundata Poir.) under triazole fungicides: impacts on tuber quality. Czech
Journal of Food Science 26: 298–307.
JAICAF. 2008. The Maize in Zambia and Malawi. Japan Associated for international
Collaboration of Agriculture and Forestry.
James W, Hansen, Simon J, Mason, Liqiand S, Arame T. 2011. Review of seasonal
climate forecasting for agriculture in Sub-Saharan Africa. Experimental Agriculture
47: 205 – 240.
Johnson DA, Asay KH. 1993. Viewpoint – selection for improved drought response in
cool-season grasses. Journal of Range Management 46: 194-202.

64
Kandji ST, Verchot L, Mackensen J. 2006. Climate change and variability in southern
Africa: Impacts and adaptation in the agricultural sector. Nairobi: World Agroforestry
Centre (ICRAF) and United Nations Environment Programme (UNEP).
Kay SJ. 2011. Cultivated vegetables of the world: Multilingual Onomasticon.
Kgasago H. 2006. Effects of planting dates and densities on yield and yield
components of short and ultra-short growth period maize. Faculty of Natural and
Agricultural Sciences Department of Plant Production and Soil Science University of
Pretoria.
Khan ZR, Chiliswa P, Ampong-Nyarko K, Smart LE, Polaszek A, Wandera J, Mulaa
MA. 1997b. Utilization of wild gramineous plants for management of cereal
stemborers in Africa. Insect Science Applications. 17: 143–150.
Khokhar Z, Hussain I, Khokhar B, Sohail M. 2010. Effect of planting date on yield of
wheat genotypes in Sindh. Pakistan Journal of Agricultural Research 23:1-5.
Klopfenstein TJ, Erickson GE, Berger LL. 2012. Maize is a critically important source
of food, feed, energy and forage in USA. Field Crop Research 153: 5-11.
Konsens I, Ofir M, Kigel J. 1991. The effect of temperature on the production and
abscission of flowers and pod in snap bean (Phaseolus vulgaris L.) Annals of Botany
67: 391-399.
Kumar J, Abbo S. 2001. Genetics of flowering time in chickpea and its bearing on
productivity in the semi-arid environments. Advanced Agronomy 72: 107-138.
Lauer JG, Carter PR, Wood TM, Diezel G, Wiersma PE, Mlynarek MJ. 1999. Corn
hybrid response to planting more severe in central and northern zones compared
date in the northern corn belt. Agronomy Journal 91: 834–839.

65
Lemos MC, Dilling L. 2007. Equity in forecasting climate: can science save the
world’s poor? Science Public Policy 34:109–116.
Liebenberg AJ. 2011. Sweet potato (Ipomoea batatas L) production guide.
Directorate: Plant Production.
Lisar SYS, Motafakkerazad R, Hossain MM, Rahman IMM. 2012. Water Stress in
Plants: Causes, Effects and Responses. DOI: 10.5772/39363
Lizana C, Wentworth M, Martinez J.P, Villegas D, Meneses R, Murchie EH, Pastenes
C, Lercari. B, Vernieri P, Horton P, and Pinto M. 2006. Differential adaptation of two
varieties of common bean to abiotic stress. Effects of drought on yield and
photosynthesis. Journal of Experimental Botany. 57: 685-697.
Mabhaudhi T. 2009. Responses of Landrace Maize (Zea mays L.) to water stress
compared with commercial hybrids. MSc Thesis, University of KwaZulu-Natal, South
Africa.
Mabhaudhi T. 2012. Drought tolerance and water use of selected South Africa
landraces of Taro (Colocasia Esculenta L. Schott) and bambara groundnut (Vigna
subterranea L. Verdc). PhD Thesis, University of KwaZulu-Natal, South Africa.
Mabhaudhi T, Modi AT and Beletse YG. 2014. Parameterisation and testing of the
FAO AquaCrop model for a South African bambara groundnut landrace. Agronomy
Journal 106: 243-251.
Magness JR, Markue GM, Compton CC. 1999. Corn maize (Zea mays). Purdue
University centre for new crops and plant products.
66
Manjeru P, Madanzi T, Makeredza B, Nciizah A, Sithole M. 2007. Effects of water
stress at different growth stages on components and grain yield of common bean
(Phaseolus vulgaris L.). African Crop Science Conference Proceedings 8: 299-303.
Marco A, Rondon MA, Lehmann J, Ramirez J, Hurtado M. 2006. Biological nitrogen
fixation by common beans. Biol Fert Soils DOI 10.1007/s00374-006-0152-z.
Mashingaidze K. 2012. Focus on improved maize for African soils, ARC-Grain crops
institute.
Matarira CH, Manatsa D. 2009. Changing Dependence of Zimbabwe Rainfall
Variability on ENSO and the Indian Ocean Dipole/Zonal Mode. Theoretical and
Applied Climatology 98: 375-396.
Matsuoka Y. 2005. Origin Matters: Lessons from the search for the Wild Ancestor of
Maize. Breeding Science 55: 383-390.
Mbatha TP. 2010. Response of Local Wild Mustard (Brassica spp.) Landraces to
water stress. MSc Thesis, University of KwaZulu-Natal, South Africa.
Miracle MP. 2009. The introduction and Spread of Maize in Africa. The Journal of
African History 36: 39-55
Monneveux P, Sanchez C, Beck D, Edmeades GO. 2006. Drought tolerance
improvement in tropical maize source populations: evidence of progress. Crop
Science 46: 180–191.
Mutekwa VT. 2009. Climate Change Impacts and Adaptation in the Agricultural
Sector: The Case of Smallholder Farmers in Zimbabwe. Journal of Sustainable
Development in Africa 11: 237-256.
Mwanamwenge J, Loss SP, Siddique KHM, Cocks PS. 1998. Effects of water stress
67
during floral, flowering and podding on the growth and yield of faba bean (Vicia faba
L). European Journal of Agronomy 11: 1–11.
Myers RL. 1999. Dry Edible bean. A high value Alternative Legume.
https://www.hort.purdue.edu/newcrop/articles/ji-beans.html. Accessed 28 August
2014.
Nonami H. 1998. Plant water relations and control of cell elongation at low water
potential. Journal Plant Research 111: 373 - 382.
Ofori E, Kyei-Baffour N. 2004. Agrometeorology and maize production. Importance of
the crop in various climates.
Ortmann G, Machethe C. 2003. Problems and opportunities in South African
Agriculture. Pietermaritzburg, South Africa: University of Natal Press.
Otieno FAO, Ochieng GMM. 2004. Water management tools as a means of averting
a possible water scarcity in South Africa by the year 2025. Water SA 30: 668 – 672.
Parry MN, Arnell T, McMichael R, Nichollos P, Martens S. Kovats M, Livemore C
Rosenzweig A, Iglesias, Fischer G. 2001. Viewpoint Millions at risk defining critical
climate change threats and targets Global Environ.Change,11,181-183,doi
10.1016/S0959-3780(01)00011-5.
Passioura J. 2007. The drought environment: physical, biological and agricultural
perspectives. Journal of Experimental Botany 58: 113 – 117.
Pathak H, Aggarwal PK and Singh SD (Eds). 2012. Climate Change Impact,
Adaptation and Mitigation in Agriculture: Methodology for Assessment and
Applications. Indian Agricultural Research Institute, New Delhi.
68
Peacock JM, Miller WB, Matsuda K, Robinson DL. 1990. Role of heat girdling in early
seedling death of sorghum. Crop Science 30: 138-143.
Pettigrew WT. 2004. Physiological consequences of moisture deficit stress in cotton.
Crop Science 44: 1265-1272.
Pleasant B. 2014. All about growing Sweet potato. Mother earth news.
Poorter H, Nagel O. 2000. The role of biomass allocation in the growth response of
plants to different levels of light, CO2, nutrients and water: a quantitative review.
Australian Journal of Plant Physiology 27: 595-607.
Praba ML, Cairns JE, Babu RC, Lafitte HR. 2009. Identification of physiological traits
underlying cultivar differences in drought tolerance in rice and wheat. Journal of.
Agronomy 195: 30–46.
Rattalino Edreira JI, Otegui ME. 2013. Heat stress in temperate and tropical maize
hybrids: A novel approach for assessing sources of kernel loss in field conditions.
Field Crops Research: 142: 58-67.
Rosenberg NJ. 1979. Drought in the Great Plains-Research on Impacts and
strategies: Proceedings of the workshop on Research in Great Plains Drought
Management Strategies, University of Nebraska, Lincoln, March 26–28: Littleton,
Colorado Water Resources Publications.
Sacks JW, Deryng D, Foley AJ, Ramankutty N. 2010. Crop planting dates: An
analysis of global patterns. Global Ecology Biogeography 19: 607-620.
Samarah NH. 2005. Effects of drought stress on growth and yield of barley. Agron.
Sustain. Dev 25: 145-149.
69
Shao HB, Chu LY, Jaleel CA, Manivannan P, Panneerselvam R, Shao MA. 2009.
Understanding water deficit stress-induced changes in the basic metabolism of
higher plants-biotechnologically and sustainably improving agriculture and the eco-
environment in arid regions of the globe. Critical Review of Biotechnology 29: 131–
151.
Schwartz YB, Boykova T, Belyaeva ES, Ashburner M, Zhimulev IF. 2004. Additional
File 1: The alignment between the DNA sequence of the D. melanogaster swi gene
and the sequence of D. pseudoobscura contigs 2140 and 2139. BMC Genetics 5: 15.
Sidik A, Njiwa D, Phiri MAR. 2005. Assessment of bean supply response to bean
improvement research in Malawi. A study report submitted to Centro International de
Agricultura Tropical (University of Malawi, Bunda College of Agriculture).
Sinefu F. 2011. Bambara groundnut response to controlled environment and planting
date associated water stress. MSc Thesis, University of KwaZulu-Natal, South Africa.
Smale M, Byerlee D, Jayne T. 2011. Maize revolutions in Sub-Saharan Africa
Forthcoming World Bank, Washington, DC, and Tegemeo Institute, Kenya.
South Africa Yearbook: 2010/11, 2012/2013 South African Government Information
services.
Specht JE, Chase K, Macrander M. Graef G, Chung J, Markwell JP, Germann M, Orf
JH, Lark KG. 2001. Soyabean response to water A QTL analysis of drought
tolerance. Crop Science 41:493-509.
Srisuwan S, Sihachakr D, Siljak-Yakovlev S. 2006. The origin and evolution of sweet
potato (Ipomoea batatas L) and its wild relatives through the cytogenetic approaches.
Plant Science 171: 424-433.
70
Statistics & Economic Analysis DAFF. 2012.
Stephen E, Beebe, Idupulapati M, Rao, Mura JD, Jose Polania. 2014. Common
beans, biodiversity, and multiple stresses: challenges of drought resistance in tropical
soils. Crop and Science Department, North Carolina State University, USA
Titus P. 2008. A Crop Production Technical Guide, Sweet potato, Cardi St. Vincent
and the Grenadines.
Traore PCS, Kouressy M, Vaksmann M, Tabo R, Maikano I, Traore SB, Cooper P.
2007. Climate prediction and agriculture: what is different about Sudano – Sahelian
West Africa? In Climate Prediction and Agriculture: Advances and Challenges (Eds
Sivakumar MVK, Hansen JW). Berlin: Springer.
Tsimba R, Edmeades GO, Millner JP, Kemp PD. 2013. The effect of planting date on
maize grain yields and yield components. Field Crop Research 150:135 -44.
United Nations Millennium Development Goals website.
http://www.un.org/millenniumgoals/ (Accessed 03 February 2015).
Wada N, Feng C, Gulati G. 2008. Introduction and Overview: Maize in Asia:
Changing markets and incentives. New Dehi: Academic Foundation.
Wang SJ, Yeh KW, Tsai CY. 1999. Molecular characterization and expression of a
starch granule – bound starch synthesis gene in the sink and source tissues of sweet
potato. Physiologia Plantarum 106: 253–261.
Webber. M, Barnett J, Finlayson B, Wang M. 2006. Pricing China’s irrigation water.
Working paper, school of Anthropology, Geography and Environmental Studies, The
University of Melbourne, Victoria, Australia.
71
Wesley B, Bruce WB, Gregory O, Edmeades, Thomas C, Barker. 2002. Molecular
and physiological approaches to maize improvement for drought tolerance. Journal of
Experimental Botany 53: 13–25.
Whalley WR, Bengough AG, Dexter AR. 1998. Water stress induced by PEG
decreases the maximum growth pressure of the roots of pea seedlings. Journal of
Experimental Botany 49. 1689 – 1694
Whitmore PA, Whalley RW. 2009. Physical effects of soil drying on roots and crop
growth. Journal of Experimental Botany 60: 2845–2857.
Williams JW, Jackson ST, Kutzback JE. 2007. Projected distributions of novel and
disappearing climates by 2100 AD. Proc. Natl. Acad Sci. USA. 104: 5738 – 5742.
Woolfe JA. 1992. Sweet potato: An untapped food resource. Cambridge University
Press. Pp. 643.
Xia MZ. 1994. Effect of soil drought during the generative development phase of faba
bean (Vicia faba) on photosynthetic characters and biomass production. Journal of
Agricultural Science 122: 67 - 72.
Xiong L, Wang R, Mao G, Koczan JM. 2006. Identification of drought tolerant
determinants by genetic analysis of root response to drought stress and abscisic
acid. Plant Physiol. 142: 1065-1074.
Zhao TJ, Sun S, Liu Y, Liu JM, Liu Q, Yan YB, Zhou HM. 2006. Regulating the
drought-responsive element (DRE)-mediated signaling pathway by synergic functions
of trans-active and transinactive DRE binding factors in Brassica napus. Journal of
Biology and Chemistry 281: 10752-10759.

72
Zulu NS. 2010. Wild watermelon (Citrullus lanatus L.) landrace production in
response to three seedling growth media and field planting dates. MSc Dissertation,
University of KwaZulu-Natal, South Africa.

73
List of Appendices
Appendix 1: Maize
Variate: %_Emergence Source of variation d.f. s.s. m.s. v.r. F pr. Rep stratum 2 145.42 72.71 2.67 Rep.*Units* stratum Planting_date 3 551.34 183.78 6.75 0.002 DAP 2 56023.03 28011.52 1028.91 <.001 Planting_date.DAP 6 2367.93 394.65 14.50 <.001 Residual 22 598.94 27.22 Total 35 59686.66 Variate: Height Source of variation d.f. s.s. m.s. v.r. F pr. Rep stratum 2 494.0 247.0 0.60 Rep.*Units* stratum Planting_date 3 34416.0 11472.0 27.82 <.001 DAP 16 413293.7 25830.9 62.63 <.001 Planting_date.DAP 48 157538.1 3282.0 7.96 <.001 Residual 134 55262.6 412.4 Total 203 661004.4 Variate: Leaf_No Source of variation d.f. s.s. m.s. v.r. F pr. Rep stratum 2 19.06 9.53 0.33 Rep.*Units* stratum Planting_date 3 251.38 83.79 2.94 0.036 DAP 16 4584.33 286.52 10.04 <.001 Planting_date.DAP 48 2049.39 42.70 1.50 0.038 Residual 134 3822.77 28.53 Total 203 10726.92

74
Variate: Fresh_biomass Source of variation d.f. s.s. m.s. v.r. F pr. Rep stratum 2 53246. 26623. 1.69 Rep.*Units* stratum Planting_date 3 2210338. 736779. 46.89 <.001 DAP 6 2777582. 462930. 29.46 <.001 Planting_date.DAP 18 7979792. 443322. 28.21 <.001 Residual 57 895715. 15714. Total 86 13888253. Variate: dry_biomass Source of variation d.f. s.s. m.s. v.r. F pr. Rep stratum 2 14360. 7180. 1.96 Rep.*Units* stratum Planting_date 3 379886. 126629. 34.61 <.001 DAP 6 518801. 86467. 23.63 <.001 Planting_date.DAP 18 1538791. 85488. 23.37 <.001 Residual 57 208539. 3659. Total 86 2655191. Variate: Time_to_seedling_establishment Source of variation d.f. s.s. m.s. v.r. F pr. Rep stratum 2 4.5000 2.2500 2.45 Rep.*Units* stratum Planting_date 3 8.2500 2.7500 3.00 0.117 Residual 6 5.5000 0.9167 Total 11 18.2500 Variate: time_to_maturity Source of variation d.f. s.s. m.s. v.r. F pr. Rep stratum 2 57.17 28.58 2.33 Rep.*Units* stratum Planting_date 3 21768.25 7256.08 592.33 <.001 Residual 6 73.50 12.25
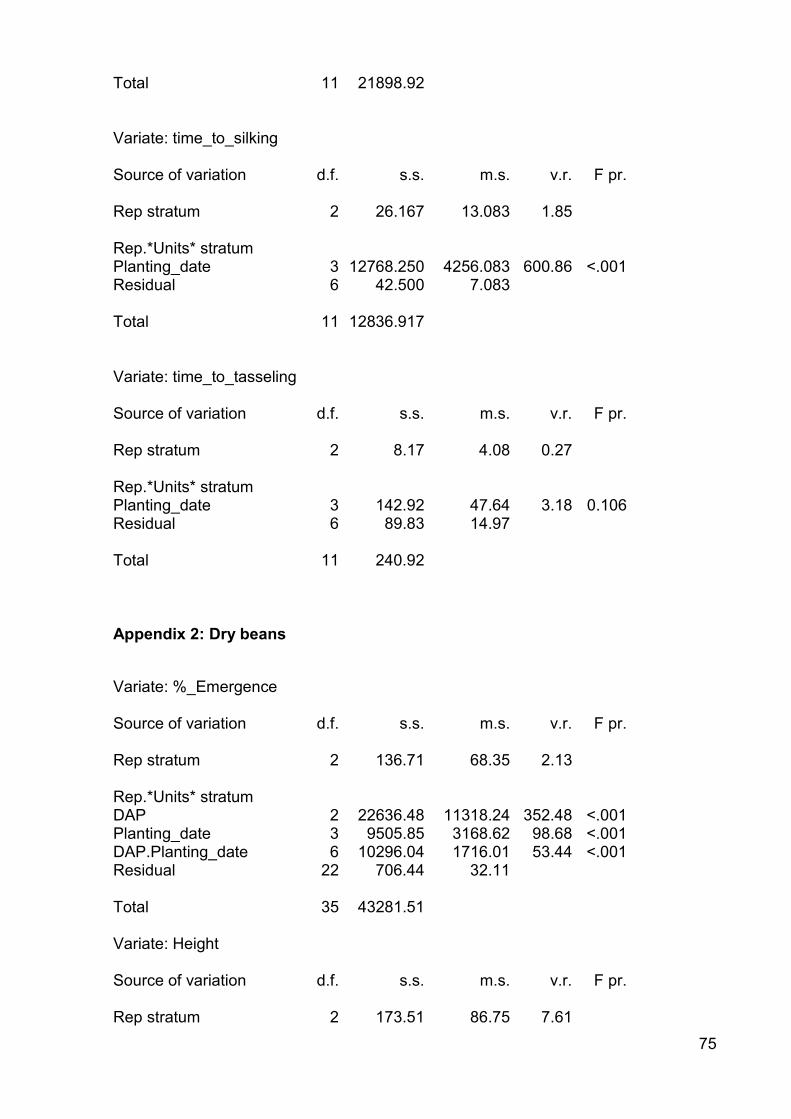
75
Total 11 21898.92 Variate: time_to_silking Source of variation d.f. s.s. m.s. v.r. F pr. Rep stratum 2 26.167 13.083 1.85 Rep.*Units* stratum Planting_date 3 12768.250 4256.083 600.86 <.001 Residual 6 42.500 7.083 Total 11 12836.917 Variate: time_to_tasseling Source of variation d.f. s.s. m.s. v.r. F pr. Rep stratum 2 8.17 4.08 0.27 Rep.*Units* stratum Planting_date 3 142.92 47.64 3.18 0.106 Residual 6 89.83 14.97 Total 11 240.92
Appendix 2: Dry beans
Variate: %_Emergence Source of variation d.f. s.s. m.s. v.r. F pr. Rep stratum 2 136.71 68.35 2.13 Rep.*Units* stratum DAP 2 22636.48 11318.24 352.48 <.001 Planting_date 3 9505.85 3168.62 98.68 <.001 DAP.Planting_date 6 10296.04 1716.01 53.44 <.001 Residual 22 706.44 32.11 Total 35 43281.51 Variate: Height Source of variation d.f. s.s. m.s. v.r. F pr. Rep stratum 2 173.51 86.75 7.61
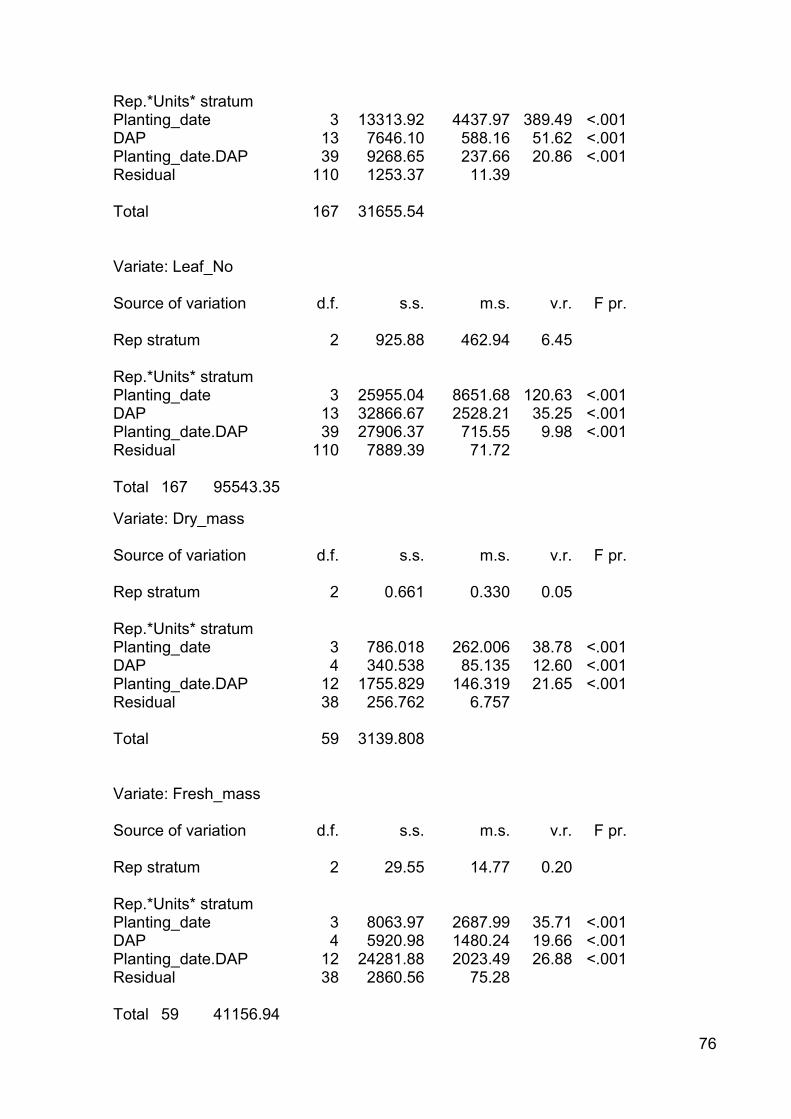
76
Rep.*Units* stratum Planting_date 3 13313.92 4437.97 389.49 <.001 DAP 13 7646.10 588.16 51.62 <.001 Planting_date.DAP 39 9268.65 237.66 20.86 <.001 Residual 110 1253.37 11.39 Total 167 31655.54 Variate: Leaf_No Source of variation d.f. s.s. m.s. v.r. F pr. Rep stratum 2 925.88 462.94 6.45 Rep.*Units* stratum Planting_date 3 25955.04 8651.68 120.63 <.001 DAP 13 32866.67 2528.21 35.25 <.001 Planting_date.DAP 39 27906.37 715.55 9.98 <.001 Residual 110 7889.39 71.72 Total 167 95543.35
Variate: Dry_mass Source of variation d.f. s.s. m.s. v.r. F pr. Rep stratum 2 0.661 0.330 0.05 Rep.*Units* stratum Planting_date 3 786.018 262.006 38.78 <.001 DAP 4 340.538 85.135 12.60 <.001 Planting_date.DAP 12 1755.829 146.319 21.65 <.001 Residual 38 256.762 6.757 Total 59 3139.808 Variate: Fresh_mass Source of variation d.f. s.s. m.s. v.r. F pr. Rep stratum 2 29.55 14.77 0.20 Rep.*Units* stratum Planting_date 3 8063.97 2687.99 35.71 <.001 DAP 4 5920.98 1480.24 19.66 <.001 Planting_date.DAP 12 24281.88 2023.49 26.88 <.001 Residual 38 2860.56 75.28 Total 59 41156.94
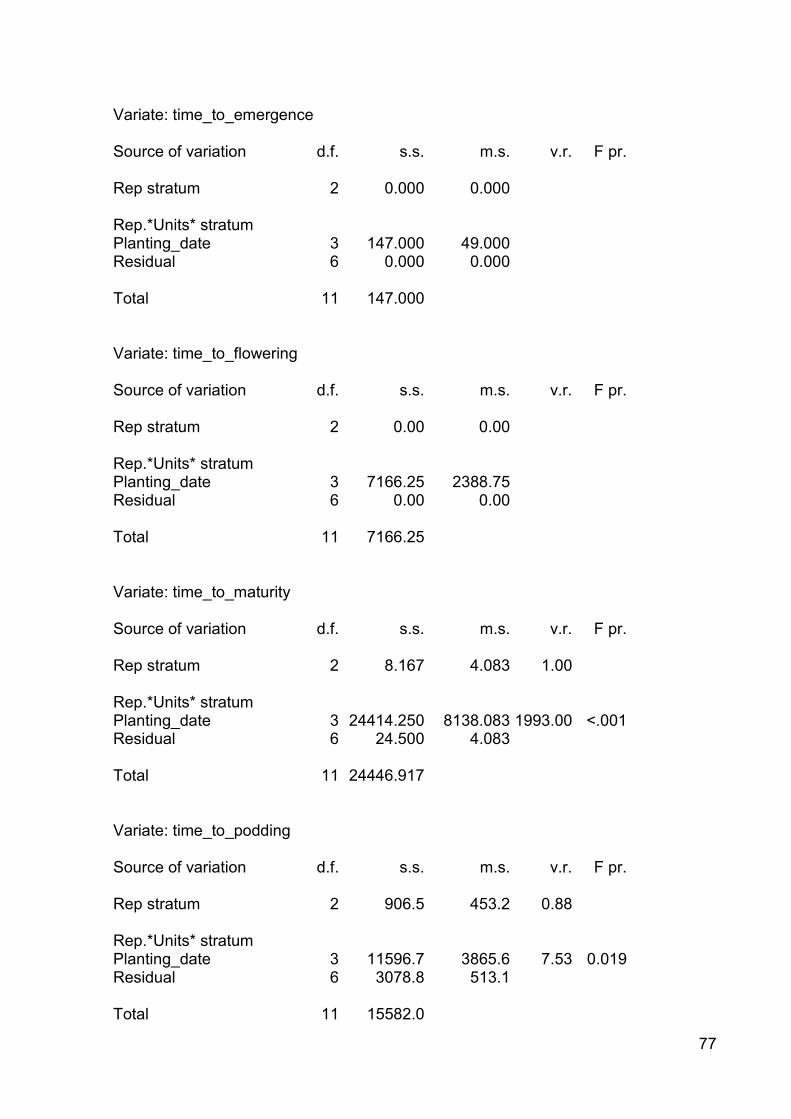
77
Variate: time_to_emergence Source of variation d.f. s.s. m.s. v.r. F pr. Rep stratum 2 0.000 0.000 Rep.*Units* stratum Planting_date 3 147.000 49.000 Residual 6 0.000 0.000 Total 11 147.000 Variate: time_to_flowering Source of variation d.f. s.s. m.s. v.r. F pr. Rep stratum 2 0.00 0.00 Rep.*Units* stratum Planting_date 3 7166.25 2388.75 Residual 6 0.00 0.00 Total 11 7166.25 Variate: time_to_maturity Source of variation d.f. s.s. m.s. v.r. F pr. Rep stratum 2 8.167 4.083 1.00 Rep.*Units* stratum Planting_date 3 24414.250 8138.083 1993.00 <.001 Residual 6 24.500 4.083 Total 11 24446.917 Variate: time_to_podding Source of variation d.f. s.s. m.s. v.r. F pr. Rep stratum 2 906.5 453.2 0.88 Rep.*Units* stratum Planting_date 3 11596.7 3865.6 7.53 0.019 Residual 6 3078.8 513.1 Total 11 15582.0

78
Variate: Hundred grain_seed_mass Source of variation d.f. s.s. m.s. v.r. F pr. Rep stratum 2 1.3333 0.6667 1.00 Rep.Planting_date stratum Planting_date 1 42.6667 42.6667 64.00 0.015 Residual 2 1.3333 0.6667 Total 5 45.3333 Variate: No_Of_pods Source of variation d.f. s.s. m.s. v.r. F pr. Rep stratum 2 23.749 11.875 2.89 Rep.Planting_date stratum Planting_date 1 35.852 35.852 8.72 0.098 Residual 2 8.227 4.113 Total 5 67.828 Variate: Seeds_per_pod Source of variation d.f. s.s. m.s. v.r. F pr. Rep stratum 2 3.804 1.902 1.13 Rep.Planting_date stratum Planting_date 1 13.650 13.650 8.08 0.105 Residual 2 3.379 1.689 Total 5 20.833
Appendix 3: Sweet potatoes
Variate: Leaf_No Source of variation d.f. s.s. m.s. v.r. F pr. Rep stratum 2 164430. 82215. 10.19
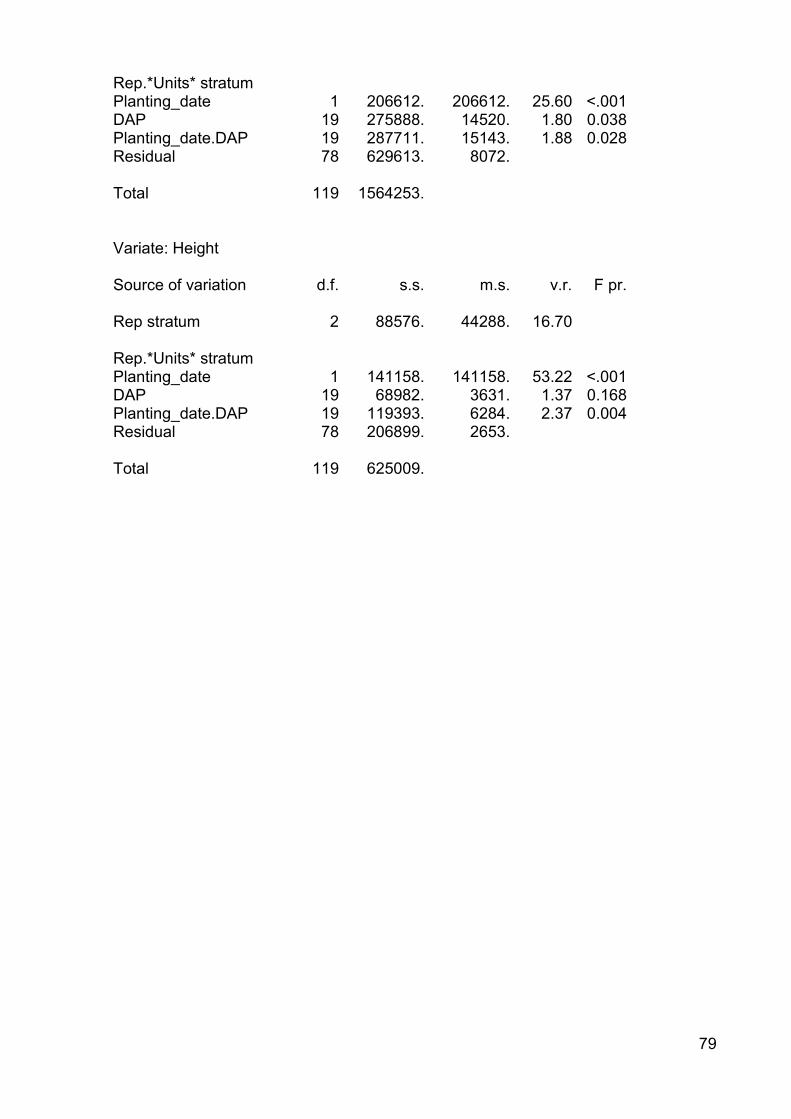
79
Rep.*Units* stratum Planting_date 1 206612. 206612. 25.60 <.001 DAP 19 275888. 14520. 1.80 0.038 Planting_date.DAP 19 287711. 15143. 1.88 0.028 Residual 78 629613. 8072. Total 119 1564253. Variate: Height Source of variation d.f. s.s. m.s. v.r. F pr. Rep stratum 2 88576. 44288. 16.70 Rep.*Units* stratum Planting_date 1 141158. 141158. 53.22 <.001 DAP 19 68982. 3631. 1.37 0.168 Planting_date.DAP 19 119393. 6284. 2.37 0.004 Residual 78 206899. 2653. Total 119 625009.