plants make their own food - mill river schoolsmillriverschools.org/documents/drivesync/curriculum...
TRANSCRIPT

This work is licensed by the MA Department of Elementary & Secondary Education under the Creative Commons Attribution-NonCommercial-ShareAlike 3.0 Unported License (CC BY-NC-SA 3.0). Educators may use, adapt, and/or share. Not for commercial use. To view a copy of the license, visit http://creativecommons.org/licenses/by-nc-sa/3.0/ Page 1 of 47
Plants Make Their Own Food Life Science, Earth Science, and Physical Science: Grade 5
Using principles from Universal Design for Learning (UDL), this unit uses materials from the Concord Consortium to engage students in investigations about photosynthesis and plant growth. Students use the online environment to read a story, reflect on their understanding through writing, and use
models and test variables. Students learn about where earth’s water comes from and goes to and produce and interpret data tables and graphs to show how a plant grows under different conditions. Students create a digital lab book where they collect snapshots of their investigations and activities and
reflect on their understanding of concepts.
This Model Curriculum Unit is designed to illustrate effective curriculum that lead to expectations outlined in the Draft Revised Science and Technology/Engineering Standards (www.doe.mass.edu/STEM/review.html) as well as the MA Curriculum Frameworks for English Language Arts/Literacy
and Mathematics. This unit includes lesson plans, a Curriculum Embedded Performance Assessment, and related resources. In using this unit it is important to consider the variability of learners in your class and make adaptations as necessary.
September, 2014

This work is licensed by the MA Department of Elementary & Secondary Education under the Creative Commons Attribution-NonCommercial-ShareAlike 3.0 Unported License (CC BY-NC-SA 3.0). Educators may use, adapt, and/or share. Not for commercial use. To view a copy of the license, visit http://creativecommons.org/licenses/by-nc-sa/3.0/ Page 2 of 47
Table of Contents
Unit Assumptions and Comments on Sequence…………………………………………………………………………………………………………….3
Unit Plan .................................................................................................................................................................................................................................. 6
Lesson 1: Pre-assessment and Introduction to Plants and Plant Growth ................................................................................................. 10
Lesson 2: How Plants Produce the Food We Eat ................................................................................................................................................. 14
Lesson 3: Plants Role in Water Cycle ....................................................................................................................................................................... 20
Lesson 4: Interpreting and Producing Data Tables and Graphs ................................................................................................................... 24
CEPA : Plants Make Their Own Food …………………………………………………………………………………………………………………………27 Unit Resources: Handouts and Additional Instructional Materials/Resources/Tools……………………………………………..……33

This work is licensed by the MA Department of Elementary & Secondary Education under the Creative Commons Attribution-NonCommercial-ShareAlike 3.0 Unported License (CC BY-NC-SA 3.0). Educators may use, adapt, and/or share. Not for commercial use. To view a copy of the license, visit http://creativecommons.org/licenses/by-nc-sa/3.0/ Page 3 of 47
Unit Assumptions and Comments on Sequence
Assumed knowledge and skills that student should bring to the unit:
• Students will be able to construct an argument that plants have structures that support their survival, growth, behavior, and reproduction. Students should know that plants need water and light to grow. Students should know that plants have different structures that perform different functions (they are not expected to know details). Students have learned how to use a science notebook. Students have interpreted and analyzed data from simple tables and graphs.
Notes about the unit:
• In this unit, students are introduced to the concept of photosynthesis to the depth of how a plant acquires the materials it needs to provide for itself, grow, and store food for animals. It does not go deeply into identifying one of the main products of the process of photosynthesis, glucose, and in accordance with the standard for this grade level, 5-LS1-1, it does not go into its chemical equation.
• Although STE standard 5-ESS2-1 is addressed (in part), in this unit, it is not taught to its fullest intent or depth. We recommend that there be additional opportunities for students to fully learn the concepts embedded in this standard.
• Access to obtaining student and class data on the Concord Consortium website is limited. Therefore, teachers should not set up accounts for students until the unit is updated on the Concord Consortium website. Teachers (and students) can and should access the activities on the site, but the questions that follow in each of the sections, should not be completed online. Instead, these questions have been copied into handouts for the students to complete.
• This unit has online components for students to interact with, but it can also be adapted so that the teacher can use “paper and pencil” alternatives. Teachers may choose any of the following: each student has access to a computer to complete the unit; students can work in groups of 2-4 with each group having a computer; or a teacher may project the website to the class.
• Before implementing this unit teachers should:
o Become familiar with the scope and parts of this unit. Teachers should access and review the Universal Design for Learning (UDL) Beginning and Intermediate Plants Unit at http://udl.portal.concord.org/activities/. (This unit will have its own pop up window in Java.) Teachers should click on icons in the Java Plants Beginning Unit to become familiar with the following

This work is licensed by the MA Department of Elementary & Secondary Education under the Creative Commons Attribution-NonCommercial-ShareAlike 3.0 Unported License (CC BY-NC-SA 3.0). Educators may use, adapt, and/or share. Not for commercial use. To view a copy of the license, visit http://creativecommons.org/licenses/by-nc-sa/3.0/ Page 4 of 47
sections: Pre-Test, Story, Modeling and Post-Test. Teachers should click on icons in the Java Plants Intermediate Unit to become familiar with the following section: Math and Introdction.
o Sign up on the website so that they view the Teacher Resources. The Teacher Guide for this unit located at http://udl.concord.org/share/teacher-guides/TG_Plants-Beginning-2010-final.pdf.
• In addition, we also recommend that teachers:
o Collect seeds and plants to show the class (Lessons 1 and 3)
o Have each student use a ½ inch 3-ring binder serve as their science notebook. This will allow students to keep track of the handouts for this unit.
o Plan to build Biome in a Baggie days before you begin this unit so it will be ready to show with students during lesson 3. Review the video Biome in a Baggie for directions on how to build one. (http://mass.pbslearningmedia.org/resource/tdc02.sci.life.stru.baggiezoom/biome-in-a-baggie/).
• Throughout the unit, notes to the teacher are either noted as such or written in parentheses, and distinguished with red font.
• All handouts are located at the end of the unit.
• You may need to establish an account with PBSLearningMedia (http://mass.pbslearningmedia.org/) to access the resources in this unit. It is free and enables you access to other PBSLearningMedia resources.
• See the Additional Instructional Materials/Resources/Tools (page 33) section at the end of this unit for resources that provide background information and support the teaching of this unit

This work is licensed by the MA Department of Elementary & Secondary Education under the Creative Commons Attribution-NonCommercial-ShareAlike 3.0 Unported License (CC BY-NC-SA 3.0). Educators may use, adapt, and/or share. Not for commercial use. To view a copy of the license, visit http://creativecommons.org/licenses/by-nc-sa/3.0/ Page 5 of 47

This work is licensed by the MA Department of Elementary & Secondary Education under the Creative Commons Attribution-NonCommercial-ShareAlike 3.0 Unported License (CC BY-NC-SA 3.0). Educators may use, adapt, and/or share. Not for commercial use. To view a copy of the license, visit http://creativecommons.org/licenses/by-nc-sa/3.0/ Page 6 of 47
Stage 1 Desired Results ESTABLISHED GOALS G Science and Technology/Engineering:
[NOTE: These are draft revised STE standards (as of 12/20/13); final adopted STE standards may be slightly different.]
5-ESS2-1. Use a model to describe the cycling of water on Earth between the geosphere, biosphere, hydrosphere, and atmosphere through evaporation, precipitation, surface runoff, condensation, transpiration, and runoff. [Assessment Boundary: Assessment does not include explanations of mechanisms that drive the cycle.]
5-LS1-1. Support an argument with evidence that plants get the materials they need for growth and reproduction chiefly through a process in which they use air, water, and energy from the sun to produce sugars and plant materials . [Assessment Boundary: The chemical formula or details about the process of photosynthesis is not expected.]
5-PS3-1. Use a model to describe that the food animals digest: a. contains energy that was once energy from the sun, and b. provides energy and materials for body repair, growth, motion, body warmth, and reproduction. [Clarification Statement: Examples of models could include diagrams and flow charts.] [Assessment Boundary: Details of photosynthesis or respiration are not expected.]
English Language Arts and Literacy:
CCSS.ELA-Literacy.W.5.2. Write informative/explanatory texts to examine a topic and convey ideas clearly.
Transfer Students will be able to independently use their learning to… T
Meaning UNDERSTANDINGS U Students will understand that…
1. The materials that make up a plant come mostly from carbon dioxide in the air and from water, not from the soil.
2. Plants get the water they need as water cycles through the Earth’s systems (the geosphere (solid earth), the hydrosphere (the earth’s waters), and atmosphere (air surrounding the earth), and the biosphere (where plants and animals live)) through the processes of evaporation, precipitation, condensation, transpiration, and runoff.
3. Plants get the materials they need for
growth and reproduction mostly through a process called photosynthesis.
4. Photosynthesis requires light energy
(from the Sun) for a part of air (carbon dioxide) and water to combine to form sugar (glucose) and oxygen.
5. The sugars can be immediately used or stored for growth or later use, such as flower and seed production.
6. There is a relationship between
ESSENTIAL QUESTIONS Q 1. How does a small seed turn into a large
plant?
2. How do plants get the material and energy required for growth?

This work is licensed by the MA Department of Elementary & Secondary Education under the Creative Commons Attribution-NonCommercial-ShareAlike 3.0 Unported License (CC BY-NC-SA 3.0). Educators may use, adapt, and/or share. Not for commercial use. To view a copy of the license, visit http://creativecommons.org/licenses/by-nc-sa/3.0/ Page 7 of 47
CCSS.ELA-Literacy.SL.5.4. Report on a topic or text or present an opinion, sequencing ideas logically and using appropriate facts and relevant, descriptive details to support main ideas or themes; speak clearly at an understandable pace.
Mathematics:
CCSS.Math.Content.5.G.A.2. Represent real-world and mathematical problems by graphing points in the first quadrant of the coordinate plane, and interpret coordinate values of points in the context of the situation.
environmental conditions and plant growth.
7. The energy and materials that animals
need for their bodies come from plants and can be traced back to the sun.
8. Models can use symbols to represent
parts and processes in scientific contexts. Acquisition
Students will know… K
1. Leaves have parts within them that perform photosynthesis.
2. Carbon dioxide is taken in by leaves and water is taken in by roots.
3. Air (carbon dioxide) and water recombine inside the plant to form sugar (glucose).
4. Sugar (glucose) is used by the plant as energy, or converted into other substances (such as starch) for storing energy, or converted into other substances (such as cellulose) for structures inside cells.
Students will be skilled at… S
1. Determining the meaning of symbols used in a specific scientific model.
2. Using models to build conceptual understanding.
3. Supporting their explanation using evidence from informational texts (data, graphs, texts, etc…)
4. Analyzing plant growth using data tables and graphs.
5. Drawing conclusions and defending their claims using data.
Stage 2 - Evidence Evaluative Criteria Assessment Evidence See CEPA Rubric CURRICULUM EMBEDDED PERFORMANCE ASSESSMENT (PERFORMANCE TASKS) PT
Students will participate in a mock competition by the Boston Children’s Museum to develop a model for a new exhibit that shows the connections between plants, animals, and their surroundings. Each model must show how plants get the materials they need through the cycling of water on earth and the process of photosynthesis to grow and store food-energy, and how animals acquire that food-energy. Informative descriptions must accompany the model.

This work is licensed by the MA Department of Elementary & Secondary Education under the Creative Commons Attribution-NonCommercial-ShareAlike 3.0 Unported License (CC BY-NC-SA 3.0). Educators may use, adapt, and/or share. Not for commercial use. To view a copy of the license, visit http://creativecommons.org/licenses/by-nc-sa/3.0/ Page 8 of 47
OTHER EVIDENCE: OE Pre-assessment Science notebooks with responses to posed questions and notes on observations Computer-based post assessment Interpreting and Producing Data Tables and Graphs handout Class discussions Homework- Food-o-Meter questions
Stage 3 – Learning Plan Summary of Key Learning Events and Instruction
Lesson 1: Pre-assessment and Introduction to Plants and Plant Growth In this lesson, the teacher introduces the unit to the students. Students come up with their own questions about how plants make food. Then they will take a pre-test to gauge their understanding of the basic functions of plant structures and what plants need to grow. Students will also read a story about how plants grow and be asked questions about the story. This lesson is an introduction to the unit and the questions should be used as formative tools. (90 minutes or 2 X 45 minute sessions) Lesson 2: How Plants Produce the Food We Eat In this lesson, students examine a model to determine how models in science help us understand phenomena and that models have limitations. In this lesson, students compare seeds to their corresponding plants to continue to build on their understanding of how plants grow. Students make predictions and engage with a computer model (Food-O-Meter) to show how varying exposure to water, sunlight, and carbon dioxide affect a plant’s growth. Students view a short photosynthesis video; discuss the limitations and benefits of using models; and follow with an interactive PBS video to understand Energy Flow. Students learn that the food animals (including humans) eat for the energy they need include plants or can be traced back to plants and ultimately the Sun. (90 minutes or 2 X 45 minute sessions) Lesson 3: Plants Role in the Water Cycle In this lesson, students learn about where Earth’s water comes from and goes to. They watch a video in which a plant that was grown in a sealed, self-contained system called a biome gets the water it needs to sustain its growth, partially demonstrating the cycling of water on Earth. (50 minutes) Lesson 4: Interpreting and Producing Data Tables and Graphs In this lesson, students will produce and interpret data tables and graphs to show how a plant grows under different conditions. Students will use the Lesson 4 Handout which is based on the Concord Consortium’s UDL Intermediate Plants Unit. (Note: The handout is not the same as the UDL Unit.). (45 minutes)

This work is licensed by the MA Department of Elementary & Secondary Education under the Creative Commons Attribution-NonCommercial-ShareAlike 3.0 Unported License (CC BY-NC-SA 3.0). Educators may use, adapt, and/or share. Not for commercial use. To view a copy of the license, visit http://creativecommons.org/licenses/by-nc-sa/3.0/ Page 9 of 47
Curriculum Embedded Performance Assessment Students will work independently to complete the Curriculum Embedded Performance Assessment (CEPA) for this unit. Students will participate in a mock competition by the Boston Children’s Museum to develop a model for a new exhibit that shows the connections between plants, animals, and their surroundings. Each model must show how plants get the materials they need through the cycling of water on earth and the process of photosynthesis to grow and store food-energy, and how animals acquire that food-energy. Informative descriptions must accompany the model. The CEPA is the summative assessment for the unit. (90 minutes or 2 X 45 minute sessions) Adapted from Understanding by Design 2.0 © 2011 Grant Wiggins and Jay McTighe Used with Permission July 2014

This work is licensed by the MA Department of Elementary & Secondary Education under the Creative Commons Attribution-NonCommercial-ShareAlike 3.0 Unported License (CC BY-NC-SA 3.0). Educators may use, adapt, and/or share. Not for commercial use. To view a copy of the license, visit http://creativecommons.org/licenses/by-nc-sa/3.0/ Page 10 of 47
Lesson 1: Pre-assessment and Introduction to Plants and Plant Growth
Brief Overview of Lesson: In this lesson, the teacher introduces the unit to the students. Students come up with their own questions about how plants make food. Then they will take a pre-test to gauge their understanding of the basic functions of plant structures and what plants need to grow. Students will also read a story about how plants grow and be asked questions about the story. This lesson is an introduction to the unit and the questions should be used as formative tools. Prior Knowledge Required:
• 1-LS1-1b: Use evidence to explain that plants have roots, stems, leaves, flowers, and fruits that are used to take in nutrients, water, and air, produce food (sugar), and make new plants.
• 4-LS1-1: Construct an argument that animals and plants have internal and external structures that support their survival, growth, behavior, and reproduction.
Estimated Time: 90 minutes
Resources for Lesson: • Chart paper and markers • Computer(s) for each student, group of students, or teacher - loaded with technical requirements and UDL Beginning Plant Unit. • Access the UDL Beginning Plant Unit on the Concord Consortium site http://udl.portal.concord.org/activities/. • Handouts: Pre-assessment, A Plant Story (http://udl.concord.org/share/teacher-guides/Plants34_v7.pdf), and questions related to A Plant Story • Science notebooks for each student (1/2 in. 3-ring binders)

This work is licensed by the MA Department of Elementary & Secondary Education under the Creative Commons Attribution-NonCommercial-ShareAlike 3.0 Unported License (CC BY-NC-SA 3.0). Educators may use, adapt, and/or share. Not for commercial use. To view a copy of the license, visit http://creativecommons.org/licenses/by-nc-sa/3.0/ Page 11 of 47
Standard(s)/Unit Goal(s) to be addressed in this lesson: • 5-LS1-1. Support an argument with evidence that plants get the materials they need for growth and reproduction chiefly through a process in
which they use air, water, and energy from the sun to produce sugars and plant materials. [Assessment Boundary: The chemical formula or details about the process of photosynthesis is not expected.]
• CCSS.ELA-Literacy.W.5.2. Write informative/explanatory texts to examine a topic and convey ideas clearly. Essential Question(s) addressed in this lesson:
• How does such a small seed turn into a much larger plant? • How do plants get the material and energy required for growth?
Objective:
• Students will understand that the materials that make up a plant come mostly from carbon dioxide in the air and from water, not from the soil. Targeted Academic Language:
Scientific Language Academic Language Other Language for this Lesson fertilizer function radish light energy transported mounds carbon dioxide label sprouting sugar describe x-ray oxygen model symbol
What students should know and be able to do before starting this lesson:
• Use evidence to explain that plants have roots, stems, leaves, flowers, and fruits that are used to take in nutrients, water, and air, produce food (sugar), and make new plants.
• Construct an argument that plants have structures that support their survival, growth, behavior, and reproduction.
Anticipated Student Preconceptions/Misconceptions
• Students may assume that plants get their materials from soil. They may have difficulty grasping the concept that the materials comes from the water and air.

This work is licensed by the MA Department of Elementary & Secondary Education under the Creative Commons Attribution-NonCommercial-ShareAlike 3.0 Unported License (CC BY-NC-SA 3.0). Educators may use, adapt, and/or share. Not for commercial use. To view a copy of the license, visit http://creativecommons.org/licenses/by-nc-sa/3.0/ Page 12 of 47
Instructional Materials/Resources/Tools • Chart paper and markers • Computer(s) for each student, group of students, or teacher - loaded with technical requirements and UDL Beginning Plant Unit. • Access the UDL Beginning Plant Unit on the Concord Consortium site http://udl.portal.concord.org/activities/. • Handouts: Pre-test, A Plant Story (http://udl.concord.org/share/teacher-guides/Plants34_v7.pdf), and questions related to A Plant Story • Science notebooks for each student
Instructional Tips/Strategies/Notes for Teacher
• Show students several different types of seeds (e.g., acorn, sunflower, fruit, vegetable) so they are familiar with what a plant starts out as. Also show them house plants or plants outside to show students what the seeds can become.
Assessment
• Formative assessment questions during lesson. Lesson Details Lesson Opening (suggested time: 15 minutes): Introduce the unit and explain what students will be learning about plants. Introduce the essential questions and post them on chart paper. After explaining what they will be learning, ask students to come up with questions that they would want answered during the unit. Keep this list of questions and refer to it at the beginning of each unit to see if the questions are being answered. During Lesson Activity 1: Pre-test (suggested time: 30 minutes):
1. Have students work individually or in pairs and answer the pre-test questions using Lesson 1: Pre-Test handout at the end of this unit. (Questions can also be viewed online).
2. Go over these questions with the class and determine any student preconceptions/misconceptions.
Activity 2: Plant Story (suggested time: 30 minutes) 1. Have students read the Plant Story*. (This can be done as a class or individually. The story can be read on the computer or can be printed out. If
using the computer set students up with computers and have them open the Concord Consortium UDL for Intermediate Plants Unit. http://udl.portal.concord.org/activities/) * Story goes beyond the limits of the standards for grade 5 (introduces vocabulary such as stomata, chloroplast and hydrogen.)
2. Project the sunflower video from the Introduction section of the Intermediate Plants Unit. The video shows 24 hours in the life of a sunflower. Students watch how the leaves and the flowers follow the movement of the sun.

This work is licensed by the MA Department of Elementary & Secondary Education under the Creative Commons Attribution-NonCommercial-ShareAlike 3.0 Unported License (CC BY-NC-SA 3.0). Educators may use, adapt, and/or share. Not for commercial use. To view a copy of the license, visit http://creativecommons.org/licenses/by-nc-sa/3.0/ Page 13 of 47
Closing Lesson (suggested time: 15 minutes): Ask students to work in pairs and answer the questions at the end of the story. Tell them they will be collected and looked at by the teacher (but they will not be graded). (The story and questions can either be distributed as handouts or viewed online.) Formative assessment: The list of questions generated by students will help guide instruction for the unit. The pre-test and questions from the Plant Story will also serve as formative assessment tools. Preview outcomes for the next lesson: Share a brief overview of Lesson 2 with students.
This work is licensed by the MA Department of Elementary & Secondary Education under the Creative Commons Attribution-NonCommercial-ShareAlike 3.0 Unported License (CC BY-NC-SA 3.0). Educators may use, adapt, and/or share. Not for commercial use. To view a copy of the license, visit http://creativecommons.org/licenses/by-nc-sa/3.0/ Page 14 of 47
Lesson 2: How Plants Produce the Food We Eat Brief Overview of Lesson: Students examine a model to determine how models in science help us understand phenomena and that models have limitations. In this lesson, students compare seeds to their corresponding plants to continue to build on their understanding of how plants grow. Students make predictions and engage with a computer model (Food-O-Meter) to show how varying exposure to water, sunlight, and carbon dioxide affect a plant’s growth. Students view a short photosynthesis video; discuss the limitations and benefits of using models; and follow with an interactive PBS video to understand Energy Flow. Students learn that the food animals (including humans) eat for the energy they need include plants or can be traced back to plants and ultimately the Sun. Prior Knowledge Required:
• 1-LS1-1b: Use evidence to explain that plants have roots, stems, leaves, flowers, and fruits that are used to take in nutrients, water, and air, produce food (sugar), and make new plants.
• 4-LS1-1: Construct an argument that animals and plants have internal and external structures that support their survival, growth, behavior, and reproduction.
• Concepts learned in Lesson 1 of this unit.
Estimated Time: 90 minutes
Resources for Lesson: • Computer(s) for each student, group of students, or teacher - loaded with technical requirements and UDL Beginning Plant Unit. • Access the UDL Beginning Plant Unit on the Concord Consortium site http://udl.portal.concord.org/activities/, the Illuminating Photosynthesis
model: http://mass.pbslearningmedia.org/resource/tdc02.sci.life.stru.methusweb/illuminating-photosynthesis/, and the Food-O-Meter interactive: http://authoring.concord.org/sequences/56.
• An earth globe • Science notebooks • Handout: Food-o-Meter: What do plants need to stay alive? (All handouts are located at the end of the unit.)
For background information and instructional support: • Next Generation Science Standards’ description of the science and engineering practices, APPENDIX F – Science and Engineering Practices in NGSS,
http://nextgenscience.org/sites/ngss/files/Appendix%20F%20%20Science%20and%20Engineering%20Practices%20in%20the%20NGSS%20-%20FINAL%20060513.pdf. See page 6 on Developing and Using Models.
• Photosynthesis Explained http://youtu.be/JJxZH_Y5D4s* * Video goes beyond the limits of the standards for grade 5 (introduces equation for photosynthesis.

This work is licensed by the MA Department of Elementary & Secondary Education under the Creative Commons Attribution-NonCommercial-ShareAlike 3.0 Unported License (CC BY-NC-SA 3.0). Educators may use, adapt, and/or share. Not for commercial use. To view a copy of the license, visit http://creativecommons.org/licenses/by-nc-sa/3.0/ Page 15 of 47
What students should know and be able to do before starting this lesson: • Use evidence to explain that plants have roots, stems, leaves, flowers, and fruits that are used to take in nutrients, water, and air, produce food
(sugar), and make new plants. • Construct an argument that plants have structures that support their survival, growth, behavior, and reproduction.
Anticipated Student Preconceptions/Misconceptions Students may think that:
• Plants get their mass from soil. They may have difficulty grasping the concept that the mass comes from water and air. • Plants get food from their roots and the soil. • Minerals in the soil, water and/or the soil provide food for plants • All plants store their food in their leaves. Leaves are the only place where food is stored.
Standard(s)/Unit Goal(s) to be addressed in this lesson:
• 5-LS1-1. Support an argument with evidence that plants get the materials they need for growth and reproduction chiefly through a process in which they use air, water, and energy from the Sun to produce sugars and plant materials. [Assessment Boundary: The chemical formula or details about the process of photosynthesis is not expected.]
• 5-PS3-1. Use a model to describe that the food animals digest: a. contains energy that was once energy from the sun, and b. provides energy and materials for body repair, growth, motion, body warmth, and reproduction. [Clarification Statement: Examples of models could include diagrams and flow charts.] [Assessment Boundary: Details of photosynthesis or respiration are not expected.]
Essential Question(s) addressed in this lesson:
• How does such a small seed turn into a much larger plant? • How do plants get the material and energy required for growth?
Objectives Students will understand that:
• Materials that make up a plant come mostly from carbon dioxide in the air and from water, not from the soil. • Plants get the materials they need for growth and reproduction mostly through a process called photosynthesis.

This work is licensed by the MA Department of Elementary & Secondary Education under the Creative Commons Attribution-NonCommercial-ShareAlike 3.0 Unported License (CC BY-NC-SA 3.0). Educators may use, adapt, and/or share. Not for commercial use. To view a copy of the license, visit http://creativecommons.org/licenses/by-nc-sa/3.0/ Page 16 of 47
• Photosynthesis requires light energy (from the Sun), air (carbon dioxide), and water to form sugar (glucose) and oxygen. • The sugars a plant produces can be immediately used or stored for growth or later use, such as flower and seed production. • There is a relationship between environmental conditions and plant growth. • The energy and materials that animals need for their bodies come from plants and can be traced back to the sun. • Models can use symbols to represent parts and processes in scientific contexts.
Students will be skilled at:
• Determining the meaning of symbols used in a specific scientific model. • Using models to build conceptual understanding.
Targeted Academic Language
Scientific Language Academic Language Other Language for this Lesson photosynthesis function half a billionth (0.0000005%) light energy transported one-tenth (10%) calories label vaporized describe molecule model symbol
What students should know and be able to do before starting this lesson:
• Use evidence to explain that plants have roots, stems, leaves, flowers, and fruits that are used to take in nutrients, water, and air, produce food (sugar), and make new plants.
• Construct an argument that plants have structures that support their survival, growth, behavior, and reproduction. • Concepts learned in Lesson 1 of this unit.
Anticipated Student Preconceptions/Misconceptions Students may think that:
• Plants get their mass from soil. They may have difficulty grasping the concept that the mass comes from the water and air. • Plants get food from their roots and the soil. • Minerals in the soil, water and/or the soil provide food for plants • All plants store their food in their leaves. Leaves are the only place where food is stored.

This work is licensed by the MA Department of Elementary & Secondary Education under the Creative Commons Attribution-NonCommercial-ShareAlike 3.0 Unported License (CC BY-NC-SA 3.0). Educators may use, adapt, and/or share. Not for commercial use. To view a copy of the license, visit http://creativecommons.org/licenses/by-nc-sa/3.0/ Page 17 of 47
Instructional Materials/Resources/Tools • Computer(s) for each student, group of students, or teacher - loaded with technical requirements and UDL Beginning Plant Unit. • Access the UDL Beginning Plant Unit on the Concord Consortium site http://udl.portal.concord.org/activities/, the Illuminating Photosynthesis
model: http://mass.pbslearningmedia.org/resource/tdc02.sci.life.stru.methusweb/illuminating-photosynthesis/, and the Food-O-Meter interactive: http://authoring.concord.org/sequences/56.
• An earth globe • Science notebooks • Handout: Food-o-Meter: What do plants need to stay alive?
For background information and instructional support: • Next Generation Science Standards’ description of the science and engineering practices, APPENDIX F – Science and Engineering Practices in NGSS,
http://nextgenscience.org/sites/ngss/files/Appendix%20F%20%20Science%20and%20Engineering%20Practices%20in%20the%20NGSS%20-%20FINAL%20060513.pdf. See page 6 on Developing and Using Models.
• Photosynthesis Explained http://youtu.be/JJxZH_Y5D4s* * Video goes beyond the limits of the standards for grade 5 (introduces equation for photosynthesis.)
Instructional Tips/ Strategies/Notes for Teacher
• Review the posted list of student questions generated from Lesson 1 and note which items will be addressed in this lesson. Assessment
• Formative: Discussion questions on modeling; follow up questions for the Plant Food-O-Meter activity. Questions can be handed in for a grade. Lesson Details Opening Lesson: (suggested time: 20 minutes) Models: Engage students in the following display and discussion about models and their limitations.
(Possibly give probe: Is It a Model? Uncovering Student Ideas in Science (Volume 4) - 25 NEW Formative Assessment Probes by Page Keeley and Joyce Tugel (2009)).
1. Ask students, “What is a scientific model?” (This is brainstorming exercise to see what students know (or think they know) about models/modeling. It is okay if there are some wrong or inappropriate responses.)
2. Holding the Earth Globe, ask students, “What is this a model of?” (Planet Earth) 3. Ask and discuss, “What does this model represent well?” (Continents, shape of the earth, oceans, mountain ranges, equator, relative size, etc) 4. Ask and discuss, “What does this model not represent?” (Size, place in space, individual states, small bodies of water) Ask, “Why?” 5. Ask and discuss, “How does one know what is displayed on this model?” (Everything (or most everything) is labeled. There are also symbols to
represent or identify things. Explain what the symbols mean and how to interpret them.)

This work is licensed by the MA Department of Elementary & Secondary Education under the Creative Commons Attribution-NonCommercial-ShareAlike 3.0 Unported License (CC BY-NC-SA 3.0). Educators may use, adapt, and/or share. Not for commercial use. To view a copy of the license, visit http://creativecommons.org/licenses/by-nc-sa/3.0/ Page 18 of 47
6. Ask and discuss, “Do all models look the same? Why or why not?” “What are some other types of models?” (See Instructional Materials/Resources/Tools for resource on modeling.)
7. Ask and discuss, “What are some of the benefits and limitations of this model or models in general?” (See Instructional Materials/Resources/Tools for resource on modeling.)
8. Revisit the question “What is a scientific model?” and discuss how students now define a model or modeling. 9. Explain to students that we will be exploring a computer model that will demonstrate what happens inside a leaf, this model will be an animation
(not the real object) and we will be able to select different variables to change that will affect the model. During Lesson: Part A. From Seed to Plant: Amassing Mass (suggested time: 10 minutes)
1. Show students a picture or an actual seed (for a bean, grass, corn, herbs, nut, etc.) and its corresponding plant/tree (and in some cases, fruit, bark, etc.), and write the following questions on the board: How does a seed get the materials it needs to grow into a plant come from? Where do the materials that make up a tree trunk come from?
2. Have students write their explanations/responses in their science notebook. 3. Have students then turn to a partner to discuss their responses or discuss students’ responses as a whole class.
(Note to teacher: Students’ responses will reveal their preconceptions and possible misconceptions. Do not correct students’ responses at this point. You will revisit these questions later.)
Part B. Photosynthesis (suggested time: 15 minutes)
1. Let students know that they will now be interacting with a computer model that simulates the process by which plants acquire the materials they need to grow.
2. Use the Illuminating Photosynthesis: http://mass.pbslearningmedia.org/resource/tdc02.sci.life.stru.methusweb/illuminating-photosynthesis/ model to demonstrate how plants take in sunlight, the air we breathe out (carbon dioxide), and water, and releases the air we breathe in (in part oxygen). (Note to teacher: If possible, allow students to interact with this model on their own. Or, you may display this model from your computer to the whole class.) Launch the program. Click on “The Cycle” tab. Follow the instructions on the interactive. Explain to students what is happening in the interactive model. Use the Discussion question at the bottom of the page to guide the students.
3. Discuss the benefits, limitations, and need for using a model such as this.
Part C. The Food-o-Meter: What do Plants Need to Stay Alive? (suggested time: 20 minutes) In this activity, students will use a computer model of a growing plant, called the Food-o-Meter. It will show the effect of water, sunlight, and carbon dioxide on the health of the plant. (Note to teacher: If possible, allow students to interact with this model on their own. Or, you may display this model from your computer to the whole class.)

This work is licensed by the MA Department of Elementary & Secondary Education under the Creative Commons Attribution-NonCommercial-ShareAlike 3.0 Unported License (CC BY-NC-SA 3.0). Educators may use, adapt, and/or share. Not for commercial use. To view a copy of the license, visit http://creativecommons.org/licenses/by-nc-sa/3.0/ Page 19 of 47
Introduce this activity to students and explain its purpose. Click on Food-O-Meter link, http://authoring.concord.org/sequences/56. Click on module 2 (Food-O-Meter: What plants need to…). Have students write responses to Questions 1, 2, and 3 in section 2 (Engage I) in their science notebooks. Have students interact with
sections 3–7 (Engage II and III, and Explore I, II, and III). They are not to go beyond section 7! The questions in sections 8 and 9 (Explain and Elaborate) are for homework. (Questions are provided in handout section, What do plants need to stay alive?)
Part D. Food/Energy for and from Plants and the Animals that Eat It (suggested time: 15 minutes)
In this activity, the teacher walks students through an interactive cartoon which describes the process by which energy from the sun is captured by plants and then passed on to humans and other animals through the foods they eat. There are questions for students to answer throughout the cartoon. Introduce this activity to students and explain its purpose. To access the cartoon, go to PBS Learning Media Energy Flow online visual
(http://mass.pbslearningmedia.org/asset/tdc02_int_energyflow/) As you go through the cartoon with students, discuss what is happening.
Closing Lesson: (suggested time: 10 minutes)
• Revisit the essential questions. Have students respond to these questions in light of what they have learned in this lesson. • Review the posted list of student responses, questions, and ideas generated from Lesson 1 and have students answer/edit/add to any item that
have been addressed in this lesson. Remind students to use evidence from their observations and interactions to support your explanation. • Homework: Complete the handout with questions from the Food-O-Meter activity.
Formative assessments:
• Discussion questions, Food-o-Meter worksheet, written responses in science notebook, and homework. Preview outcomes for the next lesson:
• Share a brief overview of Lesson 3 with students.

This work is licensed by the MA Department of Elementary & Secondary Education under the Creative Commons Attribution-NonCommercial-ShareAlike 3.0 Unported License (CC BY-NC-SA 3.0). Educators may use, adapt, and/or share. Not for commercial use. To view a copy of the license, visit http://creativecommons.org/licenses/by-nc-sa/3.0/ Page 20 of 47
Lesson 3: Plants Role in the Water Cycle
Brief Overview of Lesson: In this lesson, students learn about where earth’s water comes from and goes to. They watch a video in which a plant that was grown in a sealed, self-contained system called a biome gets the water it needs to sustain its growth, partially demonstrating the cycling of water on earth. Prior Knowledge Required:
• 1-LS1-1b: Use evidence to explain that plants have roots, stems, leaves, flowers, and fruits that are used to take in nutrients, water, and air, produce food (sugar), and make new plants.
• 4-LS1-1: Construct an argument that animals and plants have internal and external structures that support their survival, growth, behavior, and reproduction.
• Concepts learned in Lessons 1 and 2 of this unit. Estimated Time: 50 minutes Resources for Lesson:
• Handout: The Hydrologic Cycle http://www.state.nj.us/drbc/library/documents/water_cycle.pdf • Poster Paper • Science notebooks • Background information:
o Summary of the Water Cycle, U.S. Geological Survey, http://water.usgs.gov/edu/watercyclesummary.html o Thirstin’s Water Cycle (cartoon), US Environmental Protection Agency, http://www.epa.gov/safewater/kids/flash/flash_watercycle.html o World Biomes, Kids do Ecology, http://kids.nceas.ucsb.edu/biomes/
• A teacher-designed biome (like the one in the PBSLearningMedia video) for students to see in person. (This is suggested but not required.) Standard(s)/Unit Goal(s) to be addressed in this lesson:
• 5-ESS2-1. Use a model to describe the cycling of water on Earth between the geosphere, biosphere, hydrosphere, and atmosphere through evaporation, precipitation, surface runoff, condensation, transpiration, and runoff. [Assessment Boundary: Assessment does not include explanations of mechanisms that drive the cycle.]
This work is licensed by the MA Department of Elementary & Secondary Education under the Creative Commons Attribution-NonCommercial-ShareAlike 3.0 Unported License (CC BY-NC-SA 3.0). Educators may use, adapt, and/or share. Not for commercial use. To view a copy of the license, visit http://creativecommons.org/licenses/by-nc-sa/3.0/ Page 21 of 47
• 5-LS1-1. Support an argument with evidence that plants get the materials they need for growth and reproduction chiefly through a process in which they use air, water, and energy from the sun to produce sugars and plant materials. [Assessment Boundary: The chemical formula or details about the process of photosynthesis is not expected.]
Essential Question(s) addressed in this lesson:
• How does such a small seed turn into a much larger plant? • How do plants get the material and energy required for growth?
Objectives: Students will understand that:
• The materials that make up a plant come mostly from carbon dioxide in the air and from water, not from the soil. • Plants get the water they need as water cycles through the earth’s systems (the geosphere (solid earth), the hydrosphere (the earth’s waters), and
atmosphere (air surrounding the earth), and the biosphere (where plants and animals live) through the processes of evaporation, precipitation, condensation, transpiration, and runoff.
Targeted Academic Language:
Scientific Language Academic Language Other Language for this Lesson geosphere runoff cycle hydrosphere system system atmosphere biome biosphere transpiration evaporation condensation precipitation
What students should know and be able to do before starting this lesson: • Use evidence to explain that plants have roots, stems, leaves, flowers, and fruits that are used to take in nutrients, water, and air, produce food
(sugar), and make new plants. • Construct an argument that plants have structures that support their survival, growth, behavior, and reproduction. • Concepts learned in Lessons 1 and 2 of this unit.
Anticipated Student Preconceptions/Misconceptions:
• Students may think that the water plants use to grow only comes from a pipe or from rain. • Students may think that once water goes into the ground/soil is only either taken in by plants or just stays there. • Students may think that water can be created once it is used up. • Students may think that water that comes from the sky (in the form of rain, snow, etc.) originated in outer space.

This work is licensed by the MA Department of Elementary & Secondary Education under the Creative Commons Attribution-NonCommercial-ShareAlike 3.0 Unported License (CC BY-NC-SA 3.0). Educators may use, adapt, and/or share. Not for commercial use. To view a copy of the license, visit http://creativecommons.org/licenses/by-nc-sa/3.0/ Page 22 of 47
Instructional Materials/Resources/Tools • Handout: The Hydrologic Cycle http://www.state.nj.us/drbc/library/documents/water_cycle.pdf • Poster Paper • Science notebooks • Background information:
o Summary of the Water Cycle, US Environmental Protection Agency, http://water.usgs.gov/edu/watercyclesummary.html o Thirstin’s Water Cycle (cartoon), US Environmental Protection Agency, http://www.epa.gov/safewater/kids/flash/flash_watercycle.html o World Biomes, Kids do Ecology, http://kids.nceas.ucsb.edu/biomes/
• A teacher-designed biome (like the one in the PBSLearningMedia video) for students to see in person. (This is suggested but not required.) Instructional Tips/Strategies/Notes for Teacher
• You may need to establish an account with PBSLearningMedia (http://mass.pbslearningmedia.org/) to view the video in this lesson. It is free and enables you access to other PBSLearningMedia resources.
Assessment
• Formative: Discussion questions. Lesson Details Lesson Opening: (suggested time: 15 minutes) A. Homework review: As a class, review the questions assigned for homework in Lesson 2 and students’ responses. Make corrections wherever
necessary. B. Preconceptions about the water cycle:
1. Post the following question on the board, “Where does the water plants need to grow come from?” 2. Ask students to write a brief response to this question in their science notebooks. 3. Discuss their responses as a whole class. Record their responses on poster paper that will stay posted for the remainder of this lesson.
Note to teacher: Students’ answers may be limited to a few ways by which they have seen water accessed. For example, they may think that the water that waters plants only comes from a pipe (to and through a hose or to a water pot), or through rain. Challenge the students’ thinking by asking where the water they have identified comes from, and then where that water comes from and so on. Do no correct incorrect responses at this time. You will revisit this question and their responses at the end of the lesson.
4. Let students know that they will be learning about where Earth’s water comes from and goes to. They will also observe a plant that was grown in a sealed, self-contained system called a biome, gets the water it needs to sustain its growth, partially demonstrating the cycling of water on Earth.

This work is licensed by the MA Department of Elementary & Secondary Education under the Creative Commons Attribution-NonCommercial-ShareAlike 3.0 Unported License (CC BY-NC-SA 3.0). Educators may use, adapt, and/or share. Not for commercial use. To view a copy of the license, visit http://creativecommons.org/licenses/by-nc-sa/3.0/ Page 23 of 47
During Lesson: A. A Model of the Earth’s Water Cycle (suggested time: 10 minutes)
1. Distribute the handout The Hydrologic Cycle (http://www.state.nj.us/drbc/library/documents/water_cycle.pdf). Project the image as well for the whole class to see and for the teacher to reference.
2. Using the handout as a reference, review the process of the hydrologic cycle with students. 3. Identify the: geosphere, biosphere, hydrosphere, and atmosphere. Write their definitions on the board for students to copy into their science
notebooks. Also define the terms used to represent the processes that are a part of the Hydrologic Cycle. (Note to teacher: For the purposes of this unit, earth’s systems and the actual terms used to represent the processes that are a part of the Hydrologic Cycle are not important. Therefore, define but do not emphasize them or students’ remembering them. Do emphasize, however, where plants fit into this cycle.)
4. Discuss the benefits and limitations of this model of the hydrologic/water cycle. B. Biome in a Baggie (suggested time: 20 minutes)
1. Introduce this video and its purpose. 2. Show the video Biome in a Baggie (http://mass.pbslearningmedia.org/resource/tdc02.sci.life.stru.baggiezoom/biome-in-a-baggie/). 3. Pose and discuss with students the discussion questions posted at the bottom on the video’s website. 4. (Optional – if available) Share your personally designed Biome in a Baggie with students to see up close.
Lesson Closing: (suggested time: 5 minutes)
• As a class, revisit the lesson opening question – “Where does the water plants need to grow come from?” and review students’ responses. Have students make corrections where there are mistakes or omissions.
Formative assessment:
• Discussion questions: o Is this a good model of a biome? o What are its strengths? What are its weaknesses?
Preview outcomes for the next lesson:
• Share a brief overview of Lesson 4 with students.

This work is licensed by the MA Department of Elementary & Secondary Education under the Creative Commons Attribution-NonCommercial-ShareAlike 3.0 Unported License (CC BY-NC-SA 3.0). Educators may use, adapt, and/or share. Not for commercial use. To view a copy of the license, visit http://creativecommons.org/licenses/by-nc-sa/3.0/ Page 24 of 47
Lesson 4: Interpreting and Producing Data Tables and Graphs
Brief Overview of Lesson: Students will use the Lesson 4 handout which is based on the Concord Consortium’s UDL Intermediate Plants Unit. (Note: The handout is not the same as the UDL Unit.) Students will produce and interpret data tables and graphs to show how a plant grows under different conditions. Prior Knowledge Required:
• Students are expected to know how to interpret data tables and plot data points on graphs. • Students are expected to know the general effects of watering and sunlight on plants. • Concepts learned in Lessons 1, 2, and 3 of this unit.
Estimated Time: 45 minutes Resources for Lesson:
• Chart paper and markers • Handout: Student data tables and graphs worksheet and Teacher answer key • Science notebooks
Standard(s)/Unit Goal(s) to be addressed in this lesson:
• 5-LS1-1. Support an argument with evidence that plants get the materials they need for growth and reproduction chiefly through a process in which they use air, water, and energy from the sun to produce sugars and plant materials . [Assessment Boundary: The chemical formula or details about the process of photosynthesis is not expected.]
• CCSS.Math.Content.5.G.A.2. Represent real-world and mathematical problems by graphing points in the first quadrant of the coordinate plane, and interpret coordinate values of points in the context of the situation.
Essential Question(s) addressed in this lesson:
• How does a small seed turn into such a large plant? • How do plants get the material and energy required for growth?

This work is licensed by the MA Department of Elementary & Secondary Education under the Creative Commons Attribution-NonCommercial-ShareAlike 3.0 Unported License (CC BY-NC-SA 3.0). Educators may use, adapt, and/or share. Not for commercial use. To view a copy of the license, visit http://creativecommons.org/licenses/by-nc-sa/3.0/ Page 25 of 47
Objectives: • Students will understand relationships between environmental conditions and plant growth. • Students will analyze plant growth using data tables and graphs. • Students will be able to draw conclusions and defend their claims using data. • Student will support their explanations using evidence from data tables and graphs.
Targeted Academic Language
Scientific and Math Language Academic Language Other Language for this Lesson photosynthesis conditions ivy line plots shriveled vine centimeters reasoning graphs effect data points predict/prediction correspond
What students should know and be able to do before starting this lesson:
• Students are expected to know how to interpret data tables and plot data points on graphs. • Students are expected to know the general effects of watering and sunlight on plants. • Concepts learned in Lessons 1, 2, and 3 of this unit.
Anticipated Student Preconceptions/Misconceptions:
• Students may have difficulty producing and interpreting tables and graphs. • Students may have difficulty using appropriate data. • Students may think that plants will die immediately without water or sunlight.
Instructional Materials/Resources/Tools:
• Chart paper and markers • Handout: data tables and graphs • Science notebooks
Instructional Tips/ Strategies/Notes for Teacher:
• As questions and issues on the chart paper are addressed throughout the lesson, be sure to call attention to them and have students edit and add information.
This work is licensed by the MA Department of Elementary & Secondary Education under the Creative Commons Attribution-NonCommercial-ShareAlike 3.0 Unported License (CC BY-NC-SA 3.0). Educators may use, adapt, and/or share. Not for commercial use. To view a copy of the license, visit http://creativecommons.org/licenses/by-nc-sa/3.0/ Page 26 of 47
• The teacher may want to help students by graphing Plant 1 as an example so the students understand the expectations. Assessment There are both formative and interim assessment tools in this lesson. Teachers can use the questions, data table, and graphs in both ways, depending on the expectations of the class. It is suggested, at a minimum, that the questions on page 1 of the handout, the first data table on page 3, and the first graph on page 4 be used as formative assessment tools. It is suggested that page 5 be used as an interim assessment. This can be a homework assignment that can be graded. Lesson Details Lesson Opening: (suggested time: 5 minutes) Tell students they will be examining how water and sunlight affect plant growth. Address any relevant questions or comments on chart paper from Lesson 1 and add any questions or information, as necessary. Ask them what they have already learned about photosynthesis and tell them they are going to apply their knowledge and their math skills to real data. They will be making their own predictions, discussing them with the classmates and figuring out if the data supports their predictions. During Lesson: (suggested time: 30 minutes)
1. Pass out the Data Tables and Graphs worksheet to each student and ask them to complete it. (Note to teacher: You can allow students to work individually or in groups of 2 or more to complete this worksheet. Students should add the worksheet to their science notebooks when completed.)
2. As a class, review the questions and data.
Closing Lesson: As a class, review the questions and data. Have students make corrections where there are mistakes or omissions. Formative assessment: There are both formative and interim assessment tools in this lesson. Teachers can use the questions, data table, and graphs in both ways, depending on the expectations of the class. It is suggested, at a minimum, that the questions on page 1 of the handout, the first data table on page 3, and the first graph on page 4 be used as formative assessment tools. It is suggested that page 5 be used as an interim assessment. This can be a homework assignment that can be graded. Preview outcomes for the next lesson: Share a brief overview of CEPA with students.
This work is licensed by the MA Department of Elementary & Secondary Education under the Creative Commons Attribution-NonCommercial-ShareAlike 3.0 Unported License (CC BY-NC-SA 3.0). Educators may use, adapt, and/or share. Not for commercial use. To view a copy of the license, visit http://creativecommons.org/licenses/by-nc-sa/3.0/ Page 27 of 47
Curriculum Embedded Performance Assessment (CEPA) Plants Make Their Own Food
Teacher Instructions Brief Overview of Lesson: Students will work independently to complete the Curriculum Embedded Performance Assessment (CEPA) for this unit. Students will participate in a mock competition by the Boston Children’s Museum to develop a model for a new exhibit that shows the connections between plants, animals, and their surroundings. Each model must show how plants get the materials they need through the cycling of water on earth and the process of photosynthesis to grow and store food-energy, and how animals acquire that food-energy. Informative descriptions must accompany the model. The CEPA is the summative assessment for the unit. Prior Knowledge Required:
• Concepts and skills learned in Lessons 1 – 4 of this unit. Estimated Time: 2×45-minute session Resources for Lesson (list resources and materials):
• Smart board or document camera or projector • Computers for each student • Science notebooks • Plants Make Their Own Food CEPA - directions sheet • For Students: Plants make Their Own Food CEPA Rubric • Suggested Building Materials:
Large paper Fabric Pictures of plants, leaves, roots, trees, sun, water, flowers etc.
Markers
Colored pencils Glue Modeling clay Scissors Toothpicks Colored paper

This work is licensed by the MA Department of Elementary & Secondary Education under the Creative Commons Attribution-NonCommercial-ShareAlike 3.0 Unported License (CC BY-NC-SA 3.0). Educators may use, adapt, and/or share. Not for commercial use. To view a copy of the license, visit http://creativecommons.org/licenses/by-nc-sa/3.0/ Page 28 of 47
Standard(s)/Unit Goal(s) to be addressed in this lesson: • 5-ESS2-1. Use a model to describe the cycling of water on Earth between the geosphere, biosphere, hydrosphere, and atmosphere through evaporation,
precipitation, surface runoff, condensation, transpiration, and runoff. [Assessment Boundary: Assessment does not include explanations of mechanisms that drive the cycle.]
• 5-LS1-1. Support an argument with evidence that plants get the materials they need for growth and reproduction chiefly through a process in which they use air, water, and energy from the sun to produce sugars and plant materials . [Assessment Boundary: The chemical formula or details about the process of photosynthesis is not expected.]
• 5-PS3-1. Use a model to describe that the food animals digest: a. contains energy that was once energy from the sun, and b. provides energy and materials for body repair, growth, motion, body warmth, and reproduction. [Clarification Statement: Examples of models could include diagrams and flow charts.] [Assessment Boundary: Details of photosynthesis or respiration are not expected.]
• CCSS.ELA-Literacy. CCSS.ELA-Literacy. W.5.2. Write informative/explanatory texts to examine a topic and convey ideas clearly. • CCSS.ELA-Literacy.SL.5.4. Report on a topic or text or present an opinion, sequencing ideas logically and using appropriate facts and relevant, descriptive details
to support main ideas or themes; speak clearly at an understandable pace. Instructional Tips/ Strategies/Notes for Teacher:
• Have building materials and reading/internet resources readily available in several stations around room. • Have students refer back to their science notebooks for additional information. • Optional: Have students create a drawing of their model first before designing.
Goal: Create a model for a new exhibit at Boston’s Children’s Museum that shows the connections between plants, animals, and their surroundings. The challenge is to develop a model that shows how plants get the materials they need through the cycling of water on Earth and the process of photosynthesis to grow and store food-energy, and how animals acquire that food-energy. Your display should clearly show what is needed for photosynthesis to occur, why it is needed and what the products of photosynthesis are. You will also need to describe what happens to these materials. Students will present their models to the class. Role: Students are participating in a model-building challenge. Audience: Boston Children’s Museum staff and visitors to the Boston Children’s Museum. Visitors are mostly families with young children. Situation: The Boston Children’s Museum has challenged fifth grade students to help them design a new exhibit. The museum wants to find the most accurate and visually appealing display that highlights the connections between plants, animals, and their surroundings to the visitors. Product and Purpose: Students will create a model (2D or 3D) that shows how plants acquire the water (through the cycling of water on Earth) and other materials they need to grow and store food-energy for animals. This display will also show animals acquiring the food-energy they need. Students will present their model to the class. Standards and Criteria for Success: See accompanying rubric

This work is licensed by the MA Department of Elementary & Secondary Education under the Creative Commons Attribution-NonCommercial-ShareAlike 3.0 Unported License (CC BY-NC-SA 3.0). Educators may use, adapt, and/or share. Not for commercial use. To view a copy of the license, visit http://creativecommons.org/licenses/by-nc-sa/3.0/ Page 29 of 47
Curriculum Embedded Performance Assessment (CEPA) Plants Make Their Own Food
Student Instructions
Goal: The Boston Children’s Museum is opening a new exhibit about plants, animals, and their surroundings and they want input from students like you. The challenge is to develop a model that shows how plants get the materials they need through the cycling of water on earth and the process of photosynthesis to grow and store food-energy, and how animals acquire that food-energy. Your display should clearly show what is needed for photosynthesis to occur and why it is needed. Your model must introduce the public to key scientific vocabulary and include informative descriptions. You will present your models to the class.
Role: You will be participating in a model-building challenge.
Audience: Boston Children’s Museum staff and visitors to the Boston Children’s Museum. Visitors are mostly families with young children.
Situation: The Boston Children’s Museum has challenged fifth grade students to help them design a new exhibit. The museum wants to find the most accurate and visually appealing display that highlights the connections between plants, animals, and their surroundings to the visitors.
Product and Purpose: You will create a model (2D or 3D) that shows how plants acquire the water (through the cycling of water on Earth) and other materials they need to grow and store food-energy for animals. This display will also show animals acquiring the food-energy they need. You will present your model to the class.
Standards and Criteria for Success: See rubric for details.
Directions: Now that you have learned all about photosynthesis and the water cycle, you will develop a model that is a visual representation of these processes. You will also write a summary of the model to describe your model to museum visitors.
A. Create a model using one of the following media:
• 2D or 3D digital animation • 2D diagram or drawing • 3D model/ possible mediums could be paper, fabric, clay
Be sure to include any necessary keys to symbols you use in your model.

This work is licensed by the MA Department of Elementary & Secondary Education under the Creative Commons Attribution-NonCommercial-ShareAlike 3.0 Unported License (CC BY-NC-SA 3.0). Educators may use, adapt, and/or share. Not for commercial use. To view a copy of the license, visit http://creativecommons.org/licenses/by-nc-sa/3.0/ Page 30 of 47
B. Your model must represent the following scientific concepts:
• Where do plants get the materials they need for growth and reproduction? • What is needed for photosynthesis to occur and why? • How water cycles on earth, and where plants fit into the cycle. • How the food and energy animals need can be traced back to plants and the sun.
C. Write a description for your model that will be presented to the class. Your descriptions should be informative and use scientific vocabulary that help museum visitors understand the science behind your model. The descriptions should include the following sections (see bullet points below): and should be approximately a paragraph long for each explanation.
• Where do plants get the materials they need for growth and reproduction? • What is needed for photosynthesis to occur and why? • How water cycles on earth, and where plants fit into the cycle. • How the food and energy animals need can be traced back to plants and the sun.

This work is licensed by the MA Department of Elementary & Secondary Education under the Creative Commons Attribution-NonCommercial-ShareAlike 3.0 Unported License (CC BY-NC-SA 3.0). Educators may use, adapt, and/or share. Not for commercial use. To view a copy of the license, visit http://creativecommons.org/licenses/by-nc-sa/3.0/ Page 31 of 47
For Students: Plants Make Their Own Food CEPA Rubric
Name: _____________________________________ Date: _____________________
Exceeds Expectations 4
Meets Expectations 3
Developing 2
Does Not Meet Expectations
1
Model
Model clearly illustrates where plants get the materials needed for growth and reproduction.
Display clearly shows the materials and, their source, needed for plants to grow and reproduce.
Display mostly shows the materials and, their source, needed for plants to grow and reproduce.
Display is missing some of the major materials and, their source, needed for plants to grow and reproduce.
Display incorrectly shows the materials and, their source, needed for plants to grow and reproduce.
Model clearly illustrates how plants get their materials needed for growth and reproduction.
Display clearly illustrates how plants get their materials needed for growth and reproduction.
Display mostly illustrates how plants get their materials needed for growth and reproduction.
Display is missing pieces that illustrate how plants get their materials needed for growth and reproduction.
Display incorrectly illustrates how plants get their materials needed for growth and reproduction.
Model clearly illustrates how water cycles on earth, and where plants fit into the cycle.
Water cycle is clearly represented accurately and model includes plants role in cycle.
Water cycle representation is mostly correct and model includes plants role in cycle.
Water cycle is mostly modeled correctly. Did not demonstrate plants role in water cycle.
Water cycle is not represented correctly and/or plants role in water cycle in model.
Model clearly illustrates how the food and energy animals need can be traced back to plants and the sun.
Display clearly illustrates how the food and energy animals need can be traced back to plants and the sun.
Display mostly illustrates how the food and energy animals need can be traced back to plants and the sun.
Display is missing pieces that illustrate how the food and energy animals need can be traced back to plants and the sun.
Display incorrectly illustrates how the food and energy animals need can be traced back to plants and the sun.

This work is licensed by the MA Department of Elementary & Secondary Education under the Creative Commons Attribution-NonCommercial-ShareAlike 3.0 Unported License (CC BY-NC-SA 3.0). Educators may use, adapt, and/or share. Not for commercial use. To view a copy of the license, visit http://creativecommons.org/licenses/by-nc-sa/3.0/ Page 32 of 47
Exceeds Expectations 4
Meets Expectations 3
Developing 2
Does Not Meet Expectations
1 Model Description
All parts of the model are clearly labeled and keys to symbols used are included.
All parts clearly labeled and keys are included
All parts labeled and keys are mostly included.
Missing parts to model. Missing some labels and keys.
Many parts are missing from model. Missing many labels
and keys.
Writing: Uses grade appropriate scientific and academic language and clearly expresses the science behind the model (includes scientific vocabulary)
Words are clear, precise, and accurate. All terms used correctly
and in context.
Words are mostly clear, precise, and accurate. Most of the terms are used correctly
and in context.
Two or more missing terms. Words are mostly clear,
precise, and/or accurate. Most of the terms are used
correctly and in context.
Words are not clear, precise, and/or accurate. Terms are
not used correctly or in context.
Speaking: Topic is presented in a logical sequence, includes facts, and speaks clearly at an understandable pace.
Topic is presented in a logical sequence, includes facts, and speaks clearly at an understandable pace.
Topic is mostly presented in a logical sequence, includes
facts, and speaks clearly at an understandable pace.
Topic is presented in mostly logical sequence, includes
facts, and speaks at a mostly understandable pace.
Topic is not presented in a logical sequence, does not
include facts, and speaks at a non-understandable pace.
Total: _______________________________ Score: ______________________________
This work is licensed by the MA Department of Elementary & Secondary Education under the Creative Commons Attribution-NonCommercial-ShareAlike 3.0 Unported License (CC BY-NC-SA 3.0). Educators may use, adapt, and/or share. Not for commercial use. To view a copy of the license, visit http://creativecommons.org/licenses/by-nc-sa/3.0/ Page 33 of 47
Unit Resources: Handouts and Additional Instructional Materials/Resources/Tools
Lesson 1: Pre-assessment handout, A Plant Story (http://udl.concord.org/share/teacher-guides/Plants34_v7.pdf), and questions related to A Plant Story
Lesson 2: The Food-o-Meter: What do plants need to stay alive? handout
Lesson 3: Diagram of The Hydrologic Cycle from the Delaware Basin Commission: http://www.state.nj.us/drbc/library/documents/water_cycle.pdf Lesson 4:
• Students will use the Lesson 4 Handout which is based on the Concord Consortium’s UDL Intermediate Plants Unit. (Note: The handout is not the same as the UDL Unit.) Students will produce and interpret data tables and graphs to show how a plant grows under different conditions.
• Data Tables and Graphs student worksheet
• Teacher answer key for graphs and tables

This work is licensed by the MA Department of Elementary & Secondary Education under the Creative Commons Attribution-NonCommercial-ShareAlike 3.0 Unported License (CC BY-NC-SA 3.0). Educators may use, adapt, and/or share. Not for commercial use. To view a copy of the license, visit http://creativecommons.org/licenses/by-nc-sa/3.0/ Page 34 of 47
Additional Instructional Materials/Resources/Tools
• Annenberg Learner (http://www.learner.org/workshops/privuniv/pup02.html), Workshop Two: Private Universe Project in Science: Why are
some ideas so difficult? Photosynthesis is among the most widely taught of all concepts in biology. Why, then, do many people have difficulty grasping the central idea of photosynthesis-that most of the substance of plants comes from the air?
• MIT Blossoms (https://blossoms.mit.edu/videos/lessons/roots_shoots_and_wood), Lesson video: Roots, Shoots, and Wood, Taught by Kathleen
Vandiver
• AAAS Science Assessment (http://assessment.aaas.org/topics/ME#/) – Topic: Matter and Energy in Living Systems – Includes: Sub-Ideas, Assessment Items, and Misconceptions related to this topic.
• Concord Consortium UDL Beginning Plants Unit Teacher Guide: http://udl.concord.org/share/teacher-guides/TG_Plants-Beginning-2010-
final.pdf. (The Concord Consortium Teacher Guide is a slightly different unit than this unit but uses the same online components.)
This work is licensed by the MA Department of Elementary & Secondary Education under the Creative Commons Attribution-NonCommercial-ShareAlike 3.0 Unported License (CC BY-NC-SA 3.0). Educators may use, adapt, and/or share. Not for commercial use. To view a copy of the license, visit http://creativecommons.org/licenses/by-nc-sa/3.0/ Page 35 of 47
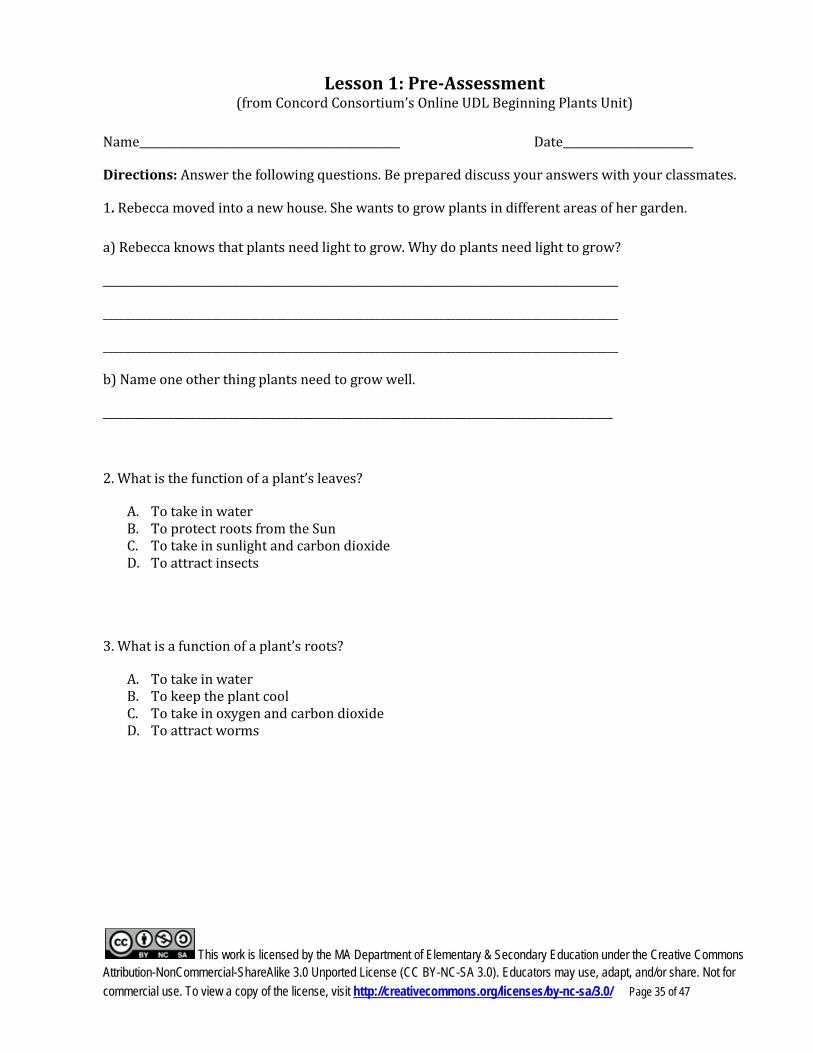
Lesson 1: Pre-Assessment (from Concord Consortium’s Online UDL Beginning Plants Unit)
Name________________________________________________ Date________________________
Directions: Answer the following questions. Be prepared discuss your answers with your classmates.
1. Rebecca moved into a new house. She wants to grow plants in different areas of her garden. a) Rebecca knows that plants need light to grow. Why do plants need light to grow?
_______________________________________________________________________________________________
_______________________________________________________________________________________________
_______________________________________________________________________________________________
b) Name one other thing plants need to grow well.
______________________________________________________________________________________________
2. What is the function of a plant’s leaves?
A. To take in water B. To protect roots from the Sun C. To take in sunlight and carbon dioxide D. To attract insects
3. What is a function of a plant’s roots?
A. To take in water B. To keep the plant cool C. To take in oxygen and carbon dioxide D. To attract worms

This work is licensed by the MA Department of Elementary & Secondary Education under the Creative Commons Attribution-NonCommercial-ShareAlike 3.0 Unported License (CC BY-NC-SA 3.0). Educators may use, adapt, and/or share. Not for commercial use. To view a copy of the license, visit http://creativecommons.org/licenses/by-nc-sa/3.0/ Page 36 of 47
4. A girl has an idea that green plants need sand in the soil for healthy growth. In order to test her idea she uses two pots of plants. She sets up one pot of plants as shown.
Which ONE of the following should she use for the second pot of plants?
5. Circle the letter for where each of the following processes takes place in a plant. (You may use the letters more than once.)
Water enters the plant. Sunlight energy enters the plant.
Nutrients enter the plant.
Water is transported from the roots to the leaves.
A A A A
B B B B
C C C C

This work is licensed by the MA Department of Elementary & Secondary Education under the Creative Commons Attribution-NonCommercial-ShareAlike 3.0 Unported License (CC BY-NC-SA 3.0). Educators may use, adapt, and/or share. Not for commercial use. To view a copy of the license, visit http://creativecommons.org/licenses/by-nc-sa/3.0/ Page 37 of 47
6. Here is a graph of the number of healthy leaves on a plant for ten days. A student watered the plant each day at first, but then stopped. The plant had lots of sunlight.
Answer the following questions about the graph.
a) What was the greatest number of healthy leaves?
A. 15 B. 20 C. 25 D. 30
b) On which day was the number of leaves unchanged?
A. Day 3 B. Day 6 C. Day 9

This work is licensed by the MA Department of Elementary & Secondary Education under the Creative Commons Attribution-NonCommercial-ShareAlike 3.0 Unported License (CC BY-NC-SA 3.0). Educators may use, adapt, and/or share. Not for commercial use. To view a copy of the license, visit http://creativecommons.org/licenses/by-nc-sa/3.0/ Page 38 of 47
Lesson 1: Plant Story Questions (from Concord Consortium’s Online UDL Beginning Plants Unit)
Name_________________________________________________________ Date________________________ Describe something you learned from this story about growing plants. ______________________________________________________________________________________________________________________________________________________________________________________________________________________________________________________________________________________________________________________________________________________________________________
Draw a picture of a plant from the story. Label the parts of the plant and describe their functions.

This work is licensed by the MA Department of Elementary & Secondary Education under the Creative Commons Attribution-NonCommercial-ShareAlike 3.0 Unported License (CC BY-NC-SA 3.0). Educators may use, adapt, and/or share. Not for commercial use. To view a copy of the license, visit http://creativecommons.org/licenses/by-nc-sa/3.0/ Page 39 of 47
Lesson 2: The Food-o-Meter: What do plants need to stay alive?
Name_______________________________________________________ Date_______________________ Directions: Respond to the following questions reflecting on your observations in the Food-O-Meter activity. Include evidence from your observations in your responses. 1. What happened to the plant when it was cloudy instead of sunny? 2. What happened to the plant when it did not rain? 3. What happened to the plant when there was less carbon dioxide in the air? 4. What do plants need to stay alive?
5. What does the plant produce when given enough water, sunlight, and carbon dioxide?

This work is licensed by the MA Department of Elementary & Secondary Education under the Creative Commons Attribution-NonCommercial-ShareAlike 3.0 Unported License (CC BY-NC-SA 3.0). Educators may use, adapt, and/or share. Not for commercial use. To view a copy of the license, visit http://creativecommons.org/licenses/by-nc-sa/3.0/ Page 40 of 47
Less
on 3
: Wat
er C
ycle
*Gra
phic
from
Del
awar
e Ba
sin
Com
mis
sion
ht
tp:/
/ww
w.s
tate
.nj.u
s/dr
bc/h
ydro
logi
cal/

This work is licensed by the MA Department of Elementary & Secondary Education under the Creative Commons Attribution-NonCommercial-ShareAlike 3.0 Unported License (CC BY-NC-SA 3.0). Educators may use, adapt, and/or share. Not for commercial use. To view a copy of the license, visit http://creativecommons.org/licenses/by-nc-sa/3.0/ Page 41 of 47
Lesson 4 Handout: Data Tables and Graphs (adapted from the Concord Consortium’s Online UDL Intermediate Plants Unit)
Name: ______________________________________________________ Date_______________________ Directions: For this lesson, you will study data for the growth of plants under different conditions of light and water. You will interpret data from a table and produce and interpret line plots. Read the information below and answer the questions that follow.
Natasha and Marc were having a discussion. They were convinced that plants -- sunflowers at least -- use sunlight and water to make food. But Marc still wondered what would happen to a plant if these things were taken away. "I think it will shrivel up and die right away," remarked Natasha, thinking about how she felt if she missed breakfast because she was late for school. "Well, I think the plant will just wait until the light and water come back again," argued Marc. "After all, when I go to sleep at night, I wake up hungry, but I'm not shriveled!" "Well, maybe, but it certainly won't grow if it doesn't have light and water," Natasha insisted.
Predict what will happen to a plant if water and light are missing for 3-5 days? ____________________________________________________________________________________ _______________________________________________________________________________________________________________________________________________________________________ Using your knowledge of photosynthesis, why do you think this? ____________________________________________________________________________________________________________________________________________________________________________________________________________________________________________________________ We will now look at data collected when ivy plants were growing in different conditions to see if your predictions are correct or if they need to be modified. Ivy Leaves and Vine

This work is licensed by the MA Department of Elementary & Secondary Education under the Creative Commons Attribution-NonCommercial-ShareAlike 3.0 Unported License (CC BY-NC-SA 3.0). Educators may use, adapt, and/or share. Not for commercial use. To view a copy of the license, visit http://creativecommons.org/licenses/by-nc-sa/3.0/ Page 42 of 47
How well do plants grow under different conditions? Four ivy plants were observed over 7 days under different conditions. The data for each plant is shown below.
Plant 1: lots of sunlight and only water added Day Length of Vine (cm) Total number of leaves
1 27.3 18 2 28.6 18 3 29.2 20 4 29.8 21 5 30.5 24 6 31.1 25 7 31.8 28
Plant 2: lots of sunlight and no water added Day Length of Vine (cm) Total number of leaves
1 29.0 20 2 30.2 22 3 31.8 23 4 32.3 23 5 33.6 20 6 33.2 19 7 32.7 17
Plant 3: no sunlight and only water added
Day Length of Vine (cm) Total number of leaves 1 31.0 18 2 31.5 18 3 31.8 18 4 31.3 18 5 31.0 18 6 31.0 18 7 30.5 18
Plant 4: no sunlight and no water added Day Length of Vine (cm) Total number of leaves
1 28.3 22 2 28.3 22 3 28.3 22 4 28.3 20 5 28.3 19 6 28.3 16 7 28.3 16

This work is licensed by the MA Department of Elementary & Secondary Education under the Creative Commons Attribution-NonCommercial-ShareAlike 3.0 Unported License (CC BY-NC-SA 3.0). Educators may use, adapt, and/or share. Not for commercial use. To view a copy of the license, visit http://creativecommons.org/licenses/by-nc-sa/3.0/ Page 43 of 47
Directions: Using the data tables, answer the following questions. For each plant, what is the change in the number of leaves from day 1 to day 7? Explain or show your reasoning for how you got your numbers. Change in Number of
Leaves Reasoning
Plant 1
Plant 2
Plant 3
Plant 4
For each plant, how much did the length of the vine change from day 1 to day 7? Explain or show your reasoning for how you got your numbers. Change in Length
of Vine Reasoning
Plant 1
Plant 2
Plant 3
Plant 4
Based on the first table, which plant had the most change in the number of leaves? Which plant had the least change? Based on the first table, which plant had the most change in the length of the vine? Which plant had the least change? You should discuss your answers with your classmates before moving to the next section.

This work is licensed by the MA Department of Elementary & Secondary Education under the Creative Commons Attribution-NonCommercial-ShareAlike 3.0 Unported License (CC BY-NC-SA 3.0). Educators may use, adapt, and/or share. Not for commercial use. To view a copy of the license, visit http://creativecommons.org/licenses/by-nc-sa/3.0/ Page 44 of 47
Graphing - We will now compare the four plants using graphs.
For each plant, plot the number of new leaves for each day on the graph below. Use different colored pencils to represent each plant. Connect the data points that were plotted by drawing a line for each plant. Use the same colored pencil that you used to make the data points. Be sure to label the color that corresponds (or goes with) each plant. Check with your teacher to make sure you are using the correct data to make the graph.
For each plant, graph the length of the vine for each day on the graph below. Use different colored pencils to represent each plant. Connect the data points that were plotted by drawing a line for each plant. Use the same colored pencil that you used to make the data points. Be sure to label the color that corresponds (or goes with) each plant. Check with your teacher to make sure you are using the correct data to make the graph.

This work is licensed by the MA Department of Elementary & Secondary Education under the Creative Commons Attribution-NonCommercial-ShareAlike 3.0 Unported License (CC BY-NC-SA 3.0). Educators may use, adapt, and/or share. Not for commercial use. To view a copy of the license, visit http://creativecommons.org/licenses/by-nc-sa/3.0/ Page 45 of 47
Using the graphs you produced, answer the following questions. Which condition was the best for plant growth? Explain your reasoning using data from both graphs. ________________________________________________________________________________________________________________________________________________________________________ Which had a larger effect on the plants, having no sun or having no water added? Explain your reasoning using data from both graphs. ________________________________________________________________________________________________________________________________________________________________________ Summary Questions Do the results from the investigation support the prediction you made on page 1? Why or why not? Be sure to use both evidence from the investigation and your knowledge of photosynthesis to support your answer. ________________________________________________________________________________________________________________________________________________________________________________________________________________________________________________________________________________________________________________________________________________ What is one benefit of using a data table instead of a graph? ____________________________________________________________________________________________________________________________________________________________________________________________________________________________________________________________ What is one benefit of using a graph instead of a data table? ____________________________________________________________________________________________________________________________________________________________________________________________________________________________________________________________
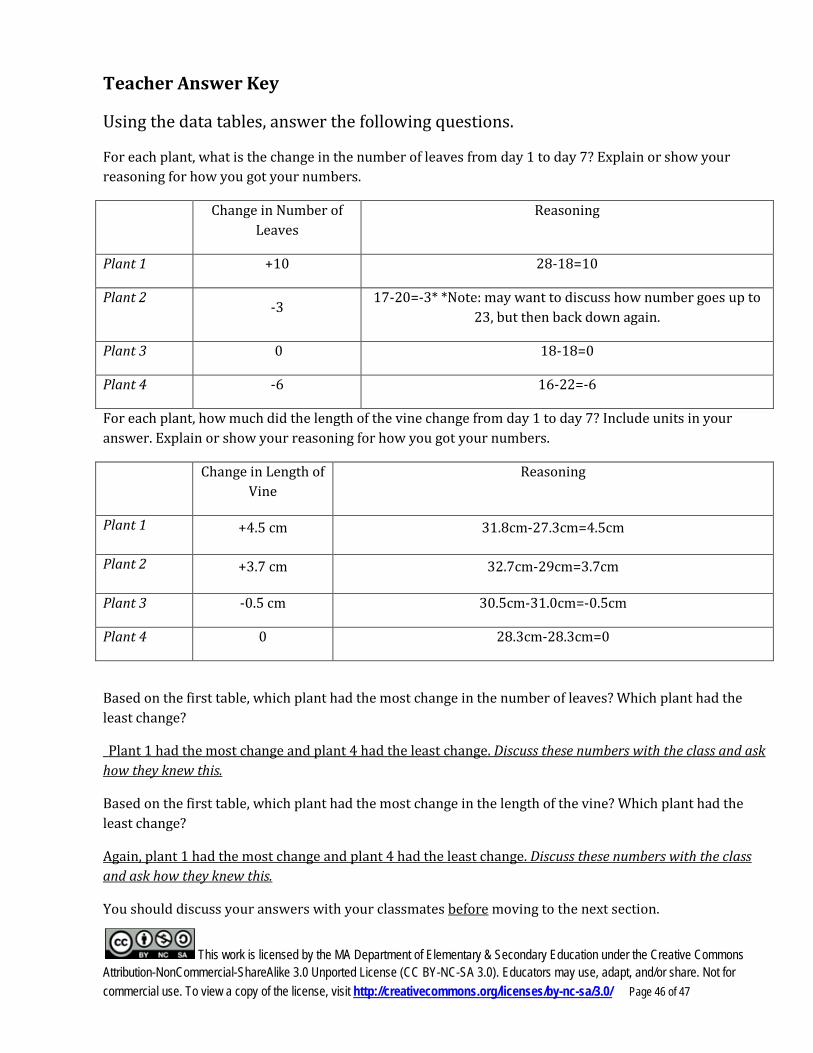
This work is licensed by the MA Department of Elementary & Secondary Education under the Creative Commons Attribution-NonCommercial-ShareAlike 3.0 Unported License (CC BY-NC-SA 3.0). Educators may use, adapt, and/or share. Not for commercial use. To view a copy of the license, visit http://creativecommons.org/licenses/by-nc-sa/3.0/ Page 46 of 47
Teacher Answer Key
Using the data tables, answer the following questions.
For each plant, what is the change in the number of leaves from day 1 to day 7? Explain or show your reasoning for how you got your numbers.
Change in Number of Leaves
Reasoning
Plant 1 +10 28-18=10
Plant 2 -3
17-20=-3* *Note: may want to discuss how number goes up to 23, but then back down again.
Plant 3 0 18-18=0
Plant 4 -6 16-22=-6
For each plant, how much did the length of the vine change from day 1 to day 7? Include units in your answer. Explain or show your reasoning for how you got your numbers.
Change in Length of Vine
Reasoning
Plant 1 +4.5 cm 31.8cm-27.3cm=4.5cm
Plant 2 +3.7 cm 32.7cm-29cm=3.7cm
Plant 3 -0.5 cm 30.5cm-31.0cm=-0.5cm
Plant 4 0 28.3cm-28.3cm=0
Based on the first table, which plant had the most change in the number of leaves? Which plant had the least change?
_Plant 1 had the most change and plant 4 had the least change. Discuss these numbers with the class and ask how they knew this.
Based on the first table, which plant had the most change in the length of the vine? Which plant had the least change?
Again, plant 1 had the most change and plant 4 had the least change. Discuss these numbers with the class and ask how they knew this.
You should discuss your answers with your classmates before moving to the next section.

This work is licensed by the MA Department of Elementary & Secondary Education under the Creative Commons Attribution-NonCommercial-ShareAlike 3.0 Unported License (CC BY-NC-SA 3.0). Educators may use, adapt, and/or share. Not for commercial use. To view a copy of the license, visit http://creativecommons.org/licenses/by-nc-sa/3.0/ Page 47 of 47
Graphing Answers
For each plant, plot the number of new leaves for each day on the graph below. Use different colored pencils to represent each plant. Connect the data points that were plotted by drawing a line for each plant. Use the same colored pencil that you used to make the data points. Be sure to label the color that corresponds (or goes with) each plant. Check with your teacher to make sure you are using the correct data to make the graph.
For each plant, graph the length of the vine for each day on the graph below. Use different colored pencils to represent each plant. Connect the data points that were plotted by drawing a line for each plant. Use the same colored pencil that you used to make the data points. Be sure to label the color that corresponds (or goes with) each plant. Check with your teacher to make sure you are using the correct data to make the graph.