plasma and corona discharge pretreatment of ... · plasma and corona discharge pretreatment of...
TRANSCRIPT

Loughborough UniversityInstitutional Repository
Plasma and coronadischarge pretreatment ofpolyetheretherketone for
adhesive bonding
This item was submitted to Loughborough University's Institutional Repositoryby the/an author.
Additional Information:
• A Doctoral Thesis. Submitted in partial fulfilment of the requirementsfor the award of Doctor of Philosophy of Loughborough University.
Metadata Record: https://dspace.lboro.ac.uk/2134/13690
Publisher: c© Gaozhi Xiao
Please cite the published version.

This item was submitted to Loughborough University as a PhD thesis by the author and is made available in the Institutional Repository
(https://dspace.lboro.ac.uk/) under the following Creative Commons Licence conditions.
For the full text of this licence, please go to: http://creativecommons.org/licenses/by-nc-nd/2.5/

LOUGHBOROUGH UNIVERSITY OF TECHNOLOGY
LIBRARY .. ---------=~---.,;..--....:..-.------! : AUTHOR/FILING TITLE . i. ____ ~ _____ _____ XLfy5~ . ..,l._s;: __________ _________ _ I [ ----- - ---- ------------------ ---- --- ---- - - - -_._-- ---! ACCESSION/COPY NO. f ; --VO'~No;e;v~~~; __ m:~~-
,....-. l' - -~ ~,'" .'.... .

1
1
1
1
1
1
1
1
1
1
1
1
1
1
1
1
1
1
1 , 1
1
1
1
1
1
1
1

PLASMA AND CORONA DISCHARGE PRETREATMENT OF
POL YETHERETHERKETONE FOR ADHESIVE BONDING
Supervisors:
by
Gaozhi Xiao, M Eng
A doctoral thesis submitted in partial fulfilment
of the requirements for the award of the degree of
Doctor of Philosophy
of Loughborough University of Technology
DrL. Mascia
Or I. Comyn
March 1995
Institute of Polymer Technology and Materials Engineering
©Gaozhi Xiao, 1995


PLASMA AND CORONA DISCHARGE PRETREATMENT OF
POL YETHERETHERKETONE FOR ADHESIVE BONDING
SYNOPSIS
To enhance the bondability of polyetheretherketone (PEEK), surface treatment
techniques of plasma and corona discharge have been evaluated. The results have
shown that these two methods are effective and practical. The treated materials not
only reach their highest possible joint strength, but also show very promising joint
durability. In addition, the various environments, e. g. atmosphere, heat, water, and
solvent, have little effects on the enhanced bondability of the treated materials.
By using Contact Angle Measurement, Scanning Electron Microscopy (SEM), X-ray
Photoelectron Spectroscopy (XPS) and Time of Flight Secondaty Ion Mass
Spectrometry (TOF-SIMS) to characterise the PEEK surfaces before and after
treatment, it was established that the lack of active chemical groups, which if present
can form strong interatomic and intermolecular forces across the adhesive/PEEK
interface, is the main cause for the poor bondability of the untreated PEEK. Both
plasma and corona discharge treatment introduce such active functional groups, for
instance, hydroxyl, carboxylic acid, amine and etc., onto the surface of PEEK film and
so greatly enhance the intrinsic adhesion at the interface between treated PEEK
surfaces and epoxy adhesive, as confirmed by the TOF-SIMS interfacial analysis.
It is deduced that low molecular weight molecules (LMWM) are formed on treated
surfaces, which contain high concentration of oxygen and/or nitrogen, and can be
removed by solvent washing. The removal of LMWM will drastically reduce the
wettability of the treated surfaces, but does not impair the enhanced bondability.
It has been found that both plasma and corona discharge treated surfaces are in a
thermodynamically unstable state. When exposed to the atmosphere, the treated
surfaces tend to lose their improved wettability and decrease their surface polarity.
Increasing temperature can not only accelerate these processes but also change the
surface chemical structures of the treated materials back to that of the untreated films
to some extent, as revealed by the TOF-SIMS analysis. Water immersion, on the
contrary, tend to reverse the above processes.
i
ACKNOWLEOOEMENTS
I would like to thank my supervisors, Dr. L. Mascia and Dr. J. Comyn, for their
guidance, support and encouragement during this project.
My thanks also go to Dr. B. M Parker of DRA Farnborough for many helpful
discussions. Grateful acknowledgement is made to the Ministry of Defence for
financial assistance which enabled this work to be undertaken.
A special thanks to my family who encouraged me to continue my studies, especially
my wife fmmei and baby daughter Helen for being patient and quiet (respectively!)
whilst I put the manuscript together.
My thanks are extended to Dr. E. Sheng for his help on the XPS derivatisation
experiment Without his help this part of work could not be undertaken.
Fmally, I wish to express my gratitude to the staff and technicians in lPTME who
helped me at various times.
ill

Dedicated to
my wife Jinmei
and my daughter Helen
iv
CONTENTS
SYNOPSIS
ACKNOWLEOOEMENT
ABBREVIATIONS
CHAPTER 1 INTRODUCTION
CHAPTER 2 SURFACE PROPERTIES AND ADHESION
2.1 Wettability and Adhesion
2.2 Chemical Composition and Adhesion
2.3 Surface Topography and Adhesion
2.4 Weak Boundary Layer and Adhesion
2.5 Other Surface Properties and Adhesion
2.6 Summary
CHAPTER 3 SURFACE CHARACTERISATION
3.1 Contact Angle Measurement
3.1.1 Young's contact angle
3.1.2 Measurement techniques
3.1.3 Contact angle hysteresis
3.1.4 Estimation of surface free energy
3.1.4.1 Geometric-mean method
3.1.4.2 Harmonic-mean method
3.2 Microscopic Techniques
v
1
4
4
5
5
6
7
7
8
8
8
9
10
10
1.1
12
13

3.3 Spectroscopic Techniques 13
3.3.1 Surface Reflectance Infrared Spectroscopy (SRIRS) 14
3.3.2 X-Ray Photoelectron Spectroscopy (XPS) 16
3.3.3 Static Secondary Ion Mass Spectrometry (SSIMS) 18
3.4 Summary 19
CHAPTER 4 EV ALUA TION OF BONDABILITY 21
4.1 Before Bonding Assessment 21
4.1.1 Physical-chemical analysis 21
4.1.2 Water break test 21
4.1.3 Contact angle test 21
4.2 Mechanical Tests 22
4.2.1 Test methods 22
4.2.1.1 Tensile tests 22
4.2.1.2 Shear tests 24
4.2.1.3 Peel tests 27
4.2.2 Failure analysis 29
CHAPTER 5 SURFACE PRETREATMENT FOR ADHESIVE 32
BONDING OF PEEK AND ITS COMPOSITES
5.1 Solvent Cleansing 32
5.2 Mechanical Abrasion and Blasting 32
5.2.1 Introduction 32
5.2.2 Abrasion 33
5.2.3 Blasting 34
VI

5.3 Chemical Treatment
5.3.1 Introduction
5.3.2 Adhesion studies
5.4 Plasma Treatment
5.4.1 Introduction
5.4.2 Adhesion studies and surface characterisation
5.4.3 Effects of ageing
5.4.4 Effects of solvents
5.5 Corona Discharge Treatment
5.5.1 Introduction
5.5.2 Adhesion studies
CHAPTER 6 AIMS OF THE PROJECf
CHAPTER 7 EXPERIMENTAL
7.1 Materials
7.1.1 PEEK and adhesive
7.1.2 Solvents and gases
7.2 Surface Treatment
7.2.1 Plasma treatment
7.2.2 Corona discharge treatment
7.2.3 Solvent washing of the treated surfaces
7.3 Joint Preparation and Testing
7.3.1 T -peel joints
7.3.2 Lap shear joints
7.3.3 Failure analysis
vii
35
35
35
37
37
38
41
43
44
44
44
46
48
48
48 48
48
48
50
51
51
51.
51
53

7.4 Surface Characterisation
7.4.1 Scanning electron microscope analysis
7.4.2 Contact angle measurement
7.4.3 Estimation of surface free energy and surface polarity
7.4.4 X-ray photoelectron spectroscopy analysis
7.4.4.1 XPS analysis
7.4.4.2 Vapour-phase derivatisation
7.4.5 Time of flight secondary ion mass spectrometry
7.5 Other Analysis Techniques
7.5.1 Fourier transfonn infrared analysis
7.5.2 Differential scanning calorimetry analysis
CHAPTER 8 ADHESION STUDIES
8.1 Effects of Processing Parameters
8.1.1 Plasma treatment
8.1.1.1 T-peel tests
8.1.1.2 Lap shear tests
8.1.2 Corona discharge treatment
8.2 Crystallinity and Treatment Effects
8.3 Hot/wet Perfonnance of Plasma and Corona Discharge Treated
PEEK/adhesive Joints
CHAPTER 9 WETTABILITY STUDIES
9.1 Contact Angle Analysis
viii
53
53 53 55
57
57
57
59
60
60
60
61
61
61
61
66
68
70
72
75
75

9.2 Surface Free Energy and Polarity
9.3 Contact Angle Hysteresis
CHAPTER 10 SURFACE CHARACfERISATION
10.1 SEM Analysis
10.2 XPS Studies
10.2.1 Effect of plasma treatment
10.2.1.1 Elemental composition analysis
10.2.1.2 Cls and 01s spectra studies
10.2.1.3 Chemical derivatisation
10.2.2 Effect of corona discharge treatment
10.2.2.1 Elemental composition analysis
10.2.2.2 Cls and 01s spectra studies
10.2.3 Effects of solvents on the treated surfaces
10.3 TOF-SIMS Analysis
10.3.1 Untreated material
10.3.2 Effect of plasma treatment
10.3.2.1 Oxygen plasma
10.3.2.2 Ammonia plasma
10.3.3 Effect of acetone washing on the plasma treatment effects
10.3.3.1 Oxygen plasma treated sample
10.3.3.2 Ammonia plasma treated sample
ix
76
78
78
80
82
82
82 82 87
89
89 89
92
95
95
99
99
101
102
102
103

CHAPTER 11 MODELLING OF THE PLASMA AND CORONA 104 DISCHARGE TREATED SURFACES
11.1 Modelling of The Treated Surfaces 104
11.2 FI1R Studies on The Low Molecular Weight Molecules (LMWM) Produced 105
by The Treatment
CHAPTER 12 STUDIES ON THE MECHANISMS OF 109
BONDABILITY ENHANCEMENT
12.1 Adhesion Theories 109
12.1.1 Weak boundary layer 109
12.1.2 Mechanical interlocking 110 12.1.3 Diffusion theory 110 12.1.4 Electronic theory III 12.1.5 Adsorption theory 111
12.2 Interfacial Contact 112
12.3 Interfacial Interactions 113
12.3.1 Thermodynamic work of adhesion 114
12.3.2 TOF-SIMS analysis 115
12.3.2.1 Sample preparation 115
12.3.2.2 Characteristic signals of epoxide resin 115
12.3.2.3 EUPK 118
12.3.2.4 EOPK 121
12.3.2.5 ENHPK 121
12.4 Role of Low Molecular Weight Molecules 126
12.4.1 Mass uptake on plasma and corona discharge treated PEEK surfaces 127 12.4.2 Effects of solvent washing on the wettability of treated materials 128
12.4.3 Effects of solvent washing on the bondability of treated materials 131
x

CHAPTER 13 SURFACE DYNAMICS AND ADHESION
13.1 Theoretic Analysis
13.2 Atmospheric Exposure
13.2.1 Surface free energy
13.2.2 Surface polarity
13.2.3 Contact angle hysteresis
13.2.4 Adhesion studies
13.3 Temperature Effect
13.3.1 Wettability studies
13.3.2 TOF-SIMS analysis
13.3.3.1 Positive ion spectra
13.3.3.2 Negative ion spectra
13.3.3 Adhesion studies
13.4 Effect of Water
133
133
134
134
138
138
144
150
151
158
158
161
164
167
CHAPTER 14 CONCLUSIONS AND RECOMMENDATIONS FOR 171
FUTURE WORK
14.1 Conclusions 171
14.2 Recommendations for Future Work 173
REFERENCES 174
Appendix 1 Calculation of Crystallinity From DSC Results
Appendix 2 TOF-SIMS Spectra of Some Plasma Treated PEEK Films
Xl

ABBREVIATIONS
DMSO Dimethylsulfoxide
DSC Differential scanning calorimetry
EO Ethanediol
ENHPK Epoxy resin coated ammonia plasma treated PEEK after 24 hours acetone .
immersion
EOPK Epoxy resin coated oxygen plasma treated PEEK after 24 hours acetone
immersion
EUPK Epoxy resin coated untreated PEEK after 24 hours acetone immersion
FTIR Fourier transform infrared spectroscopy
HMWM High molecular weight molecules
IPA 2-propanol
LMWM Low molecular weight molecules
MDI Methylene diiodide
MlR Multiple internal reflectance
OM Optical microscopy
PEEK Polyetheretherketone
SEM Scanning electron microscopy
SIMS Secondary ion mass spectrometry
SRIRS Surface reflectance infrared spectroscopy
SSIMS Static secondary ion mass spectrometry
SlEM Scanning transmission electron microscopy
TOF-SIMS Time of flight secondary Ion Mass Spectrometry
WBL Weak boundary layer
XPS X-ray photoelectron spectroscopy
xii

CHAPTER 1 INTRODUCfrON
Poly(ether ether ketone), PEEK, is a linear aromatic polymer with a repeat unit of
three benzene rings separated by two ether bonds and one carbonyl bond (as shown in
Fig. 1.1).
+-O-o-O-o-OJ~n Fig. 1.1 Chemical structure of PEEK
It is a semi-crystallisable polymer with glass transition temperature (T g) of 143°C and
melting point (T m) of 334°C, hence according to the thermal history it can be
amorphous or semi-crystalline. Due to its exceptionally high perfonnances (see Table
1.1), particularly with respect to thermal oxidative stability, chemical resistance,
mechanical and electrical properties[2,3], l'EEK and its composites are being widely
exploited in many fields[3-5], especially in the aerospace industry as structural
materials.
Table 1.1 Key properties of PEEK[I]
Mechanical Tough; . ductile; abrasion resistant; excellent fatigue
characteristics; load-bearing at high temperature
Thennal High melting ooint; high continuous service temperature
Ranunability Low flammability; good fire and smoke resistant properties
Chemical Essentially inert to organics; high degree of acid and alkali
resistance
Hard radiation No significant degradation below lIDO Mrad
Processing Easily processed on conventional equipment
The majority of structural applications, however, require joints to be made for the
assembling of various structure members. Generally speaking, joining of plastics and
composites can be broadly divided into mechanical fastening, adhesive bonding and
welding. Among these joining methods, adhesive bonding has many advantages (as
shown in Table 1.2) and is, therefore, widely used, particularly in the aerospace
industry, where sometimes other joint methods cannot be used. Perhaps the best
example, of particular importance in the aircraft industry, is the bonding of thin
composite or metal skins to honeycomb cores, to provide lightweight, rigid structures
and suitable aerodynamic surface.
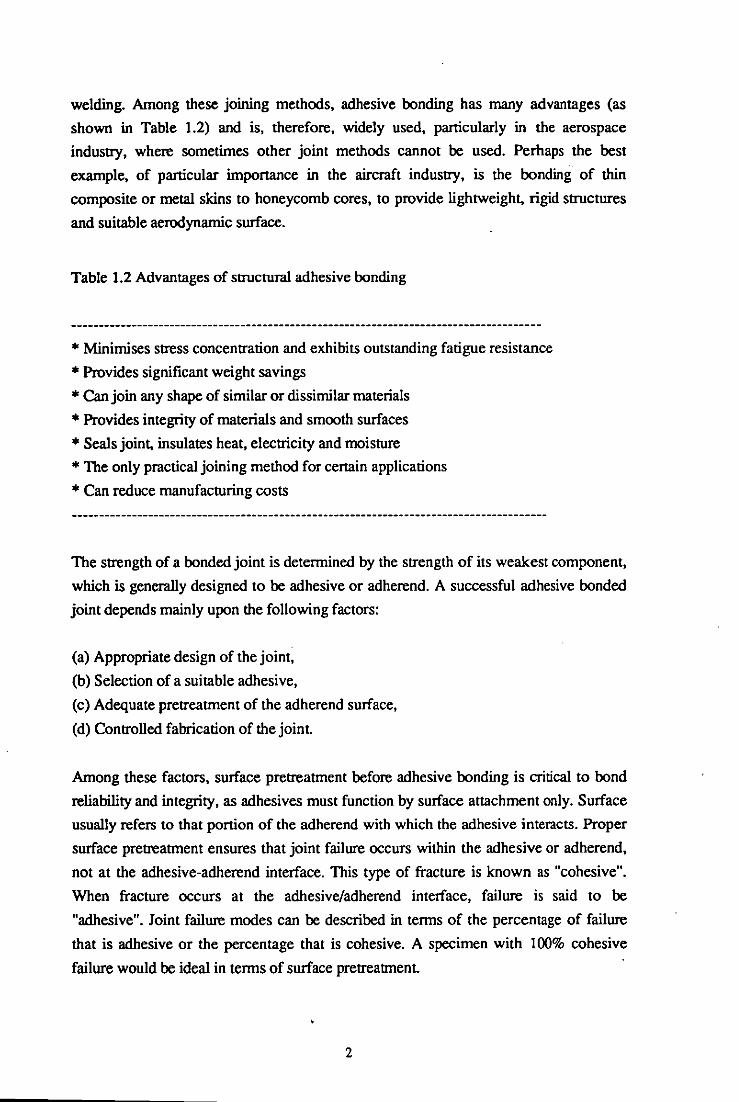
Table 1.2 Advantages of structural adhesive bonding
* Minimises stress concentration and exhibits outstanding fatigue resistance
* Provides significant weight savings
* Can join any shape of similar or dissimilar materials
* Provides integrity of materials and smooth surfaces
* Seals joint, insulates heat, electricity and moisture
* The only practical joining method for certain applications
* Can reduce manufacturing costs
The strength of a bonded joint is determined by the strength of its weakest component,
which is generally designed to be adhesive or adherend. A successful adhesive bonded
joint depends mainly upon the following factors:
(a) Appropriate design of the joint,
(b) Selection of a suitable adhesive,
(c) Adequate pretreatment of the adherend surface,
(d) Controlled fabrication of the joint
Among these factors, surface pretreatment before adhesive bonding is critical to bond
reliability and integrity, as adhesives must function by surface attachment only. Surface
usuaJIy refers to that portion of the adherend with which the adhesive interacts. Proper
surface pretreatment ensures that joint failure occurs within the adhesive or adherend,
not at the adhesive-adherend interface. This type of fracture is known as "cohesive".
When fracture occurs at the adhesive/adherend interface, failure is said to be
"adhesive". Joint failure modes can be described in terms of the percentage of failure
that is adhesive or the percentage that is cohesive. A specimen with 1 00% cohesive
failure would be ideal in terms of surface pretreatment
2

There are many surface pretreatment methods that have been developed, These
methods can be divided into four categories:
(a) Surface cleansing;
(b) Mechanical treatment;
(c) Chemical Treatment;
(d) Physical Treatment
Among them, surface cleansing is the simplest method, but for some polymers, this is
not adequate. Mechanical treatment use sand or other particles to abrade or blast the
adherend surface. This method is often used to treat metals or composites, but is not
effective for most polymers. Chemical treatments are very effective for both metals and
polymers, but these methods are toxic and pollute environment Physical treatment
methods, especially plasma treatment and corona discharge treatment, are usually very
effective to polymers and do not cause pollution or discharge health hazards.
Kin10ch and Taig[6] studied the bondability of PEEK composites(APC-2), and found
that the intrinsic bond strength of untreated APC-2 is very low. These authors also
found that the conventional surface pretreatment methods used for thermosetting
composites, such as mechanical abrasion, solvent cleaning etc. are not adequate for
PEEK composites[6,7]. Thus, in order to improve the bondability of PEEK and its
composites, special surface pretreatments need to be employed.
This study focuses on the surface pretreatment of PEEK by means of plasma and
corona discharge to improve its adhesive joint strength. A literature survey was carried
out on the following aspects:
(a) the relations between surface properties and adhesion;
(b) surface characterisation methods and their applications in adhesion studies;
(c) evaluation of bondability; and
(d) recent developments for surface treatments of PEEK and its composites.
3

CHAPTER 2 SURFACE PROPERTIES AND ADHESION
Adhesive bonding is a surface phenomenon and, therefore, the bond strength is
governed by surface properties. Both the initial bond strength and bond durability are
critically dependent on the interactions between the adhesive «andlor) primer) and the
adherend surface. Thus, it is necessary to know the relations between surface
properties and bondability.
2.1 Wettability and Adhesion
Wettability of an adherend is the ability of the adherend to be wetted by liquids. When
an adherend is easily wetted by a liquid, it is said that the adherend has a good
wettability and vice versa Wettability is evaluated by liquid contact angles.
The adsorption theory of adhesion is the most widely applicable theory and proposes
that, provided sufficiently intimate molecular contact is achieved at the interface, the
materials will adhere because of the interatomic and intermolecular forces which are
established between the atoms and molecules in the surfaces of the adhesive and
substrate. The most common forces at interfaces are van der Waals forces. However,
van der Waals forces diminish rapidly with distance, varying with the inverse of the
sixth power of the distance between two neighbouring molecules and with the inverse
cube of distance between two flat plate surfaces[8J. Appreciable attractions are
obtained only when the distance of separation is at or near an equilibrium
intermolecular distance of the order of 0.5 nm[9J. Besides van der Waals forces,
chemical bond such as covalent bond can also only be formed when the intennolecular
or interatomic distance is within 0.1-0.2 nm[10J. Thus, close proximity of molecules
from the two surfaces is a fundamental requirement for fonning a strong adhesive joint
Moreover, the wettability of the adherend not only detennines the extent of interfacial
molecular contact, but also affects joint strength in two ways[llJ. First, incomplete
wetting will produce interfacial defects, thereby lowering the adhesive bond strength.
Second, better wetting can increase the adhesive bond strength by increasing the work
of adhesion, which is directly proportional to the fracture energy.
4

2.2 Chemical Composition and Adhesion
Interfaces can be classified into two types[12]: (a) shaIp interfaces and (b) diffuse
interfaces. A sharp interface is obtained when little or no interfacial diffusion occurs; a
Table 2.1 Bond types and typical bond energies[13-15]
Type Bond Energy(KJ mol-I)
Primary Bonds
Ionic 600-1100
Covalent 60-700
Metallic 110-350
Donor-acceptor Bonds
Bronsted acid-base interactions Up to 40
Lewis acid-base interactions Up to 80
Secondary Bonds
Hydrogen bonds involving fluorine Up to 40
Hydrogen bonds excluding fluorine 10-25
Van der Waals bonds
Permanent dipole-dipole interactions 4-20
Dipole-induced dipole interactions Less than 2
Dispersion (London) forces 0.08-40
diffuse interface is obtained, on the other hand, when sufficient diffusion across the
interface takes place. If interfacial attractions are very low, as in the case of dispersion
forces (as shown in Table 2.1), interfacial molecular slippage can occur at a shaIp
interface during fracture, resulting in low energy absorption and low mechanical
strength. B ut if interfacial attractions are very strong, as for example, with primary
bonds (as shown in Table 2.1), molecular slippage at a shaIp interface may be
prevented and a high joint strength will result
Thus, in order to form a strong adhesive joint, the adherend surface should provide
some chemical groups which can form strong interfacial attraction with the adhesives.
2.3 Surface Topography and Adhesion
Roughening the surface of adherend may increase the adhesive joint strength by several
ways:
5

(a) Providing mechanical anchoring sites.
The mechanical anchoring sites will provide obstacles to failure through interface
slippage, and hence improve the bondability of the adherends.
(b) Promoting wetting
. Roughness tends to lower the contact angle when the intrinsic angle is less than 90°, or
increase it when the intrinsic angle is larger than 90°[16]. As the contact angles of
adhesives on adherends are usually less than 90°, roughness will improve the
wettability of the adherends.
(c) Increasing the surface area
Compared with a smooth surface, a rough surface has a larger contact area, which will
result in a larger joint area, thereby increasing the adhesive joint strength.
(d) Increasing fracture energy dissipation
The measured adhesive joint strength basically includes two components: the intrinsic
adhesion and the energy dissipated, normally plastically at the tip of the propagating
crack and plastically or viscoelastically in the body of the joint. The energy dissipation
component usually predominates in measurements of joint strengths. Several research
workers[17-22] have suggested that an increase in roughness may even increase the
energy dissipated viscoelastically and plastically during joint failure.
(e) Randomising the directions of the interfacial weakness
If the macroscopic surface roughness is random, it can be effective in preventing any
small cracks, flaws, voids or other points of stress concentration from aligning and
rapidly propagating along any line of interfacial weakness in the joint, as might be
envisaged in the case of a smooth planar interface.
However, exaggerated roughness may damage the surface since deep cracks lead to
the trapping of air, vapours, water and other contamination, and also provide stress
concentrations for the substrate, thus decreasing joint strength.
2.4 Weak boundary layer and adhesion
If any weak layer exists on the adherend surface, obviously, the locus of joint failure is
likely to be through this region and a relatively low joint strength will be observed.
Weak boundary layers are usually formed by low molecular weight species on the
6

surface, e.g. plasticizers which have migrated to the surfaces of polymers;
contamination; layers of protective oils or greases and so on.
2.5 Other surface properties and adhesion
Other properties of material surface such as surface crysta1linity, crosslinking, mobility
of surface chain segments, glass transition temperature and solubility parameters also
have an effect on the bondability of the adherends, according to the diffusion theory
proposed by Voyutskii[23]. This theory states that the intrinsic adhesion of polymers
to themselves (autohesion), and to each other, is due to mutual diffusion of polymer
molecules across the interface. The theory requires that the macromolecules, or chain
segments of the polymers (adhesive and substrate) possess sufficient mobility and are
mutually soluble. This latter requirement may be restated by the condition that they
possess similar value of solubility pararneter[24]. The solubility parameter, Os may be
defined by:
(2.1)
Where M1v is the molar heat of vaporisation, R is the gas constant, T is the absolute
temperature (K) and V is the molar volume. Hence, the solubility parameter is an index
of the miscibility of two components, e.g. if an amorphous polymer and a solvent have
similar values then they will form a sol ution.
2.6 Summary
Only when the adherend possess the first, second and some of the other surface
properties listed below, does it have a good bondability.
(a) No weak boundary layers on the surface;
(b) Good wettability;
(c) Some chemical groups on the surface which can form strong interfacial attraction
with adhesives;
(d) A specific surface topography which can form mechanical interlocking with
adhesives;
(e) Miscibility with adhesives.
7

CHAPTER 3 SURFACE CHARACTERISATION
The selection of surface treatment methods requires careful evaluation. The most
important factor is the effectiveness of the method. As discussed in the above chapter,
the bondabiJity of an adherend mainly depends on its surface properties. Thus, in order
to evaluate the effectiveness of surface treatments and to understand the mechanism of
bondability improvement, it is necessary to characterise the adherend surfaces before
and after the surface treatment.
A variety of surface analysis techniques have been developed for the last twenty years,
but not all of them are suitable for polymer surface analysis. Here are discussed only
the methods which are effective to analyse polymer surfaces. Surface characterisation
methods can be generally divided into three categories: contact angle measurement,
microscopy techniques, and spectroscopy techniques.
3.1 Contact Angle Measurement
Contact angle measurement is mainly employed to evaluate the wettability of
adherends. The surface energy of a polymer can be estimated by contact angle
measurement using interfacial tension theory. The main advantages of this technique
lie on two aspects: (a) it is highly surface sensitive as it depends on forces which are
effective only over a few atomic diameters (accounts for a layer less than I nm)[25];
(b) it is simple and inexpensive.
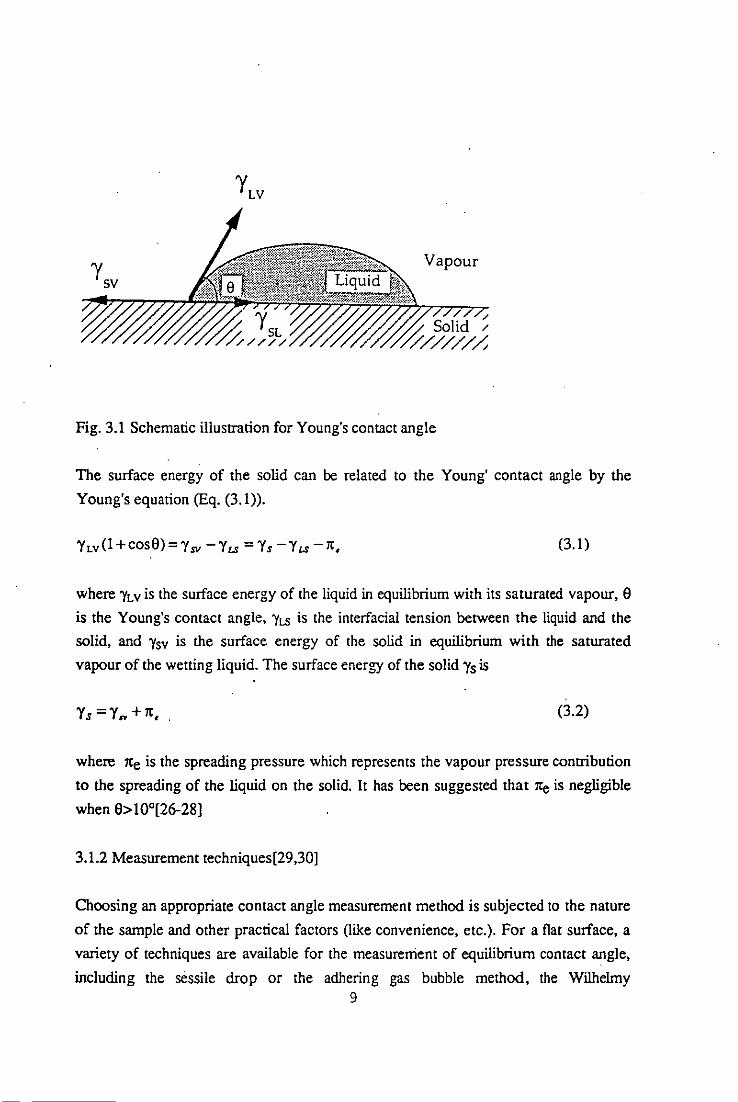
3.1.1 Young's contact angle
Consider a drop of pure liquid with surface energy 'YLV resting on a smooth,
homogeneous, rigid, isotropic solid surface with surface energy 'Ys. When the system
reaches equilibrium, the angle e in Fig. 3.1 is called Young's contact angle (also called
equilibrium contact angle).
8
Vapour
Fig. 3.1 Schematic illustration for Young's contact angle
The surface energy of the solid can be related to the Young' contact angle by the
Young's equation (Eq. (3.1».
(3.1)
where 'YLV is the surface energy of the liquid in equilibrium with its saturated vapour, 9
is the Young's contact angle, 'YLS is the interfacial tension between the liquid and the
solid, and 'Ysv is the surface energy of the solid in equilibrium with the saturated
vapour of the wetting liquid. The surface energy of the solid "Is is
Ys =Y ... + It, (3.2)
where lte is the spreading pressure which represents the vapour pressure contribution
to the spreading of the liquid on the solid. It has been suggested that lte is negligible
when 9> 10°[26-28]
3.1.2 Measurement techniques[29,30]
Choosing an appropriate contact angle measurement method is subjected to the nature
of the sample and other practical factors (like convenience, etc.). For a flat surface, a
variety of techniques are available for the measurement of equilibrium contact angle,
including the sessile drop or the adhering gas bubble method, the Wilhelmy 9

gravitational method, the tilting plate method, and the reflection method. Among
these, the sessile drop method is most widely used as it only requires a small amount
of liquid and a small size of sample. Measurements can be carried out by directly
observing the angle from the dJ:op profIle or drop dimensions, or by interference
microscopy. By drawing a tangent to the profIle at the point of three-phase contact
after the drop profIle has been enlarged either by image projection or photography, or
by using a telescope fitted with a goniometer eyepiece. The accuracy of sessile drop
method is commonly claimed to be about 2 degrees.
3.1.3 Contact angle hysteresis[31]
Many real surfaces are rough or heterogeneous. A liquid drop resting on such a
surface may reside in a stable equilibrium (lowest energy), or in a metastable
equilibrium (energy trough separated from neighbouring states by energy barriers).
The equilibrium contact angle ae corresponds to the lowest energy state for the
system On an ideally smooth and compositionally homogeneous surface, the
equilibrium contact angle is the Young's angle ay, which is also the microscopic local
contact angle on any rough or heterogeneous surface, hence it is also known as the
'intrinsic contact angle'.
Consider a liquid drop having a steady contact angle on a horizontal planar surface. If
the surface is ideally smooth and homogeneous, the addition of a small volume of
liquid from the drop will cause the drop front to advance, and the same contact angle
will be obtained. Subtraction of a small volume of the liquid from the drop will cause
the front to recede, and the same contact angle will again be formed. On the other
hand, if the surface is rough or heterogeneous, addition of the liquid will make the
drop grow taller without moving its periphery, and the contact angle will become
larger. When enough liquid is added, the drop will suddenly advance in a jerk. The
angle at the onset of this sudden advance is the maximum advancing contact angle aa.
Removal of the liquid will make the drop become flatter without moving its periphery,
and the contact angle will suddenly retract. The angle at the onset of this sudden
retraction is the minimum receding contact angle ar. The phenomenon related to
advancing and receding angles is known as hysteresis, and the difference (aa-ar) is
called the extent of hysteresis.
3.1.4 Estimation of surface free energy
Surface free energy has the same value with surface tension, but with different unit. 10 -
\

These two tenns are frequently used interchangably in the literature. In this study, only
the tenn of surface free energy was used.
A variety of methods[32-49) have been developed for the estimation of surface free
energy using equilibrium contact angle results, e.g. Zisman and co-workers'
approach[32-36), Good and Girifalco's approach[37,38), Fowkes' approach[26,39,4O),
Owens and Wendt's approach[41 ,42), Wu's approach[43-45), and other
methods[46,47).
Here, we only discussed the geometric-mean method which is based on the Fowkes',
the Owens and Wendt's and other researchers' methods and the harmonic-mean
method which has been proposed by Wu.
3.1.4.1. Geometric-mean method
Fowkes[ 40) first proposed that the surface free energy of a pure phase, 'f .. could be
represented by the sum of the contribution arising from different types of force
components. He[50) identified at least seven components but Schultz et al.[51) have
suggested that the surface free energy may be generally expressed by two terms,
namely, a dispersion and a polar component, as shown in Eq. (3.3).
_ d p Y. -Y. +Y. (3.3)
where y~ is the dispersion force component and y~ is the polar force component. This
latter term incorporates all the non-<iispersion force components. Fowkes[26.52) also
proposed that the geometric mean of the dispersion force component is a reliable
predication of the interaction energies at the interface caused by dispersion forces, hence the interfacial free energy between a saturated hydrocarbon liquid (Yfv = 0,
Y VI = Y:'" ) and a solid can be expressed as,
1
Y SI. = Y s + Y LV - 2(1:1:"')2 (3.4)
Owens and Wendt[41,42) and Kaelble and Uy[49) extended Fowkes' Equation (Eq.
(3.4» and introduced the following equation:
1 1
1 SI. = 1 s + 1 LV - 2( 1:1tv )2 - 2( 1~1fv )2 (3.5)
11

Hone of the phases is nonpolar, Eq. (3.5) will be the same as Eq. (3.4).
Combining Eq. (3.5) with Young's equation (Eq. (3.1» and neglecting the spreading
pressure 1te gives
• • (l+cos9)yLV =2[(y~y~)2 + (yf.,y:>2] (3.6)
Consequently, if the contact angles of two liquids on a solid surface are measured,
simultaneous equations may be fanned from Eq. (3.6) and solved to obtain values of • •
ysd and yl. Or alternatively a straight line can be ploned with X = ( y ~v )2 and y LV
Y = (I + COS9);LV , the slope here equals to (y~)'!2, and the Y-axis intercept is (y~)1/2. . -2(y )2
LV
Hence, the total surface free energy of the solid surface "Is' is then simply the sum of its
components.
3.1.4.2. Harmonic-mean method
The harmonic mean method rather than the geometric mean method when calculating
forces acting across the interface was proposed by Wu[43],
•• y =y +y -4( YSYLv
SI. S LV Y. +y. S LV
(3.7)
Eq. (3.7) was claimed to give more accurate results on the interfacial free energy
between two polymers or between a polymer and an ordinary liquid[43,44].
Combining Eq. (3.7) with Young's equation (Eq. (3.1» and neglecting the spreading
pressure 1te, gives
•• (1+cos9 )Y =4( YsY.
•• y~ +y~
• • (l+cos9 )y =4( YSY2
2 2 y~ +y~
Y~Yi ) Y~+Yi
12
(3.8)
(3.9)

Where y = y. + y' and the subscripts 1 and 2 refer to the testing liquids 1 and 2 respectively. If y/ and y/ of the testing liquids (j=1 and 2) are known, the dispersion
and polar components of the solid surface energy (Ys d and Ysl') can be obtained from
the Contact angles 91 and 92 by solving the two simultaneous equations.
Water and diiodomethane are commonly used as the testing liquids in this method.
3.2 Microscopic Techniques
Complete analysis of an adhesion bond necessarily involves establishing the
topography of the adherend surface, and the failure locus analysis. The microscopy
methods are employed to fulfil this task. It includes OM (Optical Microscopy)[53],
SEM (Surface Electron Microscopy)[54,55] and STEM (Scanning Transmission
Electron Microscopy)[55]. Among them, SEM is most widely used. A
comprehensively comparison for various microscopic techniques used in adhesion
studies was made by Ledbury[56].
3.3 Spectroscopic Techniques
Spectroscopic methods are utilised to study the surface chemical compoSItions.
Ideally, the surface sensitive techniques for surface chemical analysis[57] should
provide elemental identification and a quantitative analysis of the first monolayer of the
surface and identify the type of bonding present at the surface. In addition, the
measurement process should not alter the surface; it should be capable of probing only
a sma1l surface area to resolve regions of inhomogeneity; it should have near-uniform
high sensitivity for all elements; it should be suitable for any sample of interest; it
should be amenable to rapid and simple measurement and analysis; and it should
provide, or at least permit, a profIle into the near-surface ( <1 ILm ) region of the
sample. However, no one technique satisfies all of these criteria. In some cases, it is
not necessary that all criteria be met, then one analytical technique may be able to
answer all the questions raised. In other cases, the surface will have to be examined by
more than one method, thus leading to a more complete understanding of a problem.
The spec~scopi~ techniques mainly used for polymers include Surface Reflectance
Infrared Spectroscopy (SRiRS), X-ray Photoelectron Spectroscopy (XPS), and
Secondary Ion Mass Spectrometry (SIMS).
13

3.3.1 Surface Reflectance Infrared Spectroscopy (SRIRS)[55,58-61]
A number of reflection methods are used to study surface by infrared. Fig. 3.2 shows
schematic diagrams of three types of reflection[55].
~"~\:.5/-.. Source
'RE
,.)
From Iflle.lerome1e'
'0'
From Source
Fig. 3.2 IR reflectance attachments[55]: (a) MlR; (b) specular reflectance; (c) diffuse
reflectance
An internal reflection technique commonly used is multiple internal reflectance or
MlR, with a typical MlR cell shown in Fig. 3.2a. Samples such as polymer films, oils,
or gels are put in intimate contact with a crystal of high refractive index such as 14

gennanium or KRS-5 (bromide thallium iodide). When the angle of incidence of the
light is higher than the critical angle for the crystal, internal reflection occurs through
the crystal and the radiation is attenuated by absorption of radiation by the sample. in
specular reflection, the sample itself is reflective (as shown in Fig. 3.2b). Either the
substrate or a thin film in contact with the substrate can be studied making this an
excellent technique for the study of interfaces. When the sample to be studied is not
reflective, but rather scatters light, a diffuse reflectance attachment can be used, as
shown in Fig. 3.2c, where the externally reflected light is scattered by the sample,
collimated, and detected.
The advantage of SRIRS[55] is the ability to detect surface functional groups in
contrast to the detection of surface elements by other surface analytical techniques.
When infrared radiation impinges on a sample, groups of atoms (functional groups)
absorb energy at characteristic frequencies, allowing for qualitative identification.
Other information can be obtained from SRIRS include the molecular structure,
orientation, chemical reaction, conformation, crystallinity and etc.
Therefore, reflectance infrared spectroscopy can yield chemical infonnation about
substrate surface composition and, important for the study of adhesion, interaction
between adsorbed species and substrates.
However, SRIRS is not very surface sensitive compared with other surface analysis
techniques. In MlR the sampling depth can be calculated by the following
equation[58]
1..0 (3.10) 1
21t1lt [sin2 9 - (n, I lit )2],
where dp is defmed at the distance below the surface at which the amplitude of the
electric field is lIe of its initial value, 9 is the angle of incidence between the IR beam
and the surface normal, lit and n, are the refractive indices of the reflecting element
and sample respectively, and 1..0 is the wavelength of the radiation. Hence if we know
the refractive indices for PEEK and the reflection element, the sampling depth of
PEEK by MlR can-be obtained from Eq. (3.10). Table 3.2 gives the sampling depth
for PEEK at 1720 cm-I with reflection elements germanium (Ge) and KRS-S.
15

Table 3.2 MlR conditions and sampling depth for PEEK at 1720 cm-I with reflection
elements germanium (Ge) and KRS-5.
Reflection flaln.. • Angle of d,n .. o d, at 1720
element incidence cm-I (I1m)
GE 0.375 45 0.066 0.38
GE 0.375 60 0.051 0.30
KRS-5 0.625 45 0.200 1.16
KRS-5 0.625 60 0.111 0.65
* Ratio of refractive index of PEEK ( for polymers in general fla = 1.5, hence the
refractive index of PEEK was assumed as 1.5 here) to that of reflection element (Ge
=4.0, KRS-5=2.4)[62]
3.3.2 X-Ray Photoelectron Spectroscopy (XPS)[57,63-65]
XPS or ESCA( electron spectroscopy for chemical analysis ) is perhaps the most
useful of the surface-sensitive technique for investigating problems associated with
adhesive bonding, especially with polymer adherends, its sampling depth is about 3-5
nm [66].
In XPS a soft X-ray, usually AI Ka (1486.6eV) or Mg Ka (1253.6eV) irradiates the
sample under ultra-high vacuum and causes photoelectrons to be.ejected and detected.
Elements are identified by their binding energies. The measured kinetic energy, Ek, of
the ejected photoelectron is a function of the incident X-ray energy (hv), the binding
energy of the photoelectron (Eb), and the work function ct>, as shown in Eq. (3.11)
(3.11)
As the incident X-ray energy and the work function are constant for a given
equipment, the binding energy of an electron, which is characteristic of the element to
which the electron was bound, can be determined with high precision .
.
XPS has several advantages compared with other techniques. Firstly, it is not only
capable of detecting relative changes in the surface composition as a function of
different surface treatments, it can also provide a good absolute concentration for all
elements except hydrogen. Additionally, the detection limits for all possible elements
16
generally vary less than an order of magnitude and average about 0.1-1 at%, with data
acquisition times of several minutes[57]. (In principle the minimum detectable
concentrations can be made as low as desired by increasing the data acquisition times;
however, time constraints rarely pennit significant improvements.)
Secondly, it provides information about the chemical state. This information is
conveyed by shifts in binding energy of the photoelectron peaks, which occur as a
result of the transfer of electrons from one atom to another during chemical bond
formation. In many cases, the shifts are large enough so that the concentrations of the
different chemical states can be easily determined separately. Tabulations exist of the
chemical shifts for some element [63-65] to assist in the analysis.
Finally, the surface composition of nearly all vacuum-compatible samples can be
measured by XPS with little, if any, chemical changes being caused for most classes of
samples by the X-ray bombardment.
However, XPS measurement alone cannot achieve high reliability in qualitative or
quantitative analysis as the chemically shifted peak can be obscured by peak overlap
which is contributed by a variety of factors, including the small chemical shifts, energy
resolution of the electron energy analyser and the line width of the photo source used.
Hence measures capable of converting the functional groups into derivatives that are
capable of more accurate XPS measurement have been tried[67-74]. It uses a chemical
reagent which can react specifically with a particular kind of functional group. The
derivative has a unique element, such as F, Br or Ag which can be easily detected and
quantified by XPS, thereby indicating surface concentration of functional groups
present on the surface. Chemical derivatisation reactions for some functional groups
have been summarised by Briggs[ 67]. There are two kinds of derivatisation, one is
solvent reaction[68,69], the other is vapour-phase reaction[70-74]. The latter is more·
commonly used, as the solvent derivatisation has some inherent problems. For
example, the solvent used may increase the polymer chain mobility on the surface and
result in the reorientation of some functional groups into the bulk; it could also
dissolve low molecular weight materials on the surface into solution, especially for
modified surfaces.
XPS can be applied to several aspects of adhesion studies, such as evaluating surfaces
prior to bonding, which will yield whether the adherend has the functionalities which
can assist bonding or if there are any contaminants on the adherend surface; and the
failure analysis, which will decide the locus of failure in the system and also lead to 17

infonnation about the reactions occurred in the interface.
3.3.3 Static Secondary Ion Mass Spectrometry (SSIMS)
SIMS is the mass spectrometry of ionised particles which are emitted when a surface,
usually a solid, though sometimes a liquid, is bombarded by energetic primary
particles. The primary particles may be electrons, ions, neutrals, or photons. The
emitted (so called 'secondary') particles will be the secondary ions which are detected
and analysed by a mass spectrometer. It is this process which provides a mass
spectrum of a surface and enables a detailed chemical analysis of a surface or solid to
be perfonned. In a development of SIMS those particles initially emitted as neutrals
may be post-ionised and contributed to the analysis[75]
SIMS is usually operated in either dynamic or static mode. In the dynamic mode, a
high flux of primary ions is directed at the material surface to obtain a very high yield
of secondary ions. The surface is eroded (sputtered) very rapidly and it is possible to
monitor changes of elemental composition with depth and thus a depth profile may be
generated[76]. However, it is clear that analytical conditions using highly destructive
primary beam densities are not suitable for surface analysis. In the static mode
(SSIMS), which was introduced by Benninghoven [77], the current density of primary
beam is maintained at a very low level so that secondary ions are emitted from area not
previously damaged and the surface monolayer lifetime is many hours (well in excess
of the time required for analysis). SSIMS also uses high sensitivity pulse counting
devices which permit high analytical sensitivity.
Essentially static SIMS provides a mass spectrum of the surface. The mix of elemental
and cluster ions in the spectrum can generate a rich store of infollDation regarding the
chemistry of the surface layer. It offers extreme surface sensitivity coupled with the
ability to elucidate not only the elemental composition but also the chemical structure
of surfaces.
Since 1980s, SSIMS has emerged as a complimentary technique to XPS for the
surface analysis of polymers, and has been shown to provide valuable insight into the
surface structure of conventional and surface-modified polymers[78-91]. The work
done by Briggs and co-workers has proved that SSIMS can be used in the following
three areas:
(a) high spatial resolution analysis of polymer surfaces[80] 18

(b) Identification of a broad range of polymers[78]
(c) imaging and microanalysis of the heterogeneous polymer surface using
focused/scannable ion beams[79,87,88]
SSIMS can supplement XPS in many aspects, namely,
Firstly, from many direct comparisons of XPS and SIMS data from the same surface it
is quite clear that SIMS is more surface sensitive than XPS (under routine
conditions)[89]. It has been established[90] that the sampling depth of SIMS is
generally about I nm, i.e. about two monolayers. This is routinely equivalent to that of
very low take-off angle XPS.
Secondary, quantitative analysis of surface molecules is possible with XPS only when
the molecule provides some spectroscopic feature that distinguishes it from the
underlying substrate, e.g. a unique core level peak. However, most polymer molecules
only contain the same principal elements as the common polymers (H, C, 0, N), This
is causing problems for XPS analysis. SSIMS has advantage over XPS in this area, it
recognises molecules through their characteristic fragmentation patterns.
Thirdly, the ability to monitor XPS chemical shifts in electron binding energy due to
changes in the chemical state of surface atoms has been particularly valuable.
However, in many cases these shifts are very small and the resulting chemical state
information can be rather imprecise. SSIMS can probe molecular structure more
precisely because the mass spectrum is discrete and not superimposed on a continuum.
Finally, SSIMS can provide much better spatial resolution than XPS.
The applications of SSIMS in the field of adhesion are similar to those of XPS, i.e.
contaminant detection; surface treatment effects monitoring; failure analysis and
adhesion mechanism studying and etc.
3.4 Summary
A number of surface analytical techniques, of which only a limited number have been
discussed above, are readily adaptable to the study of different aspect of adhesion.
The physical structure of adherend and failure surfaces can be obtained with
microscopy methods, like SEM. The chemical compositions of surfaces and the 19

presence of contaminants and/or residuals can be determined using XPS and SIMS.
These results are often correlated to bond performance aiding in determining
mechanisms of bond failure. Surface functional groups are identified-by SRlRS or XPS
derivatisation. Indeed, basic questions in adhesion science, such as the mechanism of
adhesion, bond durability, and locus of failure, can be. addressed experimentally today
with increasing confidence due to the availability of these techniques.
20

CHAPTER 4 EVALUATION OF BONDABILITY
The bondability of an adherend can be evaluated by several methods, which may be
divided into before-bonding assessment and mechanical tests.
4.1 Before-bonding Assessment[92j
Prebonding assessment are designed to check the surface chemical or physical
propenies, as chemical composition, surface roughness, wettability, and etc .. These
tests will not yield values of joint strength.
4.1.1 Physical-chemical analysis
Physical-chemical analysis techniques are commonly used to detect the presence of any
surface contamination or to ensure that the surface pretreatment has been correctly
carried out, and hence that good adhesion to the adherend should result. Obviously,
modem surface analytical methods such as XPS may readily undertake these tasks, but
these techniques are not non-destructive with respect to the specimen needed and the
size of a typical bonded component, and are difficult to apply on a production line.
Moreover, as no widely accepted quantitative relation has been established between
surface propenies and adhesion, this method is just qualitative.
4.1.2 Water-break test
The water-break test is very easily to carry out, it is based on the principle that a well
prepared surface will hold a continuous film of water rather than isolated droplets. A
continuous water film indicates an adequate surface preparation has been achieved,
whereas a break in the film is thought that there are some contaminants on the surface.
However, the danger exists that a continuous film of water may form if a layer of the
cleaning solution remains on the surface, and care must be taken to ensure that the
surface is thoroughly dried.
4.1.3 Contact angle test
This test is based on the same principle as the last one. It measures wettability by
determining the contact angle between the prepared adherend surface and a drop of 21

reference liquid, often distilled water. Large contact angles indicate poor wettability
and inadequate surface pretreatment, whereas very small angles show the opposite.
4.2 Mechanical Tests
Mechanical tests are destructive, but can give quantitative results of the bondability of
the adherends. In industry, they are also the only accepted methods for evaluating the
bondability of adherends. The mechanical tests give two kinds of information about the
bondability of adherends, their joint strength and failure locus. The fITst is the
quantitative assessment of the bondability of adherends, while the latter can be used to
evaluate whether the surface pretreatment is adequate or not. This section will briefly
discuss the test methods and failure analysis.
4.2.1 Test methods
Many test methods have been developed in government laboratory, industry, and by
university investigators. The American Society for Testing Materials (ASTM), has
been particularly active in this respect. Finalised ASTM test methods are published in
the ASTM standards. These tests can be rather generally classified in three groups,
i.e., tension, shear, and peel (as shown in Fig. 4.1)
4.2.1.1. Tensile tests
Tensile tests are very simple tests (as depicted in Fig. 4.1). The tensile strength of the
joint is determined by the maximum tensile load at fracture divided by the contact area
of the bond. Common tensile tests can be found in ASTM standards, such as the "pi
tensile test" described by ASTM 0897, bar and rod tensile test described by ASTM
02094-69.
In all tensile tests, it is critical to properly align the specimens in the testing machine.
Any misalignment will cause inconsistent load distribution and increase in data scatter.
Another related problem is variation in adhesive thickness which causes non uniform
stresses in the adhesive and large scatter in the strength obtained.
It should be noted that it is difficult to compare tensile strength obtained from the
different test techniques. Each method has unique stress distribution which alter the
values of tensile strength. These variations in propenies are also exhibited in the other
testing modes. 22

F
a) b)
F sample adhesive sample adhesive
F
F
cl d) e)
F F F
adhesive F
adhesive adhesive
Fig. 4.1 Commonly used adhesion test methods[93] a)tensile, b )single lap shear,
c)wedge, d)900peel, elT-peel. (The bondline thickness is much exaggerated)
23

4.2.1.2. Shear tests
Shear tests are very comnion because Sample are simple to fabricate and closely
duplicate the geometry and service condition. When applied loads act in the plane of
the adhesive layer, the adhesive joint is considered to be in a state of shear. The shear
strength is given as the load at fracture divided by the bonding area. In a shear test two
things should be noted, one is that the stress distribution is not unifonn, hence the
maximum stress at the bondline may differ dramatically from the average; the other is
that usually the stress is not pure shear and the actual state of stress depends on such
factors as adhesive thickness, adherend stiffness, etc ..
(a) Lap Shear tests
Lap shear tests involve two adherends which are overlapped by a certain length, while
the adhesive forms the layer between the overlap area. Various lap shear tests have
been described in ASTM standards, such as the single lap shear test described by
ASTM 01002-72; the lap shear sandwich joint for testing plastic film (ASTM 03164-
73, as depicted in Fig. 4.1); and the double-lap shear test (ASTM 03528-76).
The single lap-joint is the simplest and most common joint used today for several
reasons [94]:
i. it is easy to fabricate;
ii. many designs used in industry rely on this overlap geometry as their foundation; and
iii. it is a common test piece used to determine the perfonnance of adhesives
However, the stresses induced in a single lap-joint loaded in tension are quite
nonuniform and complicated. Differential straining of the adherends in the overlap
region produces shear stresses, whereas eccentric bending of the adherends (as shown
in Fig. 4.2) produces tearing (peel) stresses. These two stresses are highest at or near
the overlap ends.
24

r
I ~ 1 I Fig. 4.2 Bending of the overlap region of a loaded single lap joint [95]
111
( c)
N ...-
- _ (d)
---/a---
/--x
o la Dis~cnce along overlap, X
Fig. 4.3 Schematic representation of single lap~joint[95a]. Ca) Unloaded; Cb) loaded in
tension, inextensible subsrrate; Cc) loaded in tension, elastic subsrrates; and Cd)
distribution of elastic shear srress in the adhesive layer. 25
resembling a single-lap bomi
(c) Torsional shear test
A torsional shear test is described by ASTM E229-70. This test can provide very
unifonn stress distribution and the bond system is in an almost pure shear condition.
For every shear test, as in tensile tests, sample alignment, adhesive thickness etc. have
to be well controlled.
4.2.1.3. Peel tests
In general, peel tests involve the controlled stripping of a flexible adherend that is
adhesive bonded to either a flexible or rigid adherend. The peel forces are detennined
by the average load needed to maintain the peeling of the adherend after initiation.
Average peeling forces are obtained from plots of the peeling load versus the peeling
distance. The peel strength is quoted as force per unit width.
There are several kinds of peel tests, one of the simplest is the T-peel test (as depicted
in Fig. 4.1, described by ASTM D 1876-72). In this test, part of two flexible adherends
are bonded together, while the unbonded ends are bent at 900 to the adhesive layer.
ASTM D903-49 describes a 1800 peel test, in this test, a flexible adherend is peeled at
an angle of 1800 from either a flexible or rigid adherend.
ASTM D1781-76 and ASTM D3167-76 describe a climbing drum peel test and a
floating roller peel test respectively, both of them are used to determine the adhesive
perfonnance of bonding metal or composite skins to honeycomb structures.
In peel tests, peeling angle and adhesive thickness should be controlled and hold
constant as they affect the peel strength significantly. It should be also noted that the
stress distribution is not simple and can depend on a number of the testing parameters,
including geometry.
Fig. 4.5 schematically shows the peeling of a flexible adherend from a rigid adherend,
to which it is bonded using a flexible adhesive [97]. The specimen is placed on the
abscissa with its origin 0 at the point of detachment where the nOnTIal tensile stress in
the adhesive is the greatest. In the region AO (curved region), the peeling strip is 27
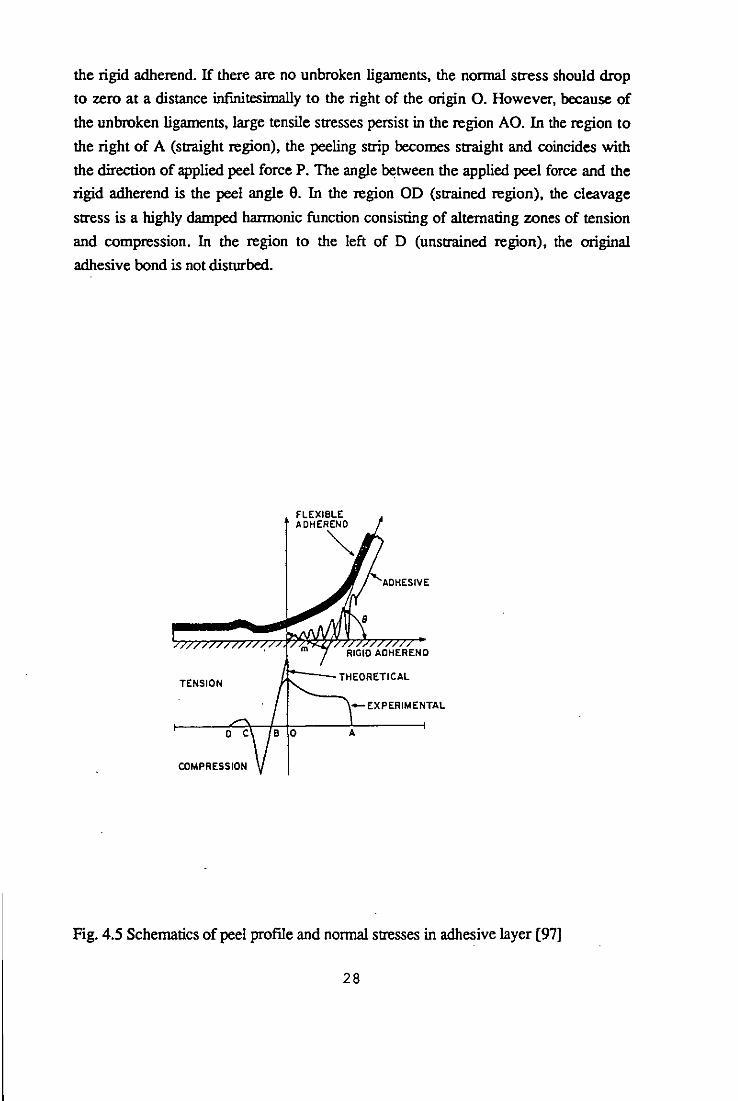
the rigid adherend. If there are no unbroken ligaments, the normal stress should drop
to zero at a distance infinitesimally to the right of the origin O. However, because of
the unbroken ligaments, large tensile stresses persist in the region AO. In the region to
the right of A (straight region), the peeling strip becomes straight and coincides with
the direction of applied peel force P. The angle between the applied peel force and the
rigid adherend is the peel angle O. In the region OD (strained region), the cleavage
stress is a highly damped hannonic function consisting of alternating zones of tension
and compression. In the region to the left of D (unstrained region), the original
adhesive bond is not disturbed.
TENSION
-~XPERIMENTAL
o c
COMPRESSION
Fig. 4.5 Schematics of peel profIle and normal stresses in adhesive layer [97)
28
Kaelble (98-99) gives the theoretical cleavage stress CJ at a distance -x from the point
of rupture 0 (x=O) as
CJ = CJo(cos/k+ K cos Ih) exp(lh)
where
13=( E.b ) 4Elt.
K= J3m J3m+sin e
(4.1)
(4.2)
(4.3)
CJo is the boundary cleavage stress at x=O. E. the elastic modulus of the adhesive. E
the elastic modulus of the flexible adherend. t. the adhesive layer thickness. b the bond
width. I the moment of inertia of the peeling strip cross section. m the moment ann of
the peel force. and e the peeling angle.
Hence according to Equation 4.1. the reduction of stress concentration and
consequent improvement in joint strength can be achieved by [95]
i. increasing adhesive flexibility i.e. reducing E.
n. increasing the modulus of the tape E
ni. increasing thickness of the tape
iv. increasing glue line thickness
4.2.2 Failure analysis
Failure analysis is a critically important aspect of evaluating the bondability of
adherends. Identification of the locus of failure can provide useful infonnation. such as
effectiveness of surface treatment; cause of the failure; mechanisms of crack initiation
and propagation and identification of the weakest point in adhesive joinL
29

Adherend
Cohesive
/,---1 ALt-.e_I....:...=.:.~=-_ Adherend
Interfacial
} .J ;;;::;;:: \
Adherend \ \
Material
Fig. 4.6 Failure Modes of Adhesive Joints[95]
Bond failure occurs in one, or a combination of the following three modes [95] (as
shown in Fig. 4.6): cohesive; interfacial (adhesive); or material. Cohesive and material
failure are identified as fracture occurs within the adhesive system and in the adherends
respectively. These kinds of failure indicate that the adherend has a very good
bondability and the ultimate performance has been reached for the joint of this
adherend and a given adhesive. Improved performance can only be achieved by
redesigning the joint or by replacing the weakest component i.e. the adhesive or the
adherends. On the other hand, an interfacial failure is defined as a fracture occurring
along the adhesive/adherend interface, which indicates that the bondability of the
adherends is not optimum and that further bond perfonnance can be obtained by
strengthening the interface, in other words by selecting a suitable surface treatment for
the adherend.
Failure analysis usually goes through two steps: the first step is a visual inspection. In
a few cases, this examination is sufficient to identify the locus of failure, such as a 30
failw-e occurring through the middle of an adhesive. However, in most situations, this
may not be possible as the eye is not usually able to detect a layer less than 100 nm
thick on a sample[57]. For example, a failw-e may visually appear adhesive, but the real
fractw-e may occur within one of the bond components close to the interface. The
second step is examining the surface by surface analysis techniques, e.g. SEM and
XPS.
Several aspects are worthy noting in failw-e analysis, firstly, it is preferred to examine
both sides of the failw-e, otherwise, the identification of the failure locus can only be
inferred and cannot usually be conclusively established. Secondly, post-failw-e
contamination should be avoided, as it can irreparably alter the surface c!temistty.
Thirdly, post-failw-e damage of the surface should be also avoided, or it is impossible
to detect the actual locus of failure. Fourthly, it is important to realise, that SEM
specimens are routinely coated with a conductive film. This film may mask the fine
structures of the surface morphology that could help to determine the locus of failure.
31

CHAPTER 5 SURFACE PRETREATMENT OF PEEK AND ITS COMPOSITES
Proper adherend surface pretreatment is critical for a good adhesive bond. The
purpose of any particular surface pretreatment may be manifold, but the main aims are
usually to produce one or more of the surface properties discussed in chapter 2.
As the bondability of untreated PEEK and its composites is very poor, a variety of
surface pretreatment methods have been employed to improve their bondability. In this
chapter, a briefly review is given from the relevant articles recently published.
5.1 Solvent Cleansing
Solvent cleansing is the simplest surface pretreatment method, its main purpose is to
remove any contamination on the surface. This treatment is carried out either with
vapour, or by wiping the surface with solvent-dipped clean cloths, or most effectively
in liquid and vapour degreasing baths, possibly using an ultrasonic agitator.
Though solvent cleansing is quite effective for some materials, such as epoxy based
composites, it seems to have no effect on PEEK and its composites[6,7,lOO-103].
Kinloch and Taig[6] found that if continuous carbon fibres reinforced PEEK is bonded
with a structural epoxy adhesive, the solvent-wiping treatment is clearly inadequate.
The resulting joints are weak and the locus of joint failure occurs at the interface
between adhesive and the PEEK composite. These results indicated that in order to
enhance the bondability of PEEK or its composites, their surface physical and chemical
properties should be modified.
5.2 Mechanical Abrasion and Blasting
5.2.1 Introduction
The main purposes of mechanical a,brasion and blasting are to roughen the surface of
the adherend and remove any weak boundary layers.
32

The methods available include wire brushes, sand and emery papers, abrasive pads and
grit- or shot-blasting. The techniques of grit- or shot- blasting give the most
reproducible results and, are preferred for industrial processes. The equipment
basically consists of an air pressure-fed grit-blasting machine in which the abrasive is
stored in a pressure vessel, and is introduced through a small feed orifice into the blast
line. The abrasive is typically angular chilled iron abrasive of size 004 to British
Standard 254 or angular a1urnina abrasive of 180/220 mesh. It is ultimately propelled
through a nozzle of convergent/divergent cross-section onto the work surface [104].
5.2.2 Abrasion
Though abrasion is effective for some materials, such as thermosetting composites, it
results in low-strength bonds with failure in the PEEK or its composites/adhesive
interface[7, 1 00, 103].
Hamdan and Evans[l00] obtained very low joint strength (as shown in Table 5.1) by
abrading PEEK strips with 600 grade silicon carbide paper and then degreasing the
surface.
Table 5.1 Effects of abrasion on the lap shear joint strength of PEEK and its
composites/adhesive joints (ref. 100)
Adherend Adherend thickness Shear strength (MPa) Failure
locus
Unreinforced 3mm 2.3 I
20 Vol% glass 3mm 2.8 I
reinforced
20 Vol% glass 9mm 3.6 I
reinforced
I: Interface
The data in Table 5.1 ( taken from ref. lOO) show that abrasion treatment is ineffective
in producing a high joint strength. The abraded surface revealed by SEM did not show
pronounced roughness or re-entrant contours, and the fracture surface is at, or very
close to, the interface.
33

5.2.3 Blasting
Compared with abrasion, blasting pretreatment is much more effective to improve the
bondability of PEEK and its composites[ 100-103].
Silvennan and Griese[102] employed Al203 grit to blast AS-4/PEEK lap shear
coupons until the blasted surface had a uniform surface appearance. Samples were then
scrubbed clean in deionized water and dried. Using FM 300 film adhesive, the lap shear
strength reached 20.9 MPa, and failure occurred in the adhesive. In this study, the
increase of surface area available for bonding with the adhesive was believed to be the
main mechanism of bondability improvement
YOON and McGraph found[103) that grit blasting increased the bond strength of
APC-2/AS-4 PEEK/Graphite composite, using PI-30% polydimethylsioxide (PDMS)
adhesive, by about 300% compared to that obtained with wash only. By utilising SEM
and XPS to characterise the treated surface, they showed that:
(a) The surface of washed samples were relatively smooth and flat, except for the small
portions of fibres exposed. Grit blasting. however, removed the top layer of the matrix
and left bare fractured fibre pieces.
(b) Washed samples exhibited three peaks at binding energy values of 285,286.7,288
and 291.6 eV which may correspond to C-C, C-O, C=O bonds and satellite peak from
aromatic rings ofPEEK[102,105], while grit blasted sample showed an additional peak
at 289.5 eV, which probably corresponds to the O-C=O groups. From these results
they concluded that the bond strength increase could be attributed in part to O-C=O
bonds but was mainly due to cleaning and surface roughness effects.
However, Davies et al. [106] obtained different results. They employed 150~m sand
particles to blast the PEEK/carbon fibre composite surface. This treatment alone
resulted in low strength bonds(Iess than 8 MPa, lap shear strength) with failure at the
composite-adhesive interface.
Thus, the results of mechanical abrasion and blasting suggest that simple roughening·
the surface is not adequate for improving the bondability of PEEK and its composite
and modification of the surface chemical compositions is needed.
34

5.3 Chemical Treatment
5.3.1 Introduction
Chemical treatment can cause physical and chemical changes on the surfaces. When a
polymer is soaked in a strongly oxidative chemical liquid and treated under suitable
conditions, polar groups are introduced on the polymer surface and the surface
characteristics are improved. Various types of chemicals, such as chromic/sulphuric
acid[7,102,106], tetra-etch solution (mixed naphthalene and tetrahydrofuran with
metallic sodium)[7], potassium permanganate-sulphuric acid mixtures[IOl] (1%
solution of potassium permanganate in a 5:2:2 solution of sulphuric acid,
orthophosphoric acid and distilled water), sulphuric/dichromate mixture[lOO] (300g!l
sulphuric acid (SG=1.84) and 75g!l dichromate), nitric/sulphuric acid mixtures[I00]
(one part by volume nitric acid (SG=1.42) and 3 pans by volume sulphuric acid
(SG= 1. 84) diluted to 10% with distilled water, a solution of Ig 2,4-
dinitrophenylhydrazine with 3 ml of methanol and 2 ml of sulphuric acid[lOO] have
been employed to modify the surface of PEEK and its composites. Among them, the
most effective and common chemicals are chromic/sulphuric acid and
sulphuric/dichromate.
5.3.2 Adhesion studies
Davies et al. [106] reponed results using chromic/sulphuric acid solution at room
temperature to treat carbon fibre reinforced PEEK composites. As shon treatment of a
5s acid etching shifted the failure locus from the interface to the adhesive. A 7.5 min or
longer treatment resulted in lap shear strengths that were as high as it is possible to be
obtained with the given specimen geometry.
Employing chromic/sulphuric acid, Wu et al. [7] obtained similar results. The lap shear
test results for Graphite/PEEK laminates after acid treatment, was over 28 MPa using
FM 300 adhesive film.
To understand better the effect of chromic/sulphuric acid etching on the composite
surface, AS-4/APC-2 laminated were etched at different temperatures for various
times. The lap shear test results are presented in Table 5.2[7], which show that the
bond strength increased with exposure time, but only to a point. It was observed that
at room temperature a 15 min etching of AS-4/APC-2 composite gave a proper
surface for good adhesive bond strength.
35

The chromic/sulphuric acid treated surfaces were also bonded with other film
adhesives. The results are summarised in Table 5.3[7]. The chromic/sulphuric acid
etched surface provided stronger bond strengths with both epoxy and bismaleimide
film adhesives. It seems that the chromic/sulphuric acid etching is a very good method
to prepare PEEK composite surfaces for adhesive bonding.
Table 5.2 The effect of chromic/sulphuric acid etching conditions on the adhesive
bonding (from ref. 7)
Chromic/sulphuric acid etching Lap shear strength ( MPa )
Temperature( of ) Time (min) FM-300 EA-9673
120 20 26.3 ----
Room Temperature 60 24.5 ----
30 ---- 21.3
15 ---- 22.S
10 ---- IS.S
5 ---- 17.S
Untreated 13.6 8.9
Table 5.3 Adhesive bonding of AS-4/APC-2Iaminates (from ref. 7)
Adhesives Lap Shear ( MPa )
FM-300 30.3
FM-137 21.4
FM-250 23.5
FM-73 22.7
EA-9673 21.3
R-319A 18.9
Torlon Tape ( a ) 17.7
PEEK film ( a ) 25.4
( a): Lap shear coupons were bonded with an ultrasonic welder
In order to study the mechanism of bondability improvement, Evans er al. [107]
employed XPS, SEM and contact angle measurement to characterise the surfaces of
PEEK before and after chromate etching.
36

The XPS survey spectrum for the chromate etched unreinforced polymer was very
similar to that of the polished sample, but clearly showed an increased oxygen content
(130%) on the surface compared with the stoichiometric value. Ols spectra indicated
that the carbonyl oxygen peaks at 532 e V has increased as a result of oxidation and
accounts for most of the oxygen present. The form of the oxygen peak was quite
different from that for the untreated polymers. The Cls spectrum was modified after
etching, showing an increase in the size of peaks at higher binding energies, which
corresponds to carbon-oxygen bonds, and the appearance of a new peak at 289 eV.
Surface energy data shown in Table 5.4 indicate that the polar component of the
surface energy was significantly increased by the chromate etching, confnming the
XPS results.
Table 5.4 Effects of chromate etching on the wettability of PEEK (after ref. 107)
Treatment condition
Chromate-etched
(30min, 65°C)
Polished and degreased
GC: glycerol
FMD: formamide
TIPH: tritolyphosphate
Contact angle (degree)
water GC FMD
58 50 32
79 65 64
Surface energy
( mJm-2
TTPH 'Ysd 'YsP 'Ys
18 30 18 48
24 31 5 36
The surface topography was also affected by the etching treatment[7, 1 07]. In view of
the limited effect of abrasion on adhesive joint strength, this roughening effect was
considered to have little effect on adhesion enhancement.
5.4 Plasma Treatment
5.4.1 Introduction
Plasma is an excited .gas which consists of atoms, molecules, ions, free radicals, free
electrons and metastable species[108]. The use of plasma to treat polymers has been
known for more than 20 years. Plasma employed for surface treatment is usually a low
temperature plasma, generated under reduced pressure.
37

In plasma treatment of materials, all significant reactions are thought to be based on
free radical chemistry[1081. The low temperature plasma is efficient in creating a high
density of free radicals, both in the gas phase and on the surface of organic materials,
even the most stable polymers. These surface free radicals are created by direct attack
of gas-phase free-radicals, ions, or by photodecomposition of the surface by vacuum
ultraviolet light generated in the primary plasma. The surface free-radicals then are able
to react either with each other or with species in the plasma environment
The major effects of a plasma pretreatment may include the following: (a) surface
cleaning; (b) ablation and degradation, a form of dry micro-etching; (c) crosslinking;
(d) surface activation; (e) polymerisation and grafting; (f) ion implantation.
These effects may occur concurrently and, depending on processing conditions and
reaction chamber design, one or more of these effects may predominate. In all cases,
these processes affect only the top surface layers and do not change the appearance or
bulk properties of the material[l09,1101.
Many different gases and plasma operating parameters are used in the surface
treatment of different polymers. It has been found that, for best results (in terms of
bondability), different polymers may require a different plasma treatment. In some
cases it has been noted that a plasma which gives excellent bonding on one polymer
may give very poor bonding on another polymer.
5.4.2 Adhesion studies and surface characterisation
Surface characterisation of plasma treated PEEK and its composites has been carried
out by many researchers[7 ,97 ,I 00,102,103,106,107 ,111-1131, However, bondability
studies have been made mainly on composites with PEEK as a matrix ..
Plasma treatments has been found to enhance the bondability of PEEK composites
significantly[7 ,I 00,102,103,1 06,1111, no matter which gas is employed, as shown in
Table 5.5.
38

Table 5.5 The effect of various plasma on the lap shear strength of APC-2/AS-4
composite Joints
Treatment Condition Adhesive Adherend Lap shear
strength(MPa)
<>2,5 min[103] PI-30%PDMS APC-2/AS-4 32.6
NH~, 5 min[103] PI-30%PDMS APC-2/AS-4 33.3
<>2, 15 min, 0.3 Torr[7] EM-300 APC-2/AS-4 28.2
CF4+Oz, 5 min[I02] FM-300 CARBONIPEEK 42.2
Table 5.6 Tensile strength of plasma-treated CarbonIPEEK composite joint as a
function of treatment gas, RF power and treatment time (after ref. Ill)
Gas Type Power (W) Time ( S) Tensile strength _ ( MPa )
---- ---- ---- 0
Oxygen 20 30 9.1
Nitrogen 20 30 11.3
Argon 20 30 9.9
Oxygen 100 30 9.8
Nitrogen 100 30 11.0
Arl!on 100 30 9.0
OXYl!en 50 60 9.7
Nitrol!en 50 60 11.8
Arl!on 50 60 11.5
Oxygen 30 30 8.9
Nitrogen 30 30 8.8
Argon 30 30 11.8
Occhiello et al. [111] studied the effects of plasma processing parameters on the
tensile strength of joints of CarbonIPEEK composite with conventional epoxy
adhesive, and found that plasma treated samples reached high strengths and cohesive
failure even with very short treatment times «30S). Tensile strengths were relatively
insensitive to the nature of the treatment gas and plasma parameters. (As shown in
Table 5.6).
39

To analyse the mechanism of bondability enhancement, XPS, SEM and Contact angle
measurement were used to characterise the plasma modified surfaces of PEEK
composites.
SEM studies revealed that[103] the roughness of the composite ( APC-2/AS-4 )
surface was slightly changed by an oxygen plasma treatment of 5 min, but no
difference was observed for the sample treated by antmonia plasma for 5 min even
though both treatments enhanced the bond strength greatly. The results indicated that
the bondability improvement is due to other mechanisms.
XPS studies shown a different trend, after plasma treatment, the surface
oxygen/carbon ratio increase considerably[7,103,106,111] (as shown in Table 5.7)
Table 5.7 XPS compositions ( atom% ) of untreated and plasma treated Carbon/PEEK
samples (After ref. 111)
Sample 0 C N
Molecular Structure 13.6 86.4 0
Untreated 13.9 86.1 0
Oxygen Plasma Treated 24.9 75.1 0
Air Plasma Treated 23.3 72.5 4.2
Nitrogen Plasma Treated 24.5 70.8 4.7
Argon Plasma Treated 20.3 76.7 3.0
Washed APC-2/AS-4 samples exhibited three peaks at binding energy of 285, 286.7,
288 and 291.6 eV which may correspond to C-C, CoO, C=O bonds, and satellite peak
from the aromatic rings of PEEK[102,105]. Oxygen plasma treatment of 5 min
enhanced the intensity of the peaks corresponding to CoO and C=O bonds, and
generated a new peak at 289.5 eV corresponding possibly to O-C=O bond. However,
NH3 plasma treatment of 5 min showed only three peaks at 285, 288 eV
corresponding possibly to C-C, CoN and C=O bonds, together with a very weak
satellite peak[103]. The peak at 286.5 eV could be a mixture of CoO and CoN .
bonds[112]. The deconvolution exercise indicated that the bond strength increase after
oxygen plasma treatment of 5 min could be attributed to O-C=O as well C=O bond,
while the adhesive bond strength enhancement by NH3 plasma for 5 min could be due·
to C=O bond and possibly to CoN bonds.
40
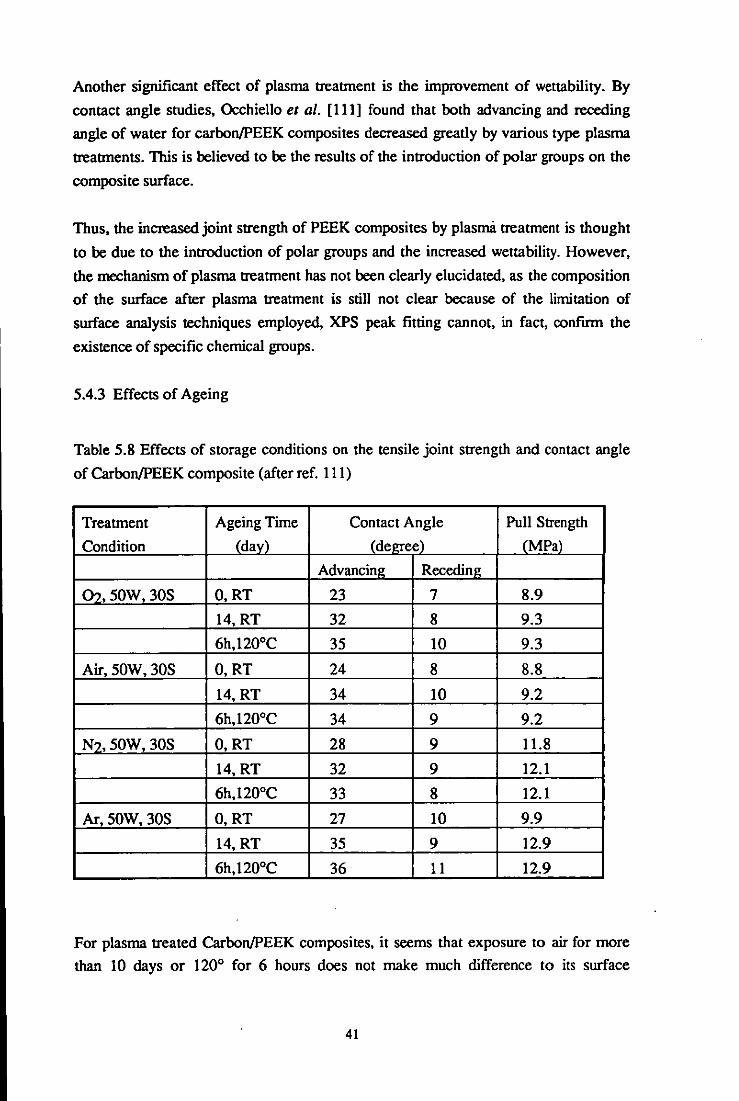
Another significant effect of plasma treatment is the improvement of wettability. By
contact angle studies, Occhiello et al. [Ill] found that both advancing and receding
angle of water for carbon/PEEK composites decreased greatly by various type plasma
treatments. This is believed to be the results of the introduction of polar groups on the
composite surface.
Thus, the increased joint strength of PEEK composites by plasma treatment is thought
to be due to the introduction of polar groups and the increased wettability. However,
the mechanism of plasma treatment has not been clearly elucidated, as the composition
of the surface after plasma treatment is still not clear because of the limitation of
surface analysis techniques employed, XPS peak fitting cannot, in fact, confirm the
existence of specific chemical groups.
5.4.3 Effects of Ageing
Table 5.8 Effects of storage conditions on the tensile joint strength and contact angle
of Carbon/PEEK composite (after ref. Ill)
Treatment Ageing Time Contact Angle Pull Strength
Condition (day) (degree) (MPa)
Advancing Receding
02, 50W, 30S 0, RT 23 7 8.9
14, RT 32 8 9.3
6h,120°C 35 10 9.3
Air, 50W, 30S 0, RT 24 8 8.8
14, RT 34 10 9.2
6h,120°C 34 9 9.2
N2, 50W, 30S 0, RT 28 9 11.8
14, RT 32 9 12.1
6h,120°C 33 8 12.1
Ar,50W,30S 0, RT 27 10 9.9
14, RT 35 9 12.9
6h,120°C 36 11 12.9
For plasma treated Carbon/PEEK composites, it seems that exposure to air for more
than 10 days or 120° for 6 hours does not make much difference to its surface
41
properties. Only the contact angle with water and the tensile joint strength increase
slightly, as shown in Table 5.8, suggesting that the surface of plasma treated
carbon/PEEK is very stable.
However, for unreinforced PEEK, though no adhesion properties versus ageing
condition have been reponed, some other surface properties have been found to be
changed significantly with the ageing condition.
Brennan et al. [113] studied the ageing behaviour of oxygen plasma treated
unreinforced PEEK, and showed that some hydrophobic recovery occurs upon ageing.
They found that:
( a ) Immediately after treatment most samples were almost completely wetted by
water. After approximately 5 min the contact angle could be measured and was found
to be in the region of 4° to 15°, tending to be lower for the less crystalline samples.
( b ) Temperature has a remarkable effect on contact angle. The higher the ambient
temperature, the more rapid is the attainment of the-plateau contact angle.
( c ) XPS studies show no significant increase in the amount of oxygen at take off
angle of either 70° or 35°. However, the Cls envelope does show an apparent increase
in the proportion of oxygen functionalised carbon to hydrocarbon.
From the above results, the authors concluded that:
( a ) The initial very rapid change in contact angle observed in the first few minutes
after plasma modification is probably due to the reorientation of highly mobile
fragments created by the treatment. The change in the surface over the next few days
are due mainly to migration of fragments from the surface into the bulk.
( b ) Increasing the crystallinity and orientation of the samples increase the degree of
order and reduces the free volume in a significant proportion of the polymer matrix.
TIris hinders the movement of the polymer chain and therefore slows the ageing
processes which give rise to migration and reorientation. Conversely, raising the
temperature of the PEEK increases the mobility of the polymer chains, that causing the
ageing processes to occur at a faster rate.
42

Previous work on ageing effects has shown, therefore, that up to almost 15 days
ageing does not affect the bondability and wettability of PEEK composites. However,
studies for longer ageing period are necessary as several months ageing is sometimes
experienced in the industry before a joint is made.
5.4.4 Effects of solvents
Pawson et al. [97] investigated the effects of rinsing the plasma treated PEEK surface
with methanol. Employing XPS and TOF-SIMS these authors found that there are
several points worth noting
( a ) Low molecular weight molecules (LMWM) created on the polymer surface by the
plasma is easily removed by rinsing the polymer surface with a non-solvent for the
polymer. Removal of LMWM from the polymer surface considerably reduces the
complexity of both the TOF-SIMS and XPS spectra. From the XPS spectra it is
evident that the LMWM removed by rinsing contains a high proportion of phenols and
of more highly oxidised carbon functionalities (e.g. carbonyls, carboxylates,
carbonates).
( b ) However, rinsing does not regenerate the TOF-SIMS and XPS spectra of clean
PEEK. The XPS spectra reported show a small, but significant, concentration of
phenolic alcohols and acid groups ( or similar) remain in the rinsed polymer surface. In
the ToF-SIMS spectra, the low intensities of ions diagnostic of PEEK indicate that the
plasma treated and rinsed surface as structurally different to that of the original PEEK.
( c ) In both the positive and negative ions ToF-SIMS spectra a series of new ions are
revealed by rinsing the plasma treated surface. Free radicals created in the polymer
surface by the plasma may combine to cross-link the polymer surface. Further, oxygen
incorporation into the benzene rings does not result immediately in chain scission, and
in the production of LMWM. Both processes will produce a surface that is stable to
methanol rinsing. Methanol rinsing possibly has the effect of revealing surface
structures masked by the presence of the LMWM.
Thus, methanol can change the surface composition of oxygen plasma treated PEEK,
but the effects of methanol or other solvents on the bondability and wettability of
plasma treated PEEK are still unknown.
43

5.5 Corona Discharge Treatment
5.5.1 Introduction
Corona is a term used to describe a gas discharge generated in air at atmospheric
pressure. It is composed of ions, excited atoms and molecules, electrons, etc. A
detailed descriptions of various corona discharge can be found in ref. 114. The effects
of corona discharge treatment is similar to the plasma treatment. But the former has
both an advantage and a disadvantage as it is generated in air, the advantage is that it is
easily set up with low cost and also easily applied in the industry; the disadvantage is
the composition of a corona discharge is not' as easily controlled as in plasma
treatment.
5.5.2 Adhesion studies
Corona discharge treatment was employed by Kinloch and co-workers[IOI,115-117]
to improve the bondability of PEEK composites (APC-2). They studied the effects of
corona discharge treatment on the fracture energy (Gc) of the adhesive joint,
wettability and surface compositions of APC-2. Their results can be summarised as
follows:
Table 5.9 Effects of corona discharge treatment on the adhesive bonding of APC-2
(from ref. 117)
Treatment level(i) 9303 Adhesive
(Jmm-2) Gc(kJm-2) L ofF (ii)
0.0 0.015 interf.<iii)
0.5 0.038 interf.
1.0 0.11 interf.
5.0 0.96 interf.
10.0 1.74 interf. +cohesive
20.0 3.79 cohesive
30.0 3.85 cohesive
(i) Treatment level is energy output of corona;
(ii) "L of F" is locus offailure;
(ill) "interf." is interfacial failure.
44
FM73M adhesive
Gc(kJm-2) LofF
0.015 interf.
0.17 interf.
0.54 interf.
1.44 interf. +cohesive
cohesive
1.84 cohesive
1.86 cohesive
(a) The corona discharge treatment increased the adhesive fracture energy of APC-2
significantly. Increasing the corona power can increase the adhesive fracture energy,
but only to a point, after that, the fracture energy remains the same as the corona
power increased further, as shown in Table 5.9.
(b) The corona discharge treatment also increased the wettability of APC-2 greatly.
The contact angle of double-distilled water on the APC-2 decreased from about 800 to
about 30 as the energy level of the corona discharge treatment was increased from 0 to
20 J mm-2 and beyond
(c) XPS studies suggested that the corona discharge treatment increase type and
concentration of oxygen containing groups
(d) SEM studies found that the corona discharge treatment roughened the APC-2
surface and attacks exposed fibres.
(e) Failure locus analysis show that when the corona power is higher than a certain
value (that is dependent on the adhesive used), failure occurred in the adhesive (as
shown in Table 5.9)
Therefore, corona discharge treatment is an effective way to improve the bondability
of PEEK composites. However, there are some areas that need further studies, such as
the ageing effect, environmental effect, the interaction between corona and PEEK,
etc ..
45
CHAPTER 6 AIMS OF TIlE PROJECf
The purpose of this project was to enhance the bondability of PEEK by means of
plasma and corona discharge treatments, particularly with respect to the following:
(a) Effects of plasma and corona discharge treatment on the bondability of PEEK
Although other surface properties have been widely investigated, there are no data on
the bondability of plasma and corona discharge treated unreinforced PEEK. Moreover,
PEEK is a crystallisable polymer, it is not known whether there is any relationship
between crystallinity and bondability, and plasma or corona discharge treatments.
The aim was to employ T-peel test and lap shear test to evaluate the bondability of
untreated and various plasma or corona discharge treated PEEK. A novel feature was
to add other gases to corona in air. Studies of the relation between crystallinity and
adhesive joint strength were to be included.
(b) Characterisation and modelling of the treated surfaces
Before analysing the mechanism of bondability enhancement, it is necessary to know
the surface physical and chemical properties. More important, to model the treated
surface structures. Though previous work has revealed that both plasma and corona
discharge treatment can change the surface topography, wenability and surface
chemical compositions, the chemical species and functional groups produced by the
treatment are still not clear, particularly the low molecular weight molecules.
The intention was to employ contact angle. measurement, SEM, XPS and XPS
chemical derivatisation, TOF-SIMS and FTIR to characterise the treated surfaces and
low molecular weight molecules produced by the treatment
(c) Surface dynamics and adhesion
In this project, the changes of surface properties after ageing are referred to as surface
dynamics. Studying the relation between the surface dynamics and adhesion has
46
practical significance. as in the industry. plasma or corona discharge treated PEEK
products may experience transportation. storage or other forms of ageing before
adhesive bonding. Thus from a practical aspect. it is necessary to know the effects of
atmospheric exposure. hot environment and humid environment on the bondability of
treated PEEK.
It has been found that about half a month atmospheric exposure does not affect the
bondability and wettability of plasma treated carbon/PEEK composites[llll. but a
short time atmospheric exposure changes the wettability of plasma treated PEEK
significantly[1131. the results indicate that atmospheric exposure has a different effects
on the plasma treated unreinforced and reinforced PEEK. Moreover. the longer period
exposure effects are still unknown and the effects of atmospheric exposure or other
environmental conditions on the bondability of PEEK have not been reported.
(d) Durability of plasma and corona treated PEEK/adhesive joints
There are no data on the durability of plasma or corona treated PEEK/adhesive joints.
Since PEEK and its composites are being actively evaluated for high performance
applications. it is essential that their performances in hostile environments are
understood. it is necessary to know the effect of moisture. solvents. physical and
thermal ageing. Some initial work will be done in this project to examine the hot/wet
performance of plasma and corona treated PEEK/adhesive joints.
47
CHAPTER 7 EXPERIMENTAL
7.1 Materials
7.1.1 PEEK and adhesive
Amorphous PEEK film, STABAR K200 (250 Ilm thickness) purchased from ICI, was
utilised as adherend. While 3M AF-163-2K structural epoxy adhesive film with a
carrier, kindly supplied by 3M, was employed as adhesive.
7.1.2 Solvents and gases
HPLC grade (99.9+%) acetone and 2-propanol (IPA), brought from AIdrich Chemical
Company Ltd, and distilled water were used as solvents.
Oxygen, argon, ammonia, sulfur dioxide brought from BOC (their purity is 99.5+%),
and laboratory air were used as plasma and corona gas respectively.
7.2 Surface Pretreatment
Before plasma and corona discharge treatment, samples were cleaned by tissue wiping.
The procedure is the foIIowing:
(a) wipe the sample surface with a tissue soaked with acetone
(b) wipe the sample surface with a clean tissue
(c) repeat (a) and (b) until the clean tissue can not pick up anything
7.2.1 Plasma treatment
The film adherends treated by plasma under different processing conditions. The
plasma apparatus employed was a Plasma Technology' System 80' barrel type etcher
(as iIIustrated in Fig. 7.1). The barrel diameter is approximately 300 mm and the
electrode cage is large enough to hold specimens 150 mm long. The operating
frequency on this equipment is 105 Hz and the power available is up to approximately
1000 watts. Using a rotary vacuum pump, a base pressure of approximately 260 mtorr
can be attained in a few minutes. The treatment procedures are as foIIows:
48

~AOC:SS ':ONr':;'OlS
\ \ I /
c=J I I /
/ I CAGE. El.ECTRQOE "·/.ACUUM EXHAUST
':lOW CONT;:tOL
Fig. 7.1 Schematic diagram of the plasma apparatus. 'System 80' Plasma Technology
Ltd [117a).
Corona discharge ---,.
HOPE plate
/Gasinlet
Gas Outlet
Rod electrode
Plane electrode
Fig. 7.2 Simplified schematic diagram of corona discharge treatment station
49

(a) pump chamber to the base pressure
(b) inject gas while pump is on
(c) switch off the gas inlet
(d) pump the chamber to the base pressure again
(e) repeat procedure (b) to (d) twice
(f) using gas inlet valve to adjust the chamber pressure to the required value
(g) switch on plasma and hold it for a required period
(h) switch off plasma
(i) let air into the chamber
7.2.2 Corona discharge treatment
The corona treatment station is schematically shown in Fig. 7.2. The generator
employed is model HV 05-2, solid state (made by Tantec). The output power range
from 0 to 350 watts, while the output frequency is from 20 KHz to 30 KHz depending
on load. During treatment, the sample was placed on a HOPE supporting plate, which
is installed between two electrodes (the upper one and the lower one) and its moment
can be controlled by a gear box. The highest speed ( HS ) of the plate is 8.0 mm s-I,
and the lowest speed ( LS ) is I mm s-I. The length of the electrode used is lOO mm.
The gap between the electrode and the sample is fIxed as 1.1 mm. Both sides of the
sample were treated separately at the same condition. The treating gas was injecting to
the upper electrode from the compressed gas cylinder by a plastic pipe and the flow
ratds controlled as 10 I min-I.
The energy output per unit area from the electrode on to the fIlms may be determined
from[lOl]
E=PN LV
(7.1)
Where E is the energy output per unit area (termed as treating level), P is the power of
the generator, N is the number of the passes of the supporting plate, L is the length of
the electrode and V is the velocity of the plate.
50

7.2.3 Solvent washing of the treated surfaces
Some plasma and corona discharge treated fiIrns were washed with either acetone, or
IPA, or distilled water. The procedure was carried out by immersing the treated
samples (five minutes after treatment) in the solvent for 30 seconds, and then hang-dry
in an air circulated clean container. Tests were made at least one hour after the
washing.
7.3 Joint Preparation and Testing
7.3.1 T-peel joints
A schematic diagram of a T-peel joint is shown in Fig. 7.3. The dimensions of the
specimens were 125 mm long and 25 mm wide. The bonded area was 75 mm by 25
mm. Curing of the adhesive was carried out at 120°C for 1.5 hour (as recommended
by the manufacturer) and then cooled down to room temperature naturally. During the
curing process, the specimens were placed between steel plates and kept under a
pressure of about 17 KPa by means of steel weights.
The joints were tested by loading the T-peel test pieces in a LIoyd 1000 tensile tester
at room temperature and at a crosshead speed of 254 mm/min. The peel strength was
obtained by the average load divided by the width of the bonded part. At least three
replicates for each type of joints were tested and the average value and its standard
deviation were reported.
7.3.2 Lap shear joints
Lap shear joints were prepared as sandwich appearance according to ASTM D3164-
73, as shown in Fig. 7.4. PEEK film was put between the adhesive and the steel
adherend. The bonding area was 25 mm by 12 mm, and the size of the adherend was
110 mmx25 mmx3 mm.
Curing of the adhesive was carried out in three stages (as recommended by the
supplier), i.e. (a). increasing the temperature to 120°C; (b). keeping the temperature at
120°C for 1.5 hour; (c). lowering the temperature to ambient naturally. During all
three stages, each specimen was kept under pressure by means of two strong clips.
51

F F
Fig. 7.3 Schematic diagram of a T-peeJ joint
Fig. 7.4 Schematic diagram of the lap shear joint
52

Testing was conducted by applying a tensile load using a Lloyd 1000 tensile tester at
room temperature. In the test, the crosshead speed is programmed as 1.3 nunlmin. The
shear strength is obtained by dividing the maximum load by the bonded area. At least
four samples were tested for each type of joints, and the results reported are their
averages and the standard deviations.
7.3.3 Failure Analysis
Failure analysis for both peel test and shear test samples were carried out by examining
the fracture surfaces visually and by Scanning electron Microscopy (SEM).
7.4 Surface Characterisation
7.4.1 Scanning electron microscope (SEM) analysis
A scanning electron microscope (Cambridge Instruments Microscope) was employed
in this work to examine some surfaces of the PEEK films prior to bonding and some
fracture surfaces of the joints. Before analysis, the specimens were sputter coated with
gold to improve the conductivity of the surfaces and to reduce charging.
7.4.2 Contact angle measurement
Contact angles were measured using a Kruss 040 contact angle measuring system (as
shown in Fig. 7.5) with the liquid drops in an enclosed chamber at room temperature
(between 20°C and 25°C). The liquids used for the measurements were triply distilled
water and high purity (99.9+%) ethanediol (ED), dimethylsulfoxide (DMSO) and
methylene diiodide (MDI). ED and DMSO were obtained from Romil Chemical Ltd,
Shepshed, UK. MDI was obtained from the Aldrich Chemical Company. The total
surface free energy of each liquid at room temperature was determined by the ring-pull
method using a torsion balance[llS]. The results are shown in Table 7.1. They agree
very well with the literature values. Table 7.1 also includes literature values for the
dispersion and polar components of surface free energy, denoted by yt and yf respectively. These values were used in the calculations which followed.
53

Fig. 7.5 Contact angle measurement system
54

Table 7.1 Literature data on test liquids together with measured values of total surface
free energy
Liquid Surface free energy (mJm-2) ref
Y~ yf YL
Literature This study
Water 21.8 51.0 72.8 71.9 26
EO 29.3 19.0 48.3 47.5 119
DMSO 34.9 8.7 43.6 43.5 120
MDI 49.5 1.3 50.8 50.3 41
The syringes which were used to place small drops of the liquids on the film surfaces
were each dedicated to handle only one of the liquids. Each syringe was washed using
their respective liquids before being finally filled. The volumes of the drops were about
3 Ill. The sessile contact angles[30] were measured from each side of the drops for all
mentioned liquids. Readings were taken 30 s after delivery of the drop. Contact angles
obtained in this way were designated as "equilibrium" contact angles and used to
estimate the surface free energy and polarity. They are thought to be similar to those
obtained in Zisman's laboratory, whose measuring procedure was described in ref. 29.
The advancing (aa) and receding contact angles (ar) of water were obtained by
increasing or decreasing the drop volume until moving the three phase boundary over
the surface. During the advancing and receding contact angle measurement, the
capillary pipette of the syringe was kept immersed in the drop as described in ref. 121.
The contact angle hysteresis[45] is defined as H=aa-ar, where H is the extent of the
hysteresis. For every measurement, more than five drops are used and the results were
averaged. The standard deviation of contact angles was found to be within 2°.
7.4.3 Estimation of surface free energy and surface polarity
The results of the contact angle measurements were analysed in accordance with the
geometric-mean method in order to obtain estimates of the surface free energy and the
pOlarity of the surfaces.
55

Surface free energy (1 s) is the su11lIIl3I)' of a dispersion component (,y:); and polar
component (1n which arise from two kinds of intennolecular forces, as shown in Eq.
7.2[41,49,51].
[ 7.2)
The equilibrium contact angles for the testing liquids can be related to the solid surface
free energy by Young's equation (Eq. 7.3)
[ 7.3)
Where 1 LY is the surface free energy of the liquid in equilibrium with its saturated
vapour, 9 is the equilibrium contact angle, 1 LS is the interfacial tension between the
solid and the liquid, 7te is the spreading pressure which has been found to be negligible
for liquids which have a non-zero contact angle on polymer surfaces[ 122].
The interfacial tension between the solid and the testing liquid can be obtained by the
geometric-mean method (Eq. 7.4)[41,42]
1 1
- 2(")22(")2 1 LS - 1 s + 1 LV - 1.1 LV - 1.1 LV [ 7.4)
where 1-:'" and 1fv are dispersion component and polar component of the surface free
energy of the testing liquid respectively.
Combining Eq. 7.3 with Eq. 7.4 and neglecting the spreading pressure 1te gives
By arranging Equation (7.5), we obtain
(1 + cos9)1LV 1
2(1L/ )2
This can be plotted as a straight line with
[ 7.5)
[ 7.6)
56

p 1
x =( Y~V)2 [ 7.7] Y LV
Y _ (1 + COs9)YLv - 1 [ 7.8] . -
2(y )2 LV
The slope equals to (y:>I12, while the Y-axis intercept is (y:)I12. The results will be
reponed with their standard deviations which are calculated according to the method
used by Comyn et al. [118]
Then the polarity of polymer surfaces X', as defmed in ref. 123, can be obtained from
Eq.7.9
XP =y: Iy. [ 7.9]
7.4.4 X-Ray photoelectron spectroscopy (XPS) analysis
7.4.4.1 XPS analysis
The survey spectra, Cls and Ols Spectra were obtained using a VG E Scalab MKll
at Loughborough Consultants Ltd, while the high resolution analysis of Cls and Ols
peaks were conducted with a Surface Sciences M-Probe at CSMA Ltd. The primary
beam in both cases was AIKn X-rays.
7.4.4.2 Vapour-phase derivatisation [124]
A vacuum frame was designed and built for vapour-phase derivatisation. It is
schematically illustrated in Fig. 7.6. A vacuum of -10-4 torr in the frame was obtained
by the use of a rotary pump, a diffusion pump and two liquid nitrogen traps. There
were three sub-frames under the main frame. Each sub-frame was exclusively used for
one derivatisation reaction only. To avoid cross contamination, different derivatisation
reactions were carried out at a time interval of at least one day. A derivatising reagent
was kept in a flask on one side of a sub-frame. Air in the flask was pumped out
through the main frame by opening the valve above the flask after the flask had been
immersed in liquid nitrogen bath for -5 min. After 10 min, the valve was then closed
and the reagent allowed to melt by removing the liquid nitrogen bath. This pumping
process was repeated several times in order to expel the impurities in the flask.
57

Rotary I I, _, ----, pump
Trap
:$
r~; 11: :ii ~~ :~
!d
Diffusion I I ' pump
1I
~J:~:
Liquid nitrogen trap
Liquid nitrogen trap
Cas outlet
Sub-frame 1
:~~~':";;:
Fig. 7.6 Schematic illustration of vapour-phase derivatisation process vacuum frame
58
Main frame
Sub-frame 2 Sub-frame 3
PEEK
Vacuum guage

A tube containing specimens was put on the other side of the sub-frame and pumped
down to a vacuum of -10-4 torr by opening the valve above the tube. The reaction
was started by closing the valve above the sub-frame and opening the valve above the
flask. The flask was kept at -20°C (room temperature -25°C) using a water bath
during the reaction to avoid the condensation of the reagent on the specimens. After
the reaction, a jar containing liquid nitrogen was used to freeze the reagent, followed
by pumping the sub-frame for -10 min. The reagent was then sealed and the specimen
was pumped for -24 hours. XPS analysis of the specimen was performed on the same
day.
7.4.41ime of Flight Secondary Ion Mass Spectrometry (fOF-SIMS)
SIMS analysis was performed on a TOF-SIMS fitted with a pulsed gallium ion source
in CSMA. Both positive and negative ion spectra were recorded.
Samples analysed by TOF-SIMS are listed in Table 7.2
Table 7.2 Samples examined by TOF-SIMS
1. Untreated PEEK
2. Oxygen plasma treated PEEK(a)
3. Oxygen plasma treated PEEK, rinsed in acetone
4. Oxygen plasma treated PEEK, heat treated at 150°C for I hour
5. Ammonia plasma treated PEEK(a)
6. Ammonia plasma treated PEEK, rinsed in acetone
7. Ammonia plasma treated PEEK, heat treated at 150°C for I hour
8. MY750(b) epoxide resin coated untreated PEEK after 24 hours acetone immersion
(EUPK)(C)
9. MY750 epoxide resin coated oxygen plasma treated PEEK after 24 hours acetone
immersion (EOPK)(C)
10. MY750 epoxide resin coated ammonia plasma treated PEEK after 24 hours
acetone immersion (ENHPK)(c)
(a) Plasma treatment condition: 1 min, 500 w, 0.3 tOrT
(b) MY750 is a standard epoxy based on the glycidation of bisphenol-A with
epichlorohydrin
(c) Sample preparation for EUPK, EOPK and ENHPK are given in section 12.3.2
59

7.5 Other Analysis Techniques
7.5.1 Fourier transfonn infrared (FTIR) analysis
A Galaxy Series 3000 FTIR Spectrometer, made by Mattson Instruments was
employed to analyse the composition of the solvents rinsed by plasma treated PEEK
film. The samples were prepared by immersing the plasma treated PEEK film (lOO mm
x 90 mm) in 2 m1 acetone immediately after the treatment, and keeping immersed for
one week.
7.5.2 Differential scanning calorimetry (DSC) analysis
A Thermal Analyst 2000 type DSC from Du Pont Instruments was used to study the
melting behaviour of various condition annealed PEEK films. The scan rate was
looK min- I , while the scan range was from room temperature to 400°C.
60

CHAPTER 8 ADHESION STUDIES
8.1 Effects of Processing Parameters
8.1.1 Plasma rreatment
8.1.1.1 T-peel tests
Ideally, the peel force should be constant at a constant peel rate. In practice the peel
force fluctuates, either. randomly or in a slip-stick fashion [I24a).· In the present
experiments, although the peel force appears to fluctuate at random with respect to the
variability in the height of the load spikes, the amplitude of the fluctuations appears to
be quite constant over the entire bonded area, as shown in Fig. 8.1. The T-peel
strength was expressed as force per unit width of the joint.
.......
.. ~ i ! ~ 60
I i i
o. 20
Fig. 8.1 Typical peel force with continuous failure for T-peel of plasma rreated PEEK
film joints (Trearrnent condition: oxygen plasma, 1 min, 300 w, 0.3 torr)
61

Table 8.1 shows the peel test results for PEEK treated with different oxygen plasma
processing parameters, i.e. treatment time, power and chamber pressure. Where the
following codes are used to indicate locus of failure judged by the naked eyes.
I: Interfacial between the adhesive and PEEK fIlm
C: Cohesive failure in the adhesive
M: Material failure of PEEK
Table 8.1 Effects of oxygen plasma processing parameters on the T-peel joint strength
of PEEK
Parameters T-peel strength (N mm-I) Locus of failure
Untreated 0 I
300 w, 0.3 tOrT, 0.5 min 0.84±O.04 I+C
I min 4.23±O.34 C
2min 4. I 8±O.09 C+M
6min 3.90±0.02 C
IOmin 3.80±0.35 C+M
30min 4.07±O.06 C
I min, 0.3 tOrT, 300 w 4.23±O.34 C
400w 4.29±O.03 C+M
500w 4.64±O.02 C+M
600w 4. 84±O.11 C+M
10 min, 0.3 tOrT, 300 w 3.80±0.35 C+M
400w 3.88±O.06 C
600w 3.72±O.29 C+M
600 w, I min, 0.3 tOrT 4. 84±O.11 C+M
0.4 tOrT 4. 13±O. 10 C
0.5 tOrT 4.42±O.16 C+M
600 w, 10 min, 0.3 tOrT 3.72±0.29 C
0.4 tOrT 3.77±O.35 C
As it can be seen, oxygen plasma treatment can significantly increase the T-peel joint
strength of PEEK. One minute and longer treatment resulted in peel strength values
which are as high as it is possible to obtain with the T-peel tests. Changing the
processing parameters do not have a large effect on the T-peel joint strength of PEEK,
though it seems that there is an optimum treatment condition for the material.
62

(a) 'adhesive' side
(b) 'PEEK' side
Fig. 8.2 Scanning electron micrographs of the peel fracture sllrfaces for untreated
PEEK/adhesive joint
63

To study funher the failure locus of PEEK/adhesive joints, the fractured specimens
were examined by SEM. Micrographs of both the adhesive and PEEK substrate from
opposite sides of the fracture plane, are shown in Fig. 8.2a and 8.2b respectively for
untreated material. Both sides are very smooth while the PEEK side resembles strongly
that of an unbonded control specimen (shown in Fig. 8.3). In other words, there is no
sign of any substrate transfer to the adhesive or any adhesive transfer to the substrate,
either from the visual or electron microscopy observations. Hence, there can be no
disagreement as to the interfacial failure for untreated PEEK joints.
For oxygen plasma treated PEEK/adhesive joints, only one side of the fracture plane
was analysed by SEM as visual observations showed that the opposite sides of the
fractured plane were exactly the same. SEM studies have found that the failure of these
joints occurred at the adhesive through plastic deformation (as shown in Fig. 8.4),
suggesting the existence of a strong interfacial bond .between plasma treated PEEK and
epoxy adhesive.
The treatment effects of different gas plasma are shown in Table 8.2, As it can be seen
that argon gives joints which are some what weaker than when oxygen is the plasma
gas, while arnmoniaand air improve peel strength of PEEK to the same extent as
oxygen is employed.
Table 8.2 Effects of plasma treatment gas on the T -peel joint strength
Treatment Condition Peel Stren~th (N/mm) Locus of Failure
02, 1 min, 500 w, 0.3 torr 4.64±O.02 C+M
1 min, 600 w, 0.4 torr 4.13±O.JO C
Ar, 1 min, 500 w, 0.3 torr 3.36±0.32 C
5 min, 500 w, 0.3 torr 3.85±O.27 C+M
Air, 1 min, 500 w, 0.3 torr 4. 19±O.07 C+M
1 min, 600 w, 0.4 torr 4.00±0.38 C
NH3, 1 min, 500 w, 0.3 torr 4.05±O.11 C
1 min, 600 w, 0.4 torr 4.00±0.09 C
64

Fig. 8.3 Scanning electron micrograph of untreated PEEK surface
Fig. 8.4 Scanning electron micrograph of the T-peel fracture surface for oxygen
plasma treated PEEK/adhesive joint (Treatment condition: 1 min, 500 w, 0.3 toIT)
65
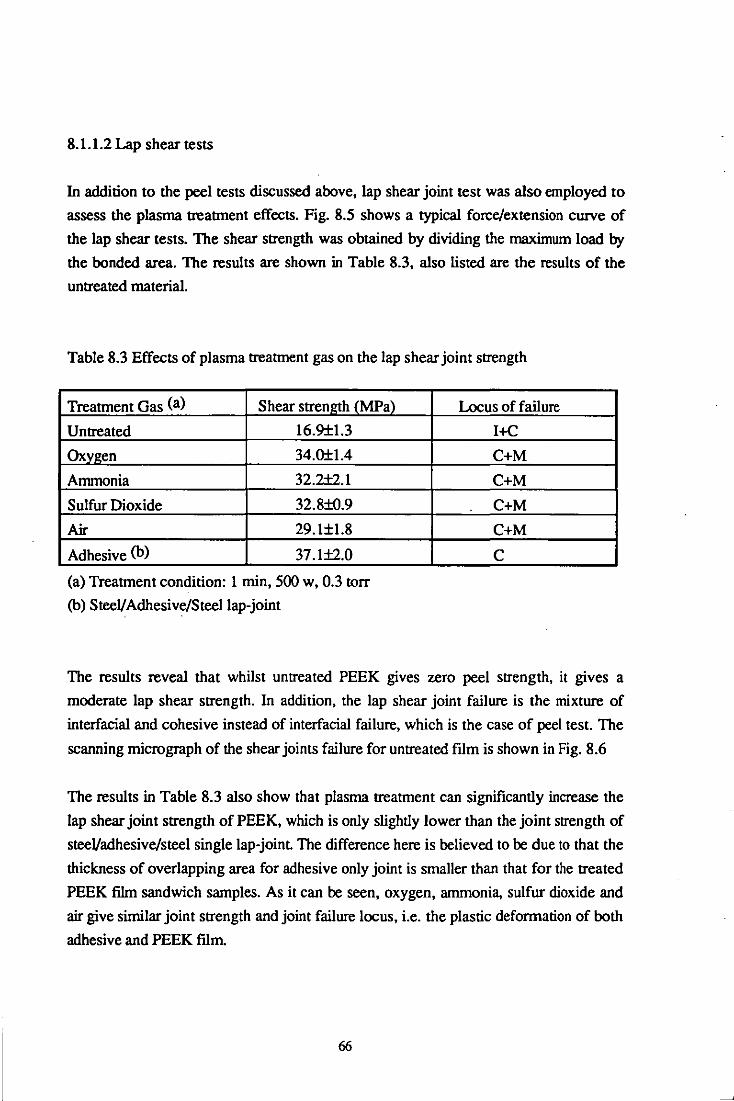
8.1.1.2 Lap shear tests
In addition to the peel tests discussed above, lap shear joint test was also employed to
assess the plasma treatment effects. Fig. 8.5 shows a typical force/extension curve of
the lap shear tests. The shear strength was obtained by dividing the maximum load by
the bonded area. The results are shown in Table 8.3, also listed are the results of the
untreated material.
Table 8.3 Effects of plasma treatment gas on the lap shear joint strength
Treatment Gas (a) Shear strength (MPa)
Untreated 16.9±1.3
Oxygen 34.0±1.4
Ammonia 32.2±2.1
Sulfur Dioxide 32.8±O.9
Air 29.1±1.8
Adhesive (b) 37.1±2.0
(a) Treatment condition: I min, 500 w, 0.3 torr
(b) SteeVAdhesive/Steellap-joint
Locus of failure
I+C
C+M
C+M
C+M
C+M
C
The results reveal that whilst untreated PEEK gives zero peel strength, it gives a
moderate lap shear strength. In addition, the lap shear joint failure is the mixture of
interfacial and cohesive instead of interfacial failure, which is the case of peel test. The
scanning micrograph of the shear joints failure for untreated film is shown in Fig. 8.6
The results in Table 8.3 also show that plasma treatment can significantly increase the
lap shear joint strength of PEEK, which is only slightly lower than the joint strength of
steeVadhesive/steel single lap-joint The difference here is believed to be due to that the
thickness of overlapping area for adhesive only joint is smaller than that for the treated
PEEK film sandwich samples. As it can be seen, oxygen, ammonia, sulfur dioxide and
air give similar joint strength and joint failure locus, i.e. the plastic defonnation of both
adhesive and PEEK film.
66

8
~
Z ~ ~
6 r '" ~ 0
L:..
4 L I
2
o o 2 4 Extension (mm)
Fig. 8.S·Typical force/extension curve of the lap shear tests
(Treatment condition: I min, SOOw, 0.3 torr)
Fig. 8.6 Scanning electron micrograph of the shear fracture surface for unrreated
PEEK/adhesive joint
67

8.1.2 Corona discharge treannent
The processing parameters of corona discharge treannent in this work include
treannent level and gas type. Table 8.4 gives the results oL different air corona
discharge treannent level on the lap shear joint strength of PEEK. The results show
that as long as the treannent level pass the lowest value available in this work, the lap
shear joint strength for PEEK films reaches its maximum value and the failure locus
moves to adhesive and PEEK, i.e. both adhesive and PEEK film are plasticalIy
defonned (as shown in Fig. 8.7). Increasing the treannent level does not further change
the joint strength and failure locus.
Table 8.4 Effects of air corona discharge treatment level on the lap shear joint strength
of PEEK
Treatment level (J mm-2) Shear strength (MPa) Locus of failure
0 16.9±1.3 I+C
0.05 28.3±O.9 C+M
0.2 28.9±2.2 C+M
0.4 28.5±1.8 C+M
0.6 29.1±O.4 C+M
0.8 29.5±O.6 C+M
2.0 29.3±O.5 C+M
Table 8.5 shows the effects of different gas injecting into the corona discharge on the
lap shear joint strength of PEEK films. The results show that all the gases employed in
this work make very little difference on the treannent effect. Air, oxygen, argon,
ammonia and sulfur dioxide corona discharge produce very similar joint strength and
failure locus for PEEK.
68
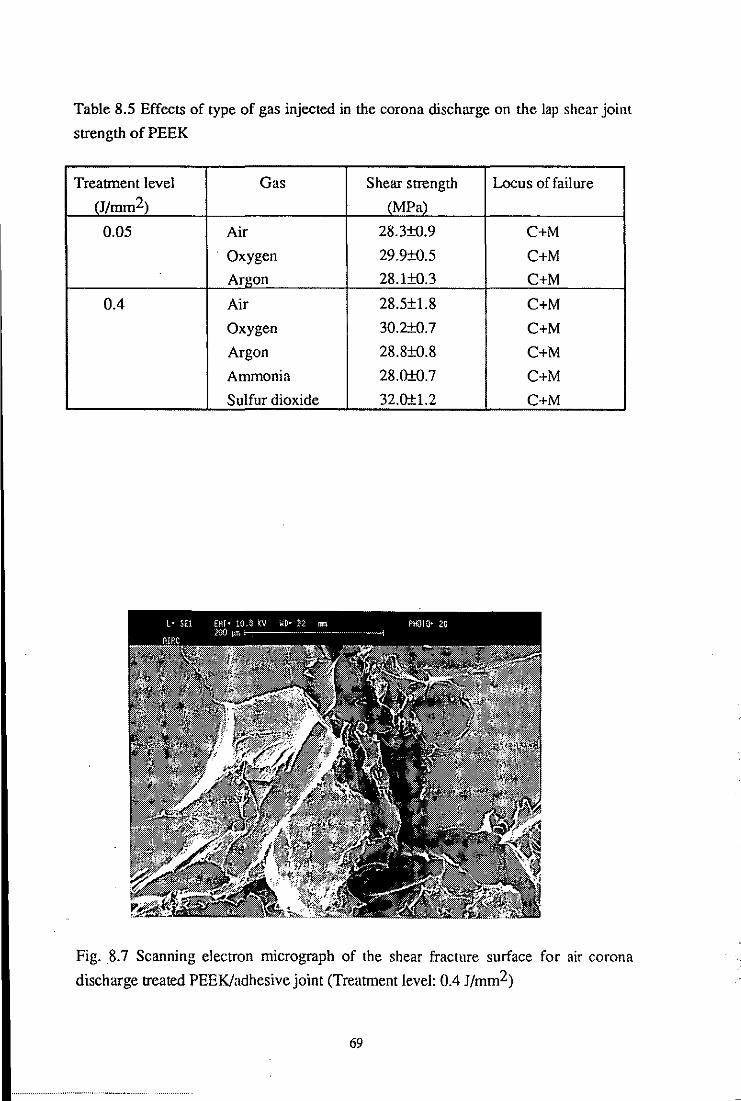
Table 8.5 Effects of type of gas injected in the corona discharge on the lap shear joint
strength of PEEK
Treatment level Gas Shear strength Locus of fail ure
(J/mm2) (MPa)
0.05 Air 28.3±o.9 C+M
Oxygen 29.9±o.5 C+M
Argon 28.1±o.3 C+M
0.4 Air 28.5±1.8 C+M
Oxygen 30.2±O.7 C+M
Argon 28.8±o.8 C+M
Ammonia 28.0±0.7 C+M
Sulfur dioxide 32.0±1.2 C+M
Fig. 8.7 Scanning electron micrograph of the shear fracture sllrface for air corona
discharge treated PEEK/adhesive joint (Treatment level: 0.4 J/mm2)
69

8.2 Crystallinity and Treatment Effects
To obtain different levels of crystallinity, the received film was annealed at 180°C for
different time, and then cooled slowly to room temperature. The crystallinity of the
annealed samples were calculated from the DSC thermograms (a- typical DSC curve is
shown in Fig. 8.8). Details of the calculation is shown in Appendix I, whereas the
results are given in Table 8.6. As it can be seen, a very shon annealing time can
produce a high degree of crystallinity and that prolonging annealing time does not
produce further increase.
Table 8.6 Relation between annealing time and crystallinity·
Annealing Time (hour) Melting peak area (J g-I) Crystallinity
0 0
0.5 40.28 31.0
1.0 41.21 31.7
2.0 42.23 32.5
4.0 44.46 34.2
·Calculation of crystallinity is shown in Appendix I
The crystallised films were treated with oxygen plasma and air corona respectively.
The bondability results are shown in Table 8.7. The relations between crystallinity and
the lap shear joint strength of PEEK before and after treatment can be summarised as
follows:
(a) Before treatment, crystallised films give similar joint strengths as their amorphous
counterparts except for the sample with 34.2% crystallinity.
(b) Oxygen plasma treatment makes little difference to the joint strength between
amorphous and crystallised samples.
(c) Air corona discharge treatment tends to produce slightly higher joint strength for
crystallised samples.
70

0.0,-------------------------------------------------------,
-0.2
Cl
-0.4l ~C ..... <5 Jig
" 0 ... 11.
.... IV -0.6 ., J:
-O.B
-1.0 I I I I I I I 100 150 200 250 300 350 400
TOIVperature (OC) General V4.0D DuPont 2000
Fig. 8.B Typical DSC then110gram for annealed PEEK films (Annealing condition: IBO°C, I hour)
71
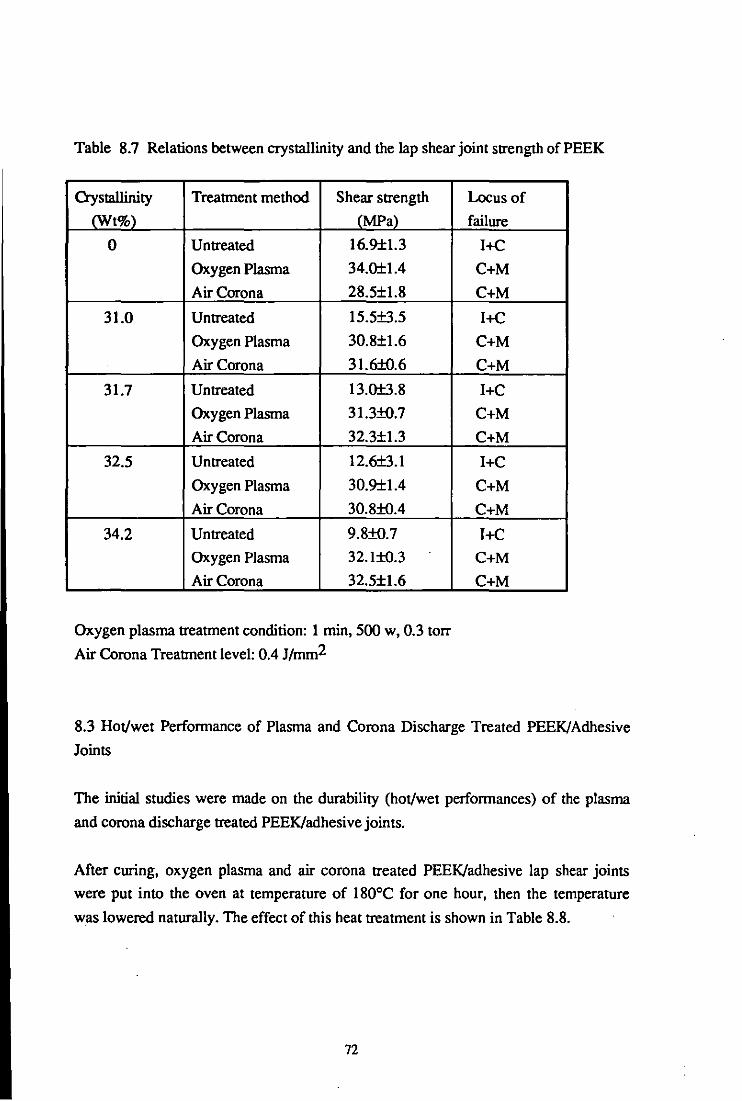
Table 8.7 Relations between crystallinity and the lap shear joint strength of PEEK
Crystallinity Treatment method Shear strength
(Wt%) (MPa)
0 Untreated 16.9±1.3
Oxygen Plasma 34.o±1.4
Air Corona 28.5±1.8
31.0 Untreated 15.5±3.5
Oxygen Plasma 30.8±1.6 . Air Corona 3 1. 6±0. 6
31.7 Untreated 13.0±3.8
Oxygen Plasma 31.3±o.7
Air Corona 32.3±1.3
32.5 Untreated 12.6±3.1
Oxygen Plasma 30.9±1.4
Air Corona 30.8±oA
34.2 Untreated 9.8±o.7
Oxygen Plasma 32.1±o.3
Air Corona 32.5±1.6
Oxygen plasma treatment condition: 1 min, 500 w, 0.3 torr
Air Corona Treatment level: 0.4 J/mm2
Locus of
failure
I+C
C+M
C+M
I+C
C+M
C+M
I+C
C+M
C+M
I+C
C+M
C+M
I+C
C+M
C+M
8.3 Hot/wet Performance of Plasma and Corona Discharge Treated PEEK/Adhesive
Joints
The initial studies were made on the durability (hot/wet performances) of the plasma
and corona discharge treated PEEK/adhesive joints.
After curing, oxygen plasma and air corona treated PEEK/adhesive lap shear joints
were put into the oven at temperature of 180°C for one hour, then the temperature
was lowered naturally. The effect of this heat treatment is shown in Table 8.8.
72

Table 8.8 Hot performance of the joints for oxygen plasma and air corona discharge
treated PEEK (l80°C, I hour)
Sample Heat treatment Lap shear strength
(MPa)
Joints for oxygen Before 34.0±1.4
plasma treated After 29.4±O.7
PEEK
Joints for air Before 28.5±1.8
corona treated After 28.3±1.3
PEEK
Plasma treatment condition: 1 min, 500 w, 0.3 torr
Corona treatment level: 0.4 J/mm2
Locus of failure
C+M
C+M
C+M
C+M
As it can be seen, the joints for oxygen plasma treated materials seem more sensitive to
heat treatment than the joints for air corona discharge treated films. After heat
treatment, the joint strengths for oxygen plasma treated samples are slightly lowered,
but those for corona treated materials remain unchanged.
The wet performance of the joints for oxygen plasma and ammonia plasma treated
PEEK films was assessed by immersing the T-peel joints in distilled water for one
month. The results are shown in Table 8.9. The data listed in Table 8.9 suggest that the
effect of one month water immersion on the adhesive joints for both oxygen plasma
and ammonia plasma treated PEEK can be neglected.
Table 8.9 Effect of one month water immersion on the T-peel joint strength of plasma
treated PEEK films
Sample Water immersion Peel strength Locus of failure
(N/mm)
Joints for oxygen Before 4.64±O.02 C+M
plasma treated After 4.48±O.02 C+M
fihns
Joints for ammonia Before 4.05±O.11 C
plasma treated After 3.97±O.08 C
fihns
Plasma treatment condition: I min, 500 w, 0.3 torr
73

The wet perfonnance of the joints for sulfur dioxide plasma treated films was also
studied by immersing both T-peel joints and lap shear joints in distilled water for 1000
hours at the temperature of 70°C. The results are shown in Table 8.10. The peel
results do not reveal that any change on the strength and the failure locus has been
induced by the water immersion. However, the lap shear joint strengths were lowered
after 1000 hours water immersion, the failure locus also move from the adhesive plus
film to adhesive plus interface. Nevertheless, the interfacial failure here occurred
between the steel and the adhesive while no any sign offailure occurred at the interface
between the adhesive and PEEK films. Hence, both peel and shear test results indicate
that the joints for sulfur dioxide plasma treated PEEK films can stand 1000 hours
water immersion at the temperature of 70°C.
Table 8.10 Effect of 1000 hours water immersion on the joint strength of sulfur
dioxide plasma treated films
Joint type Water immersion Strength Failure locus
Lap shear Before 32.8±O.9 MPa C+M
After 24.4±1.1 MPa C+I*
T-peel Before 3.98±O.06 N/mm C
After 3.99±O.05 N/mm C
*Interface between steel and adhesive
74

CHAPTER 9 WETT ABILITY STUDIES
9.1 Contact Angle Analysis
Table 9.1 and 9.2 listed the contact angles against plasma and corona discharge treated
materials, also listed in these two tables are the data for untreated films
Table 9.1 shows the effect of plasma treatment on the contact angles against PEEK
films. Oxygen plasma is particularly effective in reducing the contact angles. Mter
~- ,o,xygen plasma treatment, all the testing liquids give very small contact angles. Both
ammonia and sulfur dioxide plasma reduce the contact angles for almost all the testing
liquids, but not as significantly as oxygen plasma. From the water contact angle results,
the effects of air and argon plasma are similar to oxygen plasma.
Table 9.1 Effect of plasma treatment on the contact angles against PEEK films
Treatment gas* Contact angle (degree)
------------------------------------------Water EO OMSO OMI
Untreated 73 51 42 31
Oxve;en <5 <5 <5 11
Ammonia 37 28 20 36
Sulfur dioxide 43 27 29 24
Air <5 -- -- 22
Argon 10 -- -- 28
* Treatnient condition: 1 min, 500 w, 0.3 torr
Table 9.2 gives the contact angle results of corona discharge treated materials. As it
can be seen, unlike plasma treatment, all corona discharge treatment produce similar
contact angle results, i.e. the contact angles for all the testing liquids (excluding OMI)
are reduced after treatment.
Therefore, from the contact angle results, it is clear that both plasma and corona
discharge treatment improve the wettability of PEEK films.
75

Table 9.2 Effect of corona discharge treatment on the contact angles against PEEK
films
Treatment gas· Contact angle(degree)
-------------------------------------------Water ED DMSO DMI
Untreated 73 51 42 31
Air 30 25 12 26
Ammonia 45 28 18 34
Sulfur dioxide 45 22 14 27
Oxygen 38 23 10 23
Argon 37 22 5 26
• Treatment level: 0.4 J mm-2
9.2 Surface Free Energy and Polarity
The results of the contact angle measurements were analysed in accordance with the
method discussed in Section 7.4.3 in order to obtain estimates of the polar and
dispersion components of the sulface free energies and the sulface polarity. The
estimation results are shown in Table 9.3 and 9.4 respectively.
Table 9.3 Effect of plasma treatment on the sulface free energy and polarity of PEEK
films·
Treatment condition Sulface energy (mJm-2) Sulface polarity
y~p y~d y~
Untreated 7.2±3.9 31.5±8.3 38.7 0.186
~, 1 min, 500 w, 0.3 torr 42.5±18.1 23.5±13.6 66.0 0.644
0" 1 min, 600 w, 0.4 torr 43.5+17.6 22.6+12.8 66.1 0.658
NH3, 1 min, 500 w, 0.3 torr 32.4±11.6 22.7±9.8 55.1 0.587
NH3, 1 min, 600 w, 0.4 torr 34.6±11.7 23.2±9.7 57.8 0.598
S~, 1 min, 500 w, 0.3 torr 26.3±11.2 26.0±11.3 52.3 0.503
So" 1 min, 500 w, 0.3 torr 19.5±9.7 27.5±11.6 47.0 0.416
• When the contact angle approaches zero «5°), the equilibrium spreading pressure lie in Young's equation can be quite significant and can not be neglected. But since the value of lte is difficult to obtain, the surface free energy values of some plasma and corona treated films reported in this thesis are only approximated values by omitting the spreading pressure.
76

Table 9.4 Effect of corona discharge treatment on the surface free energy and polarity
of PEEK films
Gas Treatment level Surface energy(mJm-2) Surface polarity (1mm-2) 'Y.p 'Y.d 'Y. "
Untreated 7.2±3.9 31.5±8.3 38.7 0.186
Air 0.05 28.6±12.1 26.5±11.7 55.1 0.519
0.2 22.8±7.6 26.9±8.3 49.7 0.460
0.4 34.5±14.3 24.0±12.0 58.5 0.590
0.6 30.l±11.9 25.4±11.0 55.5 0.543
0.8 33.0±13.4 26.4±12.1 59.4 0.555
2.0 33.6±13.8 26.2±12.3 59.8 0.562
Ammonia 0.05 24.6±9.2 25.2±9.4 49.8 0.494
0.4 25.9±8.7 25.7±8.7 51.6 0.502
Sulfur dioxide 0.4 24.6±8.3 28.0±9.0 52.6 0.467
Oxygen 0.05 21.0±6.6 28.2±7.7 49.2 0.428
0.4 28.7±11.3 26.8±11.0 55.5 0.518
Argon 0.05 26.1±9.1 27.2±9.4 53.3 0.489
0.4 29.8±11.1 26.2±1O.5 56.0 0.532
Table 9.3 gives surface free energy and polarity of PEEK films before and after plasma
treatment. As it can be seen, oxygen, ammonia and sulfur dioxide plasma significantly
increase the polar component of surface free energy, while at same time lower the
dispersion component. The total surface free energy increased after treatment. The
surface polarity calculated from the surface free energy results also increased
remarkably suggesting that the treated surfaces have much higher polarity than their
untreated counterpart.
The data listed in Table 9.4 show that the effect of corona discharge treatment on the
surface free energy is quite similar to that of plasma treatment, i.e. corona treatment
increases the polar component of the surface free energy and lowers the dispersion
component, but the total surface free energy is increased after treatment.
Therefore the surface free energy and polarity results indicate that both plasma and
corona discharge treatment change the surface structure and increase the surface
polarity.
77

9.3 Contact Angle Hysteresis
Table 9.5 and 9.6 show the effect of plasma and corona discharge treatment on the
contact angle hysteresis of water respectively.
Table 9.5 Contact angle hysteresis of water before and after plasma treatment
Treatment Gas Contact angle hysteresis (degree)
e~ er e~ -er Untreated 78 32 46
Oxygen <5 <5 --Ammonia 41 <5 >36
SuIfur dioxide 43 <5 >38
Air <5 <5 --Argon 10 10 0
Treatment condition: 1 min, 500 w, 0.3 tOTT
Table 9.6 Contact angle hysteresis of water before and after corona discharge
treatment
Treatment Gas Contact angle hysteresis (degree)
e~ er e. -er Untreated 78 32 46
Air 30 <5 >25
AnmlOnia 45 <5 >42
Sulfur dioxide 46 <5 >41
Oxygen 39 <5 >34
Argon 37 <5 >32
Treatment level: 0.4 J mrn-2
Untreated PEEK has a large extent of contact angle hysteresis with .the advancing
contact angle having a value of 78 and the receding angle of 32, as shown in Table 9.5.
Plasma treatment reduce the value of advancing and receding angle simultaneously
with the receding angle reach the values of zero «5) while the advancing angle to a
different value depending on the gas used. Oxygen and air plasma also decrease the
advancing angle to the value of zero (<5), but ammonia and sulfur dioxide plasma only
78

reduce that to -40. However, all corona discharge treatment decrease the receding
angle to the value near zero and the advancing angle to values between 30 and 46.
Contact angle hysteresis is thought to be mainly influenced by two aspects, one is the
surface heterogeneity[125], the other is surface roughness[126, 127]. Wu[l28]
suggested that any hysteresis on an optically smooth surface must arise from surface
heterogeneity. SEM analysis has revealed that the materials used in this work are very
smooth before and after treatment (These will discussed in next Chapter). Thus, it is
believed that the changes of contact angle hysteresis are induced by the altering of the
surface heterogeneity after plasma and corona discharge treatment
In addition, the results obtained are the typical behaviour of heterogeneous surfaces
composed by a higher energy and a lower energy part[125,129,130]. The advancing
angles tend to reflect the lower energy part of the heterogeneous surface. Hence,
plasma and corona discharge treatment increase the surface free energy of both higher
and lower energy parts of the surface.
79

CHAPTER 10 SURFACE CHARACTERISATION
10.1 SEM Analysis
SEM analysis has revealed that both plasma and corona discharge. treatment do not
change the surface topography of PEEK films or, the effect is too small to be detected,
as shown in Fig. 10.1-10.3.
Fig. 10.1-10.3 show the scanning electron micrographs of untreated, oxygen plasma
treated and air corona treated films respectively. The untreated~ilrface is very smooth
(as shown in Fig. 10.1). After either plasma or corona dischargetreatrnent, the surface
remains unchanged (as shown in Fig. 10.2 and Fig. 10.3). Therefore, the SEM results
imply that the bondability and wettability improvement after treatment is attributed to
the modification of other surface properties.
Fig. 10.1 Scanning electron micrograph of untreated film
80
. ,

, L- SE! ' EHl- 10.0 (V ~D- Z1 '" HiDlo- 0 A
20. Ojo> I--o-------i ' " ' j II '
Fig. 10.2 Scanning electron micrograph of oxygen plasma treated filin (Treatment condition: 10 min, 300 W, 0.3 torr)
,"
Fig. 10.3 Scanning electron micrograph of air corona discharge treated material
'(Treatment level: 0.4 J mm-2)
81
~; .

10.2 XPS Analysis
10.2.1 Effect of plasma tteattnent
10.21.1 Elemental composition studies
The elemental composition for PEEK films before and after plasma treatment obtained
from the XPS survey spectra are given in Table 10.1
Table 10.1 Atomic analysis per 100 carbon atoms from survey spectra of PEEK films
before and after plasma treattnent
Treattnent e:as* Oxve:en Nitroe:en
Molecular structure 15.8 0
Untreated 17.6 0
OxYe:en 38.1 0
Ammonia 16.3 9.1
Air 31.0 2.2
Argon 30.2 9.0
*Treattnent condition: 1 min, 500 w, 0.3 torr
The results show that the amount of oxygen in untreated material is close to what is
expected, and all plasma treatment significantly changes the surface element
composition of PEEK films. Oxygen plasma treatment increase the amount of oxygen
on the surface but does not introduce nitrogen onto the surface, while ammonia plasma
seems only introduce nitrogen onto the surface and not affect the surface oxygen
concentration. Both air and argon plasma not only increase the oxygen concentration
on the surface but also introduce some amount of nitrogen onto the surface.
10.2.1.2 Cls and 01s spectra
It has been found that plasma treattnent changes the shapes of Cls and 01s peaks of
PEEK films, as shown in Fig. 10.4 and Fig. 10.5
82

! ,
r', ! \. i \ , \
,I
f I
\ I " t \ , ':
\
,", \ i '. "
i \ I', \,
'/ \,.",.,.," \._--(.) .
i ./
'. I
I .\\." ..•..
\., .•• .--- .. ------------~--.
-...• _---
-" , /\ .. \
'. \ \, \.
'~'"
.-~.'\.
(b) ". --.. _----------_._... _-_.-
...... -"--
(c) .
-------_.-._--
! ..
281 Binding energy (cV)
Fig. 10.4 Cl s spectra of untreated and plasma treated films
(a) Untreated;
(b) Oxygen plasma treated (Treatment condition: 1 min, 500w, 0.3 torr);
(c) Ammonia plasma treated (Treatment condition: 1 min, 500 w, 0.3 torr)
83
293
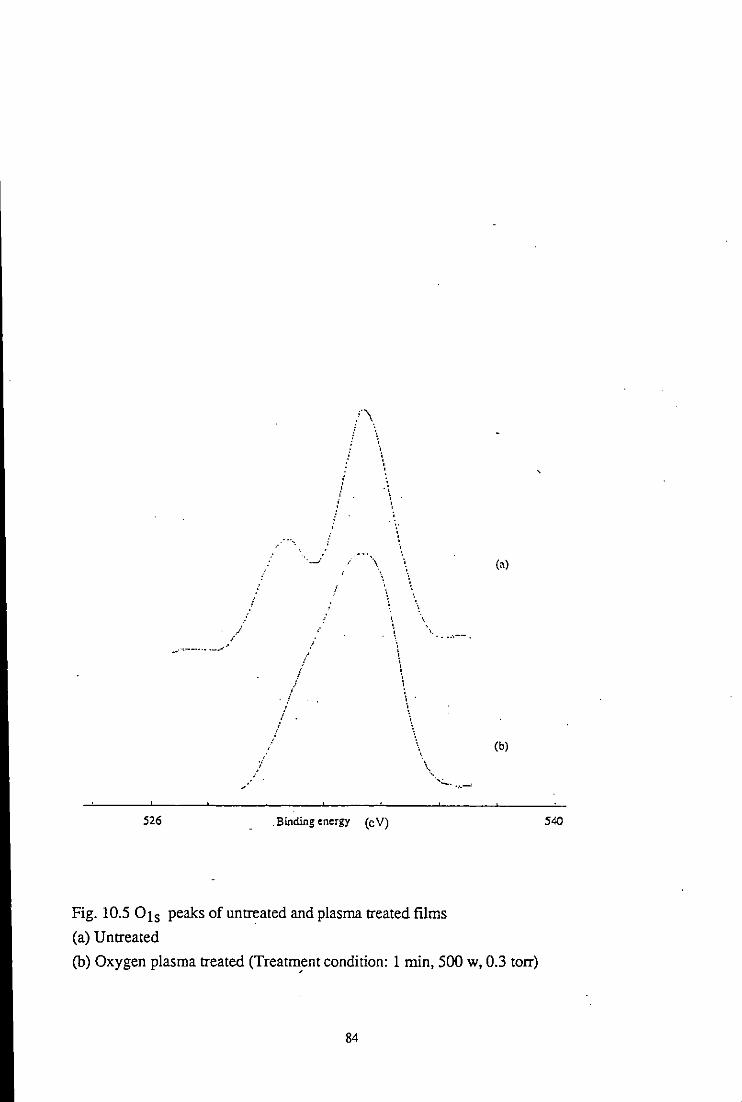
,/
.J ,.
/
526
, ,
./ ;'
. ;'
/
"'-/
!
/\
,/ f
" ;
\
\
\.
.Bindingenergy (cV)
\ \
\
\. \ , . ; ; ; \ '. ; ; , \
' . .... --.
Fig. 10.5 01s peaks of untreated and plasma treated films
Ca) Untreated
(al
(bl
(b) Oxygen plasma treated CTreatm,ent condition: 1 min, 500 W, 0.3 torr)
84
540

Fig. 10.4 shows the C1s peaks of untreated and plasma treated films. Two noteworthy
features are apparent:
(a) The higher binding energy part of the C1s peak becomes larger after plasma
treatment, suggesting that the increased oxygen and (or) nitrogen content of plasma
treated films may results from the formation of additional functional groups on the
surface of PEEK.
(b) The intensity of the x-x· shake-up satellite at 291.8 eV[131] is reduced by plasma
treatment. The results indicate that the amount of aromatic groups on the PEEK
surface was reduced by the plasma treatment. In other words, the aromatic structure of
the polymer at the surface was destroyed by various plasma treatment. This conclusion
is quite consistent with the results obtained by Pawson et al. [91]
Fig. 10.5 shows the 01s peaks of untreated and plasma treated PEEK films. From the
polymer repeat unit, untreated material has two different oxygen containing groups.
one is C=O (at 531.2 eV), the other is C-O-C (at 533.5 eV), and the ratio between
them is 1:2, thus the XPS result in Fig. 10.5 is in good agreement with the anticipated
result. However, after plasma treatment, the lower energy part of the 01s peak forms
a single peak with the higher energy part (as shown in Fig. 10.5), suggesting that the
original chain structure of the PEEK film has been changed.
There are four peaks which occur in the high resolution Cls spectra of PEEK, these
are illustrated for the untreated and Oxygen plasma treated PEEK in Fig. 10.6. Details
of the relative amounts of these, obtained form curve-fitting appear in Table 10.2
Table 10.2 Relative intensities (%) of components in high resolution Cls spectra for
plasma treated films
Sample Binding energy (eV)
285.0 286.7 288.0 289.3
Molecular structure 75 21 5 0
Untreated 76 19 5 0
Oxygen plasma treated 71 20 4 6
Ammonia plasma treated 71 20 6 2
Plasma treatment condition: 1 min, 500 w, 0.3 torr
85

,n
292.3
pp..h: M:lIIP.l. qO~ biJU~Hi.l,l:l A~; r! 'hi! t. "/: (I. \ll!
Cl", l.' iqUi.lre: I" 0<;
! , 1 284,0 28(\,0
Binding energy (eV)
288.3
, , , , , , , , , , , ,
Binding energy (eV)
lIbeak Mode 1: ~
Asymmetry:
rhlJOlJare"
284.3
gO" Gauss i an 0.00 1. 16
(a)
(b)
Fig. 10.6 XPS high resolution Cls spectra of PEEK filrns before and after oxygen
plasma treatment
(a) Untreated
(b) Oxygen plasma treated (Treatment condition: 1 min, 500 w, 0.3 torr)
86
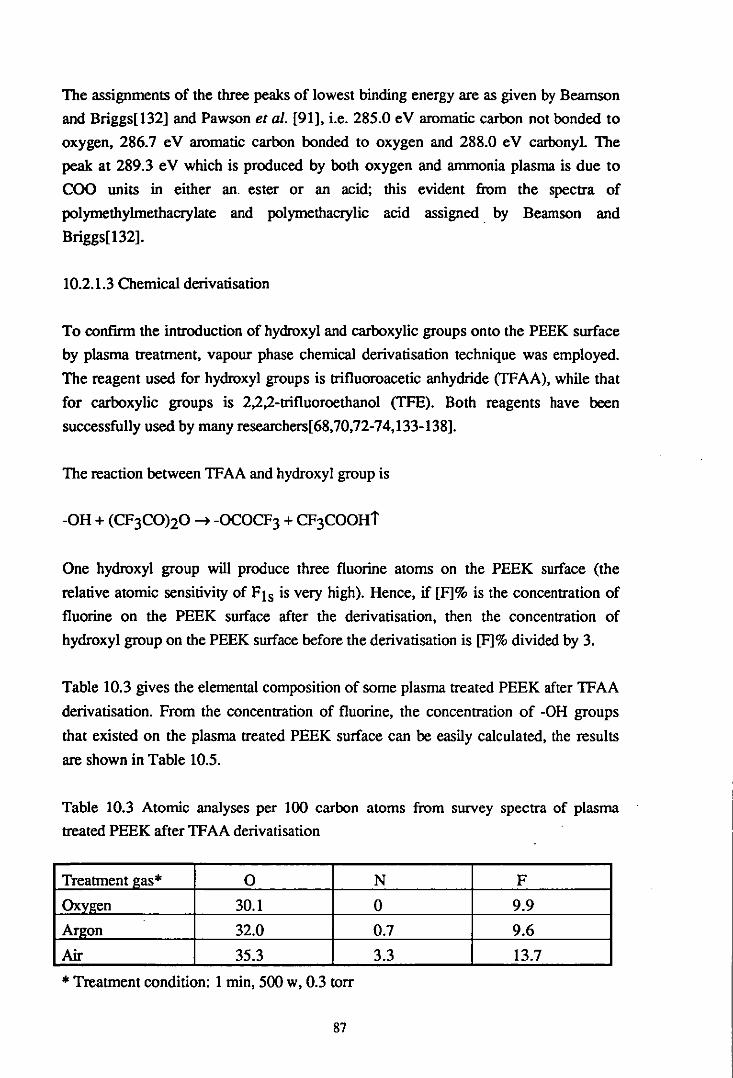
The assignments of the three peaks of lowest binding energy are as given by Bearnson
and Briggs[132] and Pawson et al. [91], i.e. 285.0 eV aromatic carbon not bonded to
oxygen, 286.7 eV aromatic carbon bonded to oxygen and 288.0 eV carbonyl. The
peak at 289.3 eV which is produced by both oxygen and ammonia plasma is due to
COO units in either an. ester or an acid; this evident from the spectra of
polymethylmethacrylate and polymethacry1ic acid assigned. by Beamson and
Briggs[132].
10.2.1.3 Chemical derivatisation
To confirm the introduction of hydroxyl and carboxylic groups onto the PEEK surface
by plasma treatment, vapour phase chemical derivatisation technique was employed.
The reagent used for hydroxyl groups is trifluoroacetic anhydride (TFAA), while that
for carboxylic groups is 2,2,2-trifluoroethano1 (TFE). Both reagents have been
successfully used by many researchers[68,70,72-74,133-138].
The reaction between TFAA and hydroxyl group is
One hydroxyl group will produce three fluorine atoms on the PEEK surface (the
relative atomic sensitivity of F1s is very high). Hence, if [F]% is the concentration of
fluorine on the PEEK surface after the derivatisation, then the concentration of
hydroxyl group on the PEEK surface before the derivatisation is [F]% divided by 3.
Table 10.3 gives the elemental composition of some plasma treated PEEK after TFAA
derivatisation. From the concentration of fluorine, the concentration of -OH groups
that existed on the plasma treated PEEK surface can be easily calculated, the results
are shown in Table 10.5.
Table 10.3 Atomic analyses per 100 carbon atoms from survey spectra of plasma
treated PEEK after TF AA derivatisation
Treatment gas* 0 N F
Oxygen 30.1 0 9.9
Argon 32.0 0.7 9.6
Air 35.3 3.3 13.7
* Treatment condition: 1 min, 500 w, 0.3 torr
87

The reaction between TFE and acid groups is
Similar to lFAA derivatisation, one carboxylic group will produce three fluorine on
the PEEK surface after TFE derivatisation reaction. Therefore, the concentration of
fluorine on the derivatised surface divided by 3 is the concentration of carboxylic
group on the underivatised surface. The elemental composition of some plasma treated
PEEK after TFE derivatisation are shown in Table 1004. The concentrations of
calculated carboxylic groups on plasma treated surfaces from the data in Table lOA
are listed in Table 10.5.
Table lOA Atomic analyses per 100 carbon atoms from survey spectra of plasma
treated PEEK after TFE derivatisation
Treatment gas· 0 F
Oxygen 35.6 8.7
Argon 32.5 4.6
Air 32.0 7.5
• Treatment condition: 1 min, 500 W, 0.3 tOIT
Table 10.5 Concentrations of hydroxyl and carboxylic groups on plasma treated
surfaces
Treatment gas· C-C -OH -COOH
Oxygen 100 3.3 2.9
Argon 100 3.2 1.5
Air 100 4.7 2.5
• Treatment condition: 1 min, 500 W, 0.3 tOIT
As untreated material does not have any hydroxyl or carboxyl groups, the data listed in
Table 10.5 confirm that plasma treatment introduce some amount of -OH and COOH
onto the PEEK surface.
88

10.2.2 Effect of corona discharge treatment
10.2.2.1 Elemental composition studies
Similar to plasma treatment, corona discharge treatment also introduced some oxygen
and nitrogen onto the surface of PEEK. As shown in Table 10.6, the oxygen
concentration per lOO carbon atoms on the untreated PEEK surface is 17.6, and no
nitrogen on that surface, but after corona discharge treatment, oxygen concentration
was increased to more than 23, and some nitrogen atoms can be found on the surface.
Table 10.6 Atomic analyses per 100 carbon atoms from swvey spectra of PEEK films
before and after corona discharge treatment
Treatment gas* 0 N
Molecular structure 15.7 0
Untreated PEEK 17.6 0
Air 25.6 1.0
Ammonia 23.7 4.4
OxYl!en 27.4 3.8
Arl!on 23.1 1.5
* Treatment level: 0.4 J mm-2
10.2.2.2 Cls and 01s spectra
Corona discharge treatments also change the shape of Cls and 0ls peaks for PEEK
films, as shown in Fig. 10.7 and Fig. 10.8. The effects are quire similar to those of
plasma treatment
For Cls peak, the x-x* shake-up signal was reduced after treatment, and for 01s peak,
the dual peaks simplified as one. The results suggest that corona discharge treatments
not only destroy some of the aromatic structure on the surface but also change the
relative amount between C-O and C=O bonds.
89

(\
/ " ! \ I
f \, ! ("\ I / \ \
i j \ .\;; i l I , '
•
i ; ; \.
.J.J,I.·,;~.\,\'.\·-\ ___ -----~ ...• , ... _-----
;" : I I \ .. ,
281
"
\ ".
'. "
..... ,.
.. \
""
" . . ~ .. .... -._- -,' ._-- ,--
'\.\\.
/ !! \, -\._-. ..,-.--------------. , .' --",/ ./,:' \ \\
./ j \, \ , , , /f \ \', ~ ... / ! .. , ........... , .... -... _--:------------
---_... ! \, ! \
\\"'----._--_._---. __ ._-"
Binding energy (eV) 293
Fig. 10.7 Effects of corona discharge treatment on the Cls peak for PEEK
(a) Untreated
(b) Air corona (treatment level: 0.4 J mrn-2)
(c) Oxygen corona (treatment level: 0.4 J mm-2)
(d) Argon corona (treatment level: 0.4 J mm-2)
(e) Ammonia corona (treatment level: 0.4 J mm-2)
90

/ , t
/
7\ ,:' ~ I \
/ \ I \
"I '
'\ / I
/ \. l ,t'.', \
" ....... / ! \ • ./ • J
\. \ , , \ 'i ~ " !
• -.-~ .. ,/
./
/
\ \. // ...... \ \, \.
I \. \, - .... .,.. .. -----...... ~--'.--. / \
! / \ \ .1 / \ l
j .~ \
/// \\ .. _----, / \
~.I/ ...... -----.
c
526 542
Binding energy (cV)
Fig. 10.8 Effects of corona discharge treatment on the Ols peak for PEEK
(a) Untreated
(b) Oxygen corona (treatment level: 004 J mm-2)
(c) Air corona (treatment level: 004 ,J mm-2)
91

High resolution analyses confmn that corona discharge treatments change the surface
chemical structure of PEEK fllms. The results are shown in Table 10.7. Table 10.7 lists
the relative intensities (%) of different groups on the PEEK surface before and after
corona discharge treatments. As it can be seen, the corona treatments introduce some
acid groups onto the PEEK surface.
Table 10.7 Relative intensities (%) of components in high resolution Cls spectra for
corona discharge treated films
Binding energy (eV)
Treatment gas· ---------------------------------------------
285.0 286.7 288.0 289.3
C-C C-O C=O COOH Molecular Structure 73.7 21.0 5.3 0
Untreated film 76.5 18.6 4.9 0
Air 76.4 22.0 2.3 2.8
Ammonia 76.5 19.4 5.3 4.1
• Treatment level: 0.4 J mm-2
10.2.3 Effects of solvent washing on the treated surfaces
It has been found that some of the oxygen and (or) nitrogen atoms introduced by the
plasma and corona discharge treatment can be removed by the commonly used
solvents (which are not PEEK soluble, as discussed in Section 12.4.1). The results are
shown in Table 10.8-10.10
Table 10.8 shows the effect of acetone and IPA washing on the surface element
composition of plasma treated fllms. Several conclusions may be drawn from this table:
(a) Both acetone and IPA washing reduce the amount of oxygen on the oxygen plasma
treated surface, but not back to that of the untreated material.
Cb) Acetone and IPA washing has very little effect on the oxygen concentration on the
argon plasma treated surface, however, they remove all the nitrogen introduced by the
argon plasma treatment.
(c) For air plasma treated films, acetone and IPA washing slightly reduce the amount
of oxygen on the treated surface, but removes all the nitrogen from the treated surface.
92

(d) Acetone and IPA washing has little effect on the oxygen amount on the ammonia
plasma treated surface, but reduce the amount of nitrogen introduced by the treatment.
Table 10.8 Effects of solvent washing on the surface element composition per 100
carbon atoms of plasma treated films
Treatment gas· Solvent washing Oxygen Nitrogen
Molecular 15.8 0
structure
Untreated 17.6 0
Oxygen Before 38.1 0
Acetone washing 23.5 0
IPA washin2 35.4 0
Ammonia Before 16.3 9.1
Acetone washing 17.2 5.7
IPA washin2 15.3 3.9
Argon Before 30.2 9.0
Acetone washing 33.3 0
IPA washing 32.5 0
Air Before 31.0 2.2
Acetone washing 28.7 0
IPA washin2 27.9 0
• Treatment condition: 1 min, 500 w, 0.3 tOTT
Table 10.9 gives the results of surface elemental composition on corona discharge
treated PEEK surfaces before and after solvent washing. As it can be seen, both
acetone and IPA washing almost recover the oxygen and nitrogen amount on the
corona discharge treated surfaces (within the XPS detecting depth) back to those of
the untreated material, no matter which gas was injected into the corona discharge.
This result is different with that of plasma treated samples.
To further study the effects of solvents, high resolution analysis of Cls spectra for
some treated samples was carried out, the results are shown in Table 10.10. Two
noteworthy features are obvious:
One is that acetone and IPA washing increase the aromatic C-C bond on both plasma
and corona treated surfaces
93

Table 10.9 Effects of solvent washing on the surface element composition per lOO
carbon atoms of corona discharge treated films
Treatment gas· Solvent washing Oxye;en Nitrogen
Molecular structure 15.8 0
Untreated 17.6 0
Air Before 25.6 1.0
Acetone washing 17.4 0
IPA washing 17.5 0
Ammonia Before 23.7 4.4
Acetone washing 22.2 0
IPA washine; 16.9 1.2
Oxygen Before 27.4 3.8
Acetone washing 16.1 0
IPA washine; 18.3 0
Argon Before 23.1 1.5
Acetone washing 15.5 0
IPA washing 15.3 0
Treatment level: 0.4 J/mm-2
Table 10.10 Effect of solvent on the surface chemical composition of plasma and
corona discharge treated PEEK films analysed by high resolution Cls spectra
Sample Solvent washing Binding energy (eV)
285.0 286.7 288.0 289.3
C-C CoO C=O -COO
Molecular structure 73.7 21.0 5 0
Untreated 76.5 18.6 4.9 0
Oz plasma treated Before 70.7 19.7 4.0 5.6
Acetone washing 78.5 18.7 1.8 1.1
IPA washing 73.2 19.2 4.6 3.0
NH] plasma treated Before 71.5 20.2 6.3 2.0
Acetone washine; 76.3 18.2 5.5 0
Air corona treated Before 76.4 18.5 2.3 2.8
Acetone washing 78.0 22.0· 0 0
Plasma treatment condition: 1 min,500 w, 0.3 torr
94

The other is that acetone and IPA washing reduce the amount of -COOR group
introduced by the plasma and corona discharge treatment. The extent depends on the
treatment gas.
10.3. TOF-SIMS Analysis
10.3.1 Untreated PEEK
(a) Positive ion spectra
The positive ion spectra for untreated PEEK is displayed in Fig. 10.9
Below a.m.u. lOO a series of peak at a.m.u. 39, 51, 77 and 91 are typical of polymex's
containing aromatic groups[139], all other peaks in this region are due to carbon- and
hydrogen- containing ions, which are found in the positive ion spectra of nearly all
polymers[140]. Our results in this region are quite similar to those obtained by Pawson
et al. [91]
As suggested by Pawson et al. [91], the peaks which are unique to PEEK are shown in
the region between a.m.u. lOO and 300. These characteristic peaks are at a.m.u. 104,
105, 195-197,213-215 and 287-289 which correspond to the following structure and
polymer repeat unit (M±H)+ (a.m.u. 287-289).
a.m.u.104
H-O~=O a.m.u. 105
H --0-0-0 -c=o a.m.u.197
HO-O-O-O-C=O a.m.u.213
H-O-O-O-O-( )-c=o a.m.u.289
95

~
~
c ~
o u
'"
~
~
c ~
o u
70 l-
60
50
• 0 l-
30
20
o
+ 15 , 0>,
->
S~5 -
',!At
)("S" ..
n' • c.,.U3 ?t:\ •
l~' ~>'
, C1.US
I+~+ .J. C.)~·l:r
.. ~5'" Sf :J.l+
+ • c..U; C,11o (,q-> C5""
• r_<\." ~,lI, ell· C,H,
o 1 .. 11. 11 ~Wl.. .J\I
52>'~ ~;;' -; -> <;'11 ~-.~ (,J5y'~" qL+
=11 ~r" ~\!\C J ... "LU .. ... . . 1
o 20 .0 60 80 Atomic Mass Unils
50 13' .) J7 .
.0 ,~
2. 11 ' 30 "l;~ ,
220 2.0 260 280 Atomic Mass Units
Fig. 10.9 Positive ion spectrum of untreated PEEK
100
300
~
c ~
o u
~
~
c ~
o u
~
~
c ~
o u
5000 \-
dOOO
3000
P 10It+
p 0 l4-q ~ 11
ere,. I OH
~ c,.. " o
2000 {Cb" 't" :;;~~
100: t£:~~d'M.Jl ,," .. ~'b" .. 100 120 1.0 160 180 200
120 r ~~S"'"
60
,,,
Atomic ~ass Units
"'I~" ,"0.
1'T'c.~c.uJer Ion P D~+k"
-L 1 '-~, • '!J$>' 3',,, ... ~.
o ....... , ~ "0 A.aJ. .L 1 l .,,' 300 • p' ... l t. 4 J., • J t I !, •
320 3dO 360 380 dOO 420 .dO Atomic Mass Units
,,,. 20 SW'
"",'
.60 480 500 520 5dO 560 580 600 Atomic Mass Units
96

In Fig. 10.9, peaks at a.m.u. 104, 105,213 and a peak with low intensity at 288 can be
found, but peaks at a.mu. 195-197 are missing.
In this mass region there is a very strong signal at a.m.u. 149, which can be assigned to
the structure
a.m.u. 149
It is not known where this structure comes from.
There are also other weak signals appear in this region. They are the peaks at a.m.u.
201,202,207,219,239 and 268. Assigning these signals is very difficult They must
be originated from the polymer, though it is not possible to draw ion structures for
these peaks based directly on the polymer repeat unit. Therefore, these ions must
originate from large ions which have undergone rearrangement and fragmentation prior
to mass analysis. However, these peaks did not appear in the spectra obtained by
Pawson et al. [91], instead they found peaks at a.m.u. 139 and 163 from unknown
origin.
Above a.m.U. 300, peaks appear at a.m.u. 305, 332, 391, 413, 429, 441, 494,522 and
550 with very low intensities. It is also not possible to assign these peaks to any ion
structures. In the following sections, the spectrum above a.m.u. 300 will be omitted.
(b) Negative ion spectra
According to ref. 140, in the negative ion spectra of oxygen-containing polymers,
rearrangement reactions are not considered to play a particularly important role, and
for this reason it is often assened that negative ion spectra are more reliable than
positive spectra for elucidating polymer structure. The negative ion spectra of
untreated PEEK are displayed in Fig. LlO.
97
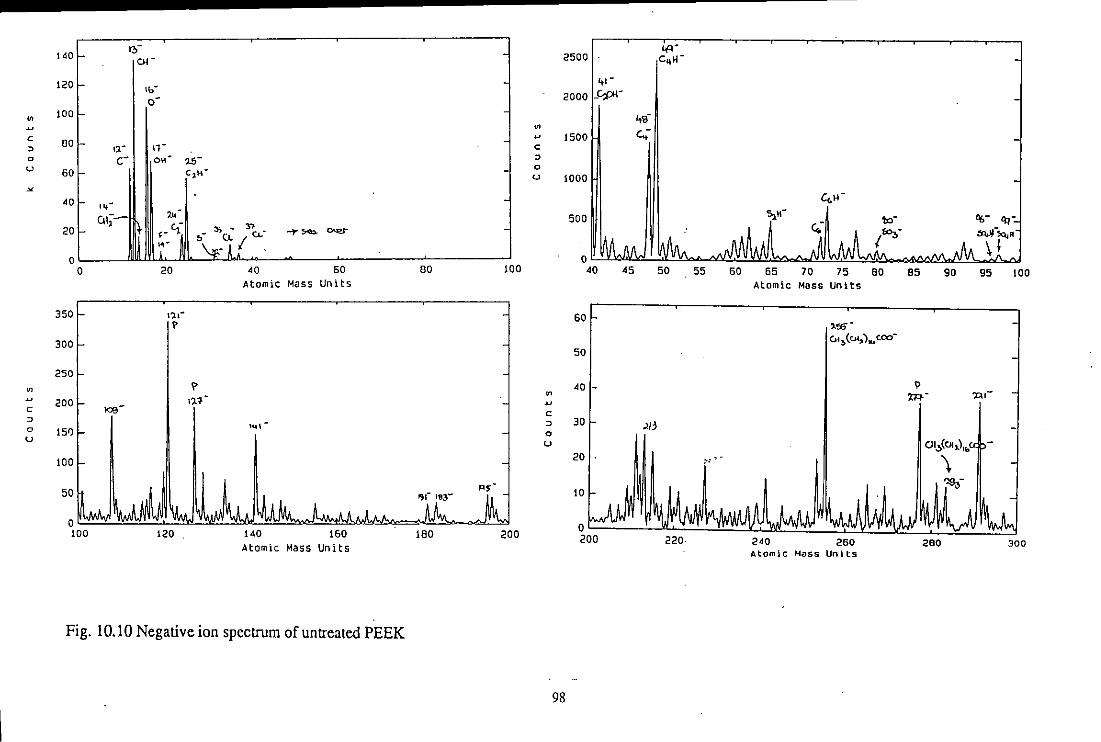
,y ""-140 f- '01- 2500 le,H-120 f- ~,-
'b- -cpl-0- 2000
" 100 Itlf
" c.;-c ~
~ 00 I,- ll- c
0 C- O" '-S- ~
u 0 60 c:tl-l~
U 1000 ~
":iUIL .. ~~:{t 40 1,-
UI,-,.
20 I- ,- "'- ~ _ :n _ .... ""'" """" w ,- _CL ( c...
0 0 20 40 60 80 100 40 45 50 55 60 65 70 75 80 85 90 95 100
AtomiC Mass Units Atomic Mass Units
350 1').,-
60 f ? ,,,,-300
I~:)(w,),..c.co· 50
250 40 1-I' \>
" " m- 'l:\1· 200 . lA_ ~
c toS c ~
I ~ 30 r )13 ,., 0 150 0 u u
100
120 140 160 180 200 220· 240 260 280 300 Atomic Mass Units Atomic Mass Units
Fig. 10.10 Negative ion spectrum of untreated PEEK
98

Many peaks appear below a.m.u. 100, however, ions below a.m.u. 60 are not usually
considered valuable in a diagnostic sense. These ions correspond to 0- and OH
(a.m.u. 16 and 17) and Cn- and CnHm- c!usters[I40]
Weak signal at a.m.U. 19 is assigned to P-, which is thought to be indicative of the
fluorine-terminated end groups originated from the polymerisation process. This
assumption was supported by the weak peak at a.m.U 97, which is assigned to
the structure
a.m.u.97
This result is similar to that obtained by Pawson et al. [91]
Above a.m.u 100, our results are quite different with those obtained by Pawson et
al.[91]. They only found strong signal at a.m.u. 108 and peaks with low intensities at
a.m.U. 197 and a.m.u. 213. The latter two signals can be assigned to two structures
respectively;
o 11 H-O-C-O-o' a.m.u.197
o 11 HO-( ) -C-( ) -0'
a.m.u.213
while the former signal could not be assigned. In Fig. 10.10 can be seen not only those
peaks but many other signals as well. They are the strong signals at a.m.U. 121, 127,
141,255,277 and 291, and the weak signals at a.m.u 181, 183. It is also not possible
to assign these peaks.
10.3.2 Effect of plasma treatment
10.3.2.1 Oxygen plasma treatment
(a) Positive ion spectrum (Fig. A2.l)
99

Compared with the positive ion spectrum of untreated, the following noteworthy
features are apparent:
Belowa.m.u. lOO, a new peak appeared at a.m.u. 18. The origin of this peak has been
the subject of speculation[139,141], It has been suggested that this peak arises from
either adsorbed water at the modified surface or, alternatively, from an oxygen
functionality fonned in the polymer surface during plasma treatment. However, work
carried out by Briggs (cited in ref. 91) has led to the unexpected conclusion that in
some plasma-treated polymer surfaces the peak at a.m.U. 18 arises from NJ4+. In
addition to this new peak, the relative intensities of peaks at a.m.u. 39, 41 and 43 were
reduced.
Between a.m.u. 100-200, a new weak signal appeared at a.m.U. 121
Between a.m.U. 200-300. oxygen plasma treatment introduced new strong signals at
a.m.u. 219 and 242 and removed all other signals in this region except the peak at
a.m.u. 213, which was enhanced.
(b) Negative ion spectrum (Fig. A2.2)
The differences arise from oxygen plasma treatment can be summarised as the
following:
Below a.m.u. 100, the intensities of peaks at a.m.u. 16 (0-),17 (OH-) and 41 (C20H
) were significantly enhanced by the treatment suggesting that oxygen plasma
treatment introduced some oxygen containing groups onto the PEEK surface. Other
changes of the signals in this region were the slightly enhancing of some weak signals
at a.m.u. 45, 57, 59, 77, 93, 95, 97.
Between a.m.u. 100-200, signals at a.m.u. 127, 141, 181, 183, 195-197 disappeared
after oxygen plasma treatment. while signals at a.m.u. 108 and 121 still remained there.
Between a.m.U. 200-300, a strong signal appeared at a.m.u. 203, while peaks at a.m.u
227,253 and 255 disappeared after the treatment. In addition the signal at a.m.u. 211
was enhanced, while the peak at a.m.u. 291 remained little changed.
Hence, both positive and negative ions results confinned our previous results that
oxygen plasma treatment changes the surface chemical structure of PEEK.
100

10.3.2.2 Ammonia plasma treatment
(a) Positive ion spectrum (Fig. A2.3)
Below am.u. lOO, similar to oxygen plasma treatment, after ammonia plasma
treatment, a new peak appeared at a.m.u. 18, and the relative intensities of peaks at
am.u. 39,41 and 43 were reduced.
Between a.m.u. 100-200, a new weak signal appeared at a.m.u. 133 after treatment.
Between am.u. 200-300, just like oxygen plasma treatment, ammonia plasma also
introduced a new peak at am.u 219, however, it introduced another new peak at a.m.u
211, instead of at am.u 242, which was the case of oxygen plasma treatment. In
addition to the introduction of new peaks, ammonia plasma treatment removed all
other peaks shown in the untreated PEEK spectrum.
(b) Negative ion spectrum (Fig. A2A)
Belowa.m.u. lOO, ammonia plasma treatment produced new peaks at a.m.u 15 (NH-),
26 (CN-), 42 (CNO-), 66 and 71. The latter two signals are difficult to be assigned.
The intensities of peaks at a.m.u. 16 (0-), 17 (OH-) and 41 (C20H-) were enhanced
just like the oxygen plasma treatment effect.
Between a.m.u. lOO and 200, the spectrum become much complicated after ammonia
plasma treatment. Strong new signals appeared at a.m.u liS, 131 and 185, while
signals at a.m.u 108, 127, 141, 181, 183, 195-197 disappeared (this is similar to the
effect of oxygen plasma treatment)
Between a.m.u. 200-300, a new peak show at a.m.u. 203, and peaks at 227 was much
enhanced, while the intensities of other peaks were reduced.
Summarised the positive and negative ions results, it can be concluded that ammonia
plasma treatment also changes the surface chemical structure of PEEK and
incorporates some nitrogen and oxygen containing groups in the surface layer. This
result is in good agreement with the XPS results.
101

10.3.3 Effect of solvent washing on the plasma treatment effects
10.3.3.1 Oxygen plasma treated sample
(a) Positive ion spectrum (Fig. A2.5)
Compared with unwashed sample, acetone washing caused the following changes
Below a.m.u. 200, signal at a.m.u. 18 was significantly reduced.
Between a.m.u. 200-300, signals at a.m.u. 213 and 219 introduced by oxygen plasma
treatment were reduced greatly, however, the peak at a.m.u. 242 remained unchanged.
In addition, a relatively strong new signal appeared at a.m.u. 214, and a weak signal
shown at a.m.u. 288, which represents the polymer repeat unit of PEEK chains
(b) Negative ion spectrum (Fig. A2.6)
Below a.m.u. lOO, the intensities of peaks at a.m.u. 16 (0-), 17 (OH-) and 41
(C20H-) were reduced significantly. The signals enhanced by oxygen plasma treatment
at a.m.u. 45, 57, 59, 77, 93, 95 and 97 were also reduced.
Between a.m.u. 100-200, signals at a.m.u. 127, 141, 181, 183, 195-197 removed by
oxygen plasma treatment reappeared after washing but with different intensities.
Between a.m. u. 200-300, peak at a.m. u. 203 introduced by oxygen plasma treatment
disappeared after washing, while a new peak appeared at a.m.u. 281. 10 addition, the
peaks at a.m.u. 227-253, 255, which were removed by the plasma treatment,
reappeared after washing. The signal at a.m.u. 211, which was enhanced by the plasma
treatment, was reduced by washing.
Therefore, both positive ions and negative ions results suggest that changes caused by
oxygen plasma treatment are lost to some extent by acetone washing.
102

10.3.3.2 Ammonia plasma treated samples
(a) Positive ion spectrum (Fig. A2.7)
Belowa.m.u. lOO. acetone washing did not make much difference to the spectrum of
ammonia plasma treated PEEK.
Between a.m.U. 100-200. acetone removed the peaks at a.m.u. 104 and 133. The latter
peak was introduced by the ammonia plasma treatment. However. acetone washing
introduced two new weak signals at a.m.U. 107 and 109.
Between a.m.u. 200-300. the peaks at a.m.u. 211. which was introduced by ammonia
plasma treatment. disappeared after acetone washing. while another peak introduced
by the treatment, which is at a.m.u 219. remained unchanged.
(b) Negative ion spectrum (Fig. A2.8)
Below a.m.U. 200, acetone washing only reduced the peak at a.m.u. 26 (CN-) slightly.
while other peaks introduced by the plasma treatment remained unchanged.
Between a.m.U. 200-300, the signal at a.m.u. 203. which was introduced by the
treatment. reduced significantly after acetone washing. While the signal at a.m. u. 227,
which was greatly enhanced by the treatment, also reduced significantly. Acetone
washing removed the peaks at a.m.u. 213,277 and 291, which existed in both
untreated and ammonia plasma treated PEEK spectra. In addition, acetone washing
enhanced the peak at a.m.u. 255, which was reduced significantly by the plasma
treatment .
Therefore, both positive and negative ions results suggest that acetone washing can
also bring back to some extent the chemical structures changed by the ammonia plasma
treatment.
103

CHAPTER 11 MODELLING OF THE PLASMA AND CORONA DISCHARGE TREATED SURFACES
11.1 Modelling The Treated Surfaces
PEEK is a linear aromatic polymer, with two ether groups, one carbonyl group and
three benzene rings in its repeat unit, as shown in Fig. 11.1
+0 -0-0 -o-oJ-+n
Fig. 11.1 Chemical structure of PEEK
When PEEK is exposed to plasma or corona discharge, the plasma and corona species,
which consists of atoms, molecules, ions, free radicals, free electrons and metastable
species and etc.[108], attack the benzene rings, the ether bonds and the carbonyl
bonds. The effects of these attacks can be the following and, of course, several may
occur simultaneously:
(a) Opening of some benzene rings with or without producing small molecules
(b) Chain scission at the ether and carbonyl site, forming fragments of various size.
(c) The products of the above events react with each other or with the treatment gas,
causing the introducing of some oxygen and nitrogen containing functional groups into
thejJolymer chains and further scission or cross-linking of the molecular chains.
(d) The incorporation of oxygen and nitrogen containing groups directly into the
benzene rings.
To model the treated surfaces, the surface characterisation results given in the last
Chapter are summarised here to evaluate the above postulations.
104

Firstly, both XPS and TOF-SIMS analysis revealed that both plasma and corona
discharge treatment change the chemical structure of the PEEK surface. XPS studies
have found that all the plasma and corona treatments reduced the It-x* shake-up
signal, which represents the aromatic rings, hence confIrmed that some of the aromatic
rings on the surface were opened after treatment.
Secondly, both XPS and TOF-SIMS studies have shown that all treatments introduced
oxygen and (or) nitrogen containing functionality groups to the PEEK surface, like -
OH, -COOH and etc.
Thirdly, XPS and TOF-SIMS studies have revealed that both acetone and IPA washing
can signifIcantly reduce the oxygen and (or) nitrogen concentration on the treated
surfaces confmning that treatment may produce some small molecules or small
fragments on the treated surfaces which are soluble in the ordinary solvents.
Based on these results, it is believed that the treated PEEK surfaces can be modelled as
a modifIed layer. This layer is mainly consisted of plasma (or corona discharge)
produced products with varying molecular weight. According to XPS and TOF-SIMS
results, those products may have higher polarity (more functionality groups) compared
with the untreated material's molecules. The molecules in the modified layer can be
divided into two categories subject to their washability by the solvents (such as
acetone), namely, low molecular weight molecules (LMWM) which can be washed
away by solvent, and high molecular weight molecules (HMWM) which can not be
removed by simply solvent washing.
11.2 FTIR Studies on The Low Molecular Weight Molecules (LMWM) Produced by
The Treatment
To characterise the LMWM produced by the treatment, both oxygen plasma and
ammonia plasma treated films were immersed in acetone for one week five minutes
after the treatment. The solvents were then studied by FTIR.
Table 11.1 compares the signals appeared in the spectra of acetone before and after
immersing of plasma treated films. It was found that there is a new signal at about
3500 cm-I after immersed of either oxygen plasma or ammonia plasma treated films.
This signal could be assigned to hydroxyl or carboxylic acid groups. In the case of
ammonia plasma treated materials, this could be amine groups.
105

Table 11.1 Spectra comparison of acetone before and after inunersion of plasma
treated films
Pure acetone After inunersion of oxygen After Immersion of ammonia
pi asma treated films plasma treated films
-3493 cm- l -3572 cm- l
-3005 cm- l (-CH]) -3005 cm- l -3005 cm- l
-1713 cm- l (-C=O) -1711 cm- l (-C=O) -1713 cm- I (-C=O)
-1422 cm- l -1424 cm- l -1422 cm- I
-1364 cm-l -1366 cm- l -1364 cm- I
-1223 cm- l -1225 cm- l -1223 cm- l
-1093 cm- l -1094 cm-l -1094 cm- l
After subtracting pure acetone spectrum, the spectra for acetone inunersed of oxygen
plasma treated materials and ammonia plasma treated films are shown in Fig. 11.1 and
Fig. 11.2 respectively.
As it can be seen, after subtraction, there are two new signals at -3500 cm-I and
1649 cm-I in the spectra for acetone rinsed of either oxygen plasma or ammonia
plasma treated films. The assigning of the former signal was discussed above, while its
broad range may indicate the existence of intermolecular hydrogen bonding [142]; The
latter signal is difficult to be assigned, but according to ref .143, it could be due to the
enolisation between the ester C=O and the enolic hydroxyl group.
Other signals appeared in the subtracted spectra are similar to those of pure acetone
but with a slightly different absorbing frequency. For instance the C=O signal, for
acetone after extraction of oxygen plasma treated films, this signal appears at about
-1707 cm-I in stead of at -1713 cm-I, which is the case of pure acetone. This could
be due to the conjugation of -C=O group with other groups, like -C=C- . Therefore,
acetone washing may wash out LMWM with hydroxyl, carboxyl, carbonyl, amine,
ketone and etc. groups from the plasma treated surfaces. These groups could play a
very important role on the surface properties. The role played by LMWM will be
discussed in next Chapter.
106

I I
O.6~ ;
(
o . fS--i
; A 0 4.J b • ~
B 0 r b .. I nO.S-i c ! .. J ,
I !
0.21 I ! I
.. ! O. _-: ! ; i
I 0.0-]
ID V CD
10
" V
0 .. .. " 0
"
" .. ID
" ID (!J
N V N ID
CD ID
"t ID
ID
(!J
V ..
1-~'--'T----rj~~~I:;:::::::='--r1 ---'j---r( --..,......
N ID ID
0 (!J
N
I 4000 3BOO 3000 2600 2000 1BOO 1600 1400 :1200 1000
wavenumbera
Fig. 11.1 Spectrum for acetone immersed with oxygen plasma treated films after
subtracting the spectrum for pure acetone
107
I I
I I I I j
j
I I I I I I
I I I
I
I
BOO eo

O.~r-----------~·--------------• !
-------,1
0.5~
i i
0.4-1 i
I I i
0.31
DJ 10 Cl
Cl' Cl 10
10 Cl (I)
, • C'l 1 ,
C'l I l' I
I (I] ! (lJ I (lJ I
I i
o • 2--' 'Of I
I 0.1-1 ,
i i I I
I • 0--':
4000
III III
'Of ... tu
tu ID 'Of 10 tu 10
Cl 'Of ID
10 o l'
I I I
I
! I i • • I I
-r·-·--r-·.-r--.---.--l----·r---l----~-·I·---r·--~ 3000 3000 21500 2000 :11500 :1600 :1400 :1200 :1000 BOO 50
Wevenumbore
Fig. 11.2 Spectrum for acetone immersed with ammonia plasma treated films after
subtracting the spectrum for pure acetone
108
I I

CHAPTER 12 STUDIES ON THE MECHANISMS OF BONDABILITY ENHANCEMENT
Adhesion is a surface phenomenon and, therefore, the bond strength is governed by
surface propenies. The results in Chapter 8, 9 and 10 have shown that both plasma and
corona discharge treatment significantly changes the bondability, wettability and
surface chemical compositions of PEEK films. This Chapter try to correlate the
adhesion of the treated materials to their surface propenies. Before making the
correlation, the adhesion theories available were reviewed and their relevance to this
work were analysed.
12.1 Adhesion Theories
There are five adhesion theories which have been proposed, namely:
(a) Weak boundary layers
(b) Mechanical interlocking
(c) Diffusion theory
(d) Electronic theory
(e) Adsorption theory
Some years ago many works searched for "the mechanism of adhesion", but more
recently it has become generally accepted that, whilst the adsorption theory has the
widest applicability, each of the others may be appropriate in cenain circumstances and
often make a contribution to the intrinsic adhesion forces which are acting across the
interface[I44]. These theories will be discussed respectively in the following sections.
12.1.1 Weak boundary layer
An adhesive bond will fracture at its weakest link. Thus, if a cohesively weak layer
exists on the adherend surface, the adhesive bond may fracture within this weak
boundary layer at low applied stress. For polymers, the WBL maybe common because
of their tendency to reject foreign substance to their surfaces by the process of
diffusion. An imponant foreign substance which might be a general source of WBL is
109

low molecular mass polymer. In addition, WBL also could occur as the consequence
of contamination.
'However, solvent washing, abrasion or blasting can hardly improve the adhesive joint
strength of neat PEEK or its composites [6,7,100-103]. The results indicate that the
low joint strength of PEEK is not due to the existence of WBL if it exists on the
untreated surface.
12.1.2 Mechanical interlocking
This theory essentially proposes that mechanical keying, or interlocking, of the
adhesive into the irregularities of the substrate surface is the major source of intrinsic
adhesion[145]. Hence, in order to get maximum bond properties, the adherends must
be roughened in some way.
Nevertheless, the results in Chapter 10 show that both plasma and corona discharge
treatment have very little effects on the surface topography of the PEEK films studied.
Therefore, the bondabiJity enhancement in this work is thought to be due to other
mechanisms.
12.1.3 Diffusion theory
In essence, the theory states that during the adhesive bonding operation, segments or
potions of the polymer in the adhesive diffuse into the polymeric substrate and vice
versa. This requires that the macromolecules or chain segments of the polymers
(adhesive and substrate) possess sufficient mobility and are mutually soluble, Voyutskii
[23] in particular have been the strong advocates of the diffusion mechanism
If the above requirements are met then the diffusion of an adhesive into a substrate will
increase as the period of contact, temperature, pressure are increased. Further,
diffusion will decrease if molecular weight and crosslinking are increased.
To consider the possibility of diffusion then several facts have to be considered. Firstly,
PEEK has a T g value above the curing temperature of the epoxy adhesive employed.
Secondly, PEEK and the adhesive employed are not identical polymers. Hence it is
unlikely that interdiffusion across the interface could occur in our case.
110

The modified layer produced by the plasma and corona discharge treatment (as
modelled in last Chapter), however, could possibly possess sufficient mobility and has
similar solubility with the adhesive. Hence, adhesive could diffuse into the treated
surface to some extend, but according to Anand [146], even in the case of autohesion
of elastomers, which was shown as the direct experiment evidence for interdiffusion,
the contribution of diffusion to the intrinsic adhesion is minimal compared to that from
the fonnation of interfacial secondary bonds.
Therefore, the interdiffusion between the adhesive and the treated PEEK films is not
thought to be the main mechanism of bondability enhancement
12.1.4 Electronic theory
The chief proponents of this theory have been Deryaguin and his co-workers [147].
They proposed that adhesion is due to electrostatic forces, arising from the transfer of
electrons from one material of an adhesive joint to another. The controversy this
theory has caused is due to this statement that such electrostatic forces are an
important cause, rather than merely a result, of high joint strength. Kinloch [148] made
a thorough review on this theory in his book and concluded that, for typical
adhesive/substrate interfaces, any electrical double layer generated does not contribute
significantly to the intrinsic adhesion. Further, any electrical phenomena observed
during the joint fracture process probably arise from the failure event, rather than cause
the adhesion between the materials. Hence this theory is also thought irrelevant to the
present work.
12.1.5 Adsorption theory
The adsorption theory of adhesion is the most widely applicable theory and proposes
that, provided sufficiently intimate molecular contact is achieved at the interface, that
material will adhere because of the interatomic and intermolecular forces which are
established between the atoms and molecules in the surfaces of the adhesive and
substrate [149]. As both plasma and corona discharge treatment significantly improve
the wettability of PEEK and also introduce some functional groups on to the surface,
which can contribute to the enhancement of the adhesion of the treated surfaces. It is
believed that this theory is most relevant to the bondability enhancement of PEEK by
means of plasma and corona discharge treatment. A detailed study has been made on
the contributions of various surface properties to the bondability of the treated PEEK,
the results are shown in the following sections.
111

12.2 Interfacial Contact
The establishment of intimate molecular contact between adhesive and adherend
surfaces is the basic requirement for developing strong adhesive joints though
sometimes insufficient [150]. This means that the adhesive needs to be able to spread
the adherend surface and needs to displace air and other contaminants that may be
present on the surface.
An adhesive which conforms ideally to these conditions should[150]
(a) when liquid exhibit a zero or near zero contact angle
(b) at some time during the bonding operation have a viscosity that should be relatively
low, e.g. no more than a few centipoises
(c) be brought together with the substrate in a rate and manner that should assist in the
displacement of any trapped air
The adhesive employed is believed to satisfy the condition (b) and (c) as this adhesive
has been successfully used commercially and the curing condition employed was
suggested by the supplier.
In order to assess the condition (a), let us consider the wetting equilibrium of an liquid
on a solid (Young's equation), which is shown in Equation 12.1
(12.1)
When 0>00 the liquid is non spreading, but when 0=00 the liquid wets the solid
completely and spontaneously, and spreads over the surface at a rate depending on the
liquid viscosity and solid surface roughness. Thus for spontaneous wetting to occur,
the following condition must be satisfied:
(12.2)
This criterion may also be expressed by defining a parameter termed the equilibrium, spreading coefficient ALS , where [151]
(12.3)
112

Hence. a liquid will spread spontaneously and completely on a solid surface when Au
~. It is also possible of course. to make a liquid spread across a solid surface when 9
>00. but this would require the application of pressure or forces to the liquid to spread
it forcibly over the substrate [151].
Substituting Equation 7.4 into Equation 12.3 then
(12.4)
Assuming that the surface free energy of the adhesive does not change significantly
after it solidified and employing Equation 12.4. the spreading coefficient of the
adhesive on untreated and treated PEEK films can be calculated. the results are shown
in Table 12.1
As it can be seen from Table 12.1. the adhesive shown positive Au; results for the
PEEK films before and after various plasma and corona discharge treatment.
Therefore. the adhesive employed in this project can spread on both untreated and
treated surfaces and form intimate interfacial contact.
Table 12.1 Spreading coefficient of the adhesive on untreated and treated PEEK films
Sample Spreadin~ coefficient (mJm-2)
Untreated 4.0
Oxy~en plasma treated 23.5
Ammonia plasma treated 16.9
Sui fur dioxide plasma treated 16.1
Air corona treated 19.4
Ammonia corona treated 15.6
Sulfur dioxide corona treated 16.7
·Plasma treatment condition: I min, 500 W, 0.3 torr
Corona discharge treatment level: 0.4 J mm-2
(The surface free energy for the adhesive employed (curing in the air) is
'Y L =33.1 mJm-2 'Yf =11.9±2.8 mJm-2 'Y~=21.2±3.7 mJm-2 )
12.3 Interfacial Interactions
As shown in Chapter 10. XPS and TOF-SIMS analysis have found that both plasma
and corona discharge treatment introduced some functional groups onto the PEEK
113

surfaces such as hydroxyl, carboxyl, amine and etc. Those functional groups might play
dual role when the treated surfaces are fonning joints with the epoxy adhesive. One is
to change the van der Waals forces across the interface, the other is possibly forming
chemical bonds with the adhesive.
In this Chapter, the contribution of the functional groups to the van der Waals forces,
and further to the adhesion enhancement was assessed by the thermodynamic work of
adhesion (W A). while the possible formation of chemical bonds across the interface
was investigated by TOF-SIMS.
12.3.1 Thermodynamic work of adhesion
The work required to separate reversibly a unit area of the interface between two bulk
phases from their equilibrium separation to infinity is the thermodynamic work of
adhesion W A' If only considering the secondary force interactions in the interface
between the adhesive and the substrate, W A can be related to the surface and interfacial
free energies by the Dupre Equation (modified by Wake [152]), as shown in Equation
12.5
W .. =1s +1 .. -15.< (12.5)
Where the subscripts S and A represent substrate and adhesive respectively.
By using Equation 7.4 to eliminate the interfacial free energy, Equation 12.5 may be
derived as Equation 12.6
(12.6)
Employing Equation 12.6, the thermodynamic work of adhesion for PEEK
film/adhesive joints was calculated, the results are listed in Table 12.2
As shown in Table 12.2, both plasma and corona discharge treatment increase the
work of adhesion for PEEK/epoxy adhesive joints. The results imply that the van der
Waals forces across the interfaces between treated materials and adhesive are stronger
than those across the interface between untreated films and the adhesive. Hence the
chemical functional groups introduced by both plasma and corona discharge treatment
can enhance the interfacial attraction between PEEK fIlms and the adhesive.
114

Table 12.2 Thermodynamic work of adhesion for PEEK/adhesive joints
Treattnent condition· Work of adhesion (mJm-2)
Untreated
Oxygen plasma
Ammonia plasma
Sulfur dioxide plasma
Air corona
Ammonia corona
Sulfur dioxide corona
.Plasma treattnent condition: 1 min, 500 w, 0.3 torr
Corona discharge treattnent level: 0.4 J mm-2
12.3.2 TOF-SIMS analysis
12.3.2.1 Sample preparation
70.2
89.7
83.1
82.3
85.6
81.2
82.9
Untreated, oxygen plasma treated and ammonia plasma treated PEEK (labelled as
EUPK, EOPK and ENHPK respectively) after being exposed to the atmosphere for
less than 5 min, were dipped twice in 2% MY750 epoxy acetone solution, then put
into an oven for 3 hours at 120°C. Before SIMS analysis, the epoxy coated samples
were immersed in acetone for 24 hours, then rinsed five times in pure acetone, and
then hang-dry in an air circulated clean container. The idea of preparing such kind
samples is based on the following assumption: If strong interfacial attractions or
interdiffusion can occur between the epoxy resin and PEEK, then after coating PEEK
with epoxy resin, the coating will not be removed by acetone. The choose of 120°C
for 3 hour curing condition is to ensure that all the functional groups introduced by the
plasma treatment have the chance to react with the epoxy resin.
12.3.2.2 Characteristic signals of epoxy resin[153]
115
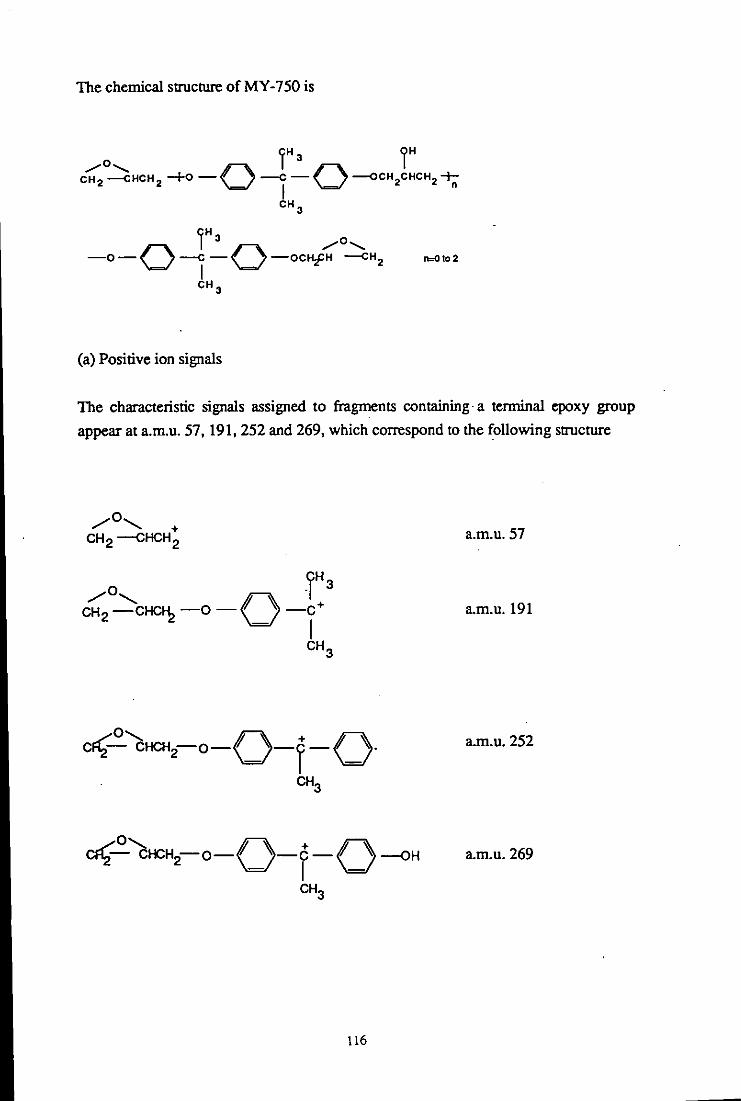
The chemical structure of MY-750 is
(a) Positive ion signals
The characteristic signals assigned to fragments containing a tenninal epoxy group
appear at a.m.u. 57,191,252 and 269, which correspond to the following structure
a.m.u.57
a.m.u. 191
Cfl£°'cHCH2-O-( )-r-( )- a.m.u.252
CH3
a.m.u.269
116

The positive ion signals specifically diagnostic of the bisphenol-A component show at
am.u. 135 and 213 corresponding to structures
f3 HO-O-( 3
HO-O' -c-O' -OH - I -CH 3
a.m.u.135
a.m.u.213
As untreated PEEK also show peaks at a.ID.U. 57 and 213, the characteristic positive
signals of epoxy resin in this work appear at a.m.u. 135, 191,252 and 269.
(b) Negative ion signals
The signal characterising the fragment containing the epoxy group at a.ID. u. 283
correspond to the structure
yH 3
/0, 0 1 0 CH --CHCH -0- f "' -C- f '-0-2 2 _ I - am.u.283
CH3
while the signal at am.u. 71 (assigned to O=CH-CH=CH-O-) is thought to be one of
the characteristic of the tenninal epoxy group.
The characteristic signals of the bisphenol-A part of the molecule appear at a.m.u. 93,
117, 133 and 211 corresponding to the structures
117

a.m.u.93
CH C-( )-0- am.u.1l7
a.m.u.133
0= < )=1-( )-0-a.m.u.211
CH3
However, the signals at a.m.u. 71, 93 and 211 also can appear in the PEEK spectra,
therefore, the characteristic negative signals of epoxy resin in our case are those at
a.m.u. 117, 133 and 283.
12.3.2.3 EUPK
In both positive and negative ion spectra of EUPK (Fig. 12.1 and Fig. 12.2), cannot be
found any characteristic signals for the epoxy resin, suggesting that the epoxy resin
coating can be thoroughly removed by acetone. The results indicate that there is no
strong interfacial artractions or interdiffusion between untreated PEEK and the MY-
750 epoxy resin.
118

30
25
~
~ 20 c ~
o u
'"
15
10
5
o o
'I
.
If ,
~ I
20
11 ,
3" Il'
n I
r7 f
il ,
6 1' .' 40 50 80
Atomic Mass Units
~","
a·f I ,,,:i"" l'i~fv~A~IU,J\'jI\
240 260 Atomic Mass Units
260
Fig, 12,1 Positive ion spectrum of EUPK
800 n ,.t
I 500r
, a) f ~
~
c 400 ~
0
10C
L,~~ 11
~~~II ,.
1,','
U
200 I- III I
100 200 " 140 Units 120 Atomic Mass
300
119
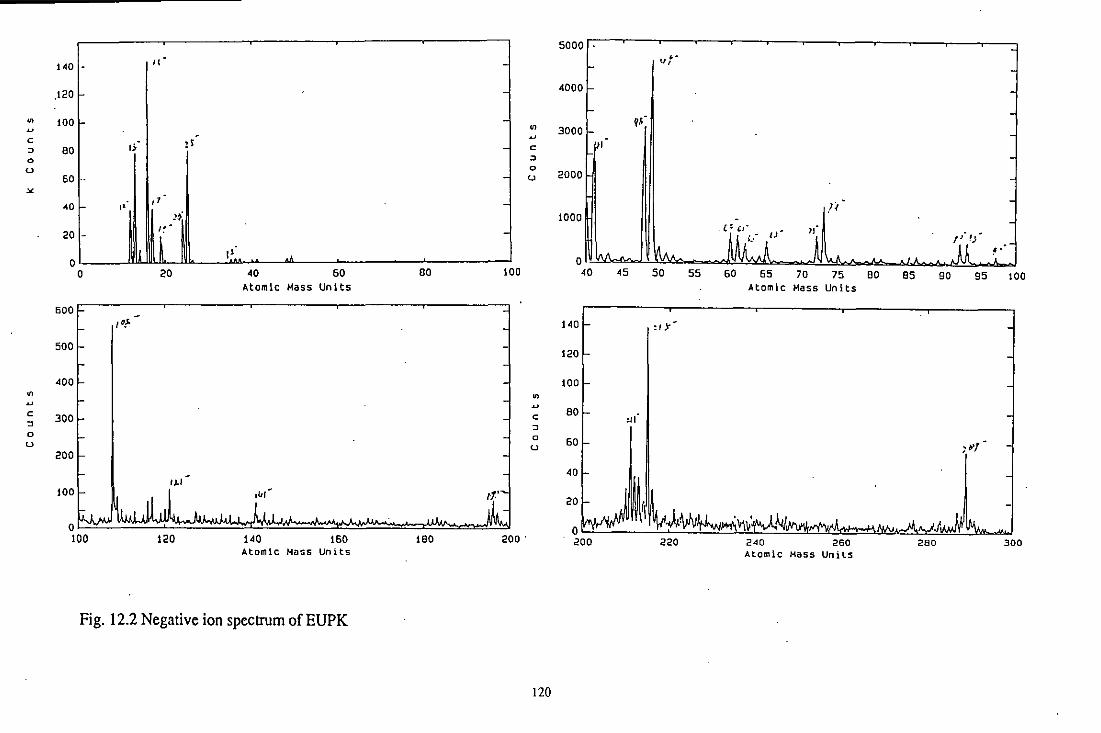
5000 .
1<01- I" -j rr 4000
.120
~ 100 .. q, 3000
~ c - ,I r' ~ 80 ,; c ! 11 0 ~
u 0 2000 60 u
~
,oo:ijLt 40 "
"
,L~ . ,0:; 't' ~ -201- JMj" IJ" !) J1 ,. -I' . u. 0' ..... L .. A-
0 20 40 60 BO 100 40 45 50 55 60 65 70 75 BO 85 90 95 lOO Atomic Mass Units Atomic Mass Units
500F I D!- 140 I I"~
500 120
400 100 ~ .. ~
~
801
c 300 c !II ~
~ 0 0
60 r-u u ,~,
200
40 ,., 100 I- I ,", - tt' I 20
120 140 160 180 200 . 0 200 220 240 260 280 300
Atomic Mass Units Atomic Mass Units
Fig. 12.2 Negative ion spectrum of EUPK
120
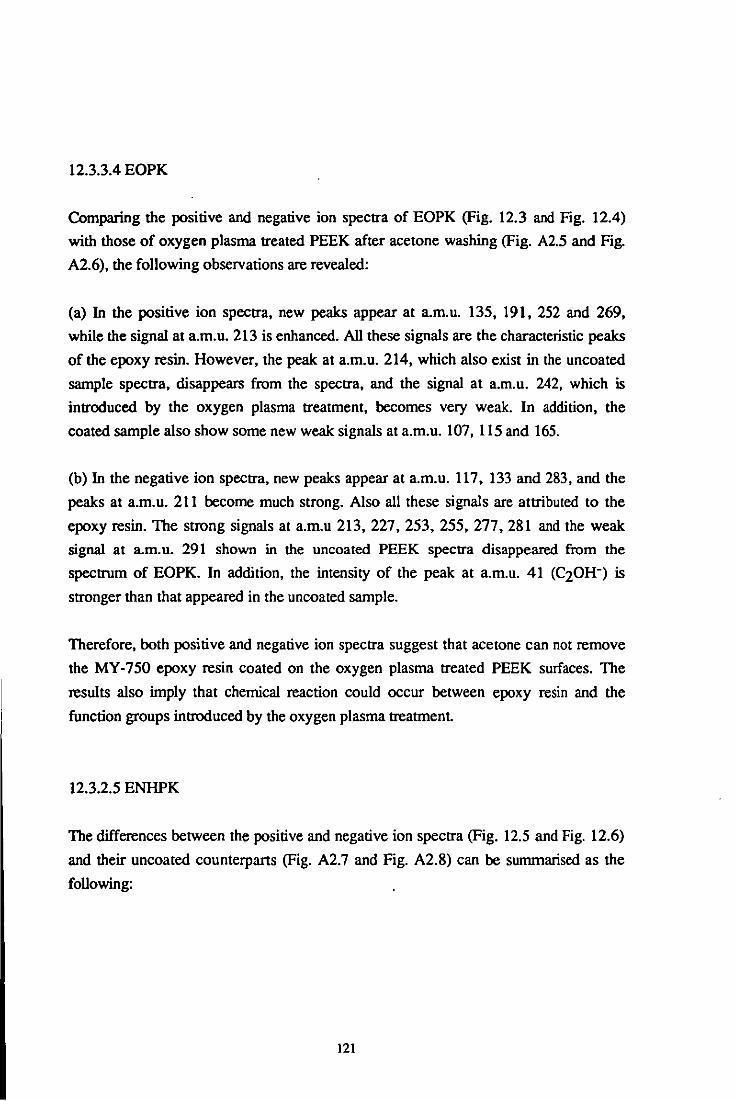
12.3.3.4 EOPK
Comparing the positive and negative ion spectra of EOPK (Fig. 12.3 and Fig. 12.4)
with those of oxygen plasma treated PEEK after acetone washing (Fig. A2.5 and Fig.
A2.6), the following observations are revealed:
(a) In the positive ion spectra, new peaks appear at a.m.u. 135, 191, 252 and 269,
while the signal at a.m.u. 213 is enhanced. All these signals are the characteristic peaks
of the epoxy resin. However, the peak at a.m.u. 214, which also exist in the uncoated
sample spectra, disappears from the spectra, and the signal at a.m.u. 242, which is
introduced by the oxygen plasma treatment, becomes very weak. In addition, the
coated sample also show some new weak signals at a.m.u. 107, 115 and 165.
(b) In the negative ion spectra, new peaks appear at a.m.u. 117, 133 and 283, and the
peaks at a.m.u. 211 become much strong. Also all these signals are attributed to the
epoxy resin. The strong signals at a.m.u 213, 227, 253, 255, 277, 281 and the weak
signal at a.m. u. 291 shown in the uncoated PEEK spectra disappeared from the
spectrum of EOPK. In addition, the intensity of the peak at a.m.u. 41 (C20H-) is
stronger than that appeared in the uncoated sample.
Therefore, both positive and negative ion spectra suggest that acetone can not remove
the MY-750 epoxy resin coated on the oxygen plasma treated PEEK surfaces. The
results also imply that chemical reaction could occur between epoxy resin and the
function groups introduced by the oxygen plasma treatment
12.3.2.5 ENHPK
The differences between the positive and negative ion spectra (Fig. 12.5 and Fig. 12.6)
and their uncoated counterparts (Fig. A2.7 and Fig. A2.8) can be summarised as the
following:
121

35
30
25,-
'" ~ c 20 ~
0
u 15
'" 10
5
0 0
r 120
100
80 u. ~
C
~ 60 0
u 40
20
,r
..
20
'1t~1'
. , '
,,'
• "" --0/-C ,,©-O" , "'3
220
~,
~J
;C.Ih</ /0, •
tf' 0\,.- U~2 N'
40
, ';\
.51-~
60 Atomic Mass Units
...... 0, ...
CHI -ot~LO-@-cr-@'
%l.' "!>
2·0 260 Atomic ~ass Units
•••
80
~ 0,
Ott-O .. c.t10-@-f·-o-°" "".
1{A'
280
Fig. 12.3 Positive ion spectrum of EOPK
2400 1/" •
I 2000
';"J 1600 t\O-@-c· fIr'
, '" . 1'~ ... CJ.l~
~ "I C 1200
.1 I ~ . 0
" I u ,,, 800
AI •
140 160 120 100 Atomic Mass Units
180 t 200
300
122

2' '[
200
~ 160
c ,. :J lc~ .J r o u
'" 80
~
~
c :> 0
u
'0 1-
,. o
c
400,-
300·-
200
100
.' (' '>
I ~ ~
~
c :> -,)" 0
u
:.1
" li.u Ju.,..J.
,.,
~
~
c ~
0 u
120 1'0 160 180 200 AtomiC Mass Units
Fig. 12.4 Negative ion spectrum of EOPK
BOOO~ "'
6000 ~!-
.OOOH q3
2000 III
0UlU.1 .(, .5
,) - <:Jto
l~oo ., .,Lo q,,-
oMAAJ" f)
• , .,oM 50 55 60 65 70 75 80 85 90 95 100
Atomic Mass Units
500 I- · :>'11
'Ol OVC-l(j)-O-, -
c..u
300 ·
201) 1-
· 100 ,H
J.J~ 0r= ~. M wlw j 200 220 2'0 260 280 300
Atomic Mass Units
123
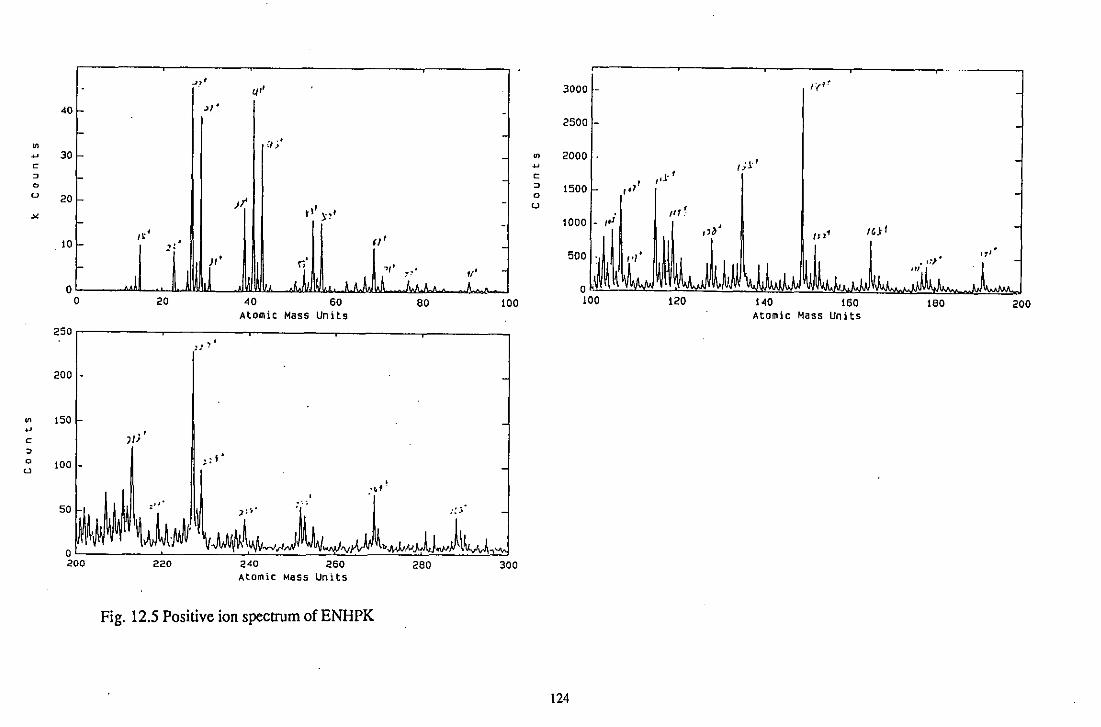
'" ~ c ~
o U
'"
'" ~ c ~
0
u
40
30
20
. 10
o o
250
200 I.
150
100
50
Jl t
~/'
,,:4 2:
,
),'
20
, .
!: f •
220
q"
'/ ;'
)I' , t 1 ~n'
n'
40 60 Atomic Mass Units
240 260 Atomic Mass Units
0'
,,'
• :" ~ .
Fig. 12.5 Positive ion spectrum of ENHPK
.,.~ 1/'
80
::3
280
100
300
'" ~ c ~
o U
3000 l_ '(' ~
2500·-
2000
,.1' ,d· ,
1500
,;.1"
':::i\ ,,' r "i'[ O~~\ I~M
/Jl1 10 1
100 120 140 160 180 200 Atomic Mass Units
124

160 I- - . I; ~ "i 4000 I vI"
" I- I
30001-
~,
120
~ I V~ ,I" ~
c u
" ,/I
C
0 80 " 2000 r III /5" u 0 ,j' u
" I 40 1000
I~IIIIIII, IIII! ! ;,.~
f- .•• I ! :~
-e~
0 0 0 20 40 60 80 100 40 45 50 55 60 65 70 75 80 85 90 .5 100
Atomic Mass UniLS Atomic Mass Units
III ] 5°l .-:11 uJ
250 I- I
400
""f j ~ . ,:, ~
u .,' u 300 c 150 ,.,
I c
" I "l /;1 ,~J' " 0 I I ,1(1 "
0 u , ",/ I U 200
J 1/" .. , ,J
100 -:, .. :
: ... /
120 140 150 180 200 220 240 260 280 300 , Atomic Mass Units Atomic M~ss Units
Fig. 12.6 Negative ion spectrum of ENHPK
125

(a) Many new peaks appear in the positive ion spectra of ENHPK. Some of these new
peaks are the characteristic signals of the epoxy coating, i.e. signals at am.u. 135, 191,
213,252 and 269. Other new strong signals appear at am.u. 107, 115, 165 and 227,
while some new weak signals appear at am.u. 119, 128, 152, 177, 178,229 and 288.
However, the strong signal at a.m.U. 219 for uncoated sample are not present. The
new signals could be attributed to chemical reactions between the epoxy resin and the
nitrogen or oxygen containing groups introduced by the ammonia plasma treatment,
but it is not possible to work out the details of these reactions.
(b) Also some new peaks appeared in the negative spectra of ENHPK, i.e. signals at
a.m.u. 48, 73, 93, 117, 133, 195, 211 and 283. Among these new peaks, those at
a.m.u. 93, 117, 133, 211 and 283 are the characteristic signals of the epoxy resin,
while the peaks at a.m.u. 48, 73, 195 could be due to the chemical reactions between
epoxy and nitrogen or oxygen containing function groups.
The signals represent the nitrogen containing groups in the low mass region became
much weak, these peaks are at a.m.u. 15 (NH-), 26 (CN-) and 42 (CNO-). These
results also suggest that chemical reactions have occurred between these groups and
the epoxy groups. In addition, the signal at a.m.u. 66, 79,81 and 203 disappeared from
the spectrum, and the signals at a.m.u. 115, 121, 131, 241 and 255 became much
weak, but signal at a.m.u. 49 became much stronger.
Summarising the TOF-SIMS results and discussions it is believed that the functional
groups introduced by the plasma treatment can fonn strong interfacial attractions with
their counterparts of the epoxy adhesive, possibly forming some chemical bonds.
12.4 Role of Low Molecular Weight Molecules
As discussed in Chapter 10 and Chapter 11, both plasma and corona discharge
treatment produce some LMWM on the treated PEEK surfaces, which are highly
oxidised or nitrogenated. These small molecules may have several effects in the
fonnation of joints, i.e.
(a) Weak boundary layer
Assuming plasma and corona discharge treatment produce large amount of low
molecular weight molecules on the treated surfaces, WBL will be formed on the
treated surface, and then plasma and corona treatment could not significantly enhance
126

the joint strength of PEEK materials. Since the results shown in chapter 8 suggest the
opposite treatment effects, the LMWM small molecules produced by the treatment is
believed not forming WBL on the treated surfaces.
(b) Primer (or coupling agent)
As the LMWM produced by the treatment contains some functional groups, like -OH,
-COOH and etc., which could react directly or indirectly with the epoxy group, it can
play the role similar to that of the primer or coupling agent, thereby enhancing the
adhesive joint strength of the treated materials.
(c) Dissolving in the adhesive
During the adhesive joint forming process, the LMWM produced by the treatment
could dissolve into the adhesive. However, as the concentration of these small
molecules is very low, the effect of their dissolution in the adhesive on the mechanical
properties of the adhesive is thought to be negligible.
Before investigating the effects of solvents, it is necessary to know the mass uptake of
the solvents used on the treated surfaces.
12.4.1 Mass uptake of solvents by plasma and corona discharge treated PEEK surfaces
PEEK does not adsorb ordinary solvents, like acetone and water. Cogswell and
Hopprich [154] have found no changes in weight when immersing APC-l(a PEEK
composites) in acetone for 7 days at 23°C. Also very little effect of moisture on the
properties of PEEK was seen [154-157]. Less than 0.1% weight gain was detected
when PEEK films were either immersed in deionized water at 20 and 70°C[155] or
conditioned in air at about 70% RH for 7 days[156].
However, as both plasma and corona discharge treatment change the surface
properties of PEEK, solvent washing could affect the weight of treated materials.
Table 12.3 listed the results of mass uptake of the solvents employed in this work on
the plasma and corona discharge treated films. The results reponed are the percentage
absorption of treated films after 10 min immersion in the solvents.
Although the results are highly scattered, it is clear that very small amount of LMWM
were present on the treated surfaces.
127
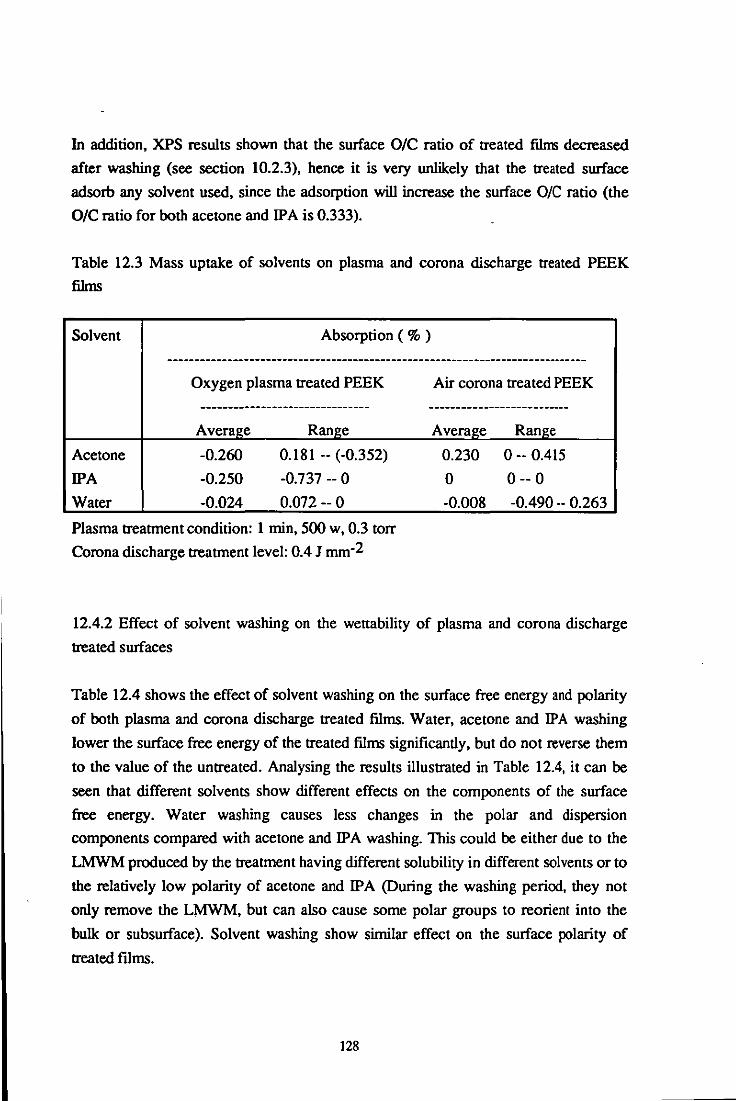
In addition, XPS results shown that the surface O/C ratio of treated films decreased
after washing (see section 10.2.3), hence it is very unlikely that the treated surface
adsorb any solvent used, since the adsorption will increase the surface ole ratio (the
O/C ratio for both acetone and IPA is 0.333).
Table 12.3 Mass uptake of solvents on plasma and corona discharge treated PEEK
films
Solvent Absorption ( % )
-----------------------------------------------------------------------------Oxygen plasma treated PEEK
-------.-----------------------Averal!;e Ranl!;e
Acetone -0.260 0.181 -- (-0.352)
IPA -0.250 -0.737 -- 0
Water -0.024 0.072 -- 0
Plasma treatment condition: 1 min, 500 w, 0.3 torr
Corona discharge treatment level: 0.4 J mm-2
Air corona treated PEEK
----------.---------------Average Ranl!;e
0.230 0-- 0.415
0 0-- 0
-0.008 -0.490 .- 0.263
12.4.2 Effect of solvent washing on the wettability of plasma and corona discharge
treated surfaces
Table 12.4 shows the effect of solvent washing on the surface free energy and polarity
of both plasma and corona discharge treated films. Water, acetone and IPA washing
lower the surface free energy of the treated films significantly, but do not reverse them
to the value of the untreated. Analysing the results illustrated in Table 12.4, it can be
seen that different solvents show different effects on the components of the surface
free energy. Water washing causes less changes in the polar and dispersion
components compared with acetone and IPA washing. This could be either due to the
LMWM produced by the treatment having different solubility in different solvents or to
the relatively low polarity of acetone and IPA (During the washing period, they not
only remove the LMWM, but can also cause some polar groups to reorient into the
bulk or subsurface). Solvent washing show similar effect on the surface polarity of
treated films.
128
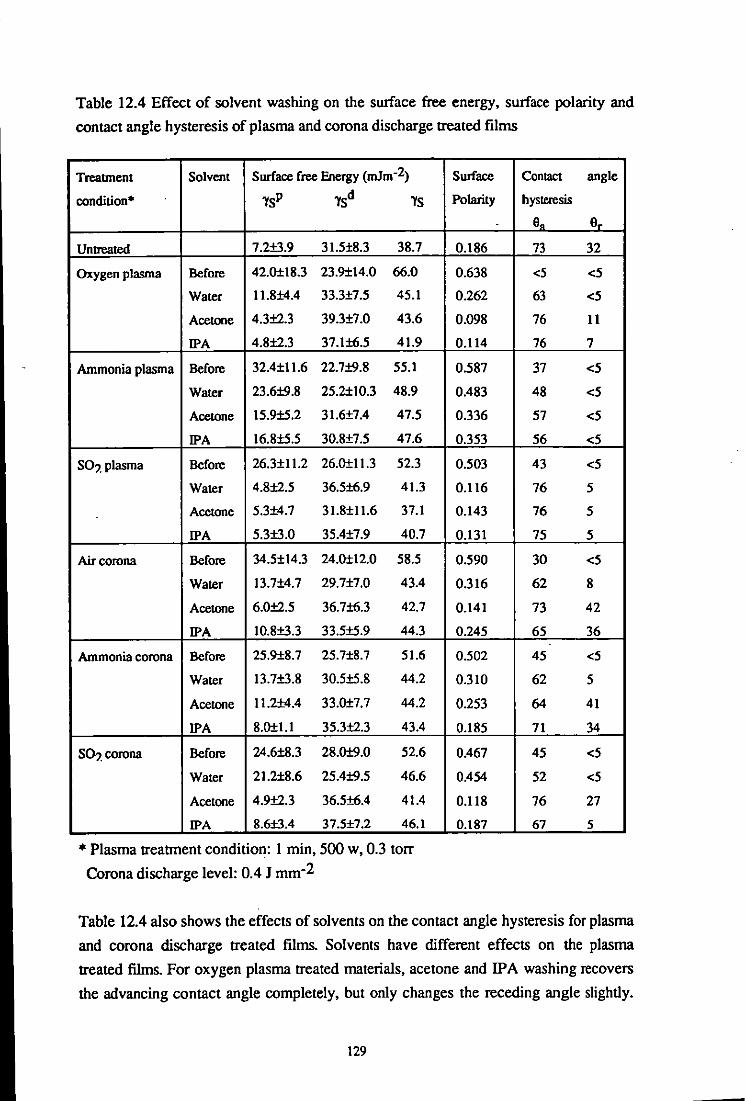
Table 12.4 Effect of solvent washing on the surface free energy, surface polarity and
contact angle hysteresis of plasma and corona discharge treated films
Treaunenl Solvent Surface free Energy (mJm-2)
condition· "tSP "tSd "tS
Untreated 7.2±3.9 31.5±8.3 38.7
Oxygen plasma Before 42.0±18.3 23.9±14.0 66.0
Water 11.8±4.4 33.3±7.5 45.1
Acetone 4.3±2.3 39.3±7.0 43.6
IPA 4.8±2.3 37.1±6.5 41.9
Ammonia plasma Before 32.4±11.6 22.7±9.8 55.1
Water 23.6±9.8 25.2±10.3 48.9
AcelOne 15.9±5.2 31.6±7.4 47.5
IPA 16.8±5.5 30.8±7.5 47.6
so?plasma Before 26.3±11.2 26.0±11.3 52.3
Water 4.8±2.5 36.5±6.9 41.3
AcelOne 5.3±4.7 3 1.8±1 1.6 37.1
IPA 5.3±3.0 35.4±7.9 40.7
Air corona Before 34.5±14.3 24.0±12.0 58.5
Waler 13.7±4.7 29.7±7.0 43.4
AcelOne 6.00.5 36.7±6.3 42.7
IPA 1O.8±3.3 33.5±5.9 44.3
Ammonia corona Before 25.9±8.7 25.7±8.7 51.6
Water I3.7±3.8 30.5±5.8 44.2
AcelOne 11.2±4.4 33.0±7.7 44.2
IPA 8.0±1.I 35.3±2.3 43.4
SO, corona Before 24.6±8.3 28.00.0 52.6
Water 21.2±8.6 25.4±9.5 46.6
Acetone 4.9±2.3 36.5±6.4 41.4
IPA 8.6±3.4 37.5±7.2 46.1
* Plasma treatment condition: 1 min, 500 w, 0.3 torr
Corona discharge level: 0.4 J mm-2
Surface ConlaCl angle
Polarity hysteresis
e. er 0.186 73 32
0.638 <5 <5
0.262 63 <5
0.098 76 11
0.114 76 7
0587 37 <5
0.483 48 <5
0.336 57 <5
0.353 56 <5
0.503 43 <5
0.116 76 5
0.143 76 5
0.131 75 5
0.590 30 <5
0.316 62 8
0.141 73 42
0.245 65 36
0.502 45 <5
0.310 62 5
0.253 64 41
0.185 71 34
0.467 45 <5
0.454 52 <5
0.118 76 27
0.187 67 5
Table 12.4 also shows the effects of solvents on the contact angle hysteresis for plasma
and corona discharge treated films. Solvents have different effects on the plasma
treated films. For oxygen plasma treated materials, acetone and IPA washing recovers
the advancing contact angle completely, but only changes the receding angle slightly.
129

Water washing, on the other hand, increases the advancing angle significantly (though
not fully back to that of the untreated sample), and does not affect the receding angle.
For ammonia and sulfur dioxide plasma treated films, water, acetone and IPA washing
only changes the advancing contact angle to some extent, but does not affect the
receding contact angle. Nevertheless, solvents have the same effects on all gas corona
discharge treated samples. After acetone and IPA washing, the values of the advancing
and receding contact angles of water became approximately the same as those of the
untreated PEEK surface, suggesting that acetone and IPA washing recovers the
topmost layer of the treated surface back to that of the untreated surface. However,
water washing only affects the advancing contact angle of the corona treated surfaces,
which also implies that water washing removes only the LMWM, but does not cause
the reorientation of the polar groups away from the surface to the bulk.
The different changes in surface properties caused by solvent washing for different
condition treated films are believed to be due to the fact that different treatment
conditions produce different molecule size and different amount of LMWM on the
PEEK surface.
Table 12.5 Effect of water immersion on the surface free energy, surface polarity and
contact angle hysteresis of acetone washed oxygen plasma treated materials
Water Immersion Temperature Surface free Energy (mJm-2) Surface
(1 hour) ( °C ) 'YSP 'YSd 'YS Polarity
Before RT 4.3±2.3 39.3+7.0 43.6 0.098
Moor RT 12.l±4.0 33.0±6.6 45.1 0.269
100°C 19.3±7.3 28A±8.9 47.7 00405
* Oxygen plasma treatment condition: 1 min, 500 w, 0.3 torr
Acetone dipping five times
Contact angle
hysteresis
9. 9r
76 11
63 <5
53 <5
Owing to its high polarity, water could recover the reorientation process in the acetone
washing period if it occurred. Table 12.5 gives the results of water immersion on the
surface properties of acetone washed oxygen plasma treated materials. The results
show that water do recover the surface free energy, surface polarity and contact angle
hysteresis to some extent. Increasing temperature facilitates this recovering process,
hence confirming that surface reorientation do occur during the washing period.
130

12.4.3 Effect of solvent washing on the bondability of plasma and corona discharge
treated materials
Table 12.6 shows the effect of solvent washing on the lap shear joint strength of
plasma and corona treated films. Acetone and IPA washing does not appear to have
much effect on the shear joint strengths of plasma and corona treated films, indicating
that LMWM on the treated sutfaces do not play a very important role on the
bondability of treated materials. However, acetone and IPA washing lowers slightly the
T-peel joint strengths of oxygen plasma treated samples, but not that for the ammonia
plasma treatments (as shown in Table 12.7).
Table 12.6 Effect of solvent washing on the lap shear joint strength of plasma and
corona discharge treated films
Treatment condition Solvent Lapshearstren2th(~a)
Untreated 16.9±1.3
Oxygen plasma Before 34.0±1.4·
Acetone 33.8±1.4
IPA 35.8±O.5
Ammonia plasma Before 32.2±2.1
Acetone 32.3±1.6
IPA 33.7±1.7
Sulfur dioxide plasma Before 32.8±O.9
Acetone 31.7±O.5
IPA 31.9±0.5
Air corona Before 28.5±1.8
Acetone 28.2±2.4
IPA 29.6±O.9
Ammonia corona Before 28.0±0.7
Acetone 31.1±1.2
IPA 28.3+1.5
Sulfur dioxide corona Before 31.9±1.2
Acetone 31.1±O.7
* Plasma treatment condition: I min, 500 w, 0.3 torr
Corona discharge level: 0.4 J mm-2
131
Failure locus
I+C
C+M
C+M
C+M
C+M
C+M
C+M
C+M
C+M
C+M
C+M
C+M
C+M
C+M
C+M
C+M
C+M
C+M

Table 12.7 Effect of solvent washing on the T-peel joint strength of plasma treated
films
Treabnent condition Solvent T-peel strength (N/mm) Failure locus
Untreated 0 I
Oxygen plasma Before 4.64±O.02 C+M
Acetone 3.12±O.18 C
IPA 3.76±O.14 C
Ammonia plasma Before 4.05±O.11 C
Acetone 3.99±O.16 C
IPA 3.95±O.27 C
• Plasma treabnent condition: 1 min, 500 w, 0.3 torr
132

CHAPTER 13 SURFACE DYNAMICS AND ADHESION
As discussed in Chapter 11, the plasma and corona discharge treated surfaces can be
modelled as a modified layer consisting of various size molecules with some functional
groups introduced by the treatment. Since the chemical composition of this modified
layer is different with the bulk of PEEK films, the treated surfaces are in a
thermodynamically unstable state. For other polymers, it has been found that the
plasma treated surfaces are not stable[l58-l641, i.e. the improved surface propenies
tend to change with the time and temperature. However, for PEEK, it is not known
whether the treated surfaces are stable are not.
In this work, the surface dynamics of the treated surfaces in atmosphere, hot or humid
environment were investigated. The results of three months atmospheric exposure,
heat treatment and water immersion are reported.
13.1 Theoretical Analysis
Because the properties of the modified layer are different from those of the bulk
material, the modified layer has two interfaces (or interphases) with its surroundings,
one is between the modified layer and the bulk material, the other is between the
treated surface and its environment, like air, solvent etc. The composition and
structure of this layer tend to change to minimise its interfacial tension.
In the interface between the treated surface and its environment, the modified layer will
restructure according to the environment to lower the interfacial tension. In the polar
environment, the molecules modified by the treatment will stay in the surface because
they have higher polarity than the bulk molecules, in addition, the polar groups will
reorient to the surface to minimise the interfacial tension. In the non-polar
environment, the molecules modified by the treatment tend to migrate away from the
surface while the molecules with low polarity tend to move to the top surface. In
addition the polar groups will reorient away the surface.
In the interface (or interphase) between the modified layer and the bulk, in order to
lower the interfacial tension, the molecules produced by the treatment tend to migrate
133

into the bulk. Among them the LMWM might migrate rapidly and cost less energy,
while the HMWM are expected to diffuse very slowly and needs more energy. At the
same time, the PEEK molecules have a tendency to migrate to the surface layer, but
because of the high T g of PEEK, this migration would take place at an extremely low
rate and may not occur at all.
In the above restructuring processes, the polar groups in the molecules, like hydroxyl,
carboxyl, amine, and etc. could form internal hydrogen bonds, hence hinder the further
migration of the molecules and the orientation of the polar groups, and stabilise the
composition and structure of the modified layer.
13.2 Atmospheric Exposure
Treated films were exposed to the laboratory atmosphere and tested at different time
intervals. The results of wettability and bondability studies are reported here.
13.2.1 Surface free energy
Fig. 13.1 shows the effects of atmospheric exposure on the surface free energy and its
components for ammonia plasma treated materials. Several noteworthy features are
apparent, namely:
Firstly, the polar component value decreased in the first two months' exposure, then
reached a value approximately equal to that of the untreated film, and remained more
or less unchanged after longer exposure (The equilibrium value is similar to that of the
untreated film (7.2 mJm-2)).
Secondly, the value of the dispersion component show a different trend, it changed
little in the exposure period.
Thirdly, the total surface free energy of the ammonia treated material also decreased
with the time of exposure. After two months, it reached an equilibrium value and
remained unchanged thereafter. This value is slightly lower than that of the untreated
f1lm (38.7 mJm-2).
134
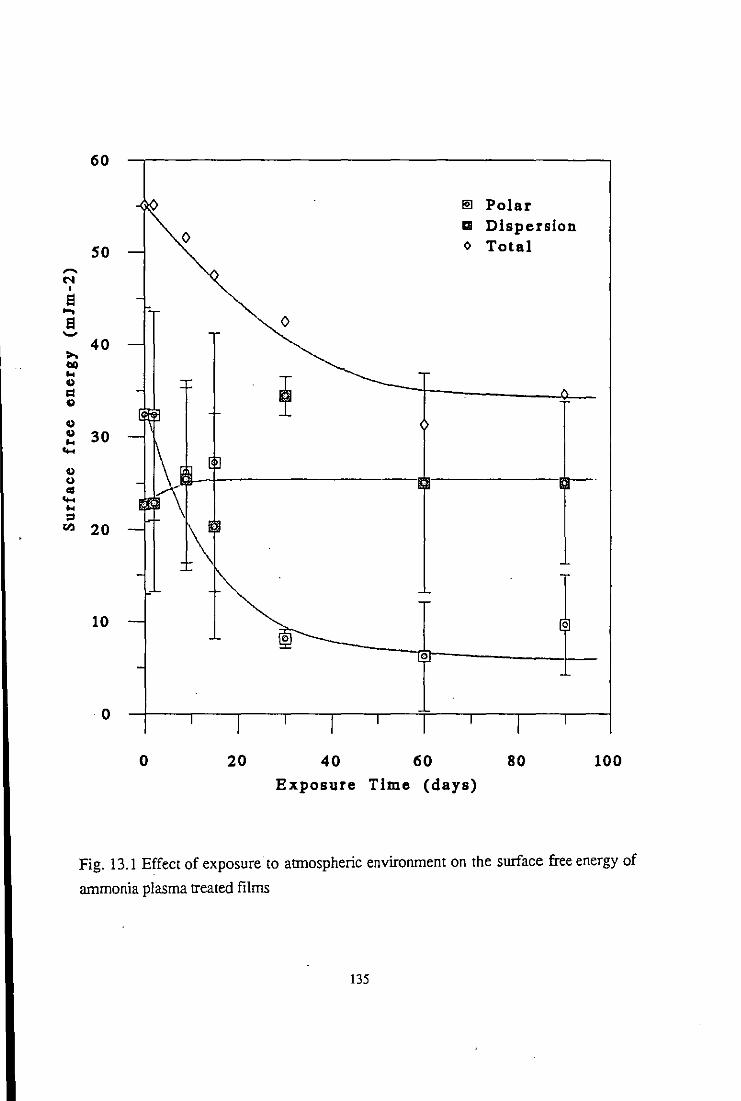
,... N
I
El ... El '-"
;.., co .. C)
c:I C)
C) C) .. ..... C) U III ..... .. ;s
r.f.I
60
I1!l Polar
0 El Dispersion
SO 0 Total
0
40
30
20
10 o o
o
o
o 20 40 60 80 100
Exposure Time (days)
Fig. 13.1 Effect of exposure· to atmospheric environment on the surface free energy of
ammonia plasma treated films
135

60
...... N SO , a ..... a '-'
>. bO 40 .. C)
c:l C)
C) C) .. .....
30 C)
<> as ..... .. ::I
foil
20
10
o
o
----
o
20 40
@] Polar III Dispersion o Total
------._--
o
60 80
Exposure Time (days)
100
Fig. 13.2 Effect of exposure to atmospheric environment on the surface free energy of
air corona discharge treated films
136

,.... N , El .... El '-'
60
so
40 >. /00 .. .. = .. .. .. 30 .. ... .. U III ... ... ~ 20
10
o
\,
o
\ \ \
20
@) Polar II:!I Dispersion o Total
0 _____
Q.<>------'---~ ---,-
40 60 80
Exposure Time (days) 100
Fig. 13.3 Effect of exposure to atmospheric environment on the surface free energy of
ammonia corona discharge treated films
137

Exposure to the atmospheric environment showed a similar effects on the surface free
energy and its components for air corona and ammonia corona discharge treated
materials, as shown in Fig. 13.2 and Fig. 13.3. However, the value of the dispersion
component increased very quickly in the early exposure period, and then changed little
at longer exposure. The plateau value is similar to that of the untreated (31.5 mJm-2).
In addition, the equilibrium value of the total surface free energy after exposure is
slightly higher than that of the untreated.
Hence, the results imply that the surface layer characterised by contact angle
measurement (less than 10 nm[25]) of treated films has changed during the exposing
period. The results also show that the decrease of the surface energy is mainly caused
by the decrease of its polar components. The next section will show the effects of
atmospheric exposure on the surface polarity of treated materials.
13.1.2 Surface polarity
The surface polarity of both plasma and corona discharge treated films significantly
decreased in the first two months exposure period, then remained constant with a value
similar to that of the untreated films, as shown in Fig. 13.4 -13.6.
Therefore the surface polarity results suggest that most of the polar groups introduced
by the treatment disappear from the surface layer characterised by contact angle
measurement after more than two months atmospheric exposure.
13.1. 3 Contact angle hysteresis
With respect to contact angle hysteresis, the results are very intriguing. Atmospheric
exposure tended to increase the hysteresis, i.e. the advancing contact angle of water
for both plasma and corona treated PEEK increased very quickly in the early exposure
period then reached their equilibrium values and remained unchanged, as shown in Fig.
13.7. For air corona, ammonia corona and plasma treated samples, those values are
about the same as the advancing contact angle of water for untreated PEEK (about 73°
), while for oxygen plasma treated films the equilibrium value is more than 20° lower
than that of untreated film. In addition, the rate to reach their equilibrium is also
different, the trend being: oxygen plasma> ammonia plasma> air corona = ammonia
corona. Nevertheless, the receding contact angle did not change with the exposure
time (as shown in Fig. 13.8). Comparing these values with the receding contact angle
of water for untreated sample, it is found that these values (about 5°) are much lower
138

0.8
-
0.7 -
-
0.6 ~ ~ @] >. ... --.. '" @] - O.S -0
"" 0) -u
'" .... -.. 0.4 ::I
'" -
0.3 -@]
-
0.2 - I2l I2l
-
0.1 I I I I I I I I I
0 20 40 60 80 100
Exposure Time (days)
Fig. 13.4 Effect of exposure to atmospheric environment on the surface polarity of
ammonia plasma treated films
139
I
~

>. ... -.. os -o
0.6
O.s
Po. 0.4
0.3
0.2
0.1
Q
o 20 40 60 80 100
Exposure Time (days)
Fig. 13.5 Effect of exposure to atmospheric environment on the surface polarity of air
corona discharge films
140
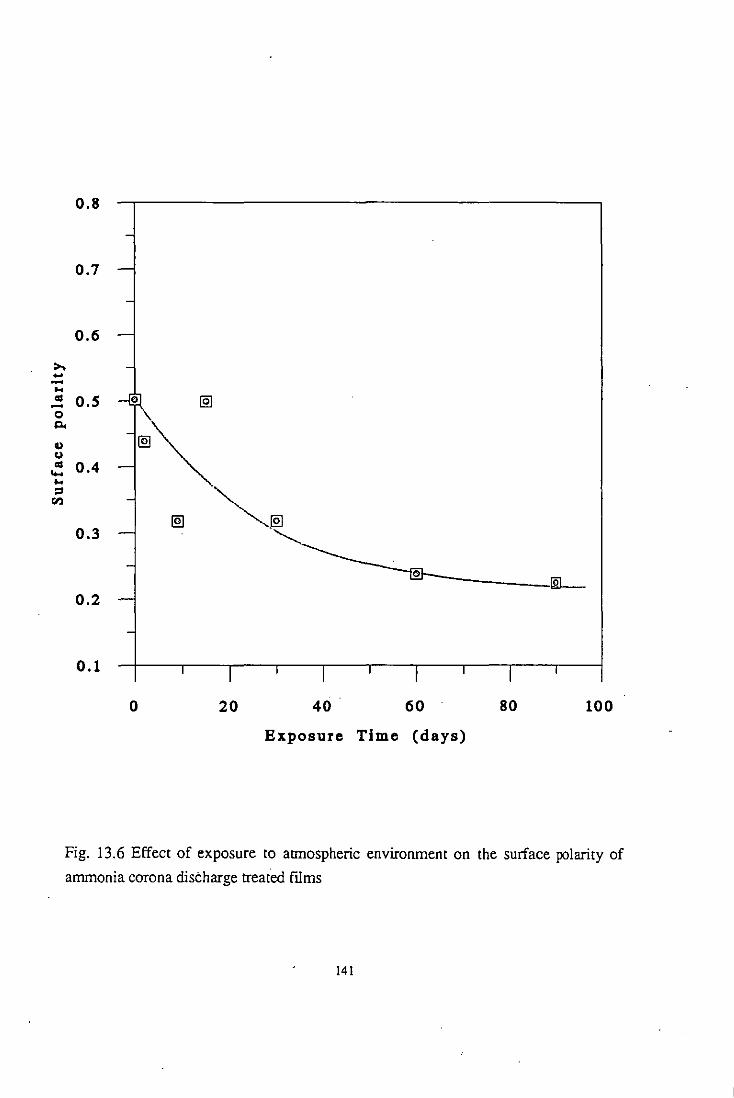
0.8
0.7
0.6
>. .. -.. as O.S 0 @] -0
"" @~ u u as 0.4 ... .. ='
~.@] rIl
@] 0.3
" lID--0.2
0.1
o 20 40 60 80 100
Exposure Time (days)
Fig. 13.6 Effect of exposure to aunospheric environment on the surface jXllarity of
ammonia corona discharge treated fIlms
141

Pluma treated fllma Corona discharge treated film.
80 80 a
11-
70 -l r -1 @) /
70 ." ... -" .... _._-I ....... @) / -.- a-,/ a··-
·r ---60
~ ~
u u
~ u :;, ..
u 60
u
" " ~ ~
u 50 @) u .. - @) ..
• • • • .----' .. .. @) • • -;; 50 U 40
• • @ • • > > " " -< -<
30 l 'F' a
40
20
'" Oxygen plasma a Ammonia plasma
~ "' Air corODa 30 a Ammonia corODa
10
o 20
o 20 40 60 80 100 o 20 40 60 80 100 Exposure TIme (daya) Exposure Time (days)
Fig. 13.7 Effect of exposure to atmospheric environment on the advancing contact angle of plasma and corona discharge treated films
142

9 PllUm. troated fllmll
8 Corona discharge treated film.
Ii1 Air corona BD Oxygcn pluma a Ammonia corona a Ammonb plasma
8 a
~
u u · .. u
~
~ 7 -la a a a u u • .. u .., ~
u 7 ..
" • u .. " • ..
" .. " ..,
• ~,
'"
.., 6 -I a u u u
'" 6 a
a @]
@]
5 -ia~ a @]
5 ~@] !IQ @] @]
4 T 4 '-T
0 20 40 60 80 100 0 20 40 60 .0 100 Exposure Time (days) Exposure TIme (days)
Fig. 13.8 Effect of exposure to atmospheric environment on the receding contact angle of plasma and corona discharge treated films
143
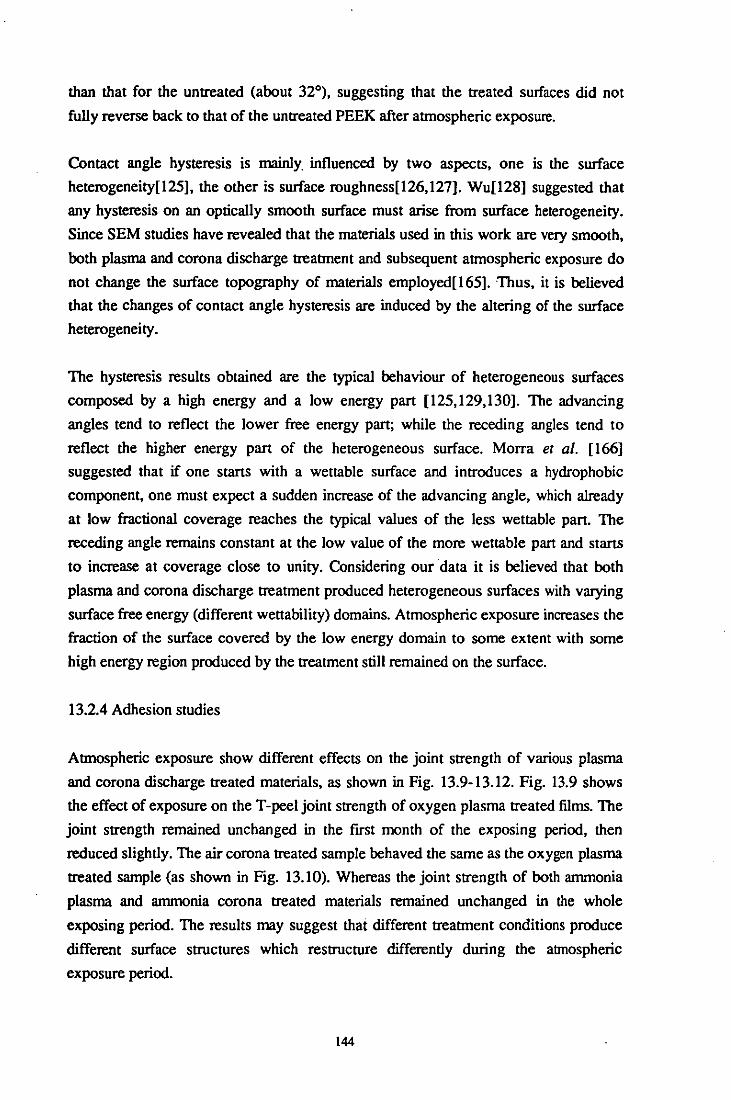
than that for the untreated (about 32°), suggesting that the treated surfaces did not
fully reverse back to that of the untreated PEEK after atmospheric exposure.
Contact angle hysteresis is mainly influenced by two aspects, one is the surface
heterogeneity[125], the other is surface roughness[126,127]. Wu[128] suggested that
any hysteresis on an optically smooth surface must arise from surface heterogeneity.
Since SEM studies have revealed that the materials used in this work are very smooth,
both plasma and corona discharge treatment and subsequent atmospheric exposure do
not change the surface topography of materials employed[165].Thus, it is believed
that the changes of contact angle hysteresis are induced by the altering of the surface
heterogenei ty.
The hysteresis results obtained are the typical behaviour of heterogeneous surfaces
composed by a high energy and a low energy part [125,129,130]. The advancing
angles tend to reflect the lower free energy part; while the receding angles tend to
reflect the higher energy part of the heterogeneous surface. Morra et al. [166]
suggested that if one starts with a wettable surface and introduces a hydrophobic
component, one must expect a sudden increase of the advancing angle, which already
at low fractional coverage reaches the typical values of the less wettable part. The
receding angle remains constant at the low value of the more wettable part and starts
to increase at coverage close to unity. Considering our data it is believed that both
plasma and corona discharge treatment produced heterogeneous surfaces with varying
surface free energy (different wettability) domains. Atmospheric exposure increases the
fraction of the surface covered by the low energy domain to some extent with some
high energy region produced by the treatment still remained on the surface.
13.2.4 Adhesion studies
Atmospheric exposure show different effects on the joint strength of various plasma
and corona discharge treated materials, as shown in Fig. 13.9-13.12. Fig. 13.9 shows
the effect of exposure on the T-peel joint strength of oxygen plasma treated films. The
joint strength remained unchanged in the first month of the exposing period, then
reduced slightly. The air corona treated sample behaved the same as the oxygen plasma
treated sample (as shown in Fig. 13.10). Whereas the joint strength of both ammonia
plasma and ammonia corona treated materials remained unchanged in the whole
exposing period. The results may suggest that different treatment conditions produce
different surface structures which restructure differently during the atmospheric
exposure period.
144

S.OO
0
...... a a
~ !2i -. z '-' 0
.cl .... co = " .. 4.00 ... ....
<Il
-.. ..
! ~ c:>. I
f-<
·3.00
o 20 40 60 80 100 Exposure Time (days)
Fig. 13.9 Effect of exposure to atmospheric environment on the T-peel joint strength
of oxygen plasma treated films
145

40
-
,.... 3S Cl! -
r:l. ~ r-..... .Cl
10 ~ ~ ! ... co
~ ~ = ~
Cl .. ~
... "-' 30 -.. Cl! Cl
.Cl "-' -
2S -
-
20 , I I I I I I I I
o 20 40 60 80 100 Exposure Time (days)
Fig. 13.10 Effect of exposure to atmospheric environment on the lap shear joint
strength of ammonia plasma treated mms
146

40
-
'"' 01 ll. 35 -::s ....., ...c= ... -co = ..
! ..
:·1 ! ... r.r.I
30 -.. 01 ..
~ ...c= r.r.I -
25 - ! 0
_L.. -
20 I I I I I I I I I
o 20 40 60 80 100
Exposure Time (days)
Fig. 13.11 Effect of exposure to atmospheric environment on the lap shear joint
strength of air corona discharge treated films
147
40
-
,.... as
r:l.. 35 -::s '-'
-= ~ ~
.... -
~ toO
1 c:I 0) @J
~ .. .... .. .. 30 -as 0)
-= <n [0 -
25 -
-
20 I I I I I I I I I
o 20 40 60 80 100 Exposure time (day)
Fig. 13.12 Effect of exposure to atmospheric environment on the lap shear joint
strength of ammonia corona discharge treated films
148

During the atmospheric exposure period, because air has very low polarity, the
modified layer tends to restructure and lower their interfacial tension. The changes in
the surface energy, surface polarity and the contact angle hysteresis, therefore, could
be due to the following restructuring process occurring within the contact angle
sampling depth on the treated PEEK surfaces.
(a) LMWM migrate away from the topmost layer towards the bulk to minimise the
interfacial tension between the treated surface and the air. This process could proceed
very fast, thus lowering the surface free energy, its polar component and the surface
polarity significantly in the early exposing period.
In the mean time the LMWM migrate into the bulk, the HMWM expose to the
atmosphere, due to the fact that they were less affected by the plasma and corona
treatment, their dispersion component of the surface energy are more close to the
untreated PEEK. Hence the dispersion component of corona discharge treated films
have increased after exposing.
XPS studies [113] on the atmospheric exposure of oxygen plasma treated PEEK has
confirmed the removal of some small molecules within its sampling depth, i.e. about
2.5 run. It was found that the o/e ratio of the treated surface dropped from 35/IDO to
a steady value 28/1 DO in about two days. At the same time the amount of oxygen
containing polar groups also decreased while the amount of species containing benzene
rings increased.
(b) The polar groups in the molecules orient away from the topmost layer to the
subsurface, driven by the thermodynamically requirement. This process may also be
very fast, and contribute to the lowering of the polar part of the surface energy and
surface polarity in the early exposing period.
(c) The migration of the HMWM away from the topmost layer may take long time to
reach completion and may not be observed within the examination period. This process
causes the surface energy and its components to change only very slowly.
(d) The polar groups of the molecules may form internal hydrogen bond among each
other or with the bulk molecules, thus hindering the restructuring in the modified layer.
After a certain period, both the thermodynamic driving force and the obstructing force
of the internal hydrogen bond could reached an equilibrium, thereby preventing further
149

changes in surface propenies. Hence the aged surfaces are different to the surface of
untreated PEEK, as confinned by the above results.
The extent of the above restructuring processes depend on the chemical structure
produced by the plasma and corona treatment. Oxygen plasma treatment may cause
more oxidation on the surface, as confinned by the XPS and TOF-SIMS analysis
(Chapter 10 and Ref. 97), and there are more functional groups on the oxygen plasma
treated PEEK surface. After atmospheric exposure, because of the obstructing force of
internal hydrogen bonds, more functional groups remain on the top surface layer,
giving rise to lower advancing contact angle of water compared with the aged surfaces
from other treatments.
As shown in Section 12.2, the LMWM that are easily removed from the surface are
not associated with bondability, therefore the bondability of treated materials was
speculative as only decided by the composition of HMWM. The HMWM produced by
oxygen plasma and air corona may be not big enough to hinder their mobility, some of
them could migrate out of the modified layer in the long term exposure period, hence
these treated materials would lose some of their bondability correspondingly. This
decaying process could be stopped by the forming of internal hydrogen bond. For the
ammonia plasma and corona treated PEEK, the HMWM may be too big and unable to
move, hence their bondability is not affected by the atmospheric exposure.
In addition, if we relate the joint strength results to the wettability results, it can be
seen that no direct relationship exist between bondability and wettability. This could be
due to two reasons, one is that the adhesive employed can wet the substrate even when
they are not treated, so intimate interfacial contact can be formed in any case, the other
is that the treated surfaces can form strong interfacial attractions with the adhesive, as
the results in Section 12.3.2 suggest.
13.3 Temperature Effect
As discussed in the previous section, the surface restructuring processes mainly involve
the molecular migration and reorientation. Increasing the temperature can increase the
molecular mobility, "hence it may facilitate the restructuring process occurring in the
modified layer produced by the plasma and corona treatment. This section is dealing
with the effects of temperature on the surface dynamics of treated PEEK.
150
13.3.1 Wettability studies
Fig. 13.13 and Fig. 13.14 show the temperature effect on the surface free energy of
oxygen plasma and air corona discharge treated PEEK fiJrns respectively. As it can be
seen, the polar component and the total surface free energy decrease with the increase
of temperature until the T g of PEEK (about 143°C) is reached, and then remains
constant values which are similar to those of the untreated material. However, the
dispersion component of the surface free energy increased with the temperature and
reached its plateau at temperature much lower than the T g of PEEK.
Fig. 13.15 and Fig. 13.16 shows the temperature effect on the surface polarity of
oxygen plasma and air corona discharge treated films respectively. The results suggest
that increasing the temperature has the similar effect on the surface polarity as
increasing atmospheric exposure time. i.e. surface polarity decreased with increasing
temperature and then reached an equilibrium value at temperature around T g of PEEK.
Table 13.1 shows the effect of I hour heat treatment at temperature of 180°C on the
surface free energy and polarity of other plasma and corona discharge treated films. It
can be seen that the heat treatment changes the surface free energy and its
components, surface polarity of the treated films to values which are similar to those of
the untreated materials.
Fig. 13.17 and Fig. 13.18 show the temperature effect on the contact angle hysteresis
of oxygen plasma treated and air corona treated materials respectively. Increasing
temperature tends to increase the advancing and receding contact angle simultaneously
but with different rate. The advancing angle reaches its equilibrium value about T g'
while the receding angle continues to increase even when the temperature is above T g.
Table 13.1 also shows the temperature effect of 1 hour heat treatment at temperature
of 180°C on the contact angle hysteresis of plasma and corona treated films. As it can
be seen, the heat treatment reverses the advancing angles of plasma and corona treated
samples back to that of the untreated, but gives varied receding angle results.
Suggesting that the consequence of surface reorganisation process is not the same for
different condition treated materials.
151
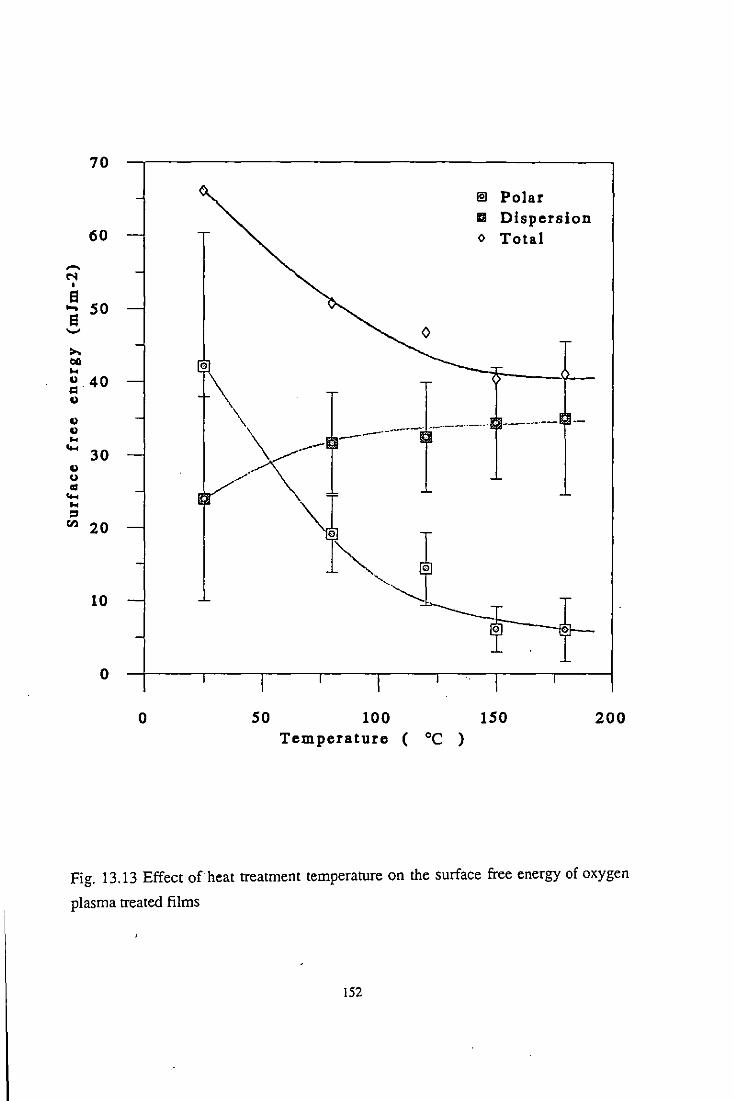
70
60
,.... N , e ... SO e ...... >. till .. <l .40 = <l
<l <l .. ....
30 <l U or .... .. ::0 I'll 20
10
o
o
o
\
~ Polar a Dispersion o Total
\ \
---.. ~- .~---'--
/-~--
so
1 ~, '~
100 Temperature ( °C )
ISO 200
Fig. 13.13 Effect of heat treatment temperature on the surface free energy of oxygen
plasma treated films
152
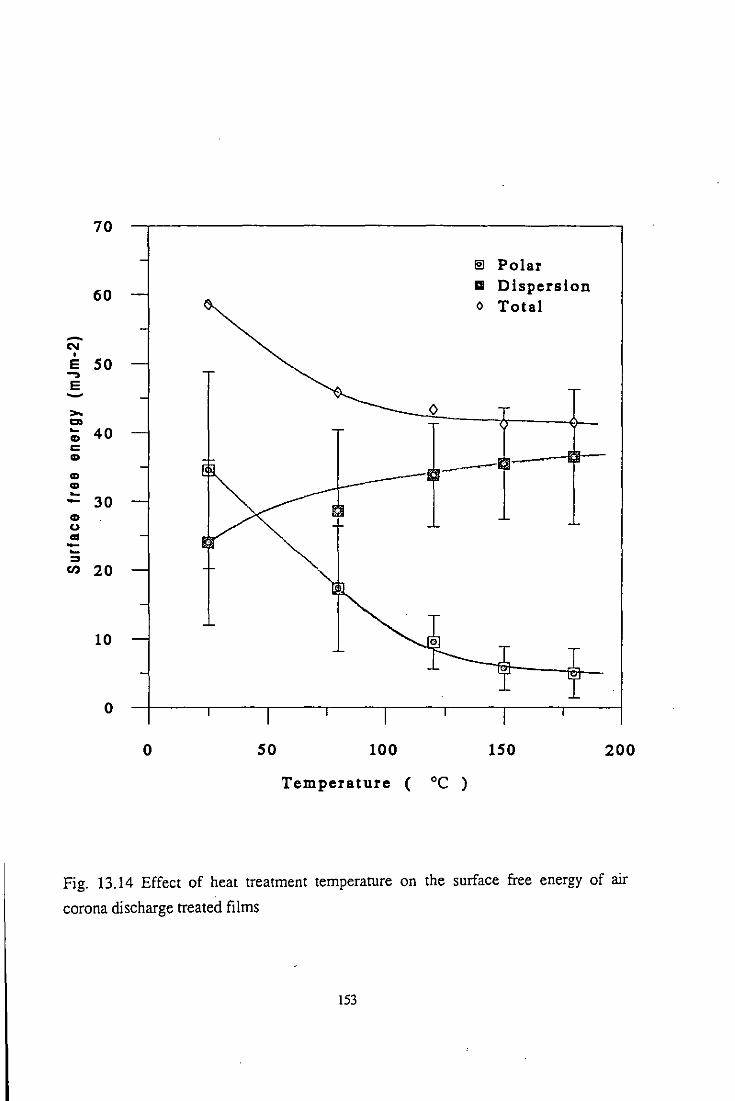
70
eJ Polar
60 III Dispersion 0 Total
~
N • E SO ~
E ~
>- 0 01 ~ 40 Cl)
c Cl) --Cl) Cl) ~ - 30 Cl)
u o:s -~ ::J en 20
10
o
o SO 100 ISO 200
Temperature ( °C )
Fig. 13.14 Effect of heat treatment temperature on the surface free energy of air
corona discharge treated films
153

>. ... -.. Cd -0
"" 0) u Cd ... .. ::I
CIl
0.7
- @)
0.6 - \ '. -
0.5 -\ \
-
\ 0.4 - \ \@)
- \\ ,
\ "
\ @) 0.3 - , , \
- \\ '-.
0.2 - ~ ,
- [email protected] I I I I I I
0 SO 100 150 200 Temperature ( °C )
Fig. 13.15 Effect of heat treatment temperature on the surface polarity of oxygen
plasma treated ftlms
154

Fig. 13.16 Effect of heat treatment temperature on the surface polarity of air corona
discharge treated films
155

80
70
""' 6 0 u u .. t>Q u
"0 '-' SO u -t>Q
= 01
.. 40 <.)
01 .. = 0 U 30
20
10
o
o
I§l Advancing lOll Receding
i /
/ ~ /
/ , @)'
I
/
SO 100 ISO Temperature ( °C )
I E'Il
I / i
200
Fig. 13.17 Effect of heat treatment temperature on the contact angle hysteresis of
oxygen plasma treated films
156

80
@) Advancing ~ 70 a Receding /
-;;- 60 /@
0)
I .. ca [§)' 0)
"Cl ....., SO
a/ 0) -ca c:I Cl .. 40 u Cl .. c:I 0 U 30 @]
20
10
o
o SO 100 ISO 200
Temperature ( °C)
Fig. 13.18 Effect of heat treatment temperature on the contact angle hysteresis of air
corona discharge treated films
157

Table 13.1 Effect of I hour heat treatment at temperature of 180°C on the wettability
of some plasma and corona discharge treated films
Treatment Heat Surface free energy (mJm-2)
condition treatment "'IJ' "'I.d
Untreated Before 7.2±3.9 31.5±8.3
After 2.3±2.6 34.8+10.3
<>? Plasma Before 42.0±18.3 23.9±14.0
After 6.0±4.3 35.0±10.5
NH1Plasma Before 3204±11.6 22.7±9.8
After 9.4±5.0 25.9±8.3
SO" Plasma Before 26.3±1l.2 26.0±11.3
After 6.6±4.7 32.3±1O.6
Air Corona Before 34.5±14.3 24.0±12.0
After 5.0±3.6 36.5±9.8
NH1Corona Before 25.9±8.7 25.7±8.7
After 504-Ic4.2 34.1+10.7
SO" Corona Before 24.6±8.3 28.0±9.0
After 6.6±5.2 3 1.7±1 1.5
Plasma treatment condition: 1 min, 500 W, 0.3 IOrr
Corona discharge treatment level: 004 J/mm2
"'I.
38.7
37.1
66.0
41.0
55.1
35.3
52.3
38.9
58.5
41.5
51.6
39.5
52.6
38.3
Surface Contact angle hysteresis
polarity 9. 9r
0.186 73 32
0.06 84 49
0.638 <5 <5
0.145 73 54
0.587 41 <5
0.266 72 .-0.503 43 <5
0.171 73 44
0.590 30 <5
0.121 75 53
0.502 45 <5
0.136 75 37
0.518 46 <5
0.172 76 47
Therefore, the above results indicate that heat treatment can be used as an accelerated
test for the atmospheric exposure experiment when studying the surface dynamics of
the plasma and corona treated PEEK films.
13.3.2 TOF-SIMS analysis
Both oxygen plasma and ammonia plasma treated films were studied by TOF-SIMS.
Samples were prepared by post treating the films for I hour at temperature of 150°C
13.3.2.1 Positive ion spectra (Fig. 13.19 and Fig. 13.20)
Below a.m.u. 200, heat treatment has very little effect on the spectra of both oxygen
plasma and ammonia plasma treated films, except for the peak at a.m.u. 18 (which was
introduced by the treatment). For oxygen plasma treated sample, this signal was
reduced, while for ammonia plasma treated sample this signal was removed.
158

~
c
" o u
'"
~
~
c
" o U
12 If-
10 I-
ee f-
I 60
40 If-
, -20
I o o
160
Jl4
• 7
.J'
"
, i Ill! 20
220
, ',J I
uJ'
~: ' , \ I ~., I
.,' I,. 'i, 40 60
Atomic Mass Units
240 260 Atomic Mass Units
" ;'1 . '
-
~
~
c
" 0
- u
'"
",- ,
80 100
280 300
10
e~ 6f-
4
21-,::,~,ct'
ol.L~o~' 100 120
III f I
I'~ 140 160 Atomic Mass Units
1
,&I •
/C
180
-
-
200
Fig. 13.19 Positive ion spectrum for oxygen plasma treated PEEK rilin after 1 hour heat treatment at temperature of 150°C (Plasma treatment
condition: 1 min, 500 w, 0.3 torr) ..
159

~
~
c ~
0 u
'"
"' ~ c ~
0 u
120 ~}'
6000 I~/J
100
5000
8C 'I' .,' ~ ~J
j ~ 4000 .,
60 JI' e ~ 3000 0
rI' H' u ,;- r· 40
,r 2000 4; • ". 20 \- ,
.1f· , "
20 40 60 80 100 100 120 Atomic Mass Units
140 160 180 200 Atomic Mass Units
"'f JI: ~
.;I'" ,J,J:! ' 250
I 200
1 11 ~Jl'
150
100
50
I' "IIIU!il'l 'V~ijIW~liIl'JVI~'ijW~li'V~ijWWWi~·YV~.iUi~ 0
220 240 260 2BO 300 Atomic Mass Units
Fig. 13.20 Positive ion spectrum for ammonia plasma treated PEEK film after 1 hour heat treatment at temperature of 150°C (Plasma treatment
condition: 1 min, 500 W, 0.3 torr)
160

Between a.m.u. 200-300, the peak at a.m.u. 219, which was introduced by both plasma
treatment, disappeared after heat treatment.
For oxygen plasma treated films, two other signals which were introduced or enhanced
by the treatment, i.e. at a.m.u. 213 and 242, were reduced after heat treatment. For
ammonia plasma treated films, the peak at a.m.u. 213, which was removed by the
plasma treatment, reappeared after heat treatment, in addition, new peaks at a.m.U. 224
and 252 appeared after heat treatment, none of which being present in the untreated
PEEK spectrum.
13.3.2.2 Negative ion spectra
(a) Oxygen plasma treated films (Fig. 13.21)
Below a.m.u. 100, the intensities of the peaks at a.m.u. 45, 57, 59, 77,93 and 97,
which have been enhanced slightly by the plasma treatment, are slightly reduced, but
not to the level of the untreated sample.
In this mass region, the peak at a.m.u. 19, which had been assigned to F-, was
enhanced after heat treatment.
Between a.m.u. 100-200, the signal at a.m.u. 141, which was removed by oxygen
plasma treatment, reappeared after heat treatment, but other peaks which were
removed by the plasma treatment were still missing after heat treatment. On the other
hand, the signal at a.m.u. 108 was enhanced by heat treatment.
Between a.m.U. 200-300, new peaks appear at 215, 255, 259 and 283 after heat
treatment. Among these, the peak at a.m.u. 255 also appeared in the untreated PEEK
spectrum but with a much strong intensity. The peak at a.m.u. 219, which was
introduced by the plasma treatment, disappeared after the heat treatment.
(b) Ammonia plasma treated films (Fig. 13.22)
Belowa.m.u. 100, after heat treatment, the intensities of peaks at a.m.U. 26 (CN-), 66
and 71 (all of them were introduced by the anunonia plasma treatment), were reduced,
while others remained virtually unchanged.
161
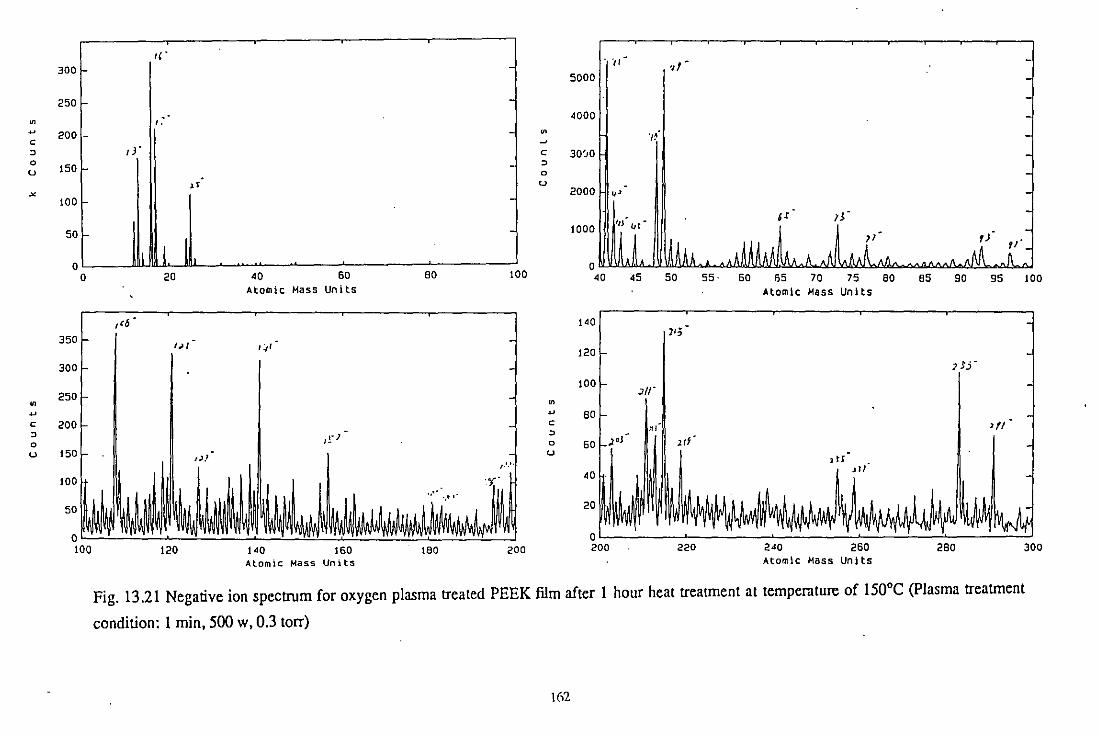
" .
I Ip'" 300 I- I . ,,-5000
'""[ ~ , : .000 ~ 200 - ~
e H '/~
" /l' e 30~O 0 I u 150 " 0
"
" u
'" 100 ~ 1 11 2000 H/,' 1000 111!"( ~r" ~II, .. /1 ,;
50 I-
:,:,. 11 L It ] I I " ,;
0' . "
0 20 .0 60 80 100 0 .0 .5 50 55· 60 55 70 75 80 85 90 95 100
Atomic Mass Units Atomic Mass Units
,'6 j 140 I 350 I- I 11'5
'" I:,' 120
300 I- I I ] Sj-
'""[ 1 100 I )//"
~ ~
~ ~ 80 e 200 e
::~r ~j " " ," 0
,1- J 0 2/'
u 150 /,),1 u I ' r r , ,rI
20
o /miIWII'··" IIWI,I~'I~V'W~W~W~~'~~~~ 'IW~~~ 120 140 160 180 200 200 220 240 260 280 300
Atomic Mass Units Atomic Mass Unlts
Fig. 13.21 Negative ion spectrum for oxygen plasma treated PEEK film after 1 hour heat treatment at temperature of 150°C (Plasma treatment
condition: 1 min, 500 W, 0.3 torr)
162

250
'r BOOO ./-
200 i- ,]"
~ ". 6000,-.p 150 i- ~
c ~
o u
~
~
u
C
~
0
u
100
50 i-
o o
12001-
HiDD
BOO I
60u
400
I" .
.1 "r
l:" <>-v-..: ~ .
" I 'j 'j I1
20
,11 ,.1'
',1'1 I/r
!J! .
/',-
120
·,0 <0->0/
40 60 Atomic MaS6 Units
" ' ,'1/ ,H
140 160 Atunic Mass Units
u I· u'-c ~
41000 0
u
20001 I!II 'Jr 1
! :
80 100 60 65 70 75 BO 05 90 95 Atomic Mass Units
,) I t ~
500
400
~
u c 30{J I ,>J:
~
0
, "J u
lBO 201} 220 240 260 200 Atomic Mass Units
Fig. 13.22 Negative ion spectrum for ammonia plasma treated PEEK film after 1 hour heat treatment at temperature of 150°C (Plasma treatment
condition: 1 min, 500 W, 0.3 torr)
163
100
300

Between a.m.U. 100-200, the heat treatment has very little effect on the spectrum of
ammonia plasma treated PEEK.
Between a.m.u. 200-300, after the heat treatment, peaks at 203, 213, 227, 277 and
291 disappeared. Among them, the peak at a.m.U. 203 was introduced by the plasma
treatment, while the peak at a.m.u. 227 was much enhanced by the plasma treatment.
The intensity of the peak at 255 was much enhanced.(there is also a strong signal at
a.m.U. 255 in the spectra of untreated PEEK). Some new weak signals appeared at
a.m.u. 269, 281 and 283. Those signals also exist in the untreated PEEK spectrum but
not the ammonia plasma treated spectrum.
Therefore, both positive and negative ions results show that heat treatment can also
recover to some extent the chemical structures changed by both oxygen and ammonia
plasma treatment back to those of the untreated PEEK.
13.3.4 Adhesion studies
Fig. 13.23 and Fig. 13.24 show the temperature effect on the lap shear joint strengths
of both oxygen plasma and air corona discharge treated materials respectively. As it can be seen, when the heat treatment temperature is lower than 150°C, i.e. lower than
T g), the heat treatment has very little effect on the joint strength and the failure locus.
Only when the heat treatment temperature is above 150°C, does the- joint strength
decreases, and the failure locus changes, particularly for oxygen plasma treated
samples. However, heat treatment for I hour at temperature of 180°C only slightly
decrease the joint strength of ammonia plasma and sulfur dioxide plasma treated
materials, while slightly increase the joint strength of ammonia corona and sulfur
dioxide corona treated films (as shown in Table 13.2).
The difference here is thought to be due to different treatment condition produce
different size molecules on the surface. The HMWM produced by the oxygen plasma
treatment may have relatively small size and could move into the bulk when
temperature is over the T g' While the HMWM produced by other treatment may have
relatively large size and it is difficult for them to migrate into the bulk even when
temperature is over the T g' Hence heat treatment does not affect their joint strength.
164

40
35
,... 30 Cl!
Cl. ~ ...... .cl 25 ... co 1'1 u .. ... 20 .. .. Cl! u
.cl 15 <I.l
10
5
o
o 50 100 150 200
Temperature ( ,cC )
Fig. 13.23 Effect of heat treatment temperature on the lap shear joint strength of
oxygen plasma treated films
165

40
-
35 -
-,.... --.----@]-~ 01 30 - ~-. Il. ); -'-'
. \ ..cl 25 -... bO , c:I -<) .. ...
20 -., .. 01 -<)
..cl 15 -tIl
-
10 --
5 --
0 I I I I I I I
0 50 100 150 200
Temperature ( °C )
Fig. 13.24 Effect of heat treatment temperature on the lap shear joint strength of air
corona discharge treated films
166

Table 13.2 Effect of heat treatment ( I hour at 180°C) on the lap shear joint strength
of some plasma and corona discharge treated PEEK
Treatment Heat treatment Joint strength
method (MPa)
Untreated Before 16.9±1.3
After 13.0±3.8
02 plasma Before 34.0±1.4
After 15.2±6.9
NH~plasma Before 32.2±2.1
After 26.4±O.7
S02plasma Before 32.8±O.9
After 28.0±1.2
Air corona Before 28.5±1.8
After 27.2+4.6
NH~corona Before 28.0±0.7
After 32.2±D.l
S02corona Before 32.0±1.2
After 32.5±1.7
Plasma treatment condition: I min, 500 w, 0.3 torr
Corona discharge treatment level: 0.4 J mm-2
13.4 Effect of Water
Locus of
failure
I+C
I+C
C+M
I+C+M
C+M
C+M
C+M
C+M
C+M
I+C+M
C+M
C+M
C+M
C+M
As discussed above, the molecules in the modified layer produced by plasma and
corona discharge treatment tends to restructure to minimise its interfacial tension. In
the non-polar environment, the polar groups would orient into the bulk, as the result
shown above, while in the polar environment, the polar groups would stay in the
surface or orient to the surface. In addition, polar environment should recover the
atmospheric exposed or heat treated sample to some extent, if the molecules have
enough mobility. This section will discuss the results of water effect on the surface
dynamics of plasma and corona discharge treated films.
167

Table 13.3 Effects of one week water immersion on the suIface free energy. surface
polarity and contact angle hysteresis of plasma and corona discharge treated materials
Treatment Water Surface free energy (mJm-2)
condition immersion 'Y'" 'Y.d
Untreated Before 7.2±3.9 31.5±8.3
0,. Plasma Before 42.0±18.3 23.9±14.0
After 34.8+15.5 25.3+13.3
NH~Plasma Before 32.4±11.6 22.7±9.8
After 35.4+15.2 24.6+12.8
Air Corona Before 34.5±14.3 24.0±12.0
After 38.5±18.0 21.2±13.5
NH~Corona Before 25.9±8.7 25.7±8.7
After 26.6±9.9 24.3±9.5
Plasma treatment condition: 1 min. 500 w. 0.3 torr
Corona discharge treatment level: 0.4 J mm-2
'Y.
38.7
66.0
60.1
55.1
60.0
58.5
59.7
51.6
50.9
Surface Contact angle hysteresis
polarity 9. 9r
0.186 73 32
0.638 <5 <5
0.579 33 <5
0.587 41 <5
0.590 27 <5
0.590 30 <5
0.645 26 <5
0.502 45 <5
0.523 45 <5
Table 13.4 Effects of one week water immersion on the lap shear joint strength of
plasma and corona discharge treated materials
Treatment Water immersion Joint strength
method (MPa)
Untreated Before l6.9±1.3
02 plasma Before 34.0±1.4
After 32.S±O.7
NH1plasma Before 32.2±2.1
After 31.4±2.0
Air corona Before 28.S±1.8
After 29.6±2.2
NH1 corona Before 28.0±0.7
After 30.1±2.3
Plasma treatment condition: 1 min. SOO w. 0.3 torr
Corona discharge treatment level: 0.4 J mm-2
168
Locus of
failure
I+C
C+M
C+M
C+M
C+M
C+M
C+M
C+M
C+M

Table 13.3 shows the effects of one week water immersion on the surface free energy
and its components for plasma and corona discharge treated films, also listed are the
results of surface polarity and contact angle hysteresis. It can be safely stated that one
week water immersion has not much effect on either surface free energy and its
components or surface polarity. Except for oxygen plasma treated sample, water
immersion decreases the surface free energy and surface polarity to some extent. The
results of the contact angle hysteresis show the same trend, as shown in Table 13.3.
Table 13.4 shows the results of water immersion on the joint strength and it can be
found that the lap shear joint strengths of plasma and corona discharge treated
materials are not affected by the water immersion, implying that very little water was
absorbed by the treated materials during the immersion period.
Hence water immersion does not change the wettability and bondability of plasma and
corona discharge treated materials. This is believed to be due to very little water
absorption during the immersion period and that water immersion may affect the
modified layer in two ways: one is the dissolution of some LMWM which depending
on the treatment condition employed; and the other is the reorientation of the polar
groups to the surface. The net effect of these two effects is that for most treated
samples, the immersed surfaces still keep their wettability and polarity. The exceptional
decrease of the surface energy and the increase of the advancing contact angle for
oxygen plasma treated films is thought to be due to that oxygen plasma treatment
produces more LMWM than other treatments.
To assess the possibility of reversing the reorientation process occurred during
atmospheric exposure and heat treatment. A one hour heat post-treated oxygen plasma
modified sample was immersed in distilled water for one hour at room temperature
(about 20°C) and IOO°C respectively. The surface energy, surface polarity and contact
angle hysteresis were studied and the results are shown in Table 13.5. As it can be
seen, water immersion at high temperature can recover the surface properties of the
aged sample, hence confmning our postulations about the surface orientation and·
restructuring (or surface dynamics).
169

Table 13.5 Effect of one hour water immersion on the surface properties of heat post
treated oxygen plasma modified materials
Water Temperature Surface free energy (mJm-2)
immersion 'Y.}' 'Y.d 'Y.
Before 11.3+4.0 32.4±7.5 43.7
After RT 13.6±4.2 29.3±6.3 42.9
100·C 36.0±11.6 20.1±B.8 56.1
Plasma treatment condition: 1 min, 500 w, 0.3 torr
Heat post-treatment: 1 hour at 120°C
170
Surface Contact angle hysteresis
J)Olarity e. er 0.259 66 <5
0.318 63 <5
0.642 35 <5

CHAPTER 14 CONCLUSIONS AND RECOMMENDATIONS FOR FUTURE WORK
14.1 Conclusions
Several conclusions can be drawn from the above results and discussions:
1. Untreated samples show low peel and shear joint strengths with the failure occurring
either at the interface or at the interface and in the adhesive, suggesting that the
interface is the weakest part in the untreated PEEK/adhesive joints.
2. Plasma and corona discharge treatment significantly increase both peel and lap shear
joint strengths of PEEK. The treatments also change the failure mode of the
PEEK/adhesive joints to cohesive or the mix of cohesive and material. The results
indicate that plasma and corona discharge treatment can enhance the bond ability of
PEEK films to a level where the PEEK ruptures.
3. The results of the adhesion studies have shown that both amorphous and crystalline
materials gave the same adhesive joint strength immediately after either plasma or
corona discharge treatment with the fracture occurred primarily in the adhesive.
4. The initial durability studies have found that the adhesive joint for both plasma and
corona discharge treated films does not lose their strength after either 180°C, 1 hour
heat treatment or I month water immersion. These results and those of the other
adhesion studies indicate that plasma and corona discharge treated materials can form
strong interfacial attractions with the adhesive employed.
5. To study the mechanism of bondability enhancement, contact angle measurement,
SEM, XPS and TOF-SIMS were employed to characterise the plasma and corona
discharge treated surfaces. I;rom contact angle studies it has been found that the
treatment can significantly increase the wettability and polarity of PEEK films. While
SEM analysis does not reveal surface topography changes after the treatment, both
XPS and TOF-SIMS investigations show that plasma and corona discharge treatment
change the chemical structures of the material surfaces. Some chemical groups, like
hydroxyl, acid and etc. are introduced to the treated surfaces, and some low molecular
weight molecules (LMWM) are also produced on the treated surfaces, which can be
removed, to some extent, by solvents like acetone.
171

6. Based on the surface characterisation results, the treated surfaces can be modelled
as a modified layer consisting of scattering molecular weight molecules with some
functional groups introduced by the treatment bonded to their main structures. The
distribution of the molecular weight in the modified layer depends on the treatment
condition. According to solvent washability, the molecules on the treated surfaces can
be classified into two categories, namely low molecular weight molecules (LMWM),
which is washable by ordinary solvent, and high molecular weight molecules
(HMWM), which are not washable by solvent.
7. The studies of bond ability enhancement mechanism have shown that either weak
boundary layers, or lack of mechanical interlocking and wetting is the main reason for
the weak adhesion of PEEK films. The TOF-SIMS results suggest that chemical bonds
can be formed between the treated surfaces and the epoxy resin, hence, it is believed
that the lack of intrinsic adhesion is due to the lack of active chemical groups which, if
present, can establish strong interatomic and intermolecular forces across the
adhesiveIPEEK interface. Both plasma and corona discharge treatment introduce such
chemical groups onto the surface of PEEK film and so greatly enhance the intrinsic
adhesion at the adhesive/substrate interface. Moreover, the results obtained also show
that the small molecules produced by the treatment play a little role on the adhesion
enhancement, though they reduce the wettability drastically.
8. Surface dynamics studies have revealed that both plasma and corona discharge
treated surfaces are in a thermodynamically unstable state. Atmospheric exposure and
heat treatment can recover the wettability and surface polarity of the treated surface to
those of the untreated material to a large extent which depends on the ageing
condition, while water immersion can reverse those ageing effects. However,
atmospheric exposure has little effects on the bondability (with the adhesive employed)
of the treated films except for the oxygen plasma and air corona discharge treated
materials, for which the joint strength is slightly lowered after more than two months
exposure. Heat treatment below the glass transition temperature of PEEK does not
affect the bondability (with the adhesive employed) of the treated materials, but
treatment above that temperature could deteriorate the bondability of oxygen plasma
and air corona discharge treated films. The mechanism of the surface dynamics is
thought to be due to the reorientation of the chemical groups and the migration of
LMWM which depend on the ageing condition.
172

14.2 Recommendations for Future Work
The present research work has established the techniques required for successful
bonding of PEEK. To gain a funher understanding of the mechanisms of adhesion and
establish critical engineering design data the following suggestions are recommended
for future work.
1. Durability Studies
The initial durability studies have shown that the plasma and corona discharge treated
PEEK/adhesive joints have a very promising hot/wet performances, but since durability
is often the limiting factor in adhesive bonding, this area needs funher studies, e.g.
exposure for up to one year.
2. Interfacial Interactions
The work carried out so far has revealed that chemical bonds can be fonned between
the treated surfaces and the epoxy adhesive. But to design the surface chemical
composition which is good for adhesion, it needs to know the contributions from
various chemical groups introduced by the treatment.
3. Surface Dynamics
The current studies had found that the wettability and chemical composition changes
with time and temperature, but not the adhesive joint strength. This could be due to the
high curing temperature for the adhesive employed. To gain funher understanding of
the relation between the adhesive and surface dynamics, different curing temperature
adhesive should be investigated.
173

REFERENCES
1. Engineered Materials Handbook, Vo1.2, "Engineering Plastics", ASM International,
144(1988)
2. T. E. Attwood et ai, Polymer, 22,1096(1981)
3. T. C. Stening, C. P. Smith and P.J. IGmber, Modem Plastics International, March,
54(1982)
4. D. J. Willats, SAMPE 1., 20, 6(1984)
5. V. Wigotsky, Plast. Eng., 42, 17(1986)
6. A. J. Kinloch and C. M. Taig, J. Adhesion, 21, 291(1987)
7. Szu-I Y. Wu, Ann M. Schuler and Dan V. Keane, 19th International SAMPE
Technical Conference, Oct.13-15, 277(1987)
8. S. Wu, Polymer Interface and Adhesion, p 29, Marcel Dekker, Inc., New York and
Basel (1982)
9. ibid. p 359
10. L. H. Lee, in Fundamentals of Adhesion (L. H. Lee, ed.), p 6, Plenum Press, New
York (1991)
11. S. Wu, Polymer Interface and Adhesion, p 360, Marcel Dekker, Inc., New York
and Basel (1982)
12. ibid. P 406
13. L. Pauling, The Nature of The Chemical Bond, Cornell University Press, New
York(1960)
14. R. J. Good, in Treatise on Adhesion and Adhesives, VoU (R. L. Patrick, ed.), p
15, Marcel Dekker, Inc., New York (1967)
15. F. M. Fowkes, in Physicochemical Aspects of Polymer Surfaces, Vol.2 (K. L.
Mittal, ed.), P 583, Plenum Press, New York (1983)
16. R. N. Wenzel, Ind. Eng. Chem. 28, 988 (1936)
17. J. R. Evans and D. E. Packham, J. Adhesion, 10, 177(1979)
18. D. E. Packham, in Developments in Adhesives 2 (A. J. Kinloch, ed.), p 315,
Applied Science Pub., London (1981)
19. D. E. Packham, in Adhesion Aspects of Polymeric Coatings (K. L. Mittal, ed.), P
19, Plenum Press, New York (1983)
20. P. J. Hine, S. E. Muddarris and D. E. Packham, 1. Adhesion, 17,207(1984)
21. H. E. Bair, S. Matsuoka, R. G. Vadimsky and T. T. Wang, J. Adhesion, 3,
89(1971)
22. T. T. Wang and H. N. Vazirani, J. Adhesion, 4,353(1972)
23. S. S Voyutskii, Autohesion and Adhesion of High Polymers, Interscience, New
York (1963)
174
24. A. J. Kinloch, Adhesion and Adhesives Science and Technology, p 248, Chapman
and HaIl Ltd., London (1987)
25. W. A. Zisman, Adv. Chem. Ser., 43, 1(1964)
26. F. M. Fowkes, Ind. Eng. Chem., 56, 40(1964)
27. T. W. Whalen, 1. Colloid Interf. Sci., 28, 443(1968)
28. A. W. Neumann, R. J. Good, J. Colloid Interf. Sci., 38, 341(1979).
29. A. W. Neumann, R. J. Good, in Surface and Colloid Science 11 (R. J. Good and R.
R. Stromberg, eds.), 31(1979)
30. D. G. Ranee, in Industtial Adhesion Problems (D. M. Brewis and D. Briggs, eds.),
p 48, Orbital Press, Oxford (1985)
31. S. Wu, Polymer Interface and Adhesion, p 15, Marcel Dekker, Inc., New York and
Basel (1982)
32. H. W. Fox, W. A. Zisman, J. Colloid Sci., 5, 514(1950)
33. H. W. Fox, W. A. Zisman, J. Colloid Sci., 7,109(1952)
34. H. W. Fox, W. A. Zisman, J. Colloid Sci., 7, 428(1952)
35. E. G. Shafrin, and W.A. Zisman, J. Phys. chem., 64, 519(1960)
36. W. A. Zisman in Contact Angle, WettabiIity, and Adhesion, ACS, Washington D.
C., Advances in Chemistry Series, 43, 1(1964)
37. L.A. Girifalco, R. J. Good, J. Phys. Chem., 61, 904(1957)
38. R. J. Good, L. A. Girifalco, G. Kraus, J. Phys. Chem., 62,1418 (1958)
39. F. M. Fowkes, J. Phys. Chem., 66,1863(1962)
40. F. M. Fowkes, J. Phys. Chem., 67, 2538(1963)
41. D. K. Owens, R. C. Wendt, J. Appl. Polym. Sci., 13, 1740(1969)
42. D. K. Owens, J. Appl. Polym. Sci., 14, 1725(1970)
43. S. Wu, J. Poly. Sci.: Part C, No.34, 19(1971)
44. S. Wu, in Polymer Science and Technology, Vo1.I2a, Adhesion and Adsorption of
Polymers (L. H. Lee, ed.), p 53, Plenum Press, New York (1980)
45. S. Wu, Polymer Interface and Adhesion, p 178, Marcel Dekker, Inc., New York
and Basel (1982)
46. C.A. Ward, A. W. Neumann, J. Colloid Interf. Sci., 49, 286(1974)
47. F. M. Fowkes, in Polymer Science and and Technology, Vo1.I2a, Adhesion and
Adsorption of Polymers (L. H. Lee, ed.), p 43, Plenum Press, New York(1980)
48. F. M. Fowkes, J. Adhesion Sci. Technol. 17(1987)
49. D. H. Kaelble and K. C. Uy, 1. Adhesion, 2, 50(1970)
50. F. M. Fowkes, 1. Colloid Interf. Sci., 28, 493(1968)
51. 1. Schultz, K. Tsutsumi and 1. B. Donnet, J. Colloid Interf. Sci., 59, 277(1977)
52. F. M. Fowkes, in Treatise on Adhesion and Adhesives, Vol. I (R. L. Pattick, ed.),
p 352, Marcel Dekker, New York ( 1967)
175

53. C. F. A. Culling, Modem Microscopy, Elementary Theory and Practice,
Butterwonh, London (1974)
54. o. Iohari and A. V. Sarnudra, in Characterization of Solid Surfaces (P.F. Kane and
G. P. Larrabee, eds.), p 107, Plenum Press, New York (1974)
55. 1. A. Fubey and 1. P. Wightman, in Adhesive Bonding (L. H. Lee, ed.), p 175,
Plenum Press, New York (1991)
56. E. A. Ledbury, A. G. Miller, P. D. Peters, E. E. Peterson and B. W. Smith, Proc.
12th Natl. SAMPE Techn. conf. Series, p 935, SAMPE, Azusa, CA (1980)
57. G. D. Davis, in Adhesive Bonding (L. H. Lee, ed.), p 139, Plenum Press, New
York (1991)
58. N.I.Harrick, Internal Reflection Spectroscopy, Wiley, New York (1967)
59. N. 1. Harrick, in Characterization of Metal and Polymer Surfaces (L. H. Lee, ed.),
Vol.2, p 153, Academic Press, New York (1977)
60. P. R. Griffiths and 1. A. deHaseth, Fourier Transform Infrared Spectroscopy,
wHey, New York (1986)
61. H. A. Willis and V. 1. I. Zichy, in Polymer Surfaces (D. T. Clark and W. J. Feast,
eds.), p 287, WHey, London (1978)
62. D. Briggs, in Surface Analysis and Pretreatment of Plastics and Metals (D. M
Brewis, ed.), p 84, Applied Science Publishers, London (1982)
63. C. D. Wagner, in Practical Surface Analysis (D. Briggs and M.P. Seah, eds.), p
477, Wiley, Chichester (1983)
64. L. C. Feldman and 1. W. Mayer, Fundamentals of Surface and Thin film Analysis,
North-Holland, New York (1986)
65. T. A. Carlson, Photoelectron and Auger Spectroscopy, Plenum Press, New York
(1974)
66. D. T. Clark, W. 1. Feast, W. K. R. Musgrave, I. Ritchie, 1. Polym. Sci. Chem. Ed.
13, 857(1975)
67. D. Briggs, in Encyclopedia of Polymer Science and Engineering (1. I. Kroschwitz,
ed.), 2nd Ed., 16,406(1989)
68. D. S. Everhart, C. N. Reilley, Anal. Chem., 53, 665(1981)
69. D. Briggs, C. R. Kendall, 1nl. 1. Adhes. Adhes., Ian, 13(1982)
70. R. A. Dickie, 1. S. Hammond, 1. E. DeVries, J. W. Holubka, Analy. Chem., 54,
2045(1982)
71. I.S. Harnmond, Polym. Prepr. Am. Chem. Soc. Div. Polym. Chem. 21, 149(1980)
72. L. J. Gerenser, 1. F. Eiman, M. G. Mason, J. M. Pochan, Polymer, 26,1162(1985)
73.1. M. Pochan, L. J. Gerenser, J. F. Elman, Polymer, 27,1058(1986)
74. A. Chilkoti, B. D. Ratner and D. Briggs, Chem. Mater. 3, 51(1991)
176

75. I. C. Vickennan, in Secondary Ion Mass Spectrometry (I. C. Vickennan, A.
Brown and N. M. Reed, eds.), P 2, Clarendon Press, Oxford (1989)
76. E. Zinner, I. Electrochem. Soc., 130, 199C, 1983
77. A. Benninghoven, Phys. Status Solidi, 34, KI69(1969)
78. D. Briggs, Surf. Interface Anal. 4,151(1982)
79. D. Briggs, Surf. Interface Anal.. 5, 113(1983)
80. D. Briggs and A. B. Watton, Surf. Interface Anal. 4, 109(1982)
81. D. Briggs, M. I. Hearn and B. D. Ratner, Surf. Interface Anal. 6, 184(1984)
82. A. Brown and J. C. Vickerman, Surf. Interface Anal. 6, 1(1984)
83. A. Brown and I. C. Vickerman, Surf. Interface Anal. 8, 75(1986)
84. D. Briggs and M. I. Hearn, Vacuum, 36,1005(1986)
85. I. Lub, F. C. B. M. van Vroonhoven, D. van Leyen and A. Benninghoven,
Polymer, 29, 998(1985)
86.1. Lub, P. N. T. van Velzen, B. Hagenhoff and A. Benninghoven, Surf. Interface
Anal., 12, 53(1988)
87. D. Briggs and M. I. Hearn, Surf. Interface Anal., 13, 181(1988)
88. D. Briggs, M. I. Hearn, I. W. F1etcher, A. R. Waugh and B. I. Macintosh, Surf.
Interface Anal., 15, 62(1990)
89. D. Briggs, in Practical Surface Analysis, second edition, Vol. 2, (D. Briggs an M.
P. Seab, eds.), p367, Iohn Wiley and Sons, Chichester (1992)
90. M. I. Hearn, D. Brigg, S. C. Yoon and B. D. Ratner, Surf. Interface Anal., 10,
384(1987)
91. D. I. Pawson, A. P. Ameen, R. D. Shon, P. Denison and F. R. lones, Surf. Interf.
Analy., 18, 13(1992)
92. A. 1. Kinloch, Adhesion and Adhesives: Science and Technology, p 248, Chapman
and Hall Ltd, London(1987)
93. D. M. Brewis in Industrial Adhesion Problems (D. M. Brewis and D. Briggs, eds.),
p 129, Orbital Press, Oxford(1985)
94. G. B. Ponelli, in Structural Adhesives: Chemistry and Technology, (S. R.
Hanshorn ed.), p407, Plenum Press, New York (1986)
95. I. Comyn, Lectring materials, Loughborough University of Technology, 1995
95a. A. 1. Kinloch, Adhesion and Adhesives: Science and Technology, p 216,
Chapman and Hall Ltd, London(1987)
96. O. Volkersen, Luftfabnforschung, 15, 41 (1938)
97. S. Wu, Polymer Interface and Adhesion, p 530, Marcel Dekker, Inc., New York
and Basel (1982)
98. D. H. Kaelble, Trans. Soc. Rheol., 3,161 (1959)
99. D. H. kaelble, Trans. Soc. Rheol., 4, 45 (1960)
177

lOO. S. Hamdan and J.R. G. Evans, J. Adhesion ScL Tech. 1(4),281(1987)
101. G. K. A. Kodokian, A. J. Kinloch, J. Mater. Sci. Lett., 7,625(1988)
102. E. M. Silverman and R. A. Griese, SAMPE Journal, 25, 34(1989)
103. Tae-Ho Yoon and 1. E. Mcgrath, 36th Inter. SAMPE Sym., April 15-18,
428(1991)
104. A. 1. Kinloch, Adhesion and Adhesives: Science and Technology, p 141,
Chapman and Hall Ltd, London(1987)
105. B. R. Strohmeier, J. Vac. ScL Tech., A7, 3228(1989)
106. P. Davies, C. Couny, N. Xanthopoulos and H. J. Mathieu, J. Mater. ScL Lett.,
10,335(1991)
107. J. R. G. Evans, R. Bulpett and M. Ghezl, 1. Adhesion ScL Technol. 1,291(1987)
108. J. R. Hollahan and A. T. Bell, Techniques and Applications of Plasma Chemistry,
John Wiley & Sons, New York (1974)
109. E. M. Liston, J. Adhesion, 30,199 (1989)
110. S. Wu, Polymer Interface and Adhesion, p 298, Marcel Dekker, Inc., New York
and Basel (1982)
111. E.Occhiello, M.Morra, G. L. Guerrini and F. Garbassi, Composites, 23(3),
193(1992)
112. A. D. Katnani, A. Knoll and M. A. Mycek, J. Adhesion ScL Tech., 3,441(1989)
113. W. J. Brennan, W. J. Feast, H. S. Munro and S. A. Walker, Polymer, 32,
1527(1991)
114. H. V. Boenig, Fundamentals of Plasma Chemistry and Technology, p 17,
Technomic Publishing Co., Inc., Lancaster and Basel (1988)
115. A. J. Kinloch, G. K. A. Kodokian and J. F. Watts, J. of Mater. Sci. Lett., 10,
815(1991)
116. A. J. Kinloch and G. K. A. Kodokian, J. Adhesion, 37, 33(1992)
117. G. K. A. Kodokian and A. 1. Kinloch, in "Bonding and Repair of Composites",
(Butterwonhs, Guildford, 1989), P57
117a. L. Mascia, G. E. Carr and P. Kember, Plastics and Rubber Processing and
Applications, 9,133(1988)
118. J. Comyn, D. C. Blackley and L. M. Harding, Int. J. Adhes. Adhes., 13,
163(1993)
119. J. R. Dann, J. Colloid Interf. Sci., 32, 302(1970)
120. F. M. Fowkes and S. Maruchi, Coatings and Plastics Preprints, 37, 605(1977)
121. S. Wu, Polymer Interface and Adhesion, p 260, Marcel Dekker Inc., New York
(1982)
122. R. J. Good, 1. colloid Interf. Sci., 52, 308(1975)
178

123. S. Wu, Polymer Interface and Adhesion, p 103, Marcel Dekker Inc., New York
(1982)
124. E. Sheng, PhD Thesis, Loughborough University of Technology, 1992
124a. S. Wu, Polymer Interface and Adhesion, p 537, Marcel Dekker Inc., New York
(1982)
125. A. W. Neumann and R. J. Good, J. Colloid Interf. Sci., 38, 341(1972)
126. J. D. Eick, R. J. Good and A. W. Neumann, J. Colloid Interf. Sci., 53,235(1975)
127. J. D. Andrade, D. E. Gregonis and L. M. Smith, Physicochemical Aspects of
Polymer Surfaces, Vol. 2, p 911, Plenum, New York/London(1982)
128. S. Wu, Polymer Interface and Adhesion, p 25, Marcel Dekker Inc., New York
(1982)
129. R. E. Jr. Johnson and R. H. Dettre, J. Phys. Chem., 68, 1744(1964)
130. L. W. Schwartz and S. Garoff, Langmuir, 1,219(1985)
131. D. Briggs, D. G. Rance, C. R. Kendall and A. B. Blythe, Polymer, 21,895(1980)
132. G. Beamson and D. Briggs, High Resolution XPS of Organic Polymers: The
Sciencta ESCA 300 Database, John Wiley & Sons Ltd, 1992
133. Y. Tamada and Y. Ikada, Polymer, 34,2208(1993)
134. A. P. Ameen, R. 1. Ward, R. D. Short, G. Beamson and D. Briggs, Polymer, 34,
1795(1993)
135. E. Sheng, I. Sutherland, D. M. Brewis and R. J. Heath, Surf. Interface Anal., 19,
151(1992)
136. A. Chilkoti and B. D. Ratner, Surf. Interface Anal., 17,567(1991)
137. Y. Yakayama, T. Takahagi, F. Soeda, K. Hatada, S. Nagacka, J. Suzuki and A.
Ishitani, J. Polym. Sci. Poly. Chem. ed., 26, 559(1988)
138. I. Sutherland, E. Sheng, D. M. Brewis and R. J. Heath, J. Mater. Chem., 4,
683(1994)
139. D. Briggs, A. Brown and J. C. Vickennan, Handbook of Static Secondary Ion
Mass Spectroscopy, Wiley, Chichester (1989)
140. J. Lub, F. C. M. van Vroonhoven, D. van leyen and A. Benninghoven, Polymer,
29,998(1988)
141, F. Garbassi, E. Occhiello, F. Polato and A. Brown, J. Mater. Sci., 22,1450(1987)
142. R. M. Silverstein, G. C. Bassler and T. C. Morrill, Spectrometric Identification of
Organic Compounds, Fifth edition, p 110, John Wiley & Sons, Inc. New York (1991)
143. ibid p120
144. A. J. Kinloch, Adhesion and Adhesives Science and Technology, p 248, Chapman
and Hall Ltd., London(1987)
145. ibid. P 57
146.1. N. Anand, J. Adhesion, 5, 265(1973)
179
147. B. V. Deryaguin and V. P. Smilga, J. Appl. Phys. 38 (12),4609 (1967)
148. A. J. Kinloch, Adhesion and Adhesives Science and Technology, p 74, Chapman
and Hall Ltd., London(1987)
149. ibid. P 248
150. ibid. p 149
151. ibid. p 20
152. W. C. Wake, Adhesion and The Fonnulation of Adhesives, p 54, Applied Science
Pub., London (1982)
153. Handout from CSMA
154. F. N. Cogswell and M. Hopprich, Composites, 14,251 (1983)
155. E. J. Stober, J. C. Seferis and J. D. Keenan, Polymer, 25, 1845(1984)
156. T. Sasuga and M. Hagiwara, Polymer, 26, 501(1985)
157. A. Anak, J. I. Eguiazabal and 1. Nazabal, J. Mater. Sci., 28, 3272(1993)
158. H. Yasuda, A. K. Shanna and T. Yasuda, 1. Polym. Sci. Polym. Phys. Ed., 19,
1285(1981)
159. T. Yasuda, T. Okuno, K. Yoshida and H. Yasuda, J. Polym. Sci. Polym. Phys.
Ed.,26, 1781(1988)
160. Y. Iriyama, T. Yasuda, D. L. Cho and R. Yasuda, 1. Appl. Polym. Sci., 39,
249(1990)
161. H. Iwata, A. Kishida, M. Suzuki, Y. hata and Y. Ikada, J. Polym. Sci. Polym.
Chem., 26,3309(1988)
162. M. Morra, E. Occhiello, L. Gila and F. Garbassi, J. Adhesion, 33, 77(1990)
163. D. Briggs, D. G. Rance, C. R. Kendall and A. R. Blythe, Polymer, 21, 895(1980)
164. A. Blythe, D. Briggs, C. R. Kendall, D. G. Rance and V. J. I. Zichy, Polymer, 19,
1273(1978)
165. Report for DRA, Research Agreement CB/RAE/9/4/2170/127/MA
166. M. Morra, E. Ochiello and F. Garbassi, J. Colloid Interf. Sci., 132, 504(1989)
180

Appendix 1 Calculation of Crystallinity From DSC Results
The DSC thennograrns of crystallised PEEK show double-melting peaks. The peaks
have been proposed to be related to a melting and recrystallization phenomenon of one
initial crystal morphology, which is characteristic of the previous crystallisation
history[1-3] or to be associated with distinct morphologies or crystals[4-6]. In this
work, the crystallinity was calculated according to the former theory and the "peak
area" method (as reviewed in ref. 7) was employed.
According to the "peak area" method, the weight per cent crystallinity X(Tl) is given
by the following equation
Where /lA is the area of the melting endotherm above the baseline between TI and T2;
TI and T2 are the temperature at the onset and completion of melting, /lHi\T2) is the
enthalpy of melting of fully crystalline polymer at T2, by carefully choosing T I and T2,
the area under the endotherms of DSC curve can be obtained. By approximating T2 to
Tm, the value of IlHf=130 J g-l given by Blundell and Osbom[2] can be used.
The results of peak area listed in Table 8.6 are the average of two sets of DSC curves.
The original data are shown in Table A-I, and a set of the DSC curves are shown in
Fig. ALl-Al.4.
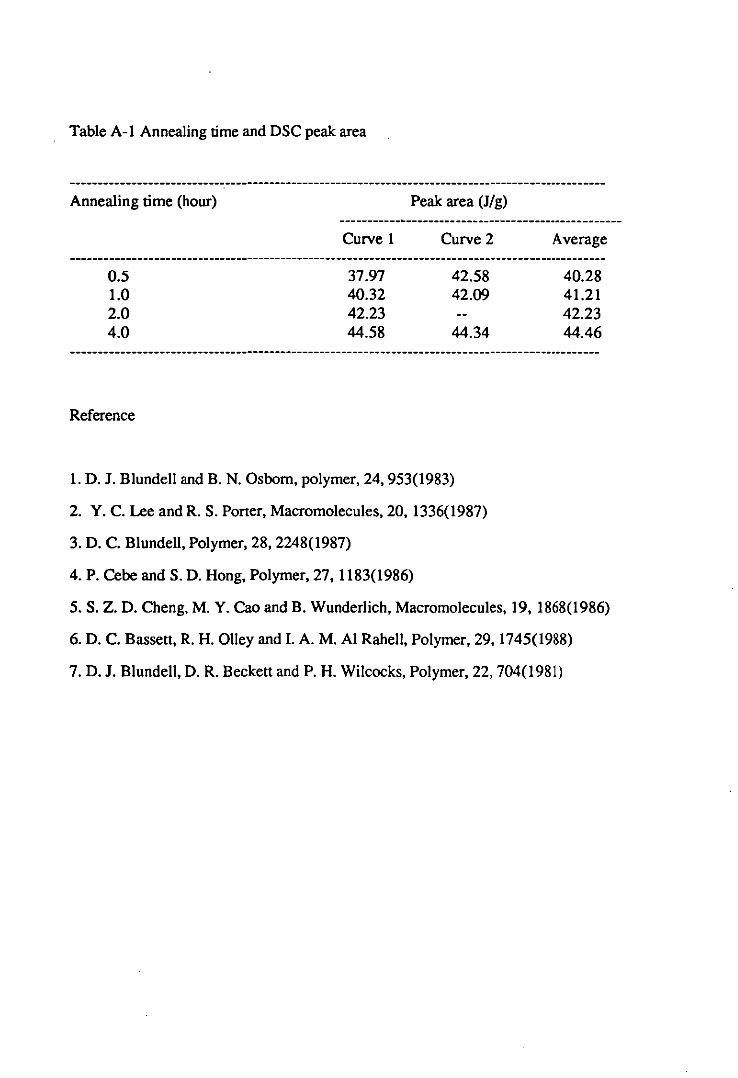
Table A-I Annealing time and DSC peak area
Annealing time (hour)
0.5 1.0 2.0 4.0
Reference
Curve 1
37.97 40.32 42.23 44.58
Peak area (JIg)
Curve 2
42.58 42.09
44.34
1. D. J. Blundell and B. N. Osbom, polymer, 24, 953(1983)
2. Y. C. Lee and R. S. Poner, Macromolecules, 20, 1336(1987)
3. D. C. Blundell, Polymer, 28, 2248(1987)
4. P. Cebe and S. D. Hong, Polymer, 27,1183(1986)
Average
40.28 41.21 42.23 44.46
5. S. Z. D. Cheng, M. Y. Cao and B. Wunderlich, Macromolecules, 19, 1868(1986)
6. D. C. Bassett, R. H. Olley and I. A. M. Al Rahell, Polymer, 29,1745(1988)
7. D. J. Blundell, D. R. Beckett and P. H. Wiicocks, Polymer, 22, 704(1981)

01
" 3: -): 0 ... l1.
.... C1l ., :I:
0.0,---------------------------------------------------------------,
-0.2
-0.4
J ~.32°C
97J/g
-0.6
-O.B
1°C
-1.0,1----~--_r----~--._--~----._--~--~----~~_.--~--__4 100 150 200 250
Temperature (OC) 300 350 400
General V4.0D DuPont 2000
Fig. Al.1 DSC curve of PEEK film annealed at the temperature of 180°C for 0.5 hour

O.O~--------------~------------------------------------------,
-0.2
CD -0.4 "-~ : ~ . ~~ .
~
): 0 .... 11.
.... -0.6l on
Q)
J:
-O.B .' " .. ~
-1. 0 I , , i 100 150 200 250 300 350 400
Temperature COC) General V4.0D DuPont 2000
Fig. A 1.2 DSC curve of PEEK film annealed at the temperature of 180°C for 2 hours

0.2,-----------------------------------------------------------,
0.0
-0.2
~
Cl "-C -0.4
319.92"C ~ Jig l: 0 ...
11.. .' -0.6 .. Q)
:r:
-O.B
-1.0
-1.2~1----~--_.----~--._--~----r_--~--_.----~--_r----~~ 100 150 200 250 300 350 400
Tempereture ("C) General V4.0D DuPont 2000
Fig. A 1.3 DSC curve of PEEK film annealed at the temperature of 180°C for 4 hours

Appendix 2 TOF-SIMS Spectra of Some Plasma Treated PEEK Films
Fig. A2.1 Positive ion spectrum of oxygen plasma treated film (Treatment condition: I
min, 500 w, 0.3 torr)
Fig. A2.2 Negative ion spectrum of oxygen plasma treated film (Treatment condition:
I min, 500 w, 0.3 torr)
Fig. A2.3 Positive ion spectrum of ammonia plasma treated film (Treatment condition:
I min, 500 w, 0.3 torr)
Fig. A2.4 Negative ion spectrum of ammonia plasma treated film (Treatment
conditiori: I min, 500 w, 0.3 torr)
Fig. A2.5 Positive ion spectrum of oxygen plasma treated film after acetone washing
(Treatment condition: I min, 500 w, 0.3 torr)
Fig. A2.6 Negative ion spectrum of oxygen plasma treated film after acetone washing
(Treatment condition: I min, 500 w, 0.3 torr)
Fig. A2.7 Positive ion spectrum of ammonia plasma treated film after acetone washing
(Treatment condition: I min, 500 w, 0.3 torr)
Fig. A2.8 Negative ion spectrum of ammonia plasma treated film after acetone
washing (Treatment condition: I min, 500 w, 0.3 torr)

~
~
c ~
c u
x
~
~
c ~
c u
120
lOO t-
eo t-
60 t-
40 t-
20
o o
50~
400 I
300
200
lOO
1" 'e 20
~r..'
220
IlL " ..Lt .
..1.. 1 " III 11. 40 60
Atomic Mass Units
"'~ .
2'0 260 Atomic Mass Units
-I
- 4l ,1,-
~ 30
~
c : c
2l
u
x
10
)-."~' .,r' "
,IU . .J.. .l ",'
0 BO 100 lOO 120 140 160
Atomic Mass Units
280 300
Fig. A2.1 Positive ion spectrum of oxygen plasma treated PEEK (Treatment condition: I min, SOO w, 0.3 torr)
IBO 200

~
~
c
" o u
~
~
~
c
" o u
350 -
300 -
250
200 -
150 -
100,- -
50
01 Ill/I!" 11, .. I ·0 20 40 60 BO 100
Atomic Mass Units
1400 I' ,
1200
1000
, " BOO
600
400
200
120 140 160 lBO 200 Atom1c Mass Units
~
~
c
" o u
~
~
c , o U
BOOO
6000
4000
2000
o 1\/ IlWA t\ A 111\ U 1\11 1\ A n A A nil J\ Illlllb\ll n 6 J\. MI\A LllV MlVllj. A A A A A 8 t\ 1\" IUVIy. Il~
40 45 ~ 55 60 65 70 75 00 B5 90 ~ 100 Atomic Mass Units
4vO
, .. 300
,,)
200
100
220 240 260 2BO 300 Atomic Mass Units
Fig. A2.2 Negative ion specuum of oxygen plasma treated PEEK (Treatment condition: 1 min, 500 w, 0.3 torr)

;)/ 101- I'U," 140 [ •
120 I. I !J'
.; 81-100 ~)
~ ~
~ u c 80 c 6 ~ ~
o 0
u 60 ~ u ;1 c' 41- 11
~ t)' ~
~
~
c ~
0
u
.. , [' Jl .-2 .,.'
20 I- ., ~J' ,;' ,;, •.• '" ,. I"~ .;;
o 0'" .. """"" •. ~ o 20 40 60 80 100 100 120 140 160 180 200
Atomic Mass Units
8001· >If'
600
400 r- ",,'
200r I,,;,
Fig. A2.3 Positive ion spectrum of ammonia plasma treated PEEK (Treatment condition: 1 min, 500 w, 0.3 torr)

1 14
250 I· l2~ I CI-lO-" :/.).
200 I- 10
'" '"
~
8 ~
""~ , 7 c
c
\
, , 0
6"- " 0 u u ",-
lOO - /.;' L •
I ~, " ", 4
" . 111111 ,. 50 I "
;: ,:1
.1'( .~~. ro-
I!; ,,' J 0 0 1
60 80 100 40 45 50 55 60 65 70 75 80 85 90 95 100 0 20 40
Alomic Mass UnIts . r Atomic Mass Units
" :
1000 -,,,
, )1 -l doaL .,.1
800 I.~ !' - 300
"' ", . "' "r ~ LI 1\(" ~
c 600 " . c
,.I' III , , 0
0
u 400
u
100 !~,II, L , d , , It .1/11 , I ~ I III 't' , . 200
120 140 160 180 200 220 240 260 280 300 Atomic Mass Units Alomic Mass Units
Fig. A2,4 Negative ion spectrum of ammonia plasma treated PEEK (Treatment condition: 1 min, 500 w, 0.3 torr)

Jl ,
'1/ ' ,"/I'
80 r I 8000·-
,--. n •
6000 ID
~ ~ c
I 11 60 I
.',"
ID
~
C
~
~ 4000 0
u -'
I11 ;\' ., . 11 , ,. 0
40 I-J}
u
'" 6; r
2001' "r' ,,' "1 'JAA 0
80 100 100
20
L,
60 20 40 . Mass Units
0
AtomlC '0
, ,.;1'
. I , A L .IA •. l, •.• I -
l. j"
120 160 180 200 140 Atomic Mass units
~~. I I
160
120 ID ~
c ~
0 80 I- !~ ?\Qf
u
40
240 260 280 300 Atomic Mass Unit~
Fig. A2.5 Positive ion spectrum of oxygen plasma treated film after acetone washing (Treatment condition: 1 min, 500 w, 0.3 torr)

160 f- I) 4000 h
" ' !(r
' ~I
" 120 3000 ~
~ LII .
c ,t ~ ~3 ~
~
0 80 c ~ 2000
u 0
" '" I u
40
J 1000 ~I IIII ';','
~r ,; 'l' I
6f
~ " !~- f;·
0 1 IIII! ml !, ml. I.! " .A
o . 20 40 60 80 100 40 45 50 55 60 65 70 75 00 85 90 95 100 Atomic Mass Units Atomic Mass Units
500 ,oB 120 L ~ \., ..
400 100 01
~
3°l
80 ~ .)d u
~
c u
~
C
0
~
"'f .>"
'~I
u 200 0
14.' IJI U
I. oI tJ
I .''11 40 "/
III JII
100 L III 20
0 120 1<0 160 180 200 2CO 220 240 260 200 300
Atomic Mass Units Atomic Mass Units
Fig. A2.6 Negative ion spectrum of oxygen plasma treated film after acetone washing (Treatment condition: 1 min, 500 w, 0.3 torr)

Fig. A2.7 Positive ion spectrum of ammonia plasma treated film after acetone washing (Treatment condition: 1 min, 500 w, 0.3 torr)

-,--------2501- ," l 7000
I I'} , 6COO
200 "
j 5000
m ~
c 15<- 40CO ~
c 0
~
U 0 3000,-100 u
~ , ,
j 20001'1111
D-' 2.-" 'be-
11 t" III .1
50 l- n ,,1"1 1,''-,-1000 ! <.0 IIlIlIJt 0 0' A "r.
c 20 40 60 eo :~o 40 45 50 55 60 65 70 75 BD 85 90 95 100 Al .. lmic "lass Unils Atomic Hass Units
'600~- In" ~ /- ); : . 500
500 L ,>I
l 400 ,:/
'""~ 1
m m
~
~ ,Cl; c 300
c ~ 300
11 r- ,)0 ~ ,
,\ ,:\ ,,·.1 0
0 u JX; u .t.' II! 290
I " ." . ...
.;)11'
100 J. JI ,~~
120 140 160 180 200 220 240 260 280 300
Atomic Mass Units Atomic Mass Units
Fig. A2,g Negative ion spectrum of ammonia plasma treated Iilm after acetone washing (Treatment condition: 1 min, 500 w, 0,3 torr)

,