plasma-assisted flame holding in ... - stanford university
TRANSCRIPT

American Institute of Aeronautics and Astronautics
1
Plasma Assisted Flame Holding in Subsonic and Supersonic Flows
W. Kim1, H. Do2, M. A. Cappelli3 and M. G. Mungal4 Mechanical Engineering Department, Stanford University, Stanford, CA, 94305-3032
In this paper, our recent studies of five different flame configurations which are assisted by nanosecond pulsed discharge (NPD) are summarized. The flow configurations are: methane jets in subsonic coflow and cross flow, supersonic hydrogen jets in cross flow with cavity and unmodified (flat plate) geometries, and laminar fully premixed methane flames. For the subsonic methane jet in coflow, it is shown that i) the flame stability is improved by ten-fold (in terms of coflow speed) with the aid of the NPD and ii) the mixture fraction at which the flame stability is maximized is much leaner than that at the flame base of a naturally stabilized flame. For the subsonic methane jet in cross flow, it is found that the optimal discharge placement rules out a region which has high strain rate and/or high concentration gradient. The preference towards a leaner mixture of the optimal discharge position shown in the jet in coflow configuration is also confirmed here. For the supersonic hydrogen jet in cross flow, a 50 % reduction of ignition delay time is observed with the NPD placed inside of a stabilization cavity. It is also shown that the supersonic flame ignition using an unmodified (flat plate) model is possible with a dual fuel jet configuration. Finally, a simple model (preflame model) of a plasma assisted fully premixed methane flame is proposed, which suggests that the central role of the plasma discharge in this case is as an in-situ reformer, not a direct radical source. The verification is carried out by 0-D/1-D discharge/flame simulations along with subsequent experimental validations including GC sampling and hydrogen/air flame analyses.
I. Introduction HE issue of flame stability is receiving renewed attention in the burning of hydrogen/hydrocarbons fuels because of the increased demand for high power combustion which can be applied to, for example, lean
combustion for low emission gas turbine/automobile engines, development of scramjet engines and the trend towards the utilization of low grade fuels for expanding the fuel base.
In this context, this paper summarizes our recent studies of pulsed, nonequilibrium plasma-activation of partially premixed subsonic flames in air co- and cross flow, partially premixed flames in supersonic cross flow1-4 and a laminar fully premixed flame.5 In the first part of the current study, we describe the flame stability improvement of a lifted methane jet in subsonic air co-/cross in the presence of nanosecond pulsed discharge (NPD) with varying electrode positions. The primary objective of this section is understanding the sensitivity of flame stability to the electrode position in the partially premixed NPD assisted flame and finding the optimal mixture fraction where the discharge might be placed to maximize the flame stability. Based on the knowledge of optimal discharge placement in the subsonic flows, the second part is dedicated to investigating plasma assisted flame ignition in a fuel jet in supersonic crossflow. In this section, the decrease of ignition delay time in the presence of discharge is discussed by igniting fuel jets with a cavity and in non-cavity (i.e. flat plate) geometries. Finally, we generalize our discussion to propose a flame stabilization mechanism of NPD assisted flames (preflame model) along with validation studies which include numerical simulations and experimental verifications. Our discussion in the final section is focused only on the laminar fully premixed configuration to eliminate additional complexities such as turbulent behavior and the spatially varying mixture fraction field in a turbulent partially premixed flame. 1 Post Doctoral Fellow. 2 Post Doctoral Fellow. 3 Professor, Mechanical Engineering Department. 4 Professor Emeritus, Mechanical Engineering Department, AIAA Associate Fellow. Also, Dean of Engineering, Santa Clara University, Santa Clara, CA 95053.
T
48th AIAA Aerospace Sciences Meeting Including the New Horizons Forum and Aerospace Exposition4 - 7 January 2010, Orlando, Florida
AIAA 2010-263
Copyright © 2010 by W. Kim , H. Do , M. A. Cappelli and M. G. Mungal . Published by the American Institute of Aeronautics and Astronautics, Inc., with permission.
Dow
nloa
ded
by S
TA
NFO
RD
UN
IVE
RSI
TY
on
Sept
embe
r 29
, 202
0 | h
ttp://
arc.
aiaa
.org
| D
OI:
10.
2514
/6.2
010-
263

American Institute of Aeronautics and Astronautics
2
Through these discussions, we suggest that i) the stability of partially premixed flames can be increased by ~ ten fold (in terms of coflow speed) when the placement of NPD is optimally chosen, e.g., in a relatively low mixture fraction region (Z/ZStoi ~ 0.65) with low strain rate and low concentration gradient, ii) ignition delay time can be reduced with the NPD by up to ~ 50 % and as a result, the ignition of a supersonic flame is possible in not only a geometrically modified configuration (cavity), but also in a carefully designed unmodified geometry (flat plate with dual fuel jets) and iii) the improvement of flame stability observed in the NPD assisted flame is eventually attributed to the in-situ reforming role of the NPD in methane flames and less directly to the formation of radicals. More detailed discussion is provided below.
II. Experimental Setup In Fig. 1, schematics of the five different flame configurations (subsonic jet in coflow, subsonic jet in crossflow,
supersonic jet in crossflow with cavity, supersonic jet in crossflow on a flat plate and with dual jets, and laminar fully premixed flow) discussed in the current study are illustrated.
Through this study, the NPD is generated between the two blunted tungsten electrodes (~ 1 mm diameter with ~ 1-3 mm separation gap) by a pulsed power supply (FID Technology SU-12 or F1112) which can typically produce ~ 6 - 10 kV peak voltage, 15-50 kHz repetition rate and ~15 ns pulse width.
For the subsonic experiment, a lifted methane jet flame is formed in a vertical wind tunnel that is 30 30 cm in its cross section and produces up to ~ 7.5 m/s flow speed. A nozzle with inner diameter of 4.6 mm is oriented parallel or perpendicular to the flow direction to produce a jet in coflow or a jet in cross flow, respectively. The typical range of methane jet speed is ~ 0.6 – 7.7 m/s. The voltage and current at the electrode is recorded with a 1000:1 high voltage probe (Tektronics P6015A) and Rogowski coil (Pearson Electronics, model 2877) respectively. In addition, we also record spectrally-resolved plasma optical emission, as a broad survey over a wide spectral window with a relatively course spectral resolution of 0.17 nm using an Ocean Optics (S2000) spectrometer, and also at a higher resolution of less than 0.1 nm with a SPEX750M spectrometer equipped with a 2000 800 pixel CCD camera. A high sampling frequency photodiode is used to detect the flame’s emission and to qualitatively confirm the presence of a flame from which its duty cycle (defined as the fraction of the total time that the flame is ignited) can be estimated.
For the supersonic experiment, the expansion tube facility developed at Stanford University is used to generate high enthalpy supersonic flows (as high as M = 9) spanning a range of hypersonic flight conditions.6,7 While a detailed description is available in Ref. 7, the expansion tube is a circular stainless steel tube of 14 cm inner diameter connected to a cylindrical dump tank. The tube has three parts divided by two diaphragms: the driver (2 m length), driven (7.3 m length) and expansion (2.8 m length) sections. A test section (30 cm × 30 cm × 30 cm) for observations and measurements is located between the expansion section and the dump tank. OH Planar Laser Induced Fluorescence (PLIF), OH emission spectroscopy and Schlieren imaging are used to visualize the OH radical distribution and to investigate the formation of compressible flow features. A Nd:YAG laser (Spectra Physics) pumped dye laser (Lumonics HD-500) generating 3 mJ per pulse at 283 nm with a 10 Hz repetition rate is used to excite the A-X(1,0) Q1(7) line of the OH molecule. The spectrally filtered laser induced fluorescence is captured by an intensified camera (Andor iStar ICCD). Spontaneous OH emission is also captured by the camera (in the absence of the laser) with a narrow band (10 nm wide) filter centered at 313 nm. Schlieren imaging is carried out with an ultra-fast framing camera (Imacon 486 intensified CCD camera) and a pulsed Xenon flash lamp (Hamamatsu Model E6611). The camera can record 8 frames at maximum frame rate of 100MHz.
As shown in Fig. 1, the supersonic experiments are carried out with two different model geometries, cavity configuration (Fig. 1c) and flat plate (Fig. 1d) with dual fuel jets which houses the fuel (hydrogen for the supersonic experiment) jet nozzle and discharge electrodes. The overall size of the flat plate is 10 cm wide, 16.5 cm long and 2 cm thick which has a sharp leading edge (22° angle) and a rectangular cavity to accommodate a ceramic sub-plate to electrically insulate the aluminum plate from the high electrode voltages. Four drilled holes in the ceramic plate (which is oriented to be parallel to the flow direction) serve to provide access to two flushed nozzles (2 mm inner diameter) and two flushed electrodes (0.8 mm diameter tungsten rods). Fuel is injected through the two nozzles – the first, or secondary, upstream oblique nozzle (inclined at 30° from the surface normal towards the downstream direction) generating a subsonic jet, and the second, or primary transverse nozzle 26 mm downstream of the oblique nozzle, generating a sonic transverse jet. In general, a much larger portion of the fuel is injected through the transverse sonic jet nozzle. The cathode and anode are positioned 10 mm and 16 mm respectively, downstream of the oblique jet nozzle. The overall geometry of the model for the cavity configuration is identical with the flat plate model, but it has a single oblique jet (1 mm diameter and 30° angled from the horizontal plane) and a 21 mm long and 3 mm deep cavity which accommodates the discharge electrodes separated by 3 mm, and aligned in the
Dow
nloa
ded
by S
TA
NFO
RD
UN
IVE
RSI
TY
on
Sept
embe
r 29
, 202
0 | h
ttp://
arc.
aiaa
.org
| D
OI:
10.
2514
/6.2
010-
263

American Institute of Aeronautics and Astronautics
3
streamwise direction. The upstream electrode is used as the cathode and is positioned 8 mm downstream of the front step of the cavity.
For the fully premixed experiments, a premixed methane/air mixture is delivered to a swirl stabilized meso-scale array burner8 containing thirty six 2.4 mm diameter swirlers. The overall burner diameter is 44 mm. A detailed description of this particular meso-scale burner is given in Ref. 8. The burner flow velocity is determined by measuring the pressure and volume flow rate while the control of equivalence ratio is carried out by use of critical flow orifices.
In the premixed study, we carried out quantitative measurements of NO, H2 and CO concentrations as well as OH emission and PLIF imaging (as described earlier) are made within the preflame region, which, as described further below, is a weakly luminous region coinciding with the portion of the flow that passes through the discharge
c)
D = 3 mm
21 mm
25°
Electrodes
Jet Nozzle
30°Supersonic
Air Crossflow
Subsonic Air Crossflow
Electrodes
Jet Nozzle
d)
Upstream Jet Nozzle
60°
Downstream Jet Nozzle
Electrodes
Supersonic Oxygen Crossflow
Premixed Flow
Electrodes
a)
Air Coflow
Electrodes
Jet Nozzle
b) e)
Figure 1. Schematics of five flame configurations observed. a) Subsonic methane jet in coflow, b) subsonicmethane jet in cross flow, supersonic hydrogen jets in cross flows c) with cavity geometry and d) dual jetson flat plate, and e) laminar fully premixed flame.
Dow
nloa
ded
by S
TA
NFO
RD
UN
IVE
RSI
TY
on
Sept
embe
r 29
, 202
0 | h
ttp://
arc.
aiaa
.org
| D
OI:
10.
2514
/6.2
010-
263

American Institute of Aeronautics and Astronautics
4
plasma. This region can be centimeters in length, and can be visible to the eye, particularly at sufficiently low equivalence ratios, when the main methane/air flame is well below the lower flammability limit (LFL) and not ignited. NO measurements are made by collecting gas samples with an uncooled 0.8 mm diameter quartz probe and delivering these to an NO chemiluminescence analyzer (Thermo Environmental, 42H). H2 and CO measurements are carried out by gas chromatography (Agilent, 3000 Micro GC) with a packed zeolite column (5Å molecular sieve) using a sampling probe identical to that used in the NO measurement and with argon as the carrier gas.
III. Results
A. NPD Assisted Partially Premixed Subsonic Jets in Coflow 1. A brief observation of flame stability improvement The current understanding of the stabilization mechanism of a natural lifted jet flame (not plasma assisted) is that
of a leading edge flame of triplet character for both laminar and turbulent jets, which implies that the flame base is anchored instantaneously at a triple point of three branches where a competition occurs between the flame propagation speed and the local flow velocity.9,10 This perspective matches well to our previous observations in which the lifted flame base is located in a flow field where the local flow velocity is two to three times that of the laminar flame speed (SL).11 The natural lifted jet flame is thus considerably more difficult to stabilize at velocities exceeding 2~3SL of coflow velocity (VCO) regardless of velocity of the jet.12 Thus, in the current section, we use coflow velocity and jet velocity as the main metrics against which the degree of improvement of discharge-assisted flame stabilization is evaluated.
The dramatic enhancement in flame stabilization due to the application of the NPD is summarized in Fig. 2a and compared to those due to two other representative non-equilibrium discharges, single electrode corona discharge (SECD) and dielectric barrier discharge (DBD) (see Ref. 2 for the detailed description of these discharges). For a given normalized coflow velocity, VCO/SL, the jet velocity at which the flame blows off is plotted, and the stable region is the region under the curves. As shown, use of the NPD extends the coflow velocity stability limit by nearly ten-fold and this improvement is quite significant in comparison with the case of SECD (~ 25 %) and DBD (~ 100 %). The improvement is clear even in the case of impure fuel (20 % nitrogen, 80 % methane) as shown in the black squares in Fig. 2a. The photographs shown in Fig. 2b are examples of methane flames that are stabilized by the NPD. It is apparent that the flame base is unusually distorted due to the high strain rate caused by the high coflow velocity (~ 5SL,, 10SL and 20SL). In the stretched flamebase, we observed that the flame emission characteristic is noticeably different from that of the flame downstream, which may imply that the chemistry at those two
Figure 2. a) The improvement of liftoff jet velocity as a function of normalized coflow speed. Stability limits are extended to 2.5SL, 3SL
and 20SL with SECD, DBD and NPD, respectively. The input P-P voltage is 9.35 kV and the frequency is 30 kHz in SECD and DBD, while NPD uses 6 kV and 15 kHz of frequency. The electrode position is fixed at 10 diameters downstream. b) Sample photographs of a NPD stabilized lifted methane jet flame. The coflow speed of each case is 5SL (left), 10SL (middle) and 20SL
(right).
a)
b)
Dow
nloa
ded
by S
TA
NFO
RD
UN
IVE
RSI
TY
on
Sept
embe
r 29
, 202
0 | h
ttp://
arc.
aiaa
.org
| D
OI:
10.
2514
/6.2
010-
263

American Institute of Aeronautics and Astronautics
5
regions are not identical. We will discuss this issue in detail in the last part of the results section. 2. Optimal discharge placement It is well known that the location where a lifted jet flame is naturally stabilized is closely related to the
distribution of a specific fuel/air mixture fraction. For example, Joedicke et al.10 showed that the average position of a naturally stabilized lifted flame base is located on the region of approximately stoichiometric fuel/air mixture fraction (Z/ZStoi = 1.14).
To investigate the mixture fraction conditions at optimal discharge placement in physical space we surveyed physical space by translating the electrode while collecting spectral emission data, and compared the emission from that of a fully premixed environment of known equivalence ratio. Since the direct measurement of mixture fraction in a turbulent diffusion flame is non-trivial, we exploit an advantage of the discharge emission spectra change when local mixture fraction varies. Figure 3a compares a typical NPD discharge emission spectrum in a pure air jet to that of a methane/nitrogen jet in a coflow of air. For both the pure air and the methane/nitrogen jet, most of the plasma-excited emission features are attributed to excited molecular nitrogen. However, in the case of the methane/nitrogen jet, we see strong cyanide (CN) emission near 388 nm and CH and C2 emission near 430 nm and 450 – 550 nm respectively. The plasma excitation spectrum serves to distinguish between methane containing and non-methane containing jets, forming the basis for our quantitative determination of mixture fraction in diffusion flames.
Figure 3b compares the emission intensity of CN near 388 nm to that of N2 near 337 nm as a function of jet radial position for various NPD discharge voltages, for the case of a pure methane jet in an air coflow. For this particular case, the jet velocity and normalized coflow velocity is 14 m/s and 1.5 m/s respectively. This graph indicates that the emission intensities of CN and N2 are monotonically varying functions of radial position, with the CN signature diminishing as the jet boundary is approached, in contrast to the increased signal from N2. The ratio of CN to N2 intensity can thus be used as an indicator of mixture fraction, when appropriately calibrated. While the relative CN signal provides a measure of methane component, the normalization by N2 provides a reference that accounts for possible differences in collection discharge volumes, and in power dissipation. The intensities are also dependent on discharge peak voltage and frequency requiring these discharge conditions be reproduced in the calibration of the intensity ratios (discussed below) against known mixture fraction conditions.
Figure 4a illustrates the measured variation in the flame duty cycle with placement of the discharge along the jet radius. For these results, the discharge was at a fixed axial position of x = 8.5d, and the discharge voltage and pulse frequency was 6 kV and 15 kHz respectively. Also shown in the figure is the corresponding measured CN/N2 emission intensity ratio. It appears that the optimal electrode placement (corresponding to maximum duty cycle) is approximately 1.6d outward from the center of the jet at this discharge condition and axial location. At this location, the CN/N2 intensity ratio is found to be 0.25. It is expected that the placement for maximum flame duty cycle will also vary with axial location, however, the CN/N2 intensity ratio corresponding to any optimal discharge position is unaffected and found to be 0.25.
In order to interpret these findings, a calibration is needed to determine the absolute mixture fraction that corresponds to a value of 0.25 in the CN/N2 intensity ratio. This calibration is performed with fully premixed flow (using a separate burner) where the CN/N2 ratio is measured as a function of equivalence ratio for various voltages and pulse repetition frequency. The results of this calibration are shown in Fig. 4b. The voltage and frequency
Figure 3. a) Emission spectra of various jet mixtures. b) Emission intensities of nitrogen (337 nm) and CN(388 nm) as a function of discharge position along the radial direction obtained at x/d=8.5 with 6 kV and 15kHz USRD. The jet Reynolds number is 4000.
a) b)
Dow
nloa
ded
by S
TA
NFO
RD
UN
IVE
RSI
TY
on
Sept
embe
r 29
, 202
0 | h
ttp://
arc.
aiaa
.org
| D
OI:
10.
2514
/6.2
010-
263

American Institute of Aeronautics and Astronautics
6
calibration conditions for the results of Fig. 4a are given by the black solid line in the figure. The measured CN/N2 ratio of 0.25 is seen to correspond to very lean conditions (Z/Zst ~ 0.65) in contrast to that of a conventional lifted jet flame, where the flame base seems to be at conditions of (Z/Zst = 1.14), i.e., closer to stoichiometric conditions.
B. Partially Premixed Subsonic Jets in Cross Flow 1. A preliminary observation of flame stability improvement Photographs of an attached burning JICF, a lifted burning JICF without the NPD and a lifted burning JICF with
the NPD, are shown in Fig. 5 for comparison. In all cases, the camera exposure time is 1/20 sec. The x (parallel to the initial jet injection direction), y (parallel to the cross flow direction), and z coordinates (perpendicular to the x and y coordinate) also shown in the figures, with the origin located at the center of the nozzle exit. For the photograph shown in Fig. 5a, the jet and crossflow speeds are 8 m/s (Red = 2300) and 0.6 m/s, respectively, such that
the square root of the momentum ratio )2/()2( ujujR ~ 10, with representing the density, u, the speed,
and the subscripts j and the jet and crossflow conditions, respectively. Apparent in Fig. 5a are two important features. First, the flame in the vicinity of nozzle at the windward side experiences liftoff or local extinction away from the jet nozzle. This is also true even with use of a hydrogen pilot flame13 at higher flow speeds. It is believed that the flame extinction in the vicinity of the windward region is mainly due to the high strain rate caused by the crossflow. Second, the flow patterns between upstream and downstream regions have clear differences. The upstream (near field) trajectory is similar to that of an axisymmetric free jet while the flow downstream (far field) is affected by the recirculation effect of the crossflow. Finally, although it is not clearly seen from the picture, it is also known that most upstream region (1d – 2d from the nozzle14) of the near field forms the potential core of the jet.
With increasing jet and crossflow speeds (and without the NPD again), the partially attached jet is lifted off as shown
Figure 4. a) Flame duty cycle co-plotted with CN/N2 ratio. The discharge and flow conditions and electrodelocation are identical to those of Fig. 3. The optimal position of the discharge corresponds to CN/N2 = 0.25. b) CN/N2 ratio in a fully premixed environment. The premixed flow speed is 0.5 m/s. CN/N2 = 0.25 corresponds to 0.65 equivalence ratio under premixed conditions.
Figure 5. Three photographs of the jet in crossflow. a) Nozzle attached. uj = 8 m/s (Red = 2300, where nozzle diameter d is 4.6 mm), u∞ = 0.6 m/s, R ~ 10. b) Lifted jet. uj = 14 m/s (Red = 4000), u∞ = 1.5 m/s, R ~ 7. c) NPD attached jet. Flow condition is identical to b). Discharge has 6 kV peak voltage and 15 kHz repetition rate in case c). The orientation of the 0.5 mm diameter, 0.8 mm separation platinum electrodes are parallel to z direction. The discharge locations is x/d = y/d = 3 on a plane z = 0. The exposure time is 1/20 sec. for every picture shown.
a) b) c)
a) b)
Dow
nloa
ded
by S
TA
NFO
RD
UN
IVE
RSI
TY
on
Sept
embe
r 29
, 202
0 | h
ttp://
arc.
aiaa
.org
| D
OI:
10.
2514
/6.2
010-
263

American Institute of Aeronautics and Astronautics
7
in Fig. 5b. In this particular case, the jet and crossflow speeds are 14 m/s (Red = 4000) and 1.5 m/s, respectively, such that R is ~ 7. It is noteworthy that the lifted flame eventually experiences blowout when the crossflow speed is higher than ~ 2 m/s for this jet speed at normal injection. In the presence of a 6 kV peak voltage, 15 kHz repetition rate NPD, as shown in Fig. 5c (all flow conditions identical to that of Fig. 5b), the flamebase is pulled back to the vicinity of the discharge, which, for this case, is located at x = 3d and y = 3d on the z = 0 plane. The observation that the flamebase is stabilized at a more upstream region which has faster flow speed in comparison to the no discharge case (Fig. 5b) preliminarily confirms the significant effect of the discharge on enhancing flame stability.
As mentioned earlier, we observed that the stability enhancement of flames is an extremely sensitive function of discharge placement. Therefore, a more comprehensive survey of the response of the flame to discharge placement will be provided below.
2. Representative discharge scanning and optimal discharge placement Scans of duty cycle along a line x = 4d, x = 8d, and y = 3d on a plane z = 0 are provided in Fig. 6a, as blue
(triangle), red (square) and black (diamond) curves, respectively. The duty cycle is defined as the fraction of the total time that the flame is ignited. The scan ranges are -1d to 5d along the y direction and 1.5d to 10d along the x direction. Similar to the scanning result in jet in coflow configuration, result shows that there exists a significant variation in the duty cycle between the windward (zero duty cycle) and leeward (non-zero duty cycle) sides. We attribute the low duty cycle on the windward side to the presence of a significant strain rate, concentration fluctuation, and a high concentration gradient – characteristics that are expected to be less significant on the leeward side, resulting in a non-zero duty cycle in that region. More specifically, comparing scans along the x = 4d and x = 8d lines, we find low (but non-zero) duty cycles (~ 0.03 0.02) along the former, and high duty cycles (up to unity) along the later line. This high duty cycle is also reached for scans line y = 3d (x = 4d to x = 6.5d). The decrease in duty cycle beyond x = 6.5d is attributed to the placement of the electrode in an excessively fuel rich region.
Despite seemingly adverse conditions, flame ignition and stabilization is sometimes possible with electrode placement on the windward side. This is illustrated in Fig. 6b, for a scan along the x direction with y = 1.5d and z = 0. Here we find a relatively wide plateau with unity duty cycle for x > 15.5d. In this region, the strain rate in the velocity field is now diminished, and the concentration gradient is alleviated by the augmented mixing with the crossflow of air.
Fig. 6c presents scans of electrode positioning along the z direction for x = 4d (triangles) and x = 8d (squares) with y = 3d. The results are consistent with the scans of Fig. 6b, i.e., (i) the duty cycle for scans with x = 4d is very low (~ 0.02) as the electrodes cross regions of the flow where there are significant adverse flow conditions, and (ii) the duty cycle for scans with x = 8d is somewhat modest, generally increasing with increased values of z. It is noteworthy that in this more downstream location, there is more intermittency in the duty cycle, which we associate with local fluctuations associated with the presence of a large scale vortex structure. At a position of y = 3d, the discharge traverses a counter-rotating vortex pair common to this flame configuration. Within this counter-rotating vortex pair, the discharge encounters intermittency in the instantaneous scalar field.14,15
The scans of the electrode placement and resulting flame duty cycle suggest that factors that diminish the effectiveness of the discharge on igniting and stabilizing the flame include: (i) gradients in the scalar concentration field, (ii) fluctuations in the scalar field, and (iii) significant strain in the velocity field.
Finally, it is worthwhile to note that the discharge placements
Figure 6. Duty cycles as a function of discharge locations along x, y and z coordinates. Flow conditions are uj = 51 m/s (Red = 14400), u∞ = 7.7 m/s, R ~ 5 while discharge conditions are 6 kV peak voltage and 15 kHz repetition rate.
a)
b)
c)
Dow
nloa
ded
by S
TA
NFO
RD
UN
IVE
RSI
TY
on
Sept
embe
r 29
, 202
0 | h
ttp://
arc.
aiaa
.org
| D
OI:
10.
2514
/6.2
010-
263

American Institute of Aeronautics and Astronautics
8
which give maximum duty cycle also reside ~ 0.22 - 0.25 CN/N2 ratio (defined earlier), i.e., ~ 0.63 - 0.65 Z/ZStoi, which is similar to jet in coflow configuration in the previous section. As noted earlier, this mixture fraction is much leaner than a stoichiometric methane/air flame.
We attribute this observed difference to three phenomena: (i) the higher energy coupling to the flow in leaner regions, as we observe that there is no discharge when the electrode is placed in the jet core; (ii) the greater cross section for electron dissociation of methane, which produces more radicals (e.g., H) which can subsequently react with molecular oxygen to produce OH, an important initiator of combustion; and (iii) inherent intermittency of the flow whereby the discharge excites both instantaneous concentration regions and entrained air regions which together comprise the local mean mixture fraction. These conjectures would, however, require further investigation.
C. Partially Premixed Supersonic Jets in Cross Flow 1. Supersonic flame ignition in a cavity geometry Figure 7 shows a set of time sequential OH PLIF images, each separated by 40 μs, depicting the time evolution
of an auto-ignited (no plasma assisted) hydrogen flame in a cavity. The flow conditions are T(static) ~ 1330 K, h0 ~ 2.9 MJ/kg (cross flow), M ~ 2.6 (cross flow), R ~ 2. The time t = 0 μs is used for reference, corresponding to the beginning of the test time. While one general observation of Fig. 7 is that the flame does not appear to penetrate deep into the freestream flow, the first ignition event is observed to appear on the back wall of the cavity at 80 μs and propagates both towards the front of the cavity and towards the freestream flow, which suggests that the cavity flame ignition delay time is approximately 80 μs. The ignition delay time referred to here (τign) includes the mixing time and the time attributed to the kinetics of combustion reactions. The cavity flame is ignited due to the high enthalpy of the freestream flow. The high enthalpy appears to be sufficient to initiate combustion under this flow condition (the static temperature in the cavity and the boundary layer approaches the stagnation temperature of the freestream flow which typically exceeds 2000 K). This condition is referred to as auto-ignition. A flame cannot be auto-ignited if the flow residence time (τres) in the cavity is shorter than τign.
Time sequential OH PLIF images presented in Fig. 8 depict the effect of the plasma on the cavity flame, through a reduction of τign of the hydrogen jet flame inside the cavity. The images are taken in the presence of the pulsed plasma at the same freestream flow condition as in Fig. 7. A comparison of Fig. 7 and Fig. 8 reveals two differences. The flame inside the cavity is clearly ignited at about 40 μs in the presence of the plasma, whereas it is seen to ignite at about 80 μs without the plasma (Fig. 7), indicating that τign is shortened by approximately 40 μs due to the plasma. An inspection of the images also reveals that the cavity flame initiates at the plasma region between two electrodes (two black solid lines) at the bottom of the cavity in the 40 μs panel in Fig. 8, which implies that the plasma ignition is faster than the auto-ignition observed on the back wall of the cavity in Fig. 7 at 80 μs. As a result, the cavity flame that is ignited earlier propagates faster and deeper into the freestream flow compared to the auto-ignited flame. Even though it is not shown here (see Ref. 3 for a detailed description), our simulation result using Bolsig (to calculate initial radical yields from the pulsed plasma) and Cantera (to simulate subsequent reaction kinetics under perfectly
Figure 7. Time sequential OH PLIF images in the absence of a plasma separated by 40 s with asupersonic crossflow and a hydrogen jet (R~ 2.1).
Dow
nloa
ded
by S
TA
NFO
RD
UN
IVE
RSI
TY
on
Sept
embe
r 29
, 202
0 | h
ttp://
arc.
aiaa
.org
| D
OI:
10.
2514
/6.2
010-
263

American Institute of Aeronautics and Astronautics
9
stirred reactor assumption) shows that the reduction of τign here is due to the fact that the pulsed plasma serves as a radical (H, O and OH) source in the cavity producing dissociated and excited species by high energy electron impact. The central role of radicals here is attributed to i) high temperature in the cavity region (~ 1330 K) and ii) short time scale of interest (~ 100 μs) in the current experiment. Later, on the contrary, we will address the central role of stable intermediate species, H2 and CO, resulting from hydrocarbon fuels in a relatively lower flow enthalpy environment (subsonic flow with reactant in room temperature).
2. Supersonic flame ignition in a flat plate geometry In this section, we show a representative case of flame ignition of a hydrogen jet in supersonic pure oxygen cross
flow (M = 2.3, T = 1500K) using an unmodified geometry (flat plate) with dual jets (upstream subsonic jet and downstream main sonic jet) configuration. It is clear that the unmodified geometry has a benefit in that it will not introduce undesirable shockwaves due to flow disturbances since the generated shockwaves are a primary source of stagnation pressure loss. Figure 9 represents typical OH PLIF images taken in the absence of a NPD pulse (Fig. 9a), and 1 s after a NPD pulse (Fig. 9b) under this higher enthalpy condition. In both cases, both the upstream and downstream hydrogen jets are activated with R ~ 0.32 and R ~ 1.4, respectively. We see that a small, fragmented OH region is apparent on the windward side of the main jet, in Fig. 9a, suggesting the presence of a weak, auto-ignited downstream jet flame. In contrast, in the presence of the NPD, there is a more intense OH region distributed over a wider area at both the windward and leeward sides of the downstream jet, confirming the existence of a
Figure 8. Time sequential OH PLIF images in the presence of a plasma separated by 40 s with a hydrogenjet (R ~ 2.1).
Figure 9. OH PLIF images taken a) without, and b) with the pulsed discharge.
a) b)
Dow
nloa
ded
by S
TA
NFO
RD
UN
IVE
RSI
TY
on
Sept
embe
r 29
, 202
0 | h
ttp://
arc.
aiaa
.org
| D
OI:
10.
2514
/6.2
010-
263

American Institute of Aeronautics and Astronautics
10
stronger jet flame that appears to propagate into the supersonic crossflow. Clearly, the ignition and stabilization of this flame is only achieved by use of the NPD under these flow conditions. We believe that the presence of the downstream jet served to produce a region rich in plasma activated species (as mentioned in the previous section) just upstream of, and around, this fuel jet. Examining the PLIF images of Fig. 9, we see that combustion is clearly taking place in this region and the flame extends well into the freestream, suggesting that this region in front of the bow shock, may serve to pilot the resulting jet flame.
The nature of the post-discharge flow field and its interaction with the associated shock structure is believed to play an important role in the flame ignition mechanism. A superposition of typical pulsed Schlieren images with the PLIF ground state OH images of Fig. 9, assist in understanding this relationship by revealing interesting flow features. These superimposed images are presented in Fig. 10. Fig 10a, combines a typical Schlieren image with the PLIF image (discharge off) of Fig. 9a, while Fig. 10b, combines the same Schlieren image with the PLIF image (discharge on) of Fig. 9b.
We see from Fig. 10a that there is evidence of an auto-ignited flame just behind the bow shock where we expect the pressure and temperature to be elevated by the shockwave. Note however, that there is no detectable OH in the leeward side of the jet where the fuel and crossflow are expected to be relatively well mixed in the jet wake.16 It seems that despite this auto-ignition behind the bow shock, the flame is marginally stable, and does not propagate into the freestream to consume a significant fraction of the jet fuel. This is contrasted with the case in the presence of the discharge, illustrated in Fig. 10b. In the presence of the NPD, we see that the flame is auto-ignited behind the bow shock, but it is attached to the strong combustion region in front of the bow shock, and we also find that there is evidence of even stronger OH signals in the leeward side of the jet in comparison to the windward side, signifying the presence of combustion in the jet wake. The results of the discharge-off case indicate that the auto-ignition is triggered by the shockwave, and it is very likely that even with the discharge plasma activation, the strength of the shock may be an important parameter in determining auto-ignition conditions. As mentioned above, the shockwave raises the temperature and pressure, notably, in the region adjacent to the boundary of hydrogen and oxygen in the windward side. Importantly, the NPD triggered pilot in the recirculation region in front of the bow shock appears to penetrate across the shockwave into this marginally auto-ignitable mixture, and seems to be directly connected to the post-shock jet flame (see region highlighted by the white circle in Fig. 10b). It is also possible that the strong combustion occurring in the leeward side of the jet is also partially dependent on the production of this plasma-activated pilot flame, as the species in this upstream region can flow around the bow shock, and also can traverse the shock and flow around the jet to penetrate into the hydrogen/oxygen mixture in the leeward side.
Thus far, we have shown representative examples of the degree to which flame stability and the reduction of ignition delay time in the partially premixed subsonic and supersonic environment can be enhanced by the NPD. Hereafter, we generalize our discussion to address the question of just how does the plasma increase the flame stability. For simplicity, the discussion in the next section will be only focused on fully premixed, low enthalpy flows.
D. Preflame Model of Plasma Assisted Fully Premixed Flame
Figure 10. Schlieren images overlapped with the OH PLIF images: a) without, and b) with the pulsed discharge.
a) b)
Dow
nloa
ded
by S
TA
NFO
RD
UN
IVE
RSI
TY
on
Sept
embe
r 29
, 202
0 | h
ttp://
arc.
aiaa
.org
| D
OI:
10.
2514
/6.2
010-
263

American Institute of Aeronautics and Astronautics
11
It is well known that the NPD can significantly extend the lean flammability limit (LFL) of fully premixed flame.17 In this section, we introduce the concept of the preflame, a stream of long-range, stable intermediate species, to describe a mechanism for the LFL extension.
1. Identification and characterization of the preflame Figure 11a is a typical time averaged (with one second exposure time) photograph of an ultra lean ( ~ 0.53)
methane/air premixed flame resulting from a 50 kHz pulse repetition rate, 6 kV peak voltage NPD. The premixed methane/air mixture (speed of approximately 1 m/s) flows through a hollow quartz cylindrical section and a small portion of it passes through the region between the electrodes (bright white spot in the photograph) to eventually sustain the ultra lean flame represented by the overall blue emission (referred to here as the main flame) seen in the figure. A close inspection of the flame emission reveals an unusual white colored emission (to the naked eye) inside the main flame, which we refer to as the preflame; a region that we believe is directly affected by the discharge kinetics. This white emission is first seen at a slightly lower equivalence ratio (~ 0.04 less than the main flame ignition), depending on the peak voltage and the frequency of discharge, and becomes more intense with increasing equivalence ratio. Spectroscopic characterization of this preflame region indicates that this emission is associated with the A2Σ+ → X2 electronic transition of excited OH (OH*), in the vicinity of 309 nm. In contrast, the blue emission from the main flame is due to A2→ X2 CH electronic transition near 431 nm. Figure 11b shows the filtered (and expanded) image in the spectral region of 309 nm, with the discharge operating at 15 kHz (all other conditions similar to Fig 11a). The filtered image is dominated by strong emission from preflame zone (highlighted by the red square). The strength of the emission at this wavelength, from the preflame region, is typically 10 – 30 times that of the main flame. The preflame region extends downstream of the discharge by nearly a centimeter, corresponding to a convective time scale of several milliseconds. This convective time scale is much longer than the recombination time scale of radicals generated directly by the discharge. We conjecture that the long lived preflame is evidence of the existence of persistent chemistry that is induced by the plasma that ultimately facilitates the combustion of the ultra lean methane-air mixture that bypasses the discharge. This mechanism of plasma enhanced combustion will be discussed in detail in the sections below. Another interesting observation that can be made by examination of the figure is that the main flame seems to be piloted from a specific region of the preflame (qualitatively identified by the red dot in the figure) and subsequently propagates from that region. This qualitative observation further suggests that the preflame (which is a consequence of the discharge), and not radicals generated directly by the discharge especially in this low enthalpy flow, serves to ignite and sustain the combustion of the ultra lean surrounding flow.
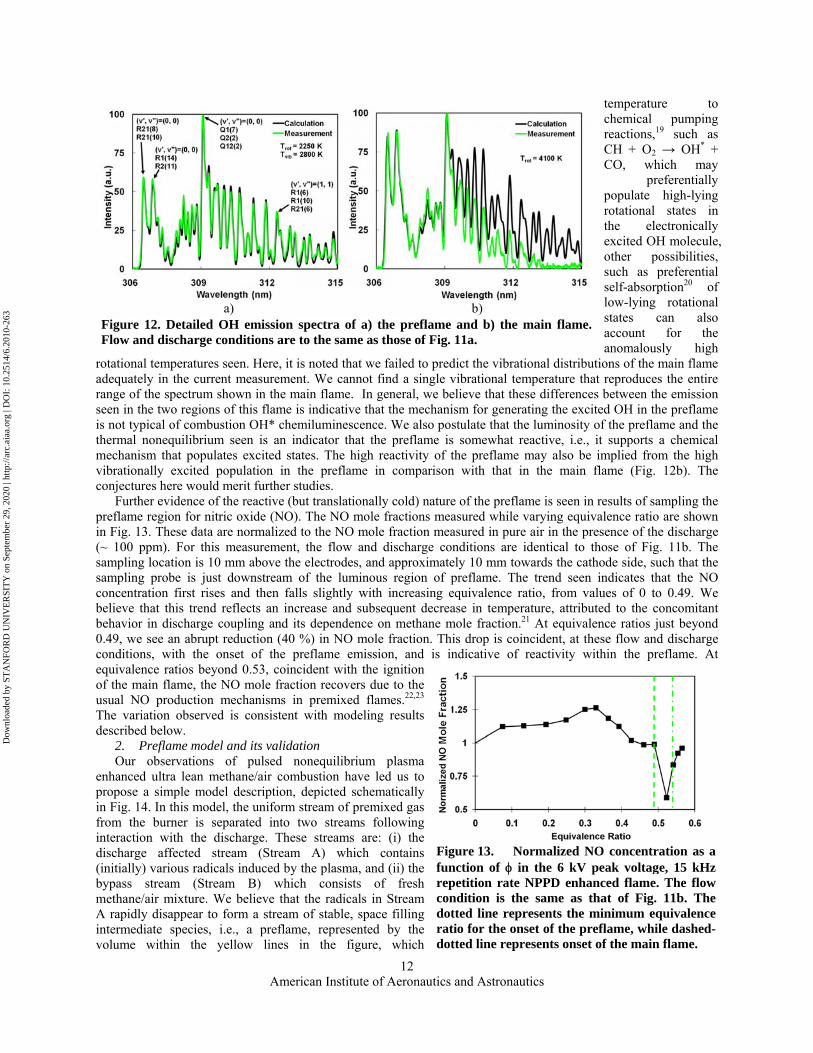
In Figs. 12a and 12b, detailed emission spectra of the A2Σ+ → X2 transition taken from the preflame and the main flame, respectively, are compared for flow and discharge conditions similar to those of Fig. 11a. The features in these spectra allow us to qualitatively and quantitatively compare their respective rotational and vibration temperatures. To aid in this comparison, we employ LIFBASE.18 We see that the preflame is readily simulated with rotational and vibrational state populations in accordance with a Boltzmann temperature of 2250 K and 2800 K, respectively. These temperatures are much higher than the estimated translational temperature of ~ 500 K, suggesting that there is a fair degree of nonequilibrium, responsible in part for the emission seen, likely due to yet unresolved chemiluminescence reactions. By comparison, the rotational temperature (4100 K) determined by the emission from the main flame is even higher than that of the preflame. Such high excited-state OH rotational temperatures are not uncommon in flames, even at atmospheric pressure.19 While some attribute this high apparent rotational
Figure 11. a) Time averaged (one second exposure) NPD (6 kV peak voltage and 50 kHz repetition rate) assisted methane/air premixed flame. The red dotted lines represent the visible boundary of the preflame. b) OH emission image of 6 kV peak voltage, 15 kHz repetition rate NPD stabilized flame. The dotted square represents a visible preflame region and the dotted arrows show the direction of main flame propagation conjectured from this image. In both cases, the initial flow velocity is ~ 1 m/s and the initial equivalence ratio is 0.53.
a) b)
Dow
nloa
ded
by S
TA
NFO
RD
UN
IVE
RSI
TY
on
Sept
embe
r 29
, 202
0 | h
ttp://
arc.
aiaa
.org
| D
OI:
10.
2514
/6.2
010-
263
American Institute of Aeronautics and Astronautics
12
temperature to chemical pumping reactions,19 such as CH + O2 → OH* + CO, which may
preferentially populate high-lying rotational states in the electronically excited OH molecule, other possibilities, such as preferential self-absorption20 of low-lying rotational states can also account for the anomalously high
rotational temperatures seen. Here, it is noted that we failed to predict the vibrational distributions of the main flame adequately in the current measurement. We cannot find a single vibrational temperature that reproduces the entire range of the spectrum shown in the main flame. In general, we believe that these differences between the emission seen in the two regions of this flame is indicative that the mechanism for generating the excited OH in the preflame is not typical of combustion OH* chemiluminescence. We also postulate that the luminosity of the preflame and the thermal nonequilibrium seen is an indicator that the preflame is somewhat reactive, i.e., it supports a chemical mechanism that populates excited states. The high reactivity of the preflame may also be implied from the high vibrationally excited population in the preflame in comparison with that in the main flame (Fig. 12b). The conjectures here would merit further studies.
Further evidence of the reactive (but translationally cold) nature of the preflame is seen in results of sampling the preflame region for nitric oxide (NO). The NO mole fractions measured while varying equivalence ratio are shown in Fig. 13. These data are normalized to the NO mole fraction measured in pure air in the presence of the discharge (~ 100 ppm). For this measurement, the flow and discharge conditions are identical to those of Fig. 11b. The sampling location is 10 mm above the electrodes, and approximately 10 mm towards the cathode side, such that the sampling probe is just downstream of the luminous region of preflame. The trend seen indicates that the NO concentration first rises and then falls slightly with increasing equivalence ratio, from values of 0 to 0.49. We believe that this trend reflects an increase and subsequent decrease in temperature, attributed to the concomitant behavior in discharge coupling and its dependence on methane mole fraction.21 At equivalence ratios just beyond 0.49, we see an abrupt reduction (40 %) in NO mole fraction. This drop is coincident, at these flow and discharge conditions, with the onset of the preflame emission, and is indicative of reactivity within the preflame. At equivalence ratios beyond 0.53, coincident with the ignition of the main flame, the NO mole fraction recovers due to the usual NO production mechanisms in premixed flames.22,23 The variation observed is consistent with modeling results described below.
2. Preflame model and its validation Our observations of pulsed nonequilibrium plasma
enhanced ultra lean methane/air combustion have led us to propose a simple model description, depicted schematically in Fig. 14. In this model, the uniform stream of premixed gas from the burner is separated into two streams following interaction with the discharge. These streams are: (i) the discharge affected stream (Stream A) which contains (initially) various radicals induced by the plasma, and (ii) the bypass stream (Stream B) which consists of fresh methane/air mixture. We believe that the radicals in Stream A rapidly disappear to form a stream of stable, space filling intermediate species, i.e., a preflame, represented by the volume within the yellow lines in the figure, which
Figure 12. Detailed OH emission spectra of a) the preflame and b) the main flame.Flow and discharge conditions are to the same as those of Fig. 11a.
Figure 13. Normalized NO concentration as a function of in the 6 kV peak voltage, 15 kHz repetition rate NPPD enhanced flame. The flow condition is the same as that of Fig. 11b. The dotted line represents the minimum equivalence ratio for the onset of the preflame, while dashed-dotted line represents onset of the main flame.
a) b)
Dow
nloa
ded
by S
TA
NFO
RD
UN
IVE
RSI
TY
on
Sept
embe
r 29
, 202
0 | h
ttp://
arc.
aiaa
.org
| D
OI:
10.
2514
/6.2
010-
263

American Institute of Aeronautics and Astronautics
13
eventually serves to ignite the outer bypass Stream B. An “inner flame” (depicted by the yellow line in the figure) is supported at the boundary between the preflame and surrounding flow. The products of this inner flame diffuse outwards and serve as means of stabilizing the combustion of the ultra-lean bypass stream, generating the strong blue emission seen visually. This flame is referred to here as the “outer flame,” and is depicted as a blue line in the figure. In all, this model contains three reactive regions: i) the low temperature, preflame formed by the discharge; ii) the higher temperature inner flame directly ignited by the preflame at its boundary, and iii) the second higher temperature outer flame formed by the discharge bypass stream facilitated by the product gas from the inner flame.
We have carried out zero and one dimensional discharge/flame simulations using Bolsig,24 the Penetrante model,25 PREMIX and OPPDIF26 to evaluate the ability of this model to explain some general observations seen in the experiments. While the detailed description of the simulation procedure is provided in Ref. 5, we only provide here sample results of the simulation.
Figure 15 shows the variation of temperature (solid line), major radical concentrations (dotted line) and major intermediate species concentrations (dashed-dotted line) along the Stream A coordinate, which are calculated by the PREMIX code with the initial radical seeding. The conditions of these calculations are 400 K discharge translational temperature as measured in the discharge kernel,2 300 Td reduced electric field in the discharge region (nominal value at 1 atm pressure and 400 K temperature), 10 W average discharge power (typical discharge power at 6 kV peak voltage and 15 kHz repetition rate observed in the experiment), 1 mm electrode separation with 1 mm2 effective plasma area, and 1 m/s initial premixed gas speed of equivalence ratio of = 0.53. From the figure, one can see that the mixture temperature gradually increases along the streamline coordinate from the 400 K initial temperature, which is to the assumed discharge kernel temperature, to ~ 600 K. This temperature increase agrees reasonably well with the measurements of approximately 500 K. Here, it is noteworthy that over 95 % of the temperature increase is observed within a 0.1 mm streamwise distance from the discharge, which implies that most of the mild exothermic reactions are completed in that short distance. To differentiate, we refer to the region of increasing temperature in this preflame (< 0.1 mm) as the discharge near-field, and the region of nearly uniform temperature (> 0.1 mm) as the far-field.
From the figure, one sees that the mole fraction of major radicals such as H, O, and OH diminish to less than 0.1 % of their maximum values in the near-field, which implies that the direct supply of radicals from the discharge is a short range phenomenon. The mole fractions of intermediate species such as H2, CO and C2H6, however, stay relatively constant in the near-field and increase slightly in the preflame far-field. Within about 1 mm, the flow is dominated by these relatively stable species, suggesting that the preflame observed in the experiments is essentially a stream of partially oxidized hydrocarbons rich in CO and H2. The preflame calculations carried out for slightly lower equivalence ratio, = 0.49 are qualitatively similar, with slightly lower (by 5%) mole fractions of CO and H2, and a nearly identical far field temperature. However, it appears that this small difference in preflame composition affects the onset of outer flame ignition as shown below.
Figure 16 depicts the temperature profile and the CH radical mole fraction computed along the OPPDIF (transverse) coordinate, representing, in a practical sense, the outward radial direction from the center of the preflame, for two different equivalence ratios, 0.49 (no flame ignited) and 0.53 (flame ignited). For these simulations, the composition of product gas
Figure 14. A schematic interpretation of theflame structure.
Figure 15. Temperature and representativespecies concentration profiles along thepreflame at 0.53 equivalence ratio, 300 Tdreduced electric field, 1 m/s initial flow speed,and 10 W average discharge power.
Dow
nloa
ded
by S
TA
NFO
RD
UN
IVE
RSI
TY
on
Sept
embe
r 29
, 202
0 | h
ttp://
arc.
aiaa
.org
| D
OI:
10.
2514
/6.2
010-
263

American Institute of Aeronautics and Astronautics
14
and the temperature calculated at a 1 mm preflame height, which is a representative location of the preflame far-field, feeds one stream of the OPPDIF calculation while the other (opposed) stream consists of fresh methane/air mixture at 1 atm pressure and 300 K temperature. The separation between the two streams is chosen to be 1 cm in accordance with the transverse flame length scale of the experiments. We see that for = 0.53, there is a significant temperature increase (~ 1600 K), which represents the ignition of the main (both inner and outer) flame at this equivalence ratio. It is also noteworthy that when ignited, the simulation predicts a dual (high temperature) flame structure as seen in the two peaks of CH concentration, where the combustion of the outer unactivated stream (outer flame) is stabilized by the combustion products of the inner discharge-stabilized stream (inner flame). This observation is consistent with our model previously described in Fig. 14.
Figure 17 shows the variation in the calculated NO mole fraction along the preflame coordinate (Fig. 17a) and the transverse main flame coordinate (Fig. 17b) for a 0.53
equivalence ratio in the initial mixture. The presence of the discharge immediately produces a significant amount of NO (~ 680 ppm at 10-6 cm distance along the preflame coordinate). Additional NO production (~ 680 – 880 ppm) is also observed in the near-field of the preflame probably due to a slight rise in temperature and subsequent radical recombination reactions. In the preflame far-field (especially up to 1 mm from the discharge), the trend is reversed; the NO mole fraction is reduced from ~ 880 ppm to ~ 500 ppm. It is noteworthy that this NO destruction (by ~ 43 %) is in reasonable agreement with our experimental observation shown in Fig. 13, namely ~ 40 % destruction of the NO mole fraction concomitant with preflame ignition, which is primarily attributed to the reaction NO + N → O + N2 based on our reaction path analysis. The NO mole fraction increases again with the main flame ignition as shown in Fig. 17b. The peak NO increases to ~1300 ppm in this case, due to the high temperature of the inner and outer flames. This increase in NO generated by the main flame corresponds qualitatively to the increased NO measurement seen in Fig. 13, once the main flame is ignited.
A pseudo-sensitivity analysis was carried out to better understand the role played by individual species generated in the preflame, on the ignition and stabilization of the premixed flame. The detailed procedure used is described in Ref. 5 and the results of this analysis are shown in Fig. 18. As a benchmark, the Tig.min, a measure of species’ contribution to improve a flame stability, when there are no species removed from the preflame products (Tig.min (NONE)) is approximately 490K. When H2 or CO is removed from the preflame products, the minimum temperature required for flame ignition increase by 130 K and 65 K, respectively. This increase is found to be much greater than any other contributions (most of which have negligible impact on Tig.min), suggesting that H2 and CO
Figure 16. Temperature and CH profilesalong the transverse (OPPDIF) direction. TheCH peak represents the expected location ofthe high temperature flames. The initialconditions are the same as those of Fig. 15.
Figure 17. NO concentrations along a) axial and b) transverse coordinates. Equivalence ratio is 0.53. Theinitial conditions correspond to those of Fig. 15.
a) b)
Dow
nloa
ded
by S
TA
NFO
RD
UN
IVE
RSI
TY
on
Sept
embe
r 29
, 202
0 | h
ttp://
arc.
aiaa
.org
| D
OI:
10.
2514
/6.2
010-
263

American Institute of Aeronautics and Astronautics
15
play a central role in flame ignition. The importance of H2 and CO in this plasma-enhanced flame stabilization is quite intriguing, as H2 and CO are
major species in hydrocarbon reforming processes.27 It seems then that the primary role of the discharge plasma when applied to an ultra lean methane/air premixed flame is that of an in-situ fuel reformer especially in the current low enthalpy flow condition. The simulations carried out here suggest that under our experimental conditions, approximately 10 % of the initial methane is reformed into H2 and CO.
As an experimental validation of above simulation, we carried out H2 and CO sampling measurement from the visual center of preflame using gas chromatography. The measurements confirm that both H2 and CO are present in the preflame, both increasing with increasing discharge voltage and frequency. H2 is found to increase dramatically, from 110 to 440 ppm when the voltage is increased from 6 to 8 kV (and from 130 to 300 ppm with increasing frequency). Correspondingly, the CO increases from 960 to 2100 ppm (and from 570 to 1640 ppm with increasing frequency). It is noteworthy that these measured values are significantly lower than those predicted by the simulations (which are in the range of 5000 – 7000 ppm for either species). This quantitative disagreement is most likely due to the three-dimensional nature of the experiment, which includes partial dilution from the surrounding mixture.
The experimental and numerical studies described in this section suggest that the H2 and the CO in the preflame (the reformed species from methane in the presence of the NPD) enhance the stability of the ultra lean premixed methane flame. One can surmise that a similar result might be obtained for other hydrocarbon flames. If indeed, the stability relies on the reforming of the hydrocarbon into hydrogen, then a natural conclusion might be that an extension in the flame stability should be seen with hydrocarbon/air flames, but that little benefit, if any, would be seen in the use of these relatively low power discharges to stabilize hydrogen/air flames.
Our results prompted us to carry out preliminary studies of flame stability enhancements in hydrogen. Experiments were carried out at slightly higher discharge voltages (17kV) and lower flow speeds (0.35 m/s). Experiments were repeated with methane/air flames at these conditions. With methane/air flames, we found a 10% enhancement of blowout limit in the presence of discharge (from approximately = 0.45 to 0.4). In contrast, no significant reduction was seen in the blowout limit for the hydrogen/air flame (the equivalence ratio for the limit was found to be about 0.14, in both cases). It is noteworthy that similar extensions in the blowout limit of fully premixed methane/air flames (from approximately = 0.45 to 0.40) have been seen by the direct addition of small amounts (~4000 ppm) of hydrogen to the fuel mixture28 – a finding that further supports our conjecture that the pulsed nonequilibrium discharge acts as an in-situ reformer of the hydrocarbon fuel.
IV. Conclusions In this paper, our recent studies of five different flame configurations (methane jets in subsonic co-/cross flow,
supersonic jets in cross flow with cavity and unmodified (flat plate) geometries and laminar fully premixed flame) which are assisted by nanosecond pulsed discharge (NPD) were summarized. For the methane jets in subsonic coflow experiment, using the NPD, we have found that the partially premixed flame is stable in coflow velocities of up to twenty times the laminar flame speed, a ten fold improvement in comparison with the no discharge case. A survey on physical locations of the optimal discharge placement and their common mixture fraction was performed for this flame configuration. The result suggested that i) the flame stability of this partially premixed configuration is a highly sensitive function of discharge placement and ii) the mixture fraction at the optimum discharge placement corresponded to Z/Zstoi ~ 0.65, i.e., conditions that are much leaner than those at the flame base of a naturally stabilized flame.
Figure 18. Results of pseudo-sensitivity analysis. Alonger bar implies a greater effect on main flameignition. The initial conditions correspond to those ofFig. 16.
Dow
nloa
ded
by S
TA
NFO
RD
UN
IVE
RSI
TY
on
Sept
embe
r 29
, 202
0 | h
ttp://
arc.
aiaa
.org
| D
OI:
10.
2514
/6.2
010-
263

American Institute of Aeronautics and Astronautics
16
For the methane jets in subsonic crossflow, a similar spatial survey to determine the optimal discharge placement was carried out. While the optimal positions do not include regions with high strain rate and high concentration gradient, it was confirmed that a plasma assisted partially premixed flame is stabilized in the leaner region (Z/Zstoi ~ 0.65) in comparison to a conventional flame.
For the supersonic jet in cross flow experiment, the use of the cavity in conjunction with a NPD resulted in the noticeable reduction of the ignition delay time (by ~ 40 s) of the mixture within the cavity for a range of flow conditions. For the flat plate geometry, a combination of a subsonic and sonic hydrogen jets were injected into a pure oxygen supersonic free stream flow. Here, the fuel injection nozzles and electrodes were flush with the surface of a flat, sharp leading edge plate oriented to be parallel to the flow to minimize stagnation pressure losses associated with generated shockwaves. It appeared that the upstream subsonic jet produces an oxygen/hydrogen mixture that when activated by the plasma, is convected towards the downstream main sonic jet, interacting with the bow shock formed by this jet to produce a combustion region that pilots the formation of a jet-flame, even under conditions of marginal stability.
In the fully premixed experiment, we have showed that H2 and CO generated in a stream of discharge activated species, plays a central role in enhancing the stability of a plasma enhanced ultra lean premixed methane flame. This activated stream (preflame) is dominated by its visible white emission attributed to electronically excited OH. The characteristics of this preflame were studied in more detail by spectral OH emission and NO sampling. The OH emission spectra revealed that the preflame region is rotationally and vibrationally hot in comparison to the translational temperature. NO sampling measurements indicated that the NO initially generated by the discharge is consumed in the preflame region which can be further evidence of the reactive preflame.
A model for this pulsed nonequilibrium discharge plasma-assisted fully premixed combustion was proposed. The model structure presumes that the preflame pilots the eventual combustion of the stream of premixed fuel that has passed through the discharge, producing an inner flame. The products of this inner flame diffuse outwards to stabilize the combustion of the surrounding premixed flow that bypasses the plasma. A numerical simulation using the 1D flame codes, PREMIX and OPPDIF, confirms the structure proposed by the model, as well as our experimental observations. A subsequent pseudo-sensitivity analysis indicated that the flame stability is most sensitive to the concentration of H2 and CO, both products of this reforming process occurring in the preflame. The presence of H2 and CO was confirmed by gas chromatographic measurements.
The significance of this reforming mechanism was confirmed by direct measurements of the plasma-induced extension of the blowout limit of the burner used in this study. We observed that in methane/air flames, the limit is extended by more than 10%. Similar studies in premixed H2/air indicated little or no discernable difference is induced by the presence of the discharge, at the voltage levels considered, which confirms the central role of H2 and CO in the plasma assisted flame.
Acknowledgments This work is sponsored by the AFOSR/MURI Program – Experimental/Computational Studies of Combined-
Cycle Propulsion: Physics and Transient Phenomena in Inlets and Scramjet Combustors with Julian Tishkoff as the Technical Monitor. The authors thank C. F. Edwards for providing access to the meso-scale burner array, C. T. Bowman for providing access to the gas chromatograph, and to A. Bardos, M. Bak and S. Im for assistance with the measurements.
References 1Kim,W., Do, H., Mungal, M. G., and Cappelli, M. A., “Optimal Discharge Placement in Plasma-assisted Combustion of a
Methane Jet in Cross Flow,” Combustion and Flame, Vol. 153, 2008, pp. 603-615. 2Kim,W., Do, H., Mungal, M. G., and Cappelli, M. A., “Plasma-discharge Stabilization of Jet Diffusion Flames,” IEEE
Transactions on Plasma Science, Vol. 34, 2006, pp. 2545-2551. 3Do, H., Cappelli, M. A., and Mungal, M. G., “Plasma Assisted Cavity Flame Ignition in Supersonic Flows,” Combust.
Flame (submitted). 4Do, H., Mungal, M. G., and Cappelli, M. A., “Jet Flame Ignition in a Supersonic Crossflow Using a Pulsed Nonequilibrium
Plasma Discharge,” IEEE Transactions on Plasma Science, Vol. 36, 2008, pp. 2918-2923. 5Kim,W., Mungal, M. G., and Cappelli, M. A., “The Role of In-situ Reforming in Plasma Enhanced Ultra Lean Premixed
Methane/air Flames,” Combustion and Flame, doi:10.1016/j.combustflame.2009.06.016 (published online), 2009. 6Heltsley,W. N., Snyder, J. A., Cheung, C. C., Mungal, M. G., and Hanson, R. K., “Combustion Stability Regimes of
Hydrogen Jets in Supersonic Crossflow,” 43rd AIAA/ASME/SAE/ASEE Joint Propulsion Conference and Exhibit, Cincinnati, OH, 2007, AIAA 2007-5401.
Dow
nloa
ded
by S
TA
NFO
RD
UN
IVE
RSI
TY
on
Sept
embe
r 29
, 202
0 | h
ttp://
arc.
aiaa
.org
| D
OI:
10.
2514
/6.2
010-
263

American Institute of Aeronautics and Astronautics
17
7Heltsley, W. N., Snyder, J. A., Houle, A. J., Davidson, D. F., Mungal, M. G., and Hanson, R. K., “Design and Characterization of the Stanford 6 inch Expansion Tube,” 42nd AIAA/ASME/SAE/ASEE Joint Propulsion Conference and Exhibit, Sacramento, CA, 2006, AIAA 2006-4443.
8S. Lee, M. Svrcek, C.F. Edwards, C.T. Bowman, “Mesoscale Burner Arrays for Gas-turbine Reheat Applications,” Journal of Propusion and Power, Vol. 22, No. 2, 2006, pp 417–424.
9Ko, Y. S., Chung, S. H., Kim, G. S., and Kim, S. W., “Stoichiometry at the Leading Edge of a Tribrachial Flame in Laminar Jets from Raman Scattering Technique,” Combustion and Flame, Vol. 123, No. 3, 2000, pp. 430–433.
10Joedicke, A., Peters, N., and Mansour, M., “The Stabilization Mechanism and Structure of Turbulent Hydrocarbon Lifted Fflames,” 30th International Symposium on Combustion, Chicago, IL, 2004, pp. 901–909.
11 Han, D. and Mungal, M. G., “Observation on the Transition from Flame Liftoff to Flame Blowout,” 28th International Symposium on Combustion, Edinburgh, U.K., 2000, pp. 537–543.
12Muñiz, L. and Mungal, M. G., “Instantaneous Flame-stabilization Velocities in Lifted Jet Diffusion Flames,” Combustion and Flame, Vol. 111, No. 1/2, 1997, pp. 16–31.
13Hasselbrink, E. F. and Mungal, M. G., “Observations on the Stabilization Region of Lifted Nonpremixed Methane Transverse Jet Flame,” Proceedings of the Combustion Institute, Vol. 27, 1999, pp. 1167–1173.
14Smith, S. H. and Mungal, M. G., “Mixing, Structure and Scaling of the Jet in Crossflow,” Journal of Fluid Mechanics, Vol. 357, 1998, pp. 83–122.
15Su, L. K. and Mungal, M. G., “Simultaneous Measurements of Scalar and Velocity Field Evolution in Turbulent Crossflowing Jets,” Journal of Fluid Mechanics, Vol. 513, 2004, pp. 1– 45.
16Fay, J. E. and Rossmann, T., “Mixing Measurements of Transverse and Oblique Sonic Jets in Supersonic Cross Flow,” 44th AIAA Aerospace Science Meeting and Exhibit, Reno, NV, 2006, AIAA 2006-1230.
17Starikovskaia, S. M., “Plasma Assisted Ignition and Combustion,” Journal of Physics D: Applied Physics, Vol. 39, 2006, pp. R265–R299.
18LIFBASE, Software Package, Ver. 1.5, SRI International, Menlo Park, CA, 1999. 19Gaydon, A. G. and Wolfhard, H. G., Flames, their structure, radiation, and temperature, 3rd ed., Chapman & Hall, London,
1970. 20Broida, H. P., “Effects of Self-Absorption on Rotational “Temperatures” of OH in Flames,” Journal of Chemical Physics,
Vol. 21, 1953, pp. 1165–1169. 21Kim, W., Do, H., Mungal, M. G., and Cappelli, M. A., “Investigation of NO Production and Flame Structure in Plasma
Enhanced Premixed Combustion,” Proceedings of Combustion Institutes, Vol. 31, 2007, pp. 3319–3326. 22Bowman, C. T., Pollutants from Combustion C. Vovelle ed., Kluwer Academic Publishers, Dordrecht, Netherlands, 2000,
pp. 123-144. 23Warnatz, J., Maas, U., and Dibble, R.W., Combustion, Springer, Berlin, Germany, 2001, pp. 237–256. 24BOLSIG, Software Package, Kinema Research & Software, Monument, CO. 25 Penetrante, B. M., Hsiao, M. C., Merritt, B. T., Vogtlin, G. E., Wallman, P. H., Neiger, M., Wolf, O., Hammer, T., and
Broer, S. “Pulsed Corona and Dielectric-barrier Discharge Processing of NO in N2,” Applied Physics Letter, Vol. 68, 1996, pp. 3719–3721.
26CHEMKIN, Software Package, Release 4.0, Reaction Design Inc., San Diego, CA, 2004. 27Higman, C. and van der Burgt, M., Gasification, Elsevier Science, Burlington, 2003. p. 1. 28Schefer, R. W., “Hydrogen Enrichment for Improved Lean Flame Stability,” International Journal of Hydrogen Energy,
Vol. 28, No. 10, 2003, pp. 1131–1141.
Dow
nloa
ded
by S
TA
NFO
RD
UN
IVE
RSI
TY
on
Sept
embe
r 29
, 202
0 | h
ttp://
arc.
aiaa
.org
| D
OI:
10.
2514
/6.2
010-
263