plasma water and 51cr edta equilibration volumes of different tissues in the rat
TRANSCRIPT
Acta Physiol Scand 1980. 110: 53-57
Plasma water and 51Cr EDTA equilibration volumes of different tissues in the rat
M. LARSSON, L. JOHNSON. G. NYLANDER and U . OHMAN Department of Surgery, Karolinska Hospital, Stockholm, Sweden
LARSSON, M.. JOHNSON, L.. NYLANDER, G. & OHMAN, U . Plasma water and V r EDTA equilibration volumes of different tissues in the rat. Acta Physiol Scand 1980. 110: 53-57. Received 28 Nov. 1979. ISSN 00014772 . Department of Surgery, Karolinska Hospital. Stockholm, Sweden.
The EDTA space and the plasma water volume of the whole animal and selected tissues were investigated with constant EDTA infusions of different duration in the rat. The calculated EDTA space increased with the duration of the infusion both in the whole animal and the tissues sampled. The plasma water volume remained constant. and therefore the calculated increase of the EDTA space suggests a slow intracellular accumulation of the tracer. As intracellular accumulation of EDTA increases with experimental time, it is necessary to use as short an experimental interval as possible to reduce this error when determining extracellular fluid volumes. K e y 1 i w - h : EDTA. extracellular space, isotopes, animal experiments
The extracellular fluid volume is measured by tracer dilution techniques, where the marker dif- fuses throughout the extracellular fluid without migrating into the cells. Such an ideal substance has not been found. EDTA has been chosen as a con- venient substance for studies of the extracellular fluid volume (Bernard & Biron 1971, Bohne et al. 1968, Brading & Jones 1969, Virgilio et al. 1970, Volf et al. 1971). It is almost completely eliminated through the kidneys (Ahrens & Aronson 1971. Brochner-Mortensen et al. 1969, Downes & McDonald 1964, Foreman et al. 1953, Foreman & Tmjillo 1954, Garnett et al. 1967. Lachine et al. 1976, Prpic 1967) with only an insignificant fraction being metabolized (Volf et al. 1971, Foreman et al. 1953, Foreman & Trujillo 1954, Havlicek et al. 1968) or bound to plasma proteins (Bohne et al. 1968, Volf et al. 1971, Garnett et al. 1967, Stacy & Thorburn 1966). We have recently investigated EDTA tracer kinetics in the extracellular fluid in the rat (Larsson et al., unpublished data). It was found that the rapid renal elimination of the tracer substance made space studies unreliable but when this renal loss was excluded, the EDTA space could be determined with more precision. This latter mod- ification, however, involved a surgical procedure which in itself might bias the results.
The aim of the present study was to estimate the extracellular fluid volume and the plasma water volume of different tissues in the rat using "'Cr EDTA and It51 human serum albumin as tracers. A constant infusion of EDTA was used to compensate for renal losses and to achieve a stable concentra- tion of the tracer. To test the hypothesis of a slow but steady intracellular penetration of EDTA, we chose to vary the duration of the constant infusion.
METHODS Male albino Sprague-Dawley rats weighing approximately 250 g were used. They were kept in the laboratory under standardized conditions for at least one week before the expts. The animals fasted for 12-18 h prior to the expts. but received water ad libitum.
The rats were anesthetized with Pentothal Sodium (Ab- bott) intraperitoneally, 5.0 mg/100 g b.wt. The left carotid artery and the right jugular vein were cannulated with Wnebore catheters, the former for blood sampling and blood pressure registration (Siemens-Elema 746 pressure transducer and Siemens-Elema Mingograf 803 multi- channel writer), the latter for tracer injections.
A commercial solution of W r EDTA in isotonic saline (Behringwerke AG, Marburg) with a concentration of 37 MBqlml was used. Of this solution 0. I m1/100 g b.wt. was given as a bolus dose followed by a constant infusion (syringe pump model 352, Sage Instruments) with 35% of the bolus dose diluted to I ml and infused at a rate of 1
Arra Phvsiol Smnd. 110
54 M. Larssori rt crl.
Table I . Nirtnber trnd body ic'eight in the experi- merifrrl grorrps. Metrn k S.D.
n Body weight (g)
60 rnin infusion 23 90 min infusion 2 I
120 min infusion 20
245f25 261f39 254f50
ml/h. Infusions of 60, 90 and 120 rnin were given. Three rnin before the end of the infusion period a bolus dose of 0.1 ml/lOOg b.wt. of an 1251 human serum albumin solution (130 kBq/ml) was given i.v.
Immediately following the end of the EDTA infusion, the animals were sacrificed and the following tissues sam- pled: lung, liver, spleen, gastric fundus and antrum, small and large intestine, omental and subcutaneous fat, skin and skeletal muscle. The tissue specimens were im- mediately weighed wet and thereafler counted in a gamma scintillation detector (Selektronik model 54-22). From a representative number of experiments selected tissues were sampled in triplicate enabling the error of the method to be calculated.
The following formula was used to calculate the tissue spaces of the tracers:
v,=s,/s, where V,= volume of distribution in tissue @I/@, S,= concentration of tracer in whole tissue (pg/g). S,= con- centration of tracer in plasma water (pg/pI). The plasma water volume was attained from the plasma volume by using the factor 0.929 (Altman & Dittmer 1961).
The EDTA space of the whole animal can be calculated from the biological half life of the tracer, the rate of the constant infusion and the concentration of the tracer in plasma water in the steady-state for EDTA that ensues when the renal losses of the tracer are balanced by the constant infusion (Moore et al. 1968). The following for- mula was used:
V=(I X T i X 1.44)lSp
where V= EDTA space of the whole animal, I= intake (=output) of the tracer, T,=biological half life of the tracer, Sp=concentration of tracer in plasma water.
Conventional statistical methods and tables (Armitage 1971) were used. Inter-group and intra-group mean values were compared according to Student's r-test for indepen- dent and dependent observations. When the variances differed considerably, the mean values were compared using the r-test described by Welch (Welch 1947). The method errors were calculated with analysis of variance. Values are given as mean and the standard deviation.
RESULTS
Table 1 gives the number and body weight of the animals in the different experimental groups.
L- .
90 120
Llnr ... 1
60 90 120
Splnn ,
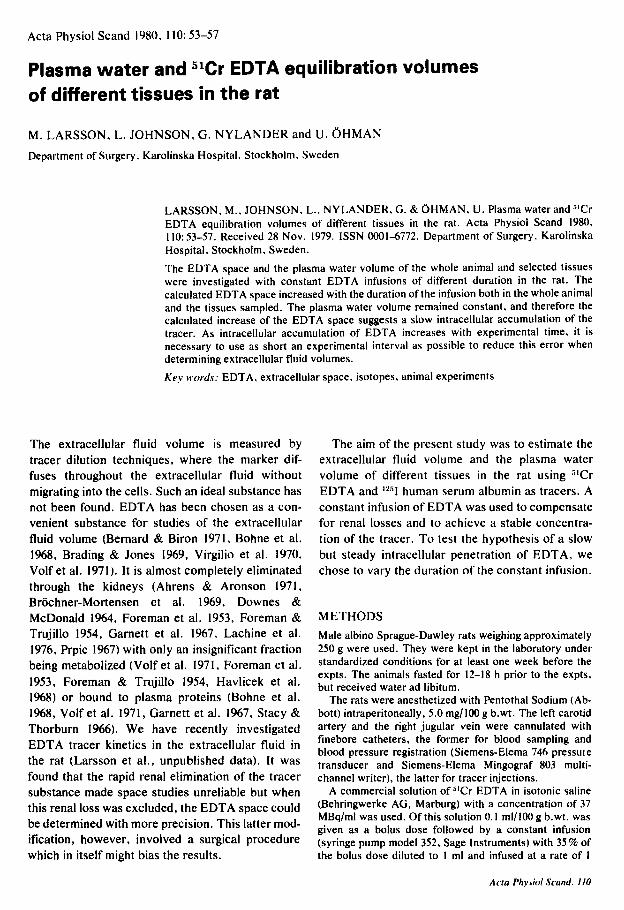
Fig. 1. Plasma water volume (hatched area) and EDTA space of lung, liver and spleen after EDTA infusion of different duration. Mean f S.D. Statistically significant differences are indicated : * (P<0.05), ** (P<O.OI), *** ( P <O.OOI).
In Table 2 initial and final blood pressure, plasma water volume and EDTA space at the end of each experimental period are presented. The blood pres- sure values and the plasma water volumes in each group were the same, while the EDTA space in- creased with the duration of the infusion time. This difference was significant between the 60 min and the 120 rnin groups. In Table 3 the error of the method for estimating
the volumes of plasma water and EDTA space in selected tissues is presented.
In Figs. 1-4 histograms are presented showing the plasma water and EDTA equilibration volumes for all the tissues. Compared with the 60 min values the plirsmu ivater volrrme tended to decrease in most of the tissues after 90 min EDTA infusion. This decrease was, however, significant only in the spleen (P<0.02) , the large intestine (P<0.05) and skeletal muscle (P<0.02) . The liver, however, in- creased its plasma water volume (P<0.05).
A"t,"rn
60 90 120
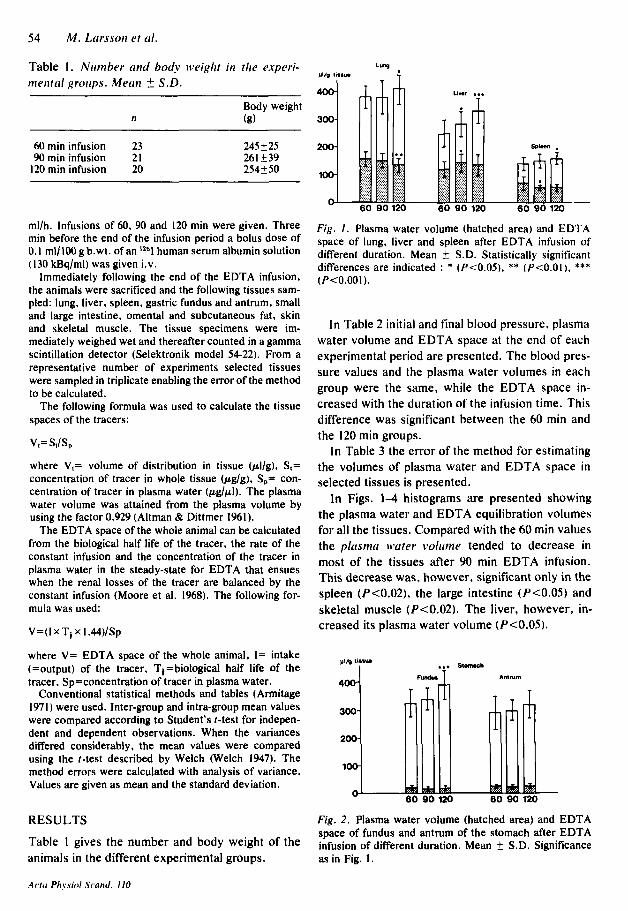
Fig. 2. Plasma water volume (hatched area) and EDTA space of fundus and antrum of the stomach after EDTA infusion of different duration. Mean f S.D. Significance as in Fig. 1.

EDTA spice of dij'ferent tissircs 55
Table 2. Blood pressure (mmHg) . plusma uuter voliirne (m1/100 g b.wt.) cind EDTA spcice (mll100 g b.lt>t.) in the e.rperimentrrl groups. Meriri k S.D.
Initial blood Final blood Plasma water EDTA pressure pressure volume space
60 rnin infusion l32+ 16 128f 19 3.65f0.55 24.4f6.7 90 rnin infusion l 2 5 f l 2 131f13 3.44f0.42 26.2 f 7 . 8
I20 rnin infusion 127f 15 122f14 3.42f0.57 28.6f7.0 (60 min vs. 120 min. P<0.05)
Table 3. Absolute citid re1Litii-e metirod error in tile detertiiinrition of plosma ltwter d i m e and EDTA spcice in Iring, liver and spleen
Lung Liver Spleen
Plasma Plasma Plasma water EDTA water EDTA water EDTA volume space volume space volume space
Number of animals (3 samples per animal) 23 20 24 21 24 22
S.D. (all samples), pllg tissue 33 59 37 56 6.2 21 Mean (all samples), pl/g tissue 153 385 143 283 51 1 40
Absolute method error, pllg tissue 14 29 15 18 2.5 8.3 Relative method error. % 9.2 7.5 10.5 6.4 4.9 5.9
Comparing the 120 min and 60 min groups, only the lung showed a significant reduction in its plasma water volume (P<O.Ol) .
The 90 rnin values of the EDTA spuce for all the tissues were greater than at 60 rnin although only the liver (P<0.05) and the large intestine (P <0.01) reached statistical significance.
At 120 rnin an increase of the EDTA space was noted for all the tissues except the skeletal muscle, failing to reach significance only in the antral part of the stomach and the omental fat.
Cob"
t..
io 90 120
0rn.d.l 1.1
io 90120
Fig. 3. Plasma water volume (hatched area) and EDTA space of small intestine, colon and omental fat after EDTA infusion of different duration. Mean f S.D. Sig- nificance as in Fig. 1.
DISCUSSION
lntracellular accumulation of a tracer results in a higher calculated tracer space volume which is re- lated to the experimental time. The EDTA space of the experimental animals tended to increase with the length of the experimental time, the 120 rnin value being 17% greater than the 60 rnin value. A probable explanation is that intracellular accumula- tion of EDTA has occurred in proportion to the time of exposure.
subcutuur*ls "119 LIT.".
230 1 100
I*
i0 90 120
Shin
li io 9(
..
Fig. 4. Plasma water volume (hatched area) and EDTA space of subcutaneous fat, skin and skeletal muscle after EDTA infusion of different duration. Mean ? S.D. Sig- nificance as in Fig. 1.
Acta Physiol Scand. 110 ,

56 M. Lnrsson et d.
The plasma water volume of the whole animal was unaffected by the length of experimental time and gave consistently normal results in all three groups (de Boer et al. 1975).
The results concerning the plasma water volume of the tissues should be regarded with some caution since variations could be attributed, in part, to a variable blood loss during the process of dissection (Everett et al. 1956). The determination of the plasma water volume serves in this study mainly as a control to answer the following question: Is any observed change of the EDTA space due to a change of the plasma water volume and thus possi- bly an artifact'?
The estimation of the method error shows that only a small degree of the total variance in the calculation of plasma water and EDTA equilibra- tion volumes depends on imperfect tissue sampling, sample weighing and isotope counting. However, the differences between tissue samples from the same organ of the same animal contribute a greater part of the total variance, while the major portion is due to the biological variation between animals.
Relating the volume of plasma water or EDTA space to the wet weight of the tissue sample causes that any observed change in comparison to the con- trol value will be calculated as a lower figure than the real one, assuming no concomitant change in the other fluid volumes. If. for example. the EDTA space decreases from 250 to 200 pllg tissue (real reduction), no change occurring in other fluid com- partments, the calculated reduction of the EDTA space will be from 250 (=250 plll OOO mg tissue) to 21 1 pI/g tissue (=200 p1/950 mg tissue).
The EDTA space in different tissues showed a uniform tendency to increase with the duration of the EDTA infusion. The increase at 90 min com- pared to the 60 min values, was 14% in the liver and 18% in the large intestine. After 120 min infusion the enlargement of the EDTA space was 34% in the liver, 22 76 in the gastric fundus, 33 % in the large intestine (P<O.OOI), 18% in the small intestine, 30% in the skin (P <0.01), 10% in the lung, 13% in the spleen and 17% in the subcutaneous fat (P<0.05). The increments of the EDTA space can not be explained by changes in the plasma water volume.
The enlargement of the EDTA space in the liver is of particular interest since this could be due to EDTA excretion in the bile. No attempt was made in these experiments to test this theory. If biliary
excretion of EDTA occtIrs. it is in negligible amounts but has been denied by most authors (Brochner-Mortensen et al. 1969, Downes & McDonald 1964, Foreman et al. 1953. Garnett et al. 1967, Prpic 1967, Havlicek et al. 1968. Ladegaard- Pedersen & Engell 1972).
Both determinations of the total EDTA space of the animal and the EDTA space of different tissues suggest that the tracer penetrates into the intracellu- lar fluid space. Thus, when using EDTA as a de- terminant of changes in the extracellular fluid space, it is necessary to minimize and standardize the length of the infusion time in the experimental animals and their controls.
This investigation was supported by a grant from the Swedish Medical Research Council (project No. B79-17- x-02022- I3C).
REFERENCES AHRENS, F. A. & ARONSON. A. L. 1971. A compara-
tive study of the toxic effects of calcium and chromium chelates of ethylenediaminetetraacetate in the dog. Toxicol Appl Pharmacol 18: 10-25.
ALTMAN, P. L. & DITTMER, D. S. 1961. Blood and other body fluids. Federation of American Societies for Experimental Biology, Washington, D.C.
ARMITAGE, P. 1971. Statistical methods in medical re- search. Blackwell Scientific Publications, Oxford.
BERNARD, J. P. & BIRON, A. 1971. Mesure du liquide extracellulaire rapidement kchangeable (LECRE) par I'EDTA 51 Cr. Etude chez le chien anesthesie. Agres- sologie 12: 291-296.
DE BOER, J., ARCHIBALD, J. & DOWNIE. H . G. 1975. An introduction to experimental surgery. Excerpta Medica, Amsterdam.
BOHNE, F., HARMUTH-HOENE. A., KURZINGER, K. & HAVLICEK, F. 1968. Metabolismus und Toxizi- tat therapeutischer Chelatbildner. 5 . Mitteilung: Der physiologische Verdiinningsraum des ADTA und DTPA. Strahlentherapie 136: 609-616.
BRADING, A. F. &JONES, A. W. 1969. Distribution and kinetics of CoEDTA in smooth muscle, and its use as an extracellular marker. J Physiol (Lond.) 200: 387- 401.
BROCHNER-MORTENSEN, J., GIESE, J. & ROS- SING, N. 1%9. Renal inulin clearance versus total plasma clearance of 5ICr-EDTA. Scand J Clin Lab Invest 23: 301-305.
DOWNES, A. M. & McDONALD, I . W. 1964. The chromium-5 1 complex of ethylenediamine tetraacetic acid as a soluble rumen marker. Br J Nutr 18: 153-163.
EVERETT, N. B., SIMMONS, B. & LASHER, E. P. 1956. Distribution of blood (FeSu) and plasma (1':'') volumes of rats determined by liquid nitrogen freezing. Circ Res 4: 419-424.
EDTA s p t i c ~ qf'tlgyerent tissiies 57
FOREMAN, H., VIER. M. & MAGEE, M. 1953. The metabolism of CIJ-labeled EDTA in the rat. J Biol Chem 203: 1045-1053.
FOREMAN, H. & TRUJILLO. T. T. 1954. The metabol- ism of C"-labeled EDTA in human beings. J Lab Clin Med 43: 566-571.
GARNETT, E. S., PARSONS, V. & VEALL, N. 1967. Measurement of glomerular filtration-rate in man using a 5'Cr/edetic-acid complex. Lancet 1: 818-819.
HAVLICEK. F., BOHNE. F. & ZORN. H. 1968. Metabolismus und Toxizitat therapeutischer Chelat- bildner. 4. Mitteilung: Exkretion und metabolischer Abbau von ADTA und DTPA. Strahlentherapie 136: 604-608.
LACHINE, E. E.. NOUJAIM, A. A.. EDISS, C. & WIEBE, L. I. 1976. Toxicity, tissue distribution and excretion of 46ScC1, and 46Sc-EDTA in mice. Int J Appl Radiat Isot 27: 373-377.
1972. A comparison of the distribution volumes of inulin and ( W r ) EDTA in man and nephrectomized dogs. Scand J Clin Lab Invest 30: 271-274.
LARSSON. M., JOHNSON, L., NYLANDER. G. & OHMAN, U. Kinetics of W r EDTA in the rat. Sub- mitted for publication.
LADEGAARD-PEDERSEN, H. J . & ENGELL. H. C.
MOORE, F. D., HARTSUCK. J. M., ZOLLINGER, R. M., Jr & JOHNSON, J. E. 1968. Reference models for clinical studies by isotope dilution. Ann Surg 168: 671-700.
PRPIC, B. 1967. Der Stoffwechsel von '"Ga-EDTA in der Ratte. Acta lsotop (Padova) 7: 41-47.
STACY, B. D. & THORBURN, G. D. 1966. Chromium- 5 1 ethylenediaminetetraacetate for estimation of glomerular filtration rate. Science 152: 10761077.
VIRGILIO, R. W., HOMER, L. D.. HERMAN, C. M.. MOSS, G. S., LOWERY, B. D. & SCHWARTZ. S . L. 1970. Comparison of inulin and chromium-EDTA spaces in the nephrectomized baboon. J Surg Res 10: 370-376.
VOLF, V., VLADAR, M. & SEIDEL, A. 1971. Distribu- tion of labelled Calcium-, Yttrium and Chromium-che- lates of EDTA in rats. Arch Int Pharmacodyn Ther 190: 110-123.
WELCH. B. L. 1947. The generalization of "Student's" problem when several different population variances are involved. Biometrics 34: 28-35.
Acta Physiol Scand. 110