plastic hardening model iii: design application€¦ · the plastic hardening ... in-situ tests...
TRANSCRIPT
1 INTRODUCTION
The plastic hardening (PH) model is a shear and volumetric hardening constitutive model for the simulation of soil behavior. When subjected to deviatoric loading, e.g. during a conventional drained triaxial test, soils usually exhibit a decrease in stiffness accompanied by irreversible de-formation. In most cases, the plot of deviatoric stress versus axial strain obtained in a drained triaxial test may be approximated by a hyperbola. This feature was discussed by Duncan & Chang (1970) in their well-known hyperbolic-soil model, which is formulated as a non-linear elastic model. The PH model is formulated within the framework of hardening plasticity (Schanz et al. 1999), allowing it to remove the main drawbacks of the original non-linear model formulation (e.g. detection of loading/unloading pattern, nonphysical bulk modulus). The main features of the new PH model are: hyperbolic stress strain relationship in axial drained compression; plastic strain in mobilizing friction (shear hardening); plastic strain in primary compression (volumetric hard-ening); stress-dependent stiffness according to a power law; elastic unloading/reloading compared to virgin loading; memory of pre-consolidation stress; and Mohr-Coulomb failure criterion. The model is easy and straightforward to calibrate using in-situ as well as the laboratory tests.
The formulation and implementation can be found in Cheng & Detournay 2016 and the cali-bration procedure from laboratory tests and a validation example are presented in Cheng & Lu-carelli 2016.
A design application is demonstrated including the material parameter estimation procedure from the in-situ tests including the cone penetration test (CPT) data and shear wave velocity data. Numerical analyses are presented including the soil-structure interaction using the PH soil model with the calibrated material parameters.
2 LAKE LIVINGSTON POWER PLAN PROJECT
The Trinity River Authority and the city of Houston have approved the construction of a new hydro-power generation facility located on the Pole County side of the Lake Livingston Dam along the Trinity River. The facility is currently under construction, and expected to begin deliv-ering power in 2018. Stanley Consultants tasked Itasca Consulting Group with carrying out the
Plastic hardening model III: Design application
A. Lucarelli & Z. ChengItasca Consulting Group, Inc., Minneapolis, MN, USA
ABSTRACT: This paper presents a design application using the plastic hardening model recently implemented in FLAC3D. We estimate material parameters from in-situ test data, including cone penetration tests and shear wave velocity tests, from a recent earth retaining system in a dam project. The numerical analyses including the soil-structure interaction using the calibrated mate-rial parameters for this project are summarized.
Applied Numerical Modeling in Geomechanics – 2016 – Gómez, Detournay, Hart & Nelson (eds.) Paper: 06-04©2016 Itasca International Inc., Minneapolis, ISBN 978-0-9767577-4-0
403
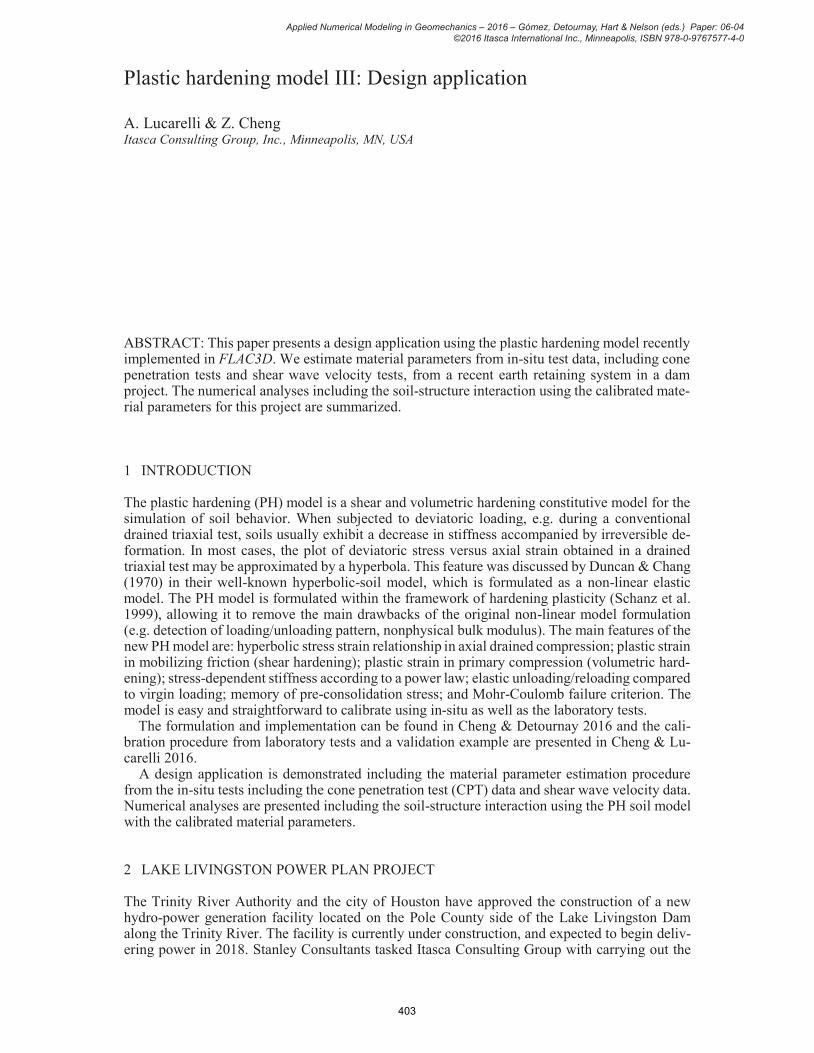
numerical modeling of the earth retaining systems implemented in the project. Figure 1 gives an overview of the project.
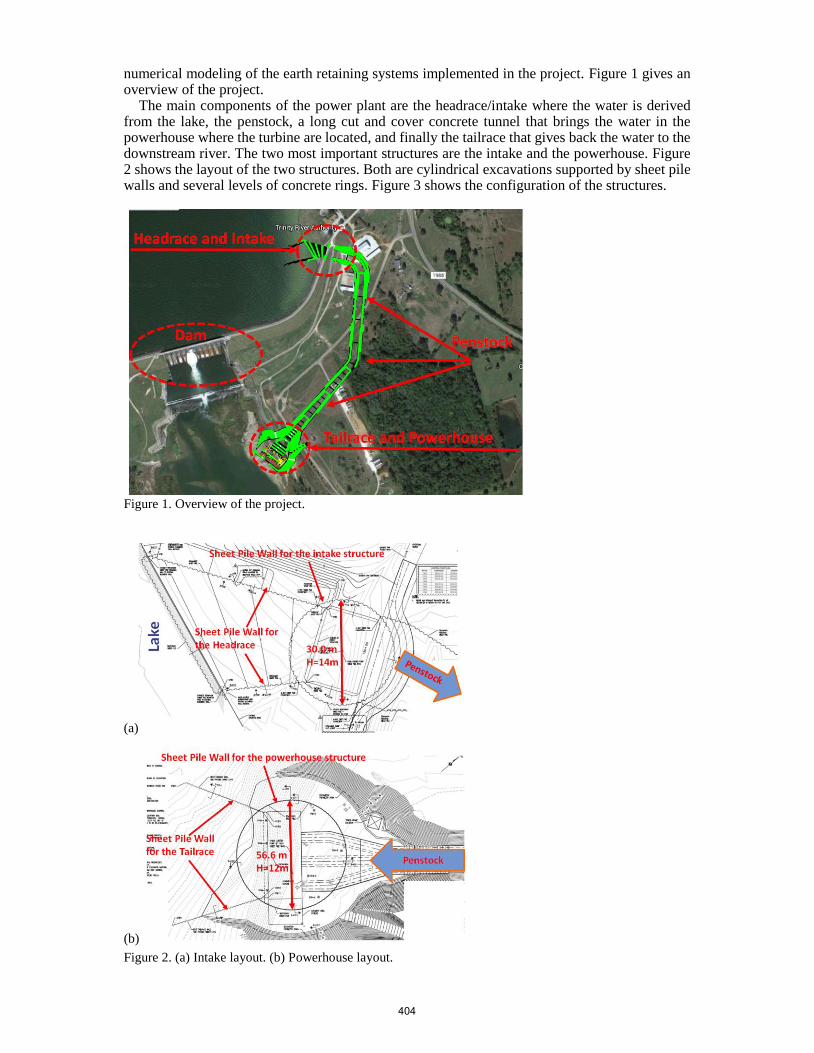
The main components of the power plant are the headrace/intake where the water is derived from the lake, the penstock, a long cut and cover concrete tunnel that brings the water in the powerhouse where the turbine are located, and finally the tailrace that gives back the water to the downstream river. The two most important structures are the intake and the powerhouse. Figure 2 shows the layout of the two structures. Both are cylindrical excavations supported by sheet pile walls and several levels of concrete rings. Figure 3 shows the configuration of the structures.
Figure 1. Overview of the project.
(a)
(b)
Figure 2. (a) Intake layout. (b) Powerhouse layout.
404
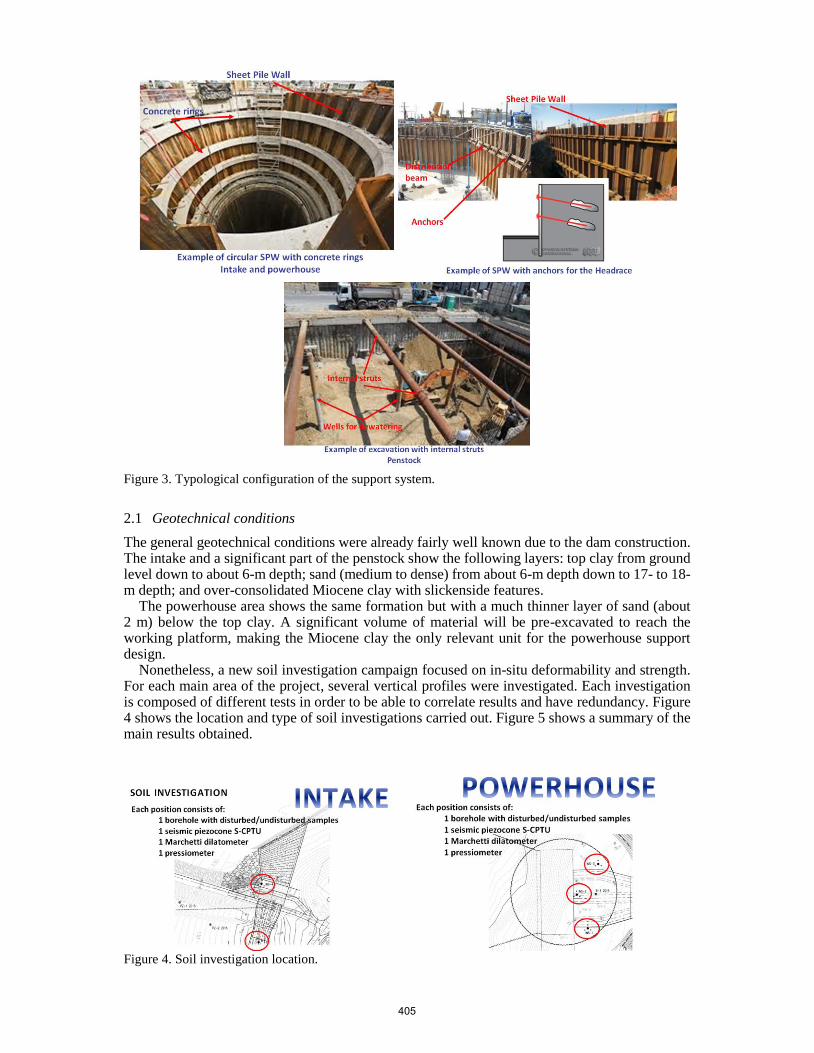
Figure 3. Typological configuration of the support system.
2.1 Geotechnical conditions
The general geotechnical conditions were already fairly well known due to the dam construction. The intake and a significant part of the penstock show the following layers: top clay from ground level down to about 6-m depth; sand (medium to dense) from about 6-m depth down to 17- to 18-m depth; and over-consolidated Miocene clay with slickenside features.
The powerhouse area shows the same formation but with a much thinner layer of sand (about 2 m) below the top clay. A significant volume of material will be pre-excavated to reach the working platform, making the Miocene clay the only relevant unit for the powerhouse support design.
Nonetheless, a new soil investigation campaign focused on in-situ deformability and strength. For each main area of the project, several vertical profiles were investigated. Each investigation is composed of different tests in order to be able to correlate results and have redundancy. Figure 4 shows the location and type of soil investigations carried out. Figure 5 shows a summary of the main results obtained.
Figure 4. Soil investigation location.
405

Figure 5. Soil investigation results.
406
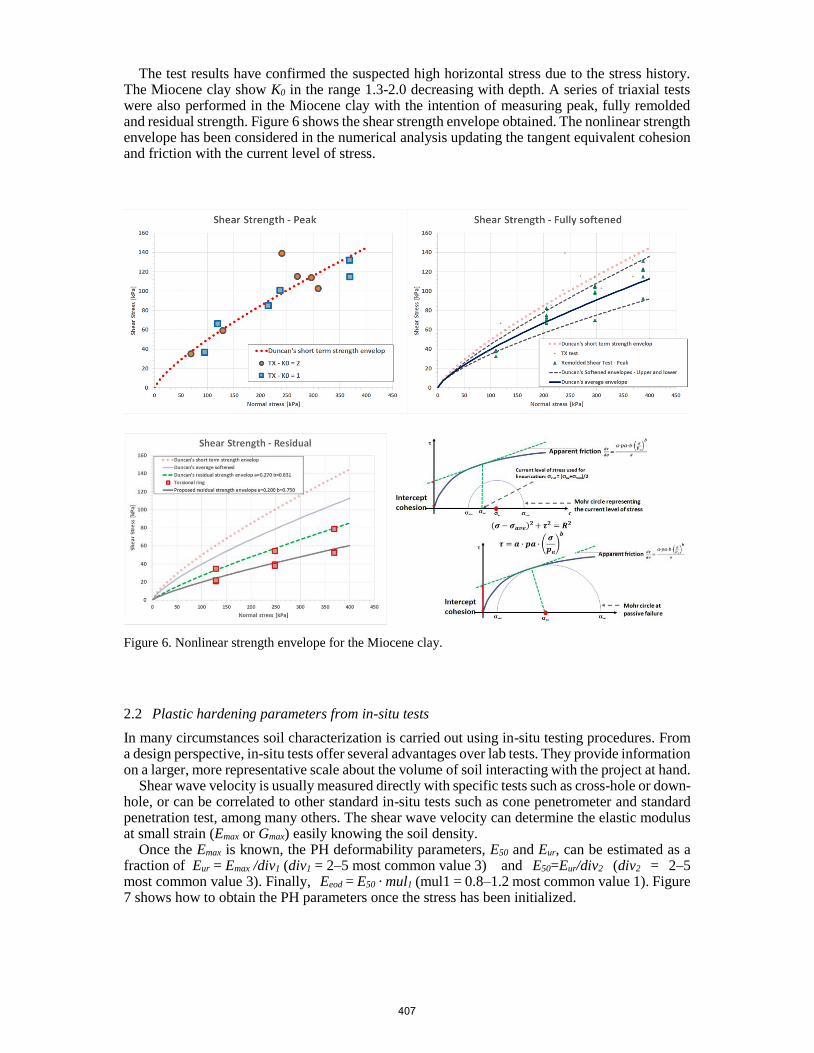
The test results have confirmed the suspected high horizontal stress due to the stress history. The Miocene clay show K0 in the range 1.3-2.0 decreasing with depth. A series of triaxial tests were also performed in the Miocene clay with the intention of measuring peak, fully remolded and residual strength. Figure 6 shows the shear strength envelope obtained. The nonlinear strength envelope has been considered in the numerical analysis updating the tangent equivalent cohesion and friction with the current level of stress.
Figure 6. Nonlinear strength envelope for the Miocene clay.
2.2 Plastic hardening parameters from in-situ tests
In many circumstances soil characterization is carried out using in-situ testing procedures. From a design perspective, in-situ tests offer several advantages over lab tests. They provide information on a larger, more representative scale about the volume of soil interacting with the project at hand.
Shear wave velocity is usually measured directly with specific tests such as cross-hole or down-hole, or can be correlated to other standard in-situ tests such as cone penetrometer and standard penetration test, among many others. The shear wave velocity can determine the elastic modulus at small strain (Emax or Gmax) easily knowing the soil density.
Once the Emax is known, the PH deformability parameters, E50 and Eur, can be estimated as a fraction of Eur = Emax /div1 (div1 = 2–5 most common value 3) and E50=Eur/div2 (div2 = 2–5 most common value 3). Finally, Eeod = E50 · mul1 (mul1 = 0.8–1.2 most common value 1). Figure 7 shows how to obtain the PH parameters once the stress has been initialized.
407

Figure 7. Deformability parameters from in-situ test.
2.3 Numerical modeling approach
Every component of the project has been modeled separately. The main features that were neces-sary to implement include non-linear strength envelope for the clay material; deformability pa-rameters, initial horizontal stress, OCR as a function of depth according to results of in-situ tests; orthotropic shell elements for the sheet pile wall (SPW); concrete rings and other repartition struc-ture modeled as beam elements considering the axis offset; and global stability analysis adopting the strength reduction method (SRM).
A general FISH routine has been written to update the strength parameter as a function of the current level of stress following the logic illustrated in Figure 6. The shear strength is expressed by 𝜏 = 𝑎 ∙ 𝑝𝑎 ∙ (𝜎 𝑃𝑎⁄ )𝑏, where a and b are material parameters obtained from the lab triaxial test(Fig. 10), pa is the atmospheric pressure. The values for a and b include a = 0.50 and b = 0.77 for peak strength; a = 0.35-0.40 and b = 0.7-0.80 for fully softened strength; and a = 0.20 and b = 0.75 for residual strength.
The parameters that are depth dependent were input using tables or using a geometry entity (representing the ground surface) to calculate the depth of each zone and then the specific prop-erties for each zone were interpolated.
As far as the structural behavior is concerned, the SPW is composed of many elements con-nected to each other via cylindrical hinges. Therefore, the horizontal bending moment cannot be transferred from one element to the other. Moreover, the hoop stress reaction is very limited. Each element of the SPW behaves closer to a simple vertical beam rather than a continuous shell. The shell orthotropic formulation inside FLAC3D (Itasca 2012) makes it possible to accommodate such behavior easily. Considering the SPW as an isotropic shell would grossly underestimate the load on the rings.
The evaluation of the safety factor for a complex support system is not trivial. The limit equi-librium method (LEM) is not capable of capturing the soil-structure interaction, detecting the pos-sibility for multiple mechanisms, or observing the progressive increments of stress on the struc-tural component. The potential failure mechanism is influenced by the structural reaction that is a function of the local relative displacement determining a complex interaction that cannot be ade-quately addressed using the LEM, which can only assume a wished-in-placed structural reaction. On the other hand, the SRM (gradual reduction of the soil strength) captures this feedback mech-anism (between the structure and the soil mass) allowing for the detection of potential failure on the soil side or on the structural side. It usually is desirable to have enough structural reaction from the structural components to guide the potential failure on the soil side.
2.4 Headrace excavation analysis
The headrace support is composed by SPW with three levels of pre-stressed anchors. Figure 8 shows the geometry layout on the right while initial stress is shown on the left (imposing the K0 obtained from the in-situ stress measurement). The longitudinal dimension of the model is equal to the longitudinal spacing of the anchors (2.3 m).
408

The PH deformability parameters (Eur and E50) and the strength parameter associated with the initial stress are shown in Figure 9. During the analysis, the strength parameters are updated as a function of the current stress level.
(a)
(b)
Figure 8. (a) Geometry layout and (b) K0.
Figure 9. Deformability and strength parameters.
409
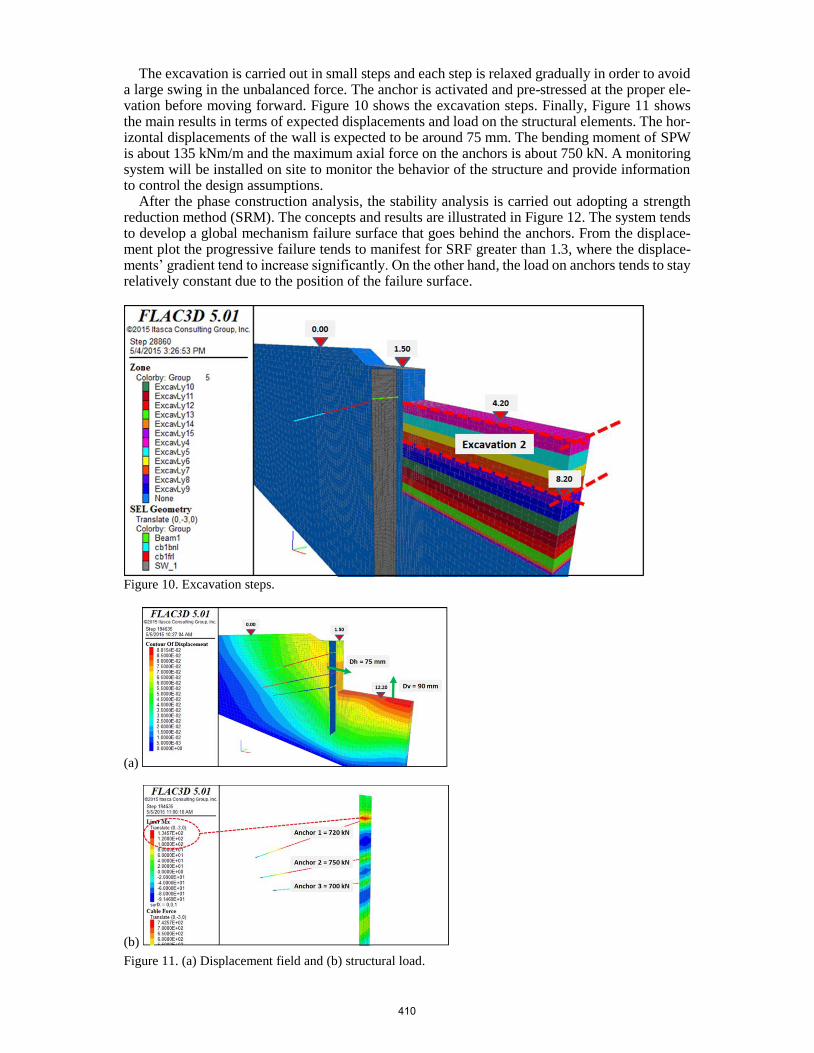
The excavation is carried out in small steps and each step is relaxed gradually in order to avoid a large swing in the unbalanced force. The anchor is activated and pre-stressed at the proper ele-vation before moving forward. Figure 10 shows the excavation steps. Finally, Figure 11 shows the main results in terms of expected displacements and load on the structural elements. The hor-izontal displacements of the wall is expected to be around 75 mm. The bending moment of SPW is about 135 kNm/m and the maximum axial force on the anchors is about 750 kN. A monitoring system will be installed on site to monitor the behavior of the structure and provide information to control the design assumptions.
After the phase construction analysis, the stability analysis is carried out adopting a strength reduction method (SRM). The concepts and results are illustrated in Figure 12. The system tends to develop a global mechanism failure surface that goes behind the anchors. From the displace-ment plot the progressive failure tends to manifest for SRF greater than 1.3, where the displace-ments’ gradient tend to increase significantly. On the other hand, the load on anchors tends to stay relatively constant due to the position of the failure surface.
Figure 10. Excavation steps.
(a)
(b)
Figure 11. (a) Displacement field and (b) structural load.
410

Figure 12. Stability analysis.
2.5 Powerhouse analysis
Similarly to the headrace, the powerhouse model and results are briefly presented. It is a circular excavation with a diameter of about 56-m and 12-m depth (from the working platform, Fig. 13). Figure 14 shows the initial at rest coefficient with depth and shear strength distribution as function of stress. The support is composed with SPW and six levels of concrete rings. The local ground level has a downward sloping configuration toward the river. This feature generates a non-uniform thrust distribution on the rings causing a bending moment. The sand underneath the Miocene clay is in artesian condition requiring a dewatering system in order to reduce the uplift pressure on the residual thickness of clay that would otherwise not be stable.
The excavation volume has been divided in 12 slices, 1 m thick. Each slice is excavated in undrained condition followed by a dissipation phase (Fig. 15).
Figure 13. Powerhouse model layout.
411
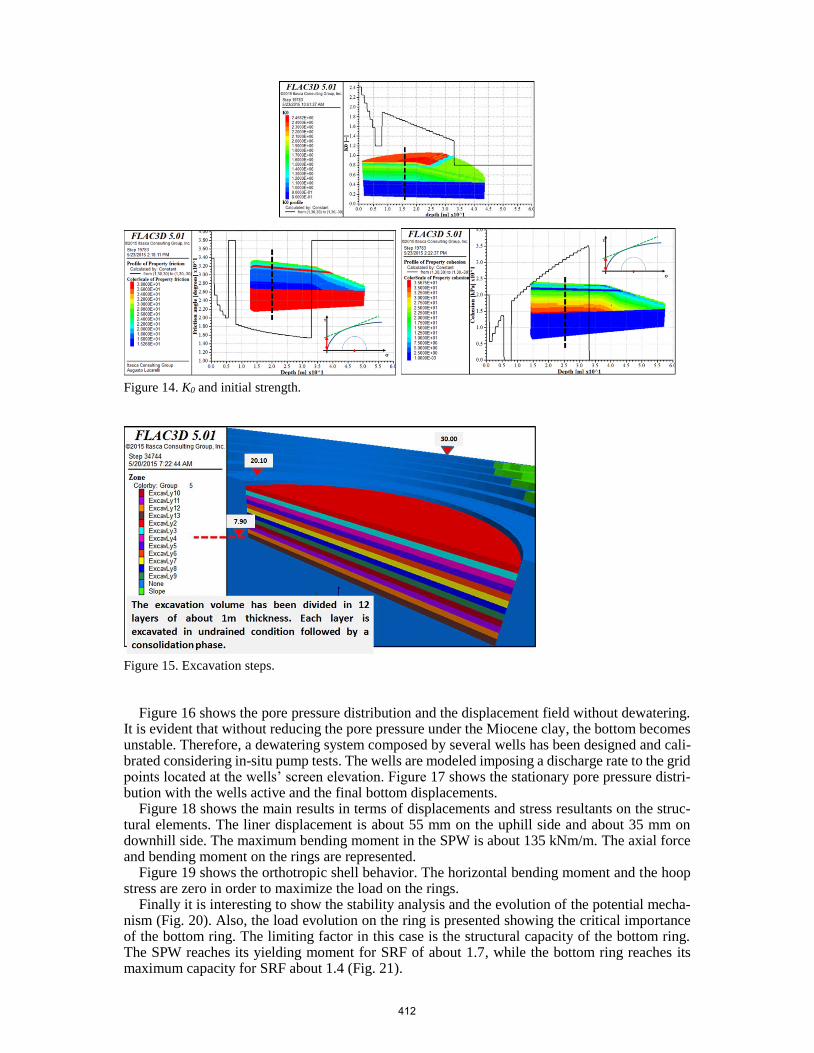
Figure 14. K0 and initial strength.
Figure 15. Excavation steps.
Figure 16 shows the pore pressure distribution and the displacement field without dewatering. It is evident that without reducing the pore pressure under the Miocene clay, the bottom becomes unstable. Therefore, a dewatering system composed by several wells has been designed and cali-brated considering in-situ pump tests. The wells are modeled imposing a discharge rate to the grid points located at the wells’ screen elevation. Figure 17 shows the stationary pore pressure distri-bution with the wells active and the final bottom displacements.
Figure 18 shows the main results in terms of displacements and stress resultants on the struc-tural elements. The liner displacement is about 55 mm on the uphill side and about 35 mm on downhill side. The maximum bending moment in the SPW is about 135 kNm/m. The axial force and bending moment on the rings are represented.
Figure 19 shows the orthotropic shell behavior. The horizontal bending moment and the hoop stress are zero in order to maximize the load on the rings.
Finally it is interesting to show the stability analysis and the evolution of the potential mecha-nism (Fig. 20). Also, the load evolution on the ring is presented showing the critical importance of the bottom ring. The limiting factor in this case is the structural capacity of the bottom ring. The SPW reaches its yielding moment for SRF of about 1.7, while the bottom ring reaches its maximum capacity for SRF about 1.4 (Fig. 21).
412

Figure 16. Pore pressure and displacement without dewatering: bottom instability.
Figure 17. Dewatering system.
Figure 18. Liner’s displacement and bending moment; ring’s axial force and bending moment.
Figure 19. SPW orthotropic shell: horizontal bending moment and hoop stress.
413

Figure 20. Potential failure mechanism.
Figure 21. Structural load evolution during stability analysis.
3 SUMMARY
The plastic hardening constitutive model is flexible and user-friendly and accommodates the most important features of the non-linear behavior of soil. The material parameters are easily estimated from the in-situ tests. It is well known and widely adopted by the geotechnical community to analyze a vast category of problems involving soil and soil-structure interaction.
REFERENCES
Cheng, Z. & Detournay C. 2016. Plastic hardening model I: Implementation in FLAC3D. In P. Gomez, C. Detournay, R. Hart & M. Nelson (eds), Proc. 4th Itasca Symposium on Applied Numerical Modeling. March 7-9, 2016, Lima, Peru.
Cheng, Z. & Lucarelli A. 2016. Plastic hardening model II: Calibration and validation. In P. Gomez, C. Detournay, R. Hart & M. Nelson (eds), Proc. 4th Itasca Symposium on Applied Numerical Modeling. March 7-9, 2016, Lima, Peru.
Duncan, J.M. & Chang, C.Y. 1970. Nonlinear analysis of stress and strain in soil. J. Soil Mech. Found. Div. 96(5), pp.1629-1653.
Itasca Consulting Group, Inc. 2012. FLAC3D – Fast Lagrangian Analysis of Continua in 3 Dimensions, Ver. 5.0. Minneapolis: Itasca
Schanz, T., Vermeer, P.A., Bonnier, P.G. 1999. The hardening soil model: formulation and verification. In R.B.J. Brinkgreve (ed), Beyond 2000 in Computational Geotechnics -10 Years of Plaxis. Rotterdam: Balkema.
414