plastic litter study post index - thanaltrust.org
TRANSCRIPT

� | P a g e0
June 2019 Zero Waste & Climate Action team
A Study on Plastic Litteralong Kerala Coast

www.thanal.co.in
ThanalOD-3, Jawahar Nagar,Kawdiar, Trivandrum,
Kerala, India - 695003.+91 471 2727150
June, 2019
Team
Jayakumar C
Raju SShibu K N
Sujith Surendran Tom JoyAnna Joseph Sanitta S MathewV Nikhilesh Paliath

About Thanal Thanal, a public interest research and campaign organisation, is one of the oldest environmental organisations in Kerala. The organisation was founded in 1986 with a vision “People, Planet, Sustainability”. Thanal leads campaigns / projects at grass-root level, handholds communities to find environmental solutions, networks with other groups at national & international level to share ideas & experiences, mentors environmental stewardship and advocates with policy makers for environmental friendly approach to developmental requirements. Focus areas of Thanal include Climate Action, Zero Waste, Organic Farming, Agriculture Diversity, Agro Ecology and Toxics. Thanal pioneered the idea of Zero Waste Communities in India with Zero Waste Kovalam project. Later Thanal worked with UNDP to develop zero waste systems for selected tourist destinations across different terrains in India. Thanal facilitated the birth and growth of Zero Waste Himalaya network. Zero Waste Centre, an enterprise for alternate products conceived by Thanal, proved the role of local economy in building zero waste systems in communities. Today Thanal is a consultant for Zero Waste systems building and partner organisation in international campaigns / networks like #breakfreefromplastic movement and GAIA (www.no-burn.org).
#breakfreefromplastic Break Free From Plastic is a global movement envisioning a future free from plastic pollution. Since its launch in September 2016, over 1200 groups from across the world have joined the movement to demand massive reductions in single-use plastics and to push for lasting solutions to the plastic pollution crisis. These organisations share the common values of environmental protection and social justice, which guide their work at the community level and represent a global unified vision. (www.breakfreefromplastic.org)
GAIAGlobal Alliance for Incinerator Alternative (GAIA) is a worldwide alliance of more than 800 grass-root groups, non-governmental organisations and individuals in over 90 countries whose ultimate vision is a just, toxic-free world without incineration. GAIA and its members are global leaders in advancing visionary, win-win solutions to waste and pollution that protect the environment and human wellbeing and build strong participatory local economies (www.no-burn.org)
www.thanal.co.in i
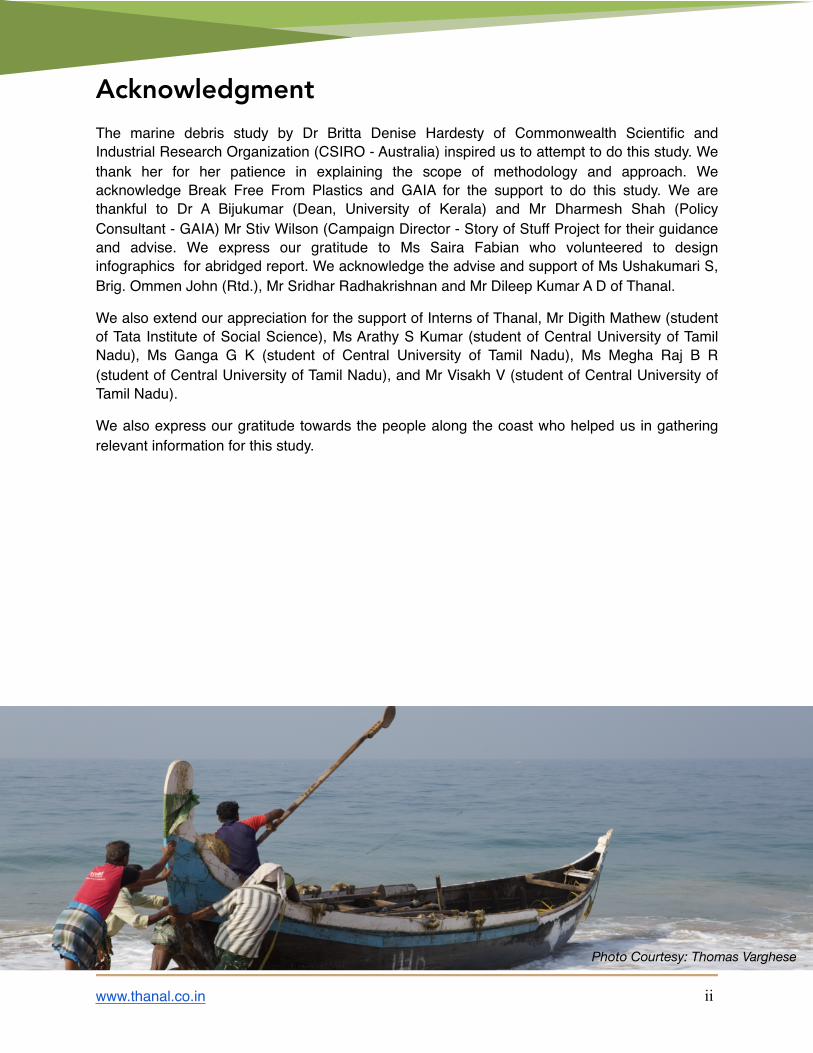
Acknowledgment The marine debris study by Dr Britta Denise Hardesty of Commonwealth Scientific and Industrial Research Organization (CSIRO - Australia) inspired us to attempt to do this study. We thank her for her patience in explaining the scope of methodology and approach. We acknowledge Break Free From Plastics and GAIA for the support to do this study. We are thankful to Dr A Bijukumar (Dean, University of Kerala) and Mr Dharmesh Shah (Policy Consultant - GAIA) Mr Stiv Wilson (Campaign Director - Story of Stuff Project for their guidance and advise. We express our gratitude to Ms Saira Fabian who volunteered to design infographics for abridged report. We acknowledge the advise and support of Ms Ushakumari S, Brig. Ommen John (Rtd.), Mr Sridhar Radhakrishnan and Mr Dileep Kumar A D of Thanal.
We also extend our appreciation for the support of Interns of Thanal, Mr Digith Mathew (student of Tata Institute of Social Science), Ms Arathy S Kumar (student of Central University of Tamil Nadu), Ms Ganga G K (student of Central University of Tamil Nadu), Ms Megha Raj B R (student of Central University of Tamil Nadu), and Mr Visakh V (student of Central University of Tamil Nadu).
We also express our gratitude towards the people along the coast who helped us in gathering relevant information for this study.
www.thanal.co.in ii
Photo Courtesy: Thomas Varghese

Contents 1. Executive Summary 12. Definitions 23. Background 34. Objective 35. Methodology 3
5.a. Sampling 35.b. Data Collection 45.c. Analysis 45.d. Calculation of Litter Index 65.e. Estimation of total plastic litter along Kerala Coast 75.f. Estimation of total number pieces for specific types of plastic products. 7
6. Limitations and Assumptions 85. Findings 9
5.a. General Composition 95.b. Contribution of Single use plastics 105.c. District wise comparison of plastic litter 115.d. Cluster analysis 125.e. Litter Indices 135.f. Estimate of Plastic litter along the coast 145.g. Most littered and least littered sample sites 145.h. Quantification of Specific types of plastic 15
6. Field observation 167. Facts at a glance 178. References 18Annexure 1 19
GPS Coordinates of sample sites 19Annexure 2 23
District Profiles - General Composition 23Annexure 3 28
Photographs from Sites 28
www.thanal.co.in

1. Executive Summary The coastline is a corridor of exchange of life between two entirely different ecosystems - ocean and land. Characteristics of aquatic eco system and land ecosystem merges on this belt. The ecosystem of this belt also support our economy through providing livelihood for millions of people. Hence this corridor require special attention in terms of conservation. Plastic litter is an impurity which is contaminating land and ocean. Presence of plastic litter on coast is an index on pollution especially for this ecologically sensitive zone. Quantification of plastic litter may tell us the pace of plastic waste from land to form marine debris in the ocean. Across the globe people, organisations and governments are concerned about plastics in the ocean. The study is an attempt to collect evidence to strengthen the argument for plastic use reduction and recovery of plastic waste to prevent plastic pollution.
Kerala the southern most State in India lies on the south western coast of Indian peninsula. It is a strip of land sandwiched between Western Ghats on the east and Arabian Sea on the west. Kerala has a coastline of 588 km which is spread across 9 districts out of 14 districts namely Thiruvananthapuram, Kollam, Alappuzha, Ernakulam, Thrissur, Malappuram, Kozhikkodu, Kannur and Kasaragod.
The study used geographically distributed samples at a regular interval of 10 kilometre along the coast of Kerala. At each sample site a sample plot of 1m width was chosen between shore line and first line of vegetation. 59 sites across 9 districts were covered during the period January to May, 2019. Collected plastic litter samples are sorted on the basis of Government of India rules governing their management and later on the basis of their utility and type of plastic. District wise average plastic litter indices were developed in terms of number of plastic litter pieces per square meter and weight of plastic litter per square meter.
The study finds that state average plastic litter index for Kerala coast is 1.66 number of plastic pieces per square metre and 10.31grams of plastic litter per square metre. Total number of plastic litter along Kerala Coast is estimated at 17,00,32,429 pieces and total weight of plastic litter is estimated at 1057.45 tonnes.
Magnitude of plastic litter is best explained by the estimated number of plastic litter pieces along the coast mentioned in the study. This signifies the number of handpicks required to make the coast of Kerala free from plastic litter. Number of handpicks becomes more relevant if we consider the man power and cost associated for such an activity. Withering of plastics on the beach makes it impossible to identify the origin / type / polymer of the plastic litter by visual inspection. Such plastic litter were categorised as 'undesignated' which contributes to a larger share of plastic litter on the coast.
The coast line is managed by multiple agencies. Local communities, religious institutions, local self governments, Revenue department, Mining and Geology Department, Department of Tourism, Harbour Engineering Department, Kerala Forest Department, Directorate of Environment, Biodiversity board, Port Trust, Harbours, Indian Coast Guard, Kerala Police, Coastal Regulatory Zone Management Authority - Kerala, NGOs etc., It requires a herculean task to coordinate and facilitate between the diverse stakeholders to keep our beaches clean to protect our marine life from plastic pollution.
www.thanal.co.in Page �1

2. Definitions
# Word Definition
a. Litter Litter consists of waste products that have been disposed of improperly, without consent, at an undesirable location.
b. Litter Index Litter index is a statistical measure devised to compare relative cleanliness of an area
c. Google Earth Google Earth is a computer program that renders a 3D representation of Earth based primarily on satellite imagery.
d. GPSGlobal Positioning System. GPS is a satellite navigation system used to determine the ground position of an object using Latitude and Longitude.
e. Google Maps Google Maps is a smartphone application that enables the user to locate and navigate to specific GPS coordinates
f. PET Polyethylene Terephthalate. Designated as #1
g. HDPE High Density Polyethylene. Designated as #2
h. PVC Polyvinyl Chloride. Designated as #3
i. LDPE Low Density Polyethylene. Designated as #4
j. PP Polypropylene. Designated as #5
k. PS Polystyrene. Designated as #6
l HM Polymers that are referred among recycling industry as Heavy Molecule polymer.
m Reject and InertsPost processing rejects from dry waste collection centres. Items that does not have recycle value. Items that are usually sent for sanitary landfill.
www.thanal.co.in Page �2

3. Background Plastics in the ocean is a global concern not just because of its impact on ecosystems but on economy dependent upon resources from the ocean. There are efforts going on across the globe to prevent plastics leaking into ocean. The concern of marine plastics caught public attention following the discovery of the great garbage patch in the pacific gyre by Captain Charles Moore in 1997 . Later other garbage patches in the oceans were identified. A recent study published by Ellen Mc Arthur foundation in 2016 states that by 2050 the plastics could even outweigh fish in the ocean. It is estimated that about 8.61 million tonnes of plastic waste end up in water bodies every year. Plastic waste end up in oceans affecting marine life. Presence of micro-plastics have also been reported in fisheries. Occurrence of micro-plastics in fish have been reported by A L Lusher in English Channel (2013) and Sajjad Abbasi at Persian Gulf (2018).
Zero Waste and Climate Action of Thanal initiated a process to create a baseline information on plastic litter along the coast of Kerala. It is important because beaches / shoreline mark the boundary of two ecosystems, an area that is highly sensitive as exchange of life, food and resources between two ecosystems takes place along this narrow belt. Baseline assessment and its findings could provide a trend in plastic waste that gets accumulated or dumped along the beach / shoreline. Characterisation of plastic litter along the shore line can help government to frame / modify specific policies to decrease the influx of plastic into coastal areas.
4. Objective The study aims to build an inventory and baseline information on plastic litter on coast line of Kerala.
5. Methodology 5.a. Sampling9 out of 14 district of Kerala share the coastline of 588.39 kilometre. The study used geographically distributed samples at a regular interval of 10 kilometre along the coast of Kerala. Google Earth was used to identify and mark sampling locations for collecting plastic litter. Google Earth is a computer program that renders a 3D representation of Earth based primarily on satellite imagery. Starting sample location was Kerala - Tamil Nadu border on the south, in the district of Thiruvananthapuram. GPS (Global Positioning System) coordinates for the starting point is 8°17'42.6" N, 77°05'38.3" E (Pathu Gramam, TVM 01) and the last location identified in Kasaragod District is 12°44'35.7" N, 74°52'13.6” E (Kanwa Thirtha, KSG 08). Plastic litter sample was collected from the total of 59 locations along a coastline of 588.39 kilometre (length of coastline determined from Google Earth). GPS coordinates for 59 sample locations are mentioned in Annexure 1. The team used the same mobile phone as GPS locator throughout the sample locations to maintain consistency.
www.thanal.co.in Page �3

5.b. Data CollectionPlastic litter was collected from a rectangular sample plot which has one metre width. The length of the plot was the distance between first line of vegetation / built land use and shore line. The plots were taken based on the the GPS coordinates identified in the map.
Based on the landuse and economic of area near the sample location, the nature of sample site was categorised into:
1. Urban residential2. Rural residential3. Tourist / Pilgrimage4. Industrial5. Open Beach6. Fish-landing / Harbour / Fishing centres7. River-mouth / Estuary8. Other categories
Landuse characteristics were noted from sample locations only to understand the nature of landuse. This information was not considered as a primary category for analysis. Other details collected from site include name of district, name of locality, name of local government and confirmation of location photographs. 59 sites across 14 districts were covered during the period January to May, 2019.
5.c. Analysis
5.c.i. General composition
Data collection and sample collection was carried out by a team consisting of people having more than 2 years of experience in plastic waste and solid waste management. Plastic litter from the sample plot was collected and packed in individual cloth bags with code number of the sample plot and was taken to base office for analysis and expert consultation.
Plastic littering is an issue of management systems. The rules provide guidelines for managing plastic waste in India. Hence the plastic litter were categorised based on the Rules to link it with the management practices. The category is as follows.
# Govt of India Rules Categories based on Type of plastics Examples
1
Plastic Waste (Management and Handling) Rules 2018
High Density PolymersPET, HDPE, PVC, PP and other rigid plastics.Water bottles, beverages bottles, oil cans, plastic spoon, food containers
2 Low Density PolymersLDPE, PP, HMOil packets, milk packets, food pouches etc.
3 Multi Layer plastics Branded Chips wrapper, chocolate wrapper, cartons
www.thanal.co.in Page �4

General composition of plastic litter that comes under the governance of plastic waste (management and handling) rules in term of utility is found out by sorting collected samples into the below mentioned categories (Table 02). Details regarding weight and number of pieces are recorded after sorting samples collected from each and every site.
4
Plastic Waste (Management and Handling) Rules 2018
Expanded Polymers / Foam
Styrofoam, Expanded Polystyrene, Thermocol, sponge, packing material, disposable cups / plates etc
5 Undesignated
Those which cannot be grouped into above categories, Those which can not be identified. Fractions of withered plastic waste. Inert and Rejects
6Construction and Demolition Waste Management Rules 2016
Plastic from Construction activities
Segments of pipe, segments of electrical wire housing
7 Bio-Medical Waste Management Rules 2016
Plastic Medical care activities
Syringes, medicine bottles, medicine strips, parts of inhaler
Table 01
# Govt of India Rules Categories based on Type of plastics Examples
# Categories based on Usage of plastics Examples
1 Fishing Equipment (Multi Use) Fishing nets, floaters, ropes, fishing ball etc.
2 Food & Snacks (Single Use)Chocolate wrapping, Biscuit covers, Ice-cream cup, Paper plate, Paper cup, Milk cover, Oil packet, Water bottles etc.
3 Home care/Personal care (Single Use)Washing powder packet, parts of fire lighter, Brush, Cream bottle, Shampoo bottle, Powder tin, Tooth paste etc.
4 Utilities (Single use) Carry bags, Straw, Fragrance sticks cover, Single use plastic pouches etc.
5 Utilities (Multi use) Foot wear, Floor mat, Toys, Pen etc.
6 Tobacco Products (Single Use) Cigarette buds, tobacco based chewing products etc.
8 UndesignatedThose which cannot be grouped into above categories. Those which can not be identified etc. Fractions of withered plastic waste. Inert & rejects
Table 02
www.thanal.co.in Page �5

5.c.ii. Contribution of Single Use plastics
From amongst the categories of Usage of material as mentioned in 4.c.i, The following categories are grouped into single use plastics
1. Food & Snacks2. Home / Personal Care3. Utilities (Single Use)4. Tobacco products
The following categories are grouped into multi use plastics1. Fishing Equipment2. Utilities (Multi Use)
Contribution of Single use and Multi use plastics is determined based on the above mentioned groups in terms of number of pieces and weight of plastic litter.
5.c.iii. Cluster Analysis
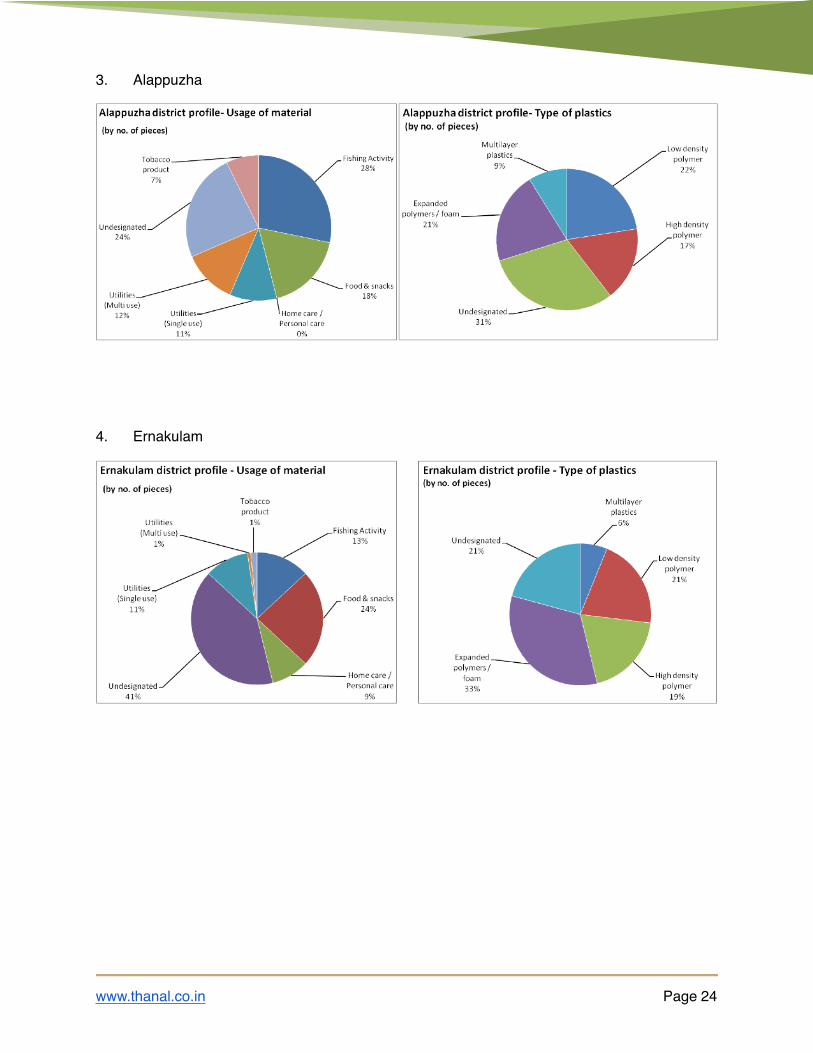
General composition for each district is calculated based on the type of plastics and also on the usage of material. Representation of composition is done in both number of pieces and weight of plastic litter.
District profiles are analysed to find similarities in general composition. Similarities are checked in both type of plastics and usage of material. Categories with percentage composition values within the range of 15% are considered as similar. Districts with similar percentage contribution for at least 3 categories of plastic are grouped into the same cluster. A cluster can have districts with similarities in either composition of type of plastics or in composition of usage of plastics.
5.d. Calculation of Litter IndexLitter Index is calculated for each sample site. Total number of plastic litter collected from the sample plot divided by area of sample plot gives Litter Index in terms of number of pieces. Total weight of plastic litter collected from the sample plot divided by area of sample plot gives Litter Index in terms of weight. Average of all indices for a district was used to calculate the average Litter index for the district. Average district index is calculated in terms of both number of pieces and weight. Average of all 9 district indices gives average Plastic litter index value for the state. Average plastic litter index for Kerala coast is also calculated in both number of pieces and weight.
5.d.i. Litter index (in terms of number of pieces) = Σ (number of plastic pieces collected from the sample site) / (area of samples plot in the district)
5.d.ii. Litter index (in terms of weight) = Σ (weight of plastic pieces collected from the sample site) / (area of samples plot in the district)
5.d.iii. Average district litter index (in terms of number of pieces) = Σ (number of plastic pieces collected from sample sites in the district) / Σ (area of samples plots in the district)
5.d.iv. Average district litter index (in terms of weight) = Σ (weight of plastic pieces collected from sample sites in the district) / Σ (area of samples plots in the district)
www.thanal.co.in Page �6

Weightage was not given to different categories of plastic litter while calculating litter index. Calculation of litter index in terms of number of piece per square meter is followed by various environmental NGOs and agencies (Centre for Science and Environment, New Atlas, GRID-Arendal etc.)
5.e. Estimation of total plastic litter along Kerala CoastAs per Coastal Zone Management Plan prepared by National Centre for Earth Science Studies, total Intertidal Zone for Kerala is calculated at 102.6 square kilometre. Average plastic litter index for Kerala coast is projected over total intertidal zone area to estimate total number of plastic litter pieces along the coast. Average plastic litter index in terms of weight is projected over total intertidal area to estimate total weight of plastic along the coast of Kerala.
5.f. Estimation of total number pieces for specific types of plastic products.
Average index values are developed based on data collected from all 59 samples sites for crucial plastic products. Average index values are then projected to Intertidal zone area to estimate total number of pieces for that specific product. Such estimations are done for
i. Plastic carry bagsii. Single Use plastic cutlery itemsiii. Tobacco products
www.thanal.co.in Page �7
Photo Courtesy: Thomas Varghese

6. Limitations and Assumptions 6.1. GPS (Global Positioning System) coordinates were identified using Google Earth. Google
Earth is a computer program that renders a 3D representation of Earth based primarily on satellite imagery. Google Maps, a smartphone application, was used to trace the location based on GPS coordinates. Accuracy of the smartphone application Google Maps is 10m.
6.2. Plastic litter were collected only from the visible surface along the shoreline.
6.3. At places where beaches were absent due to construction of sea wall, the width of seawall was included in the length of sample plot. Plastic litter was collected from the visible portions of the sea wall until first line of vegetation / built-up landuse.
6.4. Plastic litter samples collected from sites were sorted based on visual identification and by team members with sufficient field experience in solid waste and plastic waste management.
6.5. However, samples collected were often broken pieces and their size was so small that origin and or source of plastic litter could not be identified by the team. Hence such litter samples were grouped into Undesignated category.
6.6. Weight measures were taken using Electronic weighing scale that has a least count of 10milligram. All sand particles were dusted out from plastic litter before measuring. However, remnants of sand particles on the plastic litter could have affected weight measurement. As the error due to weight of sand particles were insignificant, the error factor was assumed to be zero.
6.7. The results can not indicate the type of landuse responsible for peaks and dips in litter index. The study had taken geographical sampling. Since sampling of site was not based on type of land / built use, litter indices calculated would not be able to indicate any direct influence of landuse pattern mentioned as field observations.
6.8. Certain locations mapped as per 10km interval were restricted to public. GPS coordinates of those sites were inside facilities maintained by armed forces. Thus the survey team conducted sample collection at a distance of 100m from designated GPS coordinates.
www.thanal.co.in Page �8

5. Findings 5.a. General Composition5.a.i. In terms of Type of plastic
Graph 01 illustrates the percentage of plastic litter that belong to various central government rules for waste management.
Plastic litter that is governed by Plastic waste (management and handling rules) were further sorted on the basis of their type of material. Graph 02 illustrates the percentage composition based on the type of material
www.thanal.co.in Page �9
Graph 02
Graph 01

5.a.ii. In terms of Usage of material
In terms of Usage of material General composition of plastic litter is analysed on the basis of their intended utility. Analysis is done in terms of number of litter pieces. Graph 03 illustrates general composition of plastic litter along Kerala coast. The pie chart shows that single use plastic is dominating if we do not consider the category named “undesignated”. Contribution of Single Use Plastics
5.b. Contribution of Single use plastics
www.thanal.co.in Page �10
Graph 03
Graph 04

Collected samples as per usage of material is grouped in single use plastics and multi use plastics. Sample litter pieces that belonged to Food & Snacks, Home / Personal Care, Tobacco Products, Utilities (Single Use) and Plastic waste from medical care activities are considered as Single Use plastics. Sample litter pieces that belong to Fishing equipment, Utilities (Multi Use) and Plastic waste from construction activities are considered as Multi Use plastics. Graph 04 shows that Single Use plastics contribute to 53% in total number of plastic litter collected along the coast
5.c. District wise comparison of plastic litterIn order to compare the performance of each district in terms of plastic litter and to compare their general composition, litter indices were developed for each of the categories in Type of Plastic litter and by Usage of material. Indices are developed in terms of number of pieces. Total number of pieces collected from the district divided by total area of sample plot in the district indicates the litter index for that specific category. Table 03 indicates litter indices for every category listed in Usage of material.
Category wise indices for every coastal district mentioned in Table 03 are plotted in Graph 05. It is very evident about the activity that has contributed the most towards plastic litter in all the 9 districts. Graph 5 shows a peak in Single use utilities and fishing activities from Kasargod district.
www.thanal.co.in Page �11
Graph 05

5.d. Cluster analysisComposition of plastic litter was analysed for each district to find similarities. Out of 9 coastal districts in Kerala, similarity was observed in litter composition for 7 districts. These 7 districts were grouped into 3 clusters based on their similarity in litter composition. Table 04 lists the clusters and similarities observed.
Average Plastic Litter indices as per Usage of material (no. of piece/m2)
District Food and snacks
Home care personal
careUtilities
(Single use)Tobacco products
Fishing activity
Utilities (Multi use)
Trivandrum 0.29 0.03 0.22 0.03 0.04 0.02Kollam 0.42 0.06 0.14 0.06 0.10 0.01Alappuzha 0.14 0.00 0.08 0.06 0.22 0.09Ernakulam 0.30 0.12 0.14 0.02 0.17 0.01Thrissur 0.22 0.02 0.15 0.01 0.61 0.11Malappuram 0.24 0.04 0.39 0.03 1.14 0.18Kozhikkode 0.38 0.00 0.25 0.05 0.25 0.07Kannur 0.18 0.03 0.34 0.02 0.06 0.00Kasaragod 0.50 0.05 0.61 0.01 0.08 0.02
www.thanal.co.in Page �12
# Cluster Districts Similarities Range in General composition
1 Cluster AThiruvananthapuramKollam
Styrofoam / Expanded PS 18% to 19%Single layer plastics 36% to 43%Multi layer plastics 12% to 16%Fishing equipments 5% to 9%Food & Snacks products 36% to 38%Personal & Home care products 3% to 5%Tobacco products 4% to 5%
2 Cluster BErnakulamThrissurMalappuram
Styrofoam / Expanded PS 19% to 30%Single layer plastics 14% to 19% Multi layer plastics 1% to 6% Hard plastics 15% to 18%Food & Snacks products 9% to 22%Personal & Home care products 1% to 8%Tobacco products 1%
3 Cluster C KannurKasargod
Styrofoam / Expanded PS 11%Multi layer plastics 31% to 32%Hard plastics 15% to 17%Fishing equipments 3% to 4%Food & Snacks products 25% to 26%Personal & Home care products 3%Tobacco products 3% to 5%Single Use utilities 26% to 27%
Table 03
Table 04

5.e. Litter IndicesLitter indices are developed in terms of both number of pieces/m2 and weight/m2. Total number of pieces from a site divide by total sample plot area would give litter index for the particular site. Average of litter indices for such sites in a district would give the average litter index for the district. State average litter index is also derived in a similar fashion. Total number of pieces collected from all 59 sites are divided by total sample plot area. Graph 05 shows the comparison of district indices in terms of number of pieces. Graph that compares average district indices based on weight of plastic litter per square metre is provided in Annexure 2.
Litter index for a district is a clear indication of the density of plastic pollution along the coast. The benchmark data can also be viewed as a tool to measure the effectiveness of formal waste collection and management systems in the state. Highest litter index in terms of number of pieces was recorded at 8.75 pieces/m2 and the least was recorded at 0.171 pieces/m2. Highest litter index in terms of weight of plastic litter was recorded 64.995gm/m2 and the least recorded index was at 0.445hm/m2.
Graph 07 shows the deviation for each district wise indices from state average. It also highlights those districts which are keeping the state average high.
www.thanal.co.in Page �13
State average litter index is calculated to be 1.66 number of plastic pieces per square metre and 10.31grams of plastic litter per square metre.
Graph 06
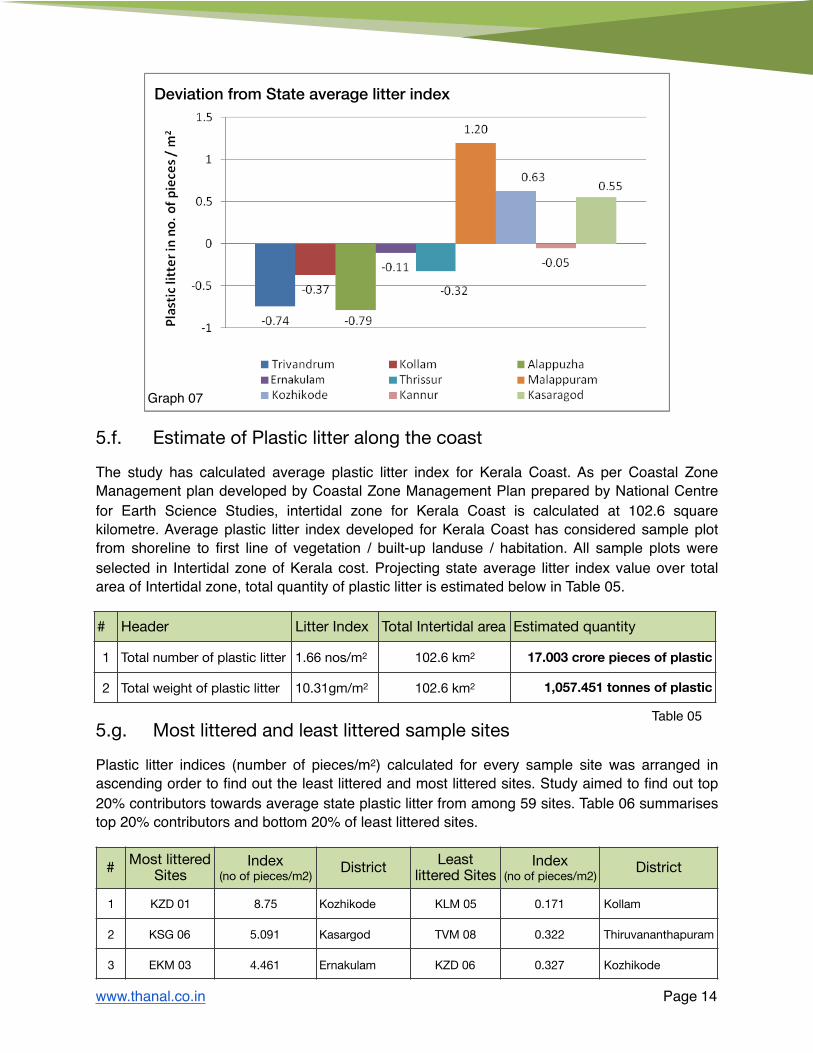
5.f. Estimate of Plastic litter along the coastThe study has calculated average plastic litter index for Kerala Coast. As per Coastal Zone Management plan developed by Coastal Zone Management Plan prepared by National Centre for Earth Science Studies, intertidal zone for Kerala Coast is calculated at 102.6 square kilometre. Average plastic litter index developed for Kerala Coast has considered sample plot from shoreline to first line of vegetation / built-up landuse / habitation. All sample plots were selected in Intertidal zone of Kerala cost. Projecting state average litter index value over total area of Intertidal zone, total quantity of plastic litter is estimated below in Table 05.
5.g. Most littered and least littered sample sitesPlastic litter indices (number of pieces/m2) calculated for every sample site was arranged in ascending order to find out the least littered and most littered sites. Study aimed to find out top 20% contributors towards average state plastic litter from among 59 sites. Table 06 summarises top 20% contributors and bottom 20% of least littered sites.
# Most littered Sites
Index(no of pieces/m2) District Least
littered SitesIndex
(no of pieces/m2) District
1 KZD 01 8.75 Kozhikode KLM 05 0.171 Kollam
2 KSG 06 5.091 Kasargod TVM 08 0.322 Thiruvananthapuram
3 EKM 03 4.461 Ernakulam KZD 06 0.327 Kozhikode
www.thanal.co.in Page �14
# Header Litter Index Total Intertidal area Estimated quantity
1 Total number of plastic litter 1.66 nos/m2 102.6 km2 17.003 crore pieces of plastic
2 Total weight of plastic litter 10.31gm/m2 102.6 km2 1,057.451 tonnes of plastic
Table 05
Graph 07
Deviation from State average litter index

5.h. Quantification of Specific types of plastic
4 MLP 04 4.403 Malappuram KAN 03 0.327 Kannur
5 KAN 01 4.268 Kannur KAN 05 0.360 Kannur
6 KZD 07 3.99 Kozhikode TVM 07 0.370 Thiruvananthapuram
7 KSG 05 3.402 Kasargod ALP 05 0.371 Alappuzha
8 KZD 02 3.333 Kozhikode TVM 06 0.415 Thiruvananthapuram
9 KAN 02 3.237 Kannur EKM 02 0.479 Ernakulam
10 MLP 05 3.013 Malappuram KAN 07 0.515 Kannur
11 KAN 08 2.603 Kannur KAN 04 0.529 Kannur
12 KZD 05 2.598 Kozhikode KLM 03 0.533 Kollam
# Most littered Sites
Index(no of pieces/m2)
District Least littered Sites
Index(no of pieces/m2)
District
# Type of plastic Litter Index Total Intertidal area Estimated quantity
1 Carry Bag 0.0824 nos/m2 102.6 km2 85.54 lakh pieces
2 Cutlery items 0.0483 nos/m2 102.6 km2 49.60 lakh pieces
3 Tobacco products 0.0456 nos/m2 102.6 km2 46.81 lakh pieces
www.thanal.co.in Page �15
Table 07
Table 06
Photo Courtesy: Thomas Varghese

6. Field observation 6.a. Built-up use characteristics at sample location
From amongst the 59 locations studied, nature of built use of areas near to sample location was observed. Majority of the sample location had rural residential settlement and fishing activity. This justifies the presence of consumer products and fishing related material in plastic litter. Leakage of plastics from rural residential settlements could be a reason for higher concentration of consumer goods products along the shoreline of Kerala.
6.b. It was observed that portions of beach adjacent to residential dwellings had higher concentration of plastic litter.
6.c. Open defecation was observed at beaches in Trivandrum and Ernakulam district.
6.d. One of the sample location in the district of Kannur was near a waste dump.
6.e. All sample locations in at an interval of 10 kilometre had road access.
6.f. Abundance of carry bags was observed at most littered sites.
6.g. At certain sites in Malappuram district, presence of plastic litter is not easily visible unless one looks carefully at the sand.
6.h. Residents at some samples sites claimed that plastic litter found in their vicinity was deposited by the sea and not a result of their activities.
6.i. Beaches that have been part of development projects often lacked provisions for waste collection / management
6.j. Dust bin was not present in any of the beaches. In such cases littering could be higher.
www.thanal.co.in Page �16
Graph 07

7. Facts at a glance
www.thanal.co.in Page �17
# Header Value
1Average plastic litter index for Kerala Coast
1.66 pieces / m2
2 10.31 gm/m2
3Total number of plastic litteralong Kerala Coast(number of hand picks required for clean up)
17,00,32,429 pieces
4Total weight of plastic litteralong Kerala Coast(number of hand picks required for clean up)
1,057.45 Tonnes
5Total number of plastic carry bagsalong Kerala Coast(estimate)
85.54 lakh pieces
6Total number of plastic cutleryalong Kerala Coast(estimate)
49.60 lakh pieces
# Product category responsible for plastic litter Contribution1 Products from fishing activity 17%2 Products related to Food & Snack 25%3 Products related to Home care & personal care 3%4 Products of or from single use utilities 21%5 Products of or from multi use utilities 4%6 Tobacco products 4%7 Undesignated 26%
Table 08
Table 09

8. References i. Understanding the effects of marine debris on wildlife, Dr Britta Denise Hardesty, 2014,
Commonwealth Scientific and Industrial Research Organization (CSIRO - Australia).
ii. Occurrence of microplastics in the gastrointestinal tract of pelagic and demersal fish from the English Channel, A L Lushera, M McHughb, R C Thompson, Marine Pollution Bulletin, Volume 67, 2013.
iii. Microplastics in different tissues of fish and prawn from the Musa Estuary, Persian Gulf, Sajjad Abbasi, Naghmeh Soltani, Mina Hassanaghaei, Chemosphere, Volume 205, 2018.
iv. Earth's highest density of plastic waste found on a deserted island, Nick Lavars, 2017, New Atlas.
v. Mumbai, Kerala most affected by marine litter; microplastics pose a major threat, 2017, Down To Earth
vi. Coastal Zone Management Plan of Kerala, 2018, National Centre for Earth Science Studies.
www.thanal.co.in Page �18
Photo Courtesy: Thomas Varghese

Annexure 1 GPS Coordinates of sample sites
# Sample ID GPS Coordinates Locality Name Name of Local Govt
1 TVM 01 8°17'42.6" N77°05'38.3" E
Pathu Gramam Kulathoor Grama Panchayat
2 TVM 02 8°21'01.9" N77°01'19.9" E
Adimalathura Kottukal Panchayat
3 TVM 03 8°25'06.7" N76°57'44.9" E
Panathura Trivandrum Municipal Corporation
4 TVM 04 8°29'19.0" N76°54'11.9 E
Vettukadu Trivandrum Municipal Corporation
5 TVM 05 8°33'41.6" N76°50'39.0" E
Menamkulam Trivandrum Municipal Corporation
6 TVM 06 8°37'44.0" N76°47'19.3" E
Perumathura Azhoor Panchayat
7 TVM 07 8°42'02.2" N76°43'56.3" E
Arivalum Chirayinkeezh Grama Panchayat
8 TVM 08 8°46'44.2" N76°40'33.5" E
Kappil Edava Panchayat
9 KLM 01 8°50'42.1" N76°37'27.1" E
Thanni Mayyanadu Panchayat
10 KLM 02 8°53'20.0" N76°33'35.0" E
Chandhai Colony Kollam Corporation
11 KLM 03 8°58'27.9" N76°31'36.8" E
Karithura Chavara Panchayat
12 KLM 04 9°02'20.7" N76°30'26.4" E
Pandarathuruthu Alappadu Grama Panchayat
13 KLM 05 9°07'35.5" N76°28'01.9" E
Azheekal Alappadu Grama Panchayat
14 ALP 01 9°12'05.8" N76°26'05.3" E
Kallikadu Arattupuzha Panchayat
15 ALP 02 9°16'31.9" N76°24'01.5" E
Panoor Thrikunnapuzha Panchayat
16 ALP 03 9°21'58.8" N76°21'31.4" E
Purakkad Purakkad Panchayat
17 ALP 04 9°27'13.6" N76°19'35.5" E
Arappakkal Punnapra Panchayat
www.thanal.co.in Page �19

18 ALP 05 9°32'22.6" N76°18'30.1" E
Omanapuzha Mararikulam Thekku Panchayat
19 ALP 06 9°37'50.0" N76°17'44.2" E
Panakkal Mararikulam Panchayat
20 ALP 07 9°43'01.1" N76°17'13.2" E
Ottamasseri Kadakkarapalli Panchayat
21 EKM 01 9°47'45.2" N76°16'46.5" E
Chellanam Chellanam Panchayat
22 EKM 02 9°52'51.4" N76°15'38.8" E
Kannamaly Chellanam Panchayat
23 EKM 03 9°58'04.7" N76°14'28.9" E
Vasco-da-gama Square Kochi Corporation
24 EKM 04 10°03'03.4" N76°12'13.7" E
Veliyatham Parambu Nayarambalam Panchayat
25 EKM 05 10°07'18.8" N76°11'03.4" E
Cherai Kuzhupilly Panchayat
26 TSR 01 10°13'03.5"N 76°09'02.0"E
Eriyad Eriyad Village Mathilakam Block
27 TSR 02 10°18'25.0"N 76°07'29.6"E
Perinjanam West Samithi Perinjanam Panchayath
28 TSR 03 10°23'28.9"N 76°05'38.0"E
Valappad Beach Valappad Panchayath
29 TSR 04 10°29'12.1"N 76°03'12.3"E
Vadanapally Vadanapally Panchayath
30 TSR 05 10°34'38.0"N 76°00'19.0"E
Dwarka Beach Dwarka Muncipality
31 TSR 06 10°39'33.6"N 75°58'06.4"E
Mannalam kunnu Punnayarkulam Panchayath
32 MLP 01 10°44'31.3"N 75°55'53.7"E
Puthu Ponnani Ponnani Muncipality
33 MLP 02 10°49'55.4"N 75°54'03.2"E
Purathoor Padinjaarekara Purathoor Panchayath
34 MLP 03 10°55'03.7"N 75°52'57.2"E
Unniyal Beach Nirambhathanoor Panchayath
35 MLP 04 11°00'35.0"N 75°51'34.9"E
Ottumppuram Tanur Ottumppuram Muncipality
36 MLP 05 11°05'50.2"N 75°50'11.2"E
Ariyalloor Vallikunnu Panchayath
# Sample ID GPS Coordinates Locality Name Name of Local Govt
www.thanal.co.in Page �20

37 KZD 01 11°11'18.6"N 75°47'41.6"E
Kaithavalappu Kozhikode Corporation
38 KZD 02 11°15'45.2"N 75°45'57.3"E
Vellayil Harbour Kozhikode Corporation
39 KZD 03 11°21'04.5"N 75°44'07.4"E
Mattuvagal Kozhikode Corporation
40 KZD 04 11°25'54.9"N 75°41'35.9"E
Koyilandi Harbour Kozhikode Corporation
41 KZD 05 11°28'29.0"N 75°37'31.3"E
Kunnumewlthaya Moodadi Panchayath
42 KZD 06 11°34'04.7"N 75°35'31.2"E
Kottakkal Payyoli Muncipality
43 KZD 07 11°39'11.6"N 75°33'21.1"E
Madakkara Onjium Panchayath
44 KAN 01 11°43'14.7"N 75°30'55.2"E
Pettipalam Thalassery Municipality
45 KAN 02 11°46'12.0"N 75°27'21.6"E
Chathodu Dharmadom Panchayath
46 KAN 03 11°49'35"N 75°24'46"E
Kizhunna Kannur Corporation
47 KAN 04 11°52'17.5"N 75°21'06.3"E
Payyambalam Beach Kannur Corporation
48 KAN 05 11°55'22.0"N 75°18'45.8"E
Thal Beach Azhikode Panchayath
49 KAN 06 12°00'00.6"N 75°15'21.0"E
Madakai Beach Road Matool Panchayath
50 KAN 07 12°00'40.4"N 75°12'34.7"E
Ittikulam Beach Ramanthali Panchayath
51 KAN 08 12°06'15.1"N 75°09'32.4"E
Trikaripur Kadapuram Valiaparambu Panchayath
52 KSG 01 12°10'45.3"N 75°07'43.9"E
Panthrad Valiaparambu Panchayath
53 KSG 02 12°15'54.7"N 75°05'42.6"E
Ozhinjavalapu Kanhagad Municipality
54 KSG 03 12°20'53.6"N 75°03'33.4"E
Chettari Kadappuram Ajanur Panchayath
55 KSG 04 12°25'01.9"N 75°01'01.7"E
Kottikulam Uduma Panchayath
# Sample ID GPS Coordinates Locality Name Name of Local Govt
www.thanal.co.in Page �21
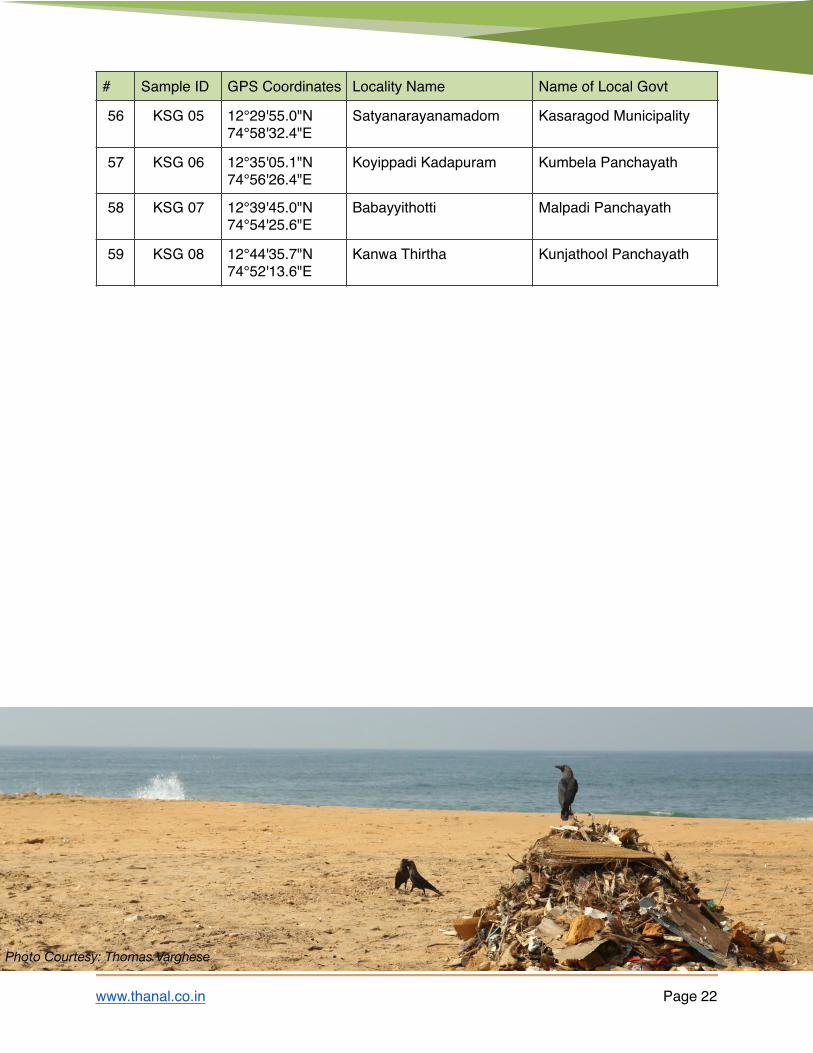
56 KSG 05 12°29'55.0"N 74°58'32.4"E
Satyanarayanamadom Kasaragod Municipality
57 KSG 06 12°35'05.1"N 74°56'26.4"E
Koyippadi Kadapuram Kumbela Panchayath
58 KSG 07 12°39'45.0"N 74°54'25.6"E
Babayyithotti Malpadi Panchayath
59 KSG 08 12°44'35.7"N 74°52'13.6"E
Kanwa Thirtha Kunjathool Panchayath
# Sample ID GPS Coordinates Locality Name Name of Local Govt
www.thanal.co.in Page �22
Photo Courtesy: Thomas Varghese

Annexure 2 District Profiles - General Composition1. Thiruvananthapuram
2. Kollam
www.thanal.co.in Page �23


Annexure 3 Photographs from Sites
www.thanal.co.in Page �28
Image 01: Sample site TSR 06. The image shows the measurement of sample plot length.
Image 02: Sample site KLM 05. The image shows Plastic litter samples collected from site in cloth bag.

www.thanal.co.in Page �29
Image 03: Sample site TVM 06. The image shows Plastic litter along the beach near site identified for TVM 06.
Image 04: Team at site after sample collection.

www.thanal.co.in Page �30
ThanalPeople, Planet, Sustainability
Crafting change for the futurewww.thanal.co.in