plasticity in selection strategies of woodland …
TRANSCRIPT

PLASTICITY IN SELECTION STRATEGIES OF WOODLAND CARIBOU (RANGIFER
TARANDUS CARIBOU) DURING WINTER AND CALVING
by
David D. Gustine
B.A., University of Oklahoma, 1994
B.S., Colorado State University, 2000
THESIS SUBMITTED IN PARTIAL FULFILLMENT OF
THE REQUIREMENTS FOR THE DEGREE OF
MASTER OF SCIENCE
in
NATURAL RESOURCES AND ENVIRONMENTAL STUDIES
(BIOLOGY)
THE UNIVERSITY OF NORTHERN BRITISH COLUMBIA
January 2005
© David D. Gustine, 2005

ii
ABSTRACT
Woodland caribou may be an important ‘indicator’ or focal species for
management agencies because they require large areas to persist and are sensitive
to both direct and indirect forms of disturbance. Prior to industrial development in
northern regions, it is important to acquire baseline information on areas that are
important to local ‘herds’ as well as to identify physiological and ecological
mechanisms of resource selection. I used global positioning system (GPS) data
from caribou (Rangifer tarandus caribou), wolves (Canis lupus), and grizzly bears
(Ursus arctos), and satellite imagery, resource selection functions, and cause-
specific mortality data from 50 caribou neonates to define calving and wintering
areas of woodland caribou in northern British Columbia. I identified scale-dependant
mechanisms of selection relative to predation risk (calving, summer, winter, and late
winter) and forage availability (calving and summer), and energetic costs of
movement (winter and late winter) at 2 spatial scales, and quantified the variation in
responses to these mechanisms among individual caribou. In all seasons, caribou
selected habitats in a hierarchical fashion, and exhibited high variation among
individuals. Three unique calving areas, or calving strategies, were defined for the
Greater Besa Prophet area; each calving area had different attributes of risk and
forage. During calving, spatial separation from areas of high wolf risk was important
to parturient females as was access to areas of high vegetative change (i.e., forage
quality); animals made trade-off decisions between minimizing the risk of predation
and securing forage to address the high nutritional demands of lactation. Calf
survival through the first 2 months of life ranged from 54% in 2002 to 79% in 2003.

iii
A total of 19 of 50 neonates died during the summers, of which 17 were by
predation: wolverines (age of calves <14 d) and wolves (age of calves >18 d) each
killed 5 calves. Movements away from calving sites (>1 km) peaked during the third
week of life and increased the odds of a neonate surviving by 196%. These
movements coincided with a change in vegetative phenology and the high energetic
demands of lactation. During winter and late winter, minimizing the energetic costs
of movement was the most important parameter in the selection of resources at a
smaller spatial scale defined by seasonal movement, whereas individual caribou
showed increased sensitivity to the components of risk at a larger scale of the home
range. Variation in the selection of resources by individuals was high, but some
similarities facilitated using pooled use/availability data to model resource selection.
These pooled models, however, collapsed important biological variation in the
selection of resources, limiting biological interpretation of selection models.
Variation in the selection of resources among individuals (i.e., plasticity) during all
times of the year may be an important life-history strategy for woodland caribou to
decrease their predictability on the landscape to major predators. Identifying and
maintaining this variation within selection strategies is an important step towards
determining the ability of caribou populations to persist in the presence of
environmental and anthropogenic disturbance.

iv
TABLE OF CONTENTS
ABSTRACT................................................................................................................ ii
TABLE OF CONTENTS............................................................................................ iv
LIST OF TABLES......................................................................................................vii
LIST OF FIGURES .................................................................................................. xv
ACKNOWLEDGEMENTS ...................................................................................... xviii
CHAPTER 1: INTRODUCTION ................................................................................1 CONTEXT ..............................................................................................................1
Calving................................................................................................................1 Winter .................................................................................................................3 Objectives...........................................................................................................6
ORGANIZATION OF THESIS ................................................................................8
CHAPTER 2: CALVING STRATEGIES AND CALF SURVIVAL OF WOODLAND CARIBOU IN A MULTI-PREDATOR ECOSYSTEM IN NORTHERN BRITISH COLUMBIA.................................................................9
ABSTRACT ............................................................................................................9 INTRODUCTION..................................................................................................10 STUDY AREA ......................................................................................................16 METHODS ...........................................................................................................21
Cow and calf capture ........................................................................................21 Cause-specific mortality and calf survival .........................................................23 Small-scale characteristics of calving sites .......................................................25 Large-scale characteristics of calving sites and calving areas..........................27
Components of Predation Risk......................................................................27 Analyses of Predation Risk ...........................................................................31 Indices of Forage Biomass and Quality.........................................................34 Analyses of Large-Scale Characteristics of Calving Sites and Calving Areas................................................................................................36
RESULTS.............................................................................................................39 Reproductive characteristics.............................................................................39 Cause-specific mortality and survival................................................................41 Small-scale characteristics of calving sites and calf survival ............................43 Large-scale characteristics of calving sites and calving areas and calf survival .............................................................................................................49
DISCUSSION.......................................................................................................58 Hierarchical scales and trade-offs in risk and forage for calving caribou ..........58 Predictions of calf survival ................................................................................63

v
Implications to understanding successful calving strategies.............................67 CHAPTER 3: INTERPRETING RESOURCE SELECTION BETWEEN
SCALES AMONG INDIVIDUAL WOODLAND CARIBOU IN WINTER........................................................................................................74
ABSTRACT ..........................................................................................................74 INTRODUCTION..................................................................................................75 STUDY AREA ......................................................................................................79 METHODS ...........................................................................................................79
Animal capture and locational data...................................................................79 Inputs to resource selection models for caribou................................................82
Vegetation, Topography, and Distance to Linear Features ...........................82 Risk of Predation and Distance to Areas of High Predation Risk ..................83 Estimated Costs of Movement for Caribou....................................................84
Relative importance of covariates and scale ....................................................84 Quantifying variation in the selection of resources among individuals ..............86
RESULTS.............................................................................................................88 Reproductive condition of caribou, collar performance, and movement ...........88 Performance of predation risk models ..............................................................89 Relative importance of covariates and scale ....................................................91 Effect of scale on the components of risk in resource selection........................98 Variation in the selection of resources among caribou ...................................102
Elevation .....................................................................................................104 Slope ...........................................................................................................104 Aspect .........................................................................................................105 Vegetation ...................................................................................................106 Fragmentation of Vegetation .......................................................................108 Components of the Risk of Predation..........................................................109
DISCUSSION.....................................................................................................110 Relative importance of risk, energetic costs of movement, and scale.............111 Variation in the selection of resources among caribou ...................................114
Elevation .....................................................................................................115 Slope ...........................................................................................................116 Aspect and Fragmentation of Vegetation ....................................................116 Vegetation ...................................................................................................117 Components of Risk ....................................................................................118
Interpreting resource selection between scales and among individuals .........119
CHAPTER 4: MANAGEMENT IMPLICATIONS FOR THE GREATER BESA PROPHET AREA .............................................................................124
INTRODUCTION................................................................................................124 IMPLICATIONS..................................................................................................125
Calving and summer.......................................................................................125 Winter and late winter .....................................................................................130
LITERATURE CITED.............................................................................................136

vi
Appendix A: Specifications and schematic of the expandable drop-off radiocollar for woodland caribou (Rangifer tarandus caribou) calves that were captured and monitored in the Greater Besa Prophet area, northern British Columbia. ..........................................................................150
Appendix B: Classification of habitats in the Greater Besa Prophet area,
northern British Columbia. ..........................................................................153 Appendix C: Defining the risk of predation from grizzly bears (Ursus arctos)
and wolves (Canis lupus) for female caribou during the calving and summer seasons in the Greater Besa Prophet area, northern British Columbia.....................................................................................................157
Appendix D: Modelling the Normalized Difference Vegetation Index during
the calving and summer seasons in the Greater Besa Prophet area, northern British Columbia. ..........................................................................171
Appendix E: Data (age, sex, weight, calving area, and method and date of
capture) from the capture of neonatal caribou calves in the Greater Besa Prophet area, northern British Columbia, 2002-2003. .......................176
Appendix F: Summary of vegetative (line-intercept and plot) data at calving
sites of woodland caribou in the Greater Besa Prophet area, northern British Columbia, 2002-2003. .......................................................179
Appendix G: Evaluating the relationship between percent-cover and
biomass of lichens at calving sites of woodland caribou in the Greater Besa Prophet area, northern British Columbia, 2002-2003. ..........182
Appendix H: Reproductive status and ultrasound measurements of back fat
for woodland caribou in the Greater Besa Prophet area, northern British Columbia, winters 2002-2004. .........................................................184
Appendix I: Defining the risk of predation from wolves (Canis lupus) for
female caribou during winter and late winter in the Greater Besa Prophet area, northern British Columbia, 2001-2002..................................187

vii
LIST OF TABLES Table 2.1. Reproductive parameters of female woodland caribou and age,
weight, sex, and peak calving data from captured calves in the Greater Besa Prophet area, northern British Columbia, 2002-2003. ............40
Table 2.2. Small-scale characteristics of calving sites ( x ± SE) among the
Foothills (FTHILLS), Western High Country (WHC), and North Prophet (NP) calving areas in the Greater Besa Prophet area, northern British Columbia, 2002-2003. Characteristics sharing the same letter were not significantly different, as determined by parametric and nonparametric analyses. ......................................................45
Table 2.3. Model sets to evaluate the importance of small- and large-scale
characteristics of calving sites as predictors of calf survival through calving (25 May-14 June) and summer (15 June-July 31) for woodland caribou in the Greater Besa Prophet area, northern British Columbia, 2002-2003. Models were evaluated within small or large-scale sets; sample size (n), log-likelihood (LL), number of parameters (K), Akaike’s Information Criterion for small samples (AICc), Akaike weights ( iw ), differences in AICc ( i∆ ), evidence ratios (Er), and area under the receiver operating characteristic curve (ROC) were used to identify and evaluate the most parsimonious models within a set. ......................................................................................47
Table 2.4. Large-scale characteristics of random points ( x ± SE) among
the Foothills (FTHILLS), Western High Country (WHC), and North Prophet (NP) calving areas in the Greater Besa Prophet area, northern British Columbia, 2002-2003. Characteristics sharing the same letter were not significantly different, as determined by Kruskal-Wallis analysis of variance and multiple comparisons of mean ranks. Large-scale characteristics of calving sites within a calving area were compared to characteristics of random points within that calving area; an asterisk indicates a significant difference (P < 0.050), as determined by the Mann-Whitney U-test. .............................50
Table 2.5. Cost (slope ± SE) from the linear relationship of predator risk
versus forage characteristics of random points within the Foothills
viii
(FTHILLS), Western High Country (WHC), and North Prophet (NP) calving areas in the Greater Besa Prophet area, northern British Columbia, 2002-2003. Slopes sharing the same letter were not significantly different among calving areas and slopes in the summer marked by an asterisk were different from the calving season; both comparisons were determined by a t-test of slopes with a Bonferroni adjustment for comparisons among calving areas........................................56
Table 3.1. Coefficients of selection ( iβ ) relating to the energetic cost of
movement (kJ/kg/hr) in the final resource selection models at the scale of seasonal movement for 10 adult female caribou during winter (November-February) and late winter (March-April) seasons in the Greater Besa Prophet area, northern British Columbia, 2001-2002. Animals 22 and 25 were not pregnant, as defined by serum progesterone assays. ...................................................................................92
Table 3.2. Sum of the weights for Akaike’s Information Criterion corrected
for small sample size ( )( jw + ) where wolf risk and distance to areas of high wolf risk covariates occurred in the model set at the scale of seasonal range for individual caribou by season (winter (November-February) and late winter (March-April)) in the Greater Besa Prophet area, northern British Columbia, 2001-2002. )( jw + denotes the average contribution of information by covariatej for a season across all individuals. ...............................................................................................93
Table 3.3. Final individual and pooled (East (E) and Mountain (M) dwelling
caribou) resource selection models at the scale of the seasonal range for 10 female caribou during winter (November-February) in the Greater Besa Prophet area, northern British Columbia, 2001-2002; squared terms include the linear term (e.g., Elevation2 = Elevation (km) + Elevation2 (km)). Statistics are sample size (n), number of parameters (K), log-likelihood (LL), Akaike’s Information Criterion corrected for small sample size (AICc), Akaike weights ( iw ), evidence ratios (Er), and average (n = 5) Spearman’s correlation coefficient from the k-fold cross-validation ( sr ). All P for
sr < 0.050. ....................................................................................................94

ix
Table 3.4. Final individual and pooled (East (E) and Mountain (M) dwelling caribou) resource selection models at the scale of the seasonal range for 10 female caribou during late winter (March-April) in the Greater Besa Prophet area, northern British Columbia, 2001-2002; squared terms include the linear term (e.g., Elevation2 = Elevation (km) + Elevation2 (km)). Statistics are sample size (n), number of parameters (K), log-likelihood (LL), Akaike’s Information Criterion corrected for small sample size (AICc), Akaike weights ( iw ), evidence ratios (Er), and average (n = 5) Spearman’s correlation coefficient from the k-fold cross-validation ( sr ). All P for sr < 0.050. ...........96
Table 3.5. Change in the Akaike’s Information Criterion corrected for small
sample size ( i∆ ) when wolf risk and distance to areas of high wolf risk were added to the most parsimonious core model for individual caribou by season (winter (November-February) and late winter (March-April)) and scale (seasonal movement and seasonal range) in the Greater Besa Prophet area, northern British Columbia, 2001-2002. i∆ denotes the average contribution of information by a covariate for a season across all individuals.................................................99
Table A.1. Specifications for the expandable drop-off collars for newborn
caribou calves (T. Pojar, Colorado Division of Wildlife, pers. comm.); Advanced Telemetry Systems, Isanti, MN, USA) that were used to monitor 50 caribou neonates in the Greater Besa Prophet area, northern British Columbia, 2002-2003. .......................................................151
Table B.1. Nine classes of vegetation used for analyses of habitat
selection by grizzly bears, wolves, and woodland caribou in the Greater Besa Prophet area, northern British Columbia, 2001.....................154
Table C.1. An ecologically plausible set of models used to define the risk of
predation from grizzly bears during the calving and summer seasons in the Greater Besa Prophet area, northern British Columbia, 2002-2003............................................................................................................158
Table C.2. Final pooled models of bear risk (based on locations from 15
female grizzly bears) by season and year in the Greater Besa Prophet area, northern British Columbia, 2002-2003 showing
x
sample size (n), log-likelihood (LL), number of parameters (K), Akaike’s Information Criterion (AIC), change in AIC ( i∆ ), Akaike weights ( iw ), evidence ratios (Er), and average (n = 5) Spearman’s correlation coefficient from k-fold cross-validation ( sr ) with associated p-values (P). .............................................................................159
Table C.3. Coefficients of selection ( iβ and iβ for an averaged model
from Table C.2) and standard errors (SE) of the covariates for the final pooled models of bear risk by season and year in the Greater Besa Prophet area, northern British Columbia, 2002-2003. Significant parameters are indicated by asterisk(s) ....................................160
Table C.4. An ecologically plausible set of models used to define the risk of
predation from wolves in the Greater Besa Prophet area, northern British Columbia, 2002-2003. Models were developed for 5 wolf packs: pack 1 (Dopp-Keily), pack 2 (Lower Besa), pack 3 (Neves), pack 4 (Pocketknife), and pack 5 (Richards-Upper Prophet). .....................161
Table C.5. Final pooled models of wolf risk (based on locations from 22
individuals in 5 wolf packs) by season and year in the Greater Besa Prophet area, northern British Columbia, 2002-2003 showing sample size (n), log-likelihood (LL), number of parameters (K), Akaike’s Information Criterion (AIC), change in AIC ( i∆ ), Akaike weights ( iw ), evidence ratios (Er), and average (n = 5) Spearman’s correlation coefficient from k-fold cross-validation ( sr ) with associated p-values (P). .............................................................................162
Table C.6. Coefficients of selection ( iβ for models from Table C.5) and
standard errors (SE) of the covariates for the final pooled models of wolf risk across packs by season and year in the Greater Besa Prophet area, northern British Columbia, 2002-2003. Significant parameters are indicated by asterisk(s). .....................................................163
Table C.7. Final pack models of wolf risk (based on locations from 22
individuals in 5 wolf packs) by season in the Greater Besa Prophet area, northern British Columbia, 2002 showing sample size (n), log-likelihood (LL), number of parameters (K), Akaike’s Information Criterion (AIC), change in AIC ( i∆ ), Akaike weights ( iw ), evidence

xi
ratios (Er), and average (n = 5) Spearman’s correlation coefficient from k-fold cross-validation ( sr ) with associated p-values (P). ...................164
Table C.8. Final pack models of wolf risk (based on locations from 22
individuals in 5 wolf packs) by season in the Greater Besa Prophet area, northern British Columbia, 2003 showing sample size (n), log-likelihood (LL), number of parameters (K), Akaike’s Information Criterion (AIC), change in AIC ( i∆ ), Akaike weights ( iw ), evidence ratios (Er), and average (n = 5) Spearman’s correlation coefficient from k-fold cross-validation ( sr ) with associated p-values (P). ...................165
Table C.9. Coefficients of selection ( iβ and iβ for an averaged model from
Tables C.7, C.8) and standard errors (SE) of the covariates for the final risk models for wolf pack 1 (Dopp-Keily) by season and year in the Greater Besa Prophet area, northern British Columbia, 2002-2003. Significant parameters are indicated by asterisk(s)..........................166
Table C.10. Coefficients of selection ( iβ and iβ for an averaged model
from Tables C.7, C.8) and standard errors (SE) of the covariates for the final risk models for wolf pack 2 (Lower Besa) by season and year in the Greater Besa Prophet area, northern British Columbia, 2002-2003. Significant parameters are indicated by asterisk(s). ................167
Table C.11. Coefficients of selection ( iβ for models from Tables C.7, C.8)
and standard errors (SE) of the covariates for the final risk models for wolf pack 3 (Neves) by season and year in the Greater Besa Prophet area, northern British Columbia, 2002-2003. Significant parameters are indicated by asterisk(s). .....................................................168
Table C.12. Coefficients of selection ( iβ and iβ for an averaged model
from Tables C.7, C.8) and standard errors (SE) of the covariates for the final risk models for wolf pack 4 (Pocketknife) by season and year in the Greater Besa Prophet area, northern British Columbia, 2002-2003. Significant parameters are indicated by asterisk(s). ...............169
Table C.13. Coefficients of selection ( iβ and iβ for an averaged model
from Tables C.7, C.8) and standard errors (SE) of the covariates for the final risk models for wolf pack 5 (Richards-Upper Prophet) by

xii
season and year in the Greater Besa Prophet area, northern British Columbia, 2002-2003. Significant parameters are indicated by asterisk(s). ..................................................................................................170
Table D.1. A model set used to estimate the Normalized Difference
Vegetation Index during the calving and summer seasons in the Greater Besa Prophet area, northern British Columbia, 2001.....................172
Table D.2. The R2 values of the final models used to estimate the
Normalized Difference Vegetation Index during the calving and summer seasons in the Greater Besa Prophet area, northern British Columbia, 2001...........................................................................................173
Table D.3. Coefficients of selection ( iβ for a model from Table D.2) and
standard errors (SE) of the covariates of the multiple regression models for each Landsat image to estimate the Normalized Difference Vegetation Index during the calving and summer seasons in the Greater Besa Prophet area, northern British Columbia, 2002-2003. Significant parameters are indicated by asterisk(s)..........................174
Table E.1. Animal identification (ID), date of capture, sex (male (M) and
female (F)), and estimates for the date of birth (DOB), age (days), and weight (kg) of newborn caribou calves captured by hand and by net-gun in the Foothills (FTHILLS), Western High Country (WHC), and North Prophet (NP) calving areas within the Greater Besa Prophet area, northern British Columbia, 2002-2003..................................177
Table F.1. Percent cover and density of vegetation by functional group and
species and biomass of lichens ( x ± SE) using line-intercept and plot data at calving sites of woodland caribou in the Greater Besa Prophet area, northern British Columbia, 2002-2003..................................180
Table H.1. Reproductive status and ultrasound estimates of back fat for
female woodland in the Greater Besa Prophet area in northern British Columbia, 2002-2004; pregnancy for 38A was confirmed via necropsy and A = adult and Y = yearling. ...................................................185

xiii
Table I.1. Final pooled models of wolf risk by season in the Greater Besa Prophet area, northern British Columbia, 2001-2002 showing sample size (n), log-likelihood (LL), number of parameters (K), Akaike’s Information Criterion (AIC), change in AIC ( i∆ ), Akaike weights ( iw ), evidence ratios (Er), and average (n = 5) Spearman’s correlation coefficient from k-fold cross-validation ( sr ) with associated p-values (P). .............................................................................188
Table I.2. Coefficients of selection ( iβ from Table I.1) and standard errors
(SE) of the covariates for the final pooled models of wolf risk by season in the Greater Besa Prophet area, northern British Columbia, 2001-2002. Significant parameters are indicated by asterisk(s). ...............189
Table I.3. Final pack models of wolf risk during winter (November-
February) in the Greater Besa Prophet area, northern British Columbia, 2001-2002 showing sample size (n), log-likelihood (LL), number of parameters (K), Akaike’s Information Criterion (AIC), change in AIC ( i∆ ), Akaike weights ( iw ), evidence ratios (Er), and average (n = 5) Spearman’s correlation coefficient from k-fold cross-validation ( sr ) with associated p-values (P). ...............................................190
Table I.4. Final pack models of wolf risk during late winter (March-April) in
the Greater Besa Prophet area, northern British Columbia, 2001-2002 showing sample size (n), log-likelihood (LL), number of parameters (K), Akaike’s Information Criterion (AIC), change in AIC ( i∆ ), Akaike weights ( iw ), evidence ratios (Er), and average (n = 5) Spearman’s correlation coefficient from k-fold cross-validation ( sr ) with associated p-values (P). ......................................................................191
Table I.5. Coefficients of selection ( iβ for an averaged model from Tables
I.4) and standard errors (SE) of the covariates for the final risk models for wolf pack 1 (Dopp-Keily) during late winter in the Greater Besa Prophet area, northern British Columbia, 2001-2002. Significant parameters are indicated by asterisk(s). ...................................192
Table I.6. Coefficients of selection ( iβ and iβ for an averaged model from
Tables I.3, I.4) and standard errors (SE) of the covariates for the final risk models for wolf pack 2 (Lower Besa) by season in the

xiv
Greater Besa Prophet area, northern British Columbia, 2001-2002. Significant parameters are indicated by asterisk(s). ...................................193
Table I.7. Coefficients of selection ( iβ for an averaged model from Tables
I.4) and standard errors (SE) of the covariates for the final risk models for wolf pack 3 (Neves) during late winter in the Greater Besa Prophet area, northern British Columbia, 2001-2002. Significant parameters are indicated by asterisk(s). ...................................194
Table I.8. Coefficients of selection ( iβ and iβ for an averaged model from
Tables I.3, I.4) and standard errors (SE) of the covariates for the final risk models for wolf pack 4 (Pocketknife) by season in the Greater Besa Prophet area, northern British Columbia, 2001-2002. Significant parameters are indicated by asterisk(s). ...................................195
Table I.9. Coefficients of selection ( iβ for an averaged model from Tables
I.4) and standard errors (SE) of the covariates for the final risk models for wolf pack 4 (Richards-Upper Prophet) by season in the Greater Besa Prophet area, northern British Columbia, 2001-2002. Significant parameters are indicated by asterisk(s). ...................................196
Table I.10. Coefficients of selection ( iβ and iβ for an averaged model
from Tables I.3, I.4) and standard errors (SE) of the covariates for the final risk models for wolf pack 4 (Withrow) by season in the Greater Besa Prophet area, northern British Columbia, 2001-2002. Significant parameters are indicated by asterisk(s). ...................................197

xv
LIST OF FIGURES Figure 2.1. The Greater Besa Prophet area of the Muskwa-Kechika
Management Area in northern British Columbia, Canada, 2004...................18 Figure 2.2. The Foothills, North Prophet, and Western High Country
calving areas and calving sites for woodland caribou and linear features of the Greater Besa Prophet area, northern British Columbia, 2004.............................................................................................20
Figure 2.3. Timing of calf movements (>1 km) by age away from caribou
calving sites compared with mortality (i.e., number of animals that died by the end of weekx divided by the number of animals alive at the beginning of weekx) during the first two months of life (a) and timing of predation-caused mortalities of collared caribou calves (b) in the Greater Besa Prophet area, northern British Columbia, 2002 and 2003.......................................................................................................42
Figure 2.4. Kaplan-Meier estimates of survival rate at a given age (days)
for woodland caribou neonates in a) 2002 and 2003 and b) by calving area (Foothills (FTHILLS), Western High Country (WHC), and North Prophet (NP)) using pooled data for both years, in the Greater Besa Prophet area, northern British Columbia. ...............................44
Figure 2.5. The change in characteristics of predation risk and forage
biomass ( x ± SE) from calving (●) to summer seasons (○) for random points within the Foothills (FTHILLS), Western High Country (WHC), and North Prophet (NP) calving areas and in the Greater Besa Prophet area (LAND) in northern British Columbia, 2002-2003. Significant differences between seasons, as determined by the Mann-Whitney U-test, are indicated by an asterisk.......................................53
Figure 3.1. Movement rates (m/hr, x ± SE) of 10 adult female caribou
averaged within a month by individual and then averaged across individuals, during winter (November-February) and late winter (March-April) months in the Greater Besa Prophet area, northern British Columbia, 2001-2002.........................................................................90

xvi
Figure 3.2. Frequency distributions of wolf risk and distance to areas of high risk from availability data for female woodland caribou at two scales (seasonal movement and seasonal range) in winter (November-February, top graphs) and late winter (March-April, lower graphs) in the Greater Besa Prophet area, northern British Columbia, 2001-2002. ................................................................................101
Figure 3.3. Relative likelihood of female caribou selecting elevations (a, b),
slopes (c, d), and distances to areas of high risk (e, f) during winter (November-February) and late winter (March-April) assuming other covariates are constant in the final resource selection models for individual caribou (light shading) and pooled models (heavy shading) for animals living in the East ( ) and Mountain ( ) regions of the Greater Besa Prophet area, northern British Columbia, 2001-2002. Resource selection functions were scaled 0-1 (RSF0-1) as in Boyce and McDonald (1999) to evaluate selection of resources among individuals and pooled models. Slope was not included in the final pooled East model in the winter (c). ..............................................103
Figure 3.4. Number of GPS collared caribou that selected or avoided a
vegetation class (left axes) and the strength of significant (P < 0.050) coefficients of selection for the pooled models of animals living in the eastern (East, n = 2) and mountainous (Mountain, n = 8) portions of the Greater Besa Prophet area during winter (November-February) and late winter (March-April), in northern British Columbia, 2001-2002...................................................................................................107
Figure 4.1. Areas important to GPS-collared female woodland caribou in
winter and late winter in the Greater Besa Prophet, northern British Columbia, 2001-2002. ................................................................................132
Figure A.1. Schematic of the expandable drop-off collar for neonatal
caribou calves (T. Pojar, Colorado Division of Wildlife, pers. comm.; Advanced Telemetry Systems, Isanti, MN, USA) that was used to monitor 50 neonates in the Greater Besa Prophet area, northern British Columbia, 2002-2003.......................................................................152

xvii
Figure B.1. Nine habitats, as defined using a vegetation classification from an August 15, 2001 Landsat TM image (see Table B.1), in the Greater Besa Prophet area, northern British Columbia. .............................156
Figure G.1. Relationship between ocular estimates of percent cover and
measured samples of air-dried biomass for a) all lichen species and b) Cladina spp. at calving sites of woodland caribou in the Greater Besa Prophet area, northern British Columbia, 2002-2003. ......................183

xviii
ACKNOWLEDGEMENTS
The Muskwa-Kechika Trust Fund and the UNBC Northern Land Use Institute provided essential funding for this research, and R. Backmeyer of the Ministry of Water, Land, and Air Protection was quick to purchase several satellite images. The University of Northern British Columbia made my life easier in Prince George through scholarships.
Kathy Parker, Mike Gillingham, and Doug Heard have been, and will continue to be, a fundamental part of my education as a young professional in wildlife science. I’ve learned the importance and power of objectivity in science, as well as to never forget about the animals we study; Kathy, Mike, and Doug have created an environment designed to all but guarantee success of their students. Kathy’s patience, guidance, friendship, and constant selflessness no doubt will continue to shape my personal and professional life. The only problem with working for Kathy these past few years is that now I have to go and work for someone else; her example and skills as a supervisor, mentor, and teacher will be impossible to match. Mike’s impact on this research was immediate. His eagerness and enthusiasm for problem solving and tackling difficult questions, both biological and technical, and his ability to truly answer a question with a question is unparalleled. I’ve already found myself asking, “what is your question?” of other graduate students. Doug knows caribou and I was lucky to have him share with me his almost endless experiences with these truly unique animals. More importantly, working with Doug showed me that the excitement and novelty of being in the field never goes away.
Field work was rewarding and challenging and I will never forget my summers on the Besa, Thanksgivings at Keily, or visits to the Hammett’s. I owe thanks to the Williams Family for taking us into their outfit and treating us like family. The success of this project was directly linked to the technical skill and knowledge of the net-gunners and pilots. Rob Woods and Brad Culling are unique in their ability to safely capture animals both big and small, although Rob’s skills as a cribbage player are questionable. Greg Williams is an exceptional bush pilot and good friend; my experience with him has redefined what it means to have a coffee break. I thank A. Moore, N. Mavin, and O. Amar for their excellent flying skills and companionship. J. Ayotte, E. Jones, R. Lay, B. Milakovic, J. Psyllakis, and A. Walker are good friends and, no matter what the task, were always eager to help. C. Johnson was instrumental in getting me through resource selection and logistic regression; his research continues to strongly influence my work. M. Shook completed the mundane task of sorting lichens and made it look easy. S. Emmons was generous with his time working me through GIS and UNIX. I also need to acknowledge the animals whose lives we intruded on in effort to understand and protect them.
R. Wheate and N. Alexander took it upon themselves to take care of my best friend when I was away. W. Alldredge, W. Andelt, D. Benson, W. Gilgert, and T. Pojar helped prepare me for success in graduate school by challenging me as an undergraduate student and technician. The Clarkson and Olson families welcomed me into their home for my last few months in town and treated me like family and helped me finish in the process. Bobbi, JB, and Indy have been my constant companions through it all, thank you. For their extraordinary support, I share this

xix
success with my parents (David and Bobbie Gustine), and my siblings (James and Sarah) and their significant others (Jamie and Bobby). Nicole’s understanding, love, and support were influential; I couldn’t have done it without her. I would like to dedicate this humble work to my uncle, Richard Gustine, who past away suddenly 4 December 2004, and his 3 children and their families. Dick will be greatly missed.

1
CHAPTER 1: INTRODUCTION
CONTEXT
The northern ecotype of woodland caribou (Rangifer tarandus caribou) is
blue-listed as a species of concern in British Columbia and is listed as threatened in
Canada (Committee on the Status of Endangered Wildlife 2002). Recent literature,
regional data, and anecdotal evidence suggest that many caribou populations are at
low levels and are either stable or declining in most of Canada (Seip and Cichowski
1996; Bergerud and Elliot 1998; Heard and Vagt 1998; Mahoney and Virgl 2003;
McLoughlin et al. 2003). The resiliency of caribou to endure stochastic events (e.g.,
extreme winters or forest fires), changes in predator densities, and large-scale
human disturbances (i.e., habitat alteration) is, therefore, a source of concern for
land managers and users. Woodland caribou are essentially an indicator of
landscape or ecosystem health because of their large landscape requirements and
sensitivity to human (Murphy and Curatolo 1987; Bradshaw et al. 1997; Stuart-Smith
et al. 1997) and environmental disturbance throughout the year (Schaefer and Pruitt
1991). Caribou may be most susceptible to disturbances during ‘critical’ times of the
year (e.g., calving and winter) (Nellemann and Cameron 1998; Dyer et al. 2002),
and identifying calving and wintering areas is an important step towards maintaining
population persistence.
Calving
Relative to other North American ungulates, woodland caribou occur at lower
2
densities and use larger areas to meet seasonal demands for calving (spring and
summer), breeding (fall), and over-wintering (Cumming 1992; Seip 1992).
Distribution over large areas appears to minimize predation from wolves and may
play a significant role in calving success (Bergerud and Page 1987; Seip 1992;
Barten et al. 2001). I define dispersal as in Bergerud et al. (1984), Bergerud and
Page (1987), and Seip (1992), as increasing the distance between both parturient
and non-parturient caribou, other prey species (e.g., moose (Alces alces)), and
predators; this increases search time and lowers encounter rates for predators
(Bergerud et al. 1984; Bergerud and Page 1987; Bergerud 1992; Barten et al. 2001).
Calf survival may be related to the ability of parturient caribou to segregate
themselves from wolf (Canis lupus) and/or moose populations (Bergerud et al. 1984;
Seip 1992), as wolf predation appears to be the main source of mortality for
neonates (Gasaway et al. 1983; Bergerud and Elliot 1986; Bergerud and Page 1987;
Seip 1992; Adams et al. 1995; Wittmer 2004). Other causes of mortality, however,
also may be important (e.g., bear (Ursus spp.) and golden eagle predation (Aquila
chrysaetos), insect harassment, malnourishment) (Dale et al. 1994; Griffith et al.
2002; Mahoney and Virgl 2003).
Because of the importance of predation on neonatal survival, parturient
females likely select calving areas lower in predation risk (Bergerud et al. 1990;
Bergerud 1996; Cumming et al. 1996; Heard et al. 1996; Barten et al. 2001). Often
these low-risk areas are in alpine environments with decreased forage abundance in
early summer (Bergerud et al. 1984; Seip 1992; Poole et al. 2000; Barten et al.
2001). It is also during this time that lactating females experience high nutritional

3
demands (White and Luick 1984; Parker et al. 1990) and are at their worst body
condition of the year (approx. 3 weeks after parturition) (Chan-McLeod et al. 1999).
These nutritional demands of lactation cannot be met through intake of forage in
areas with low primary productivity, and therefore, females must use body reserves
(White et al. 1981). Post and Klein (1999) emphasized the importance of maternal
condition and subsequent nutritional demands and suggested that the productivity of
early summer range may have direct effects on perinatal mortality, especially in
areas with low lichen productivity in the winter. Access to forage during the calving
and summer season also may affect the probability of pregnancy and timing of
estrus in fall (Cameron et al. 1993; Adams and Dale 1998a,b), which could then
affect the mass (Reimers et al. 1983) and subsequent survival of the next year’s calf
as heavier calves appear to have higher survival than those born at lighter weights
(Cameron et al. 1993; Adams et al. 1995). Therefore, to enhance reproductive
fitness, females with young must make compromises, or ‘trade-offs’ between
increased access to forage and minimizing the risk of predation (Bowyer et al. 1998;
Rachlow and Bowyer 1998; Bowyer et al. 1999).
Winter
In British Columbia, northern woodland caribou use a variety of habitats (i.e.,
combinations of biotic and abiotic factors) during winter. Low elevation pine-lichen
woodlands when snow depths are low (Johnson 2000), windswept alpine ridges
(Cichowski 1993; Wood 1996), and spruce-fir forests (Poole et al. 2000) are all
wintering habitats for various woodland caribou herds or, possibly, for the same herd

4
at different times of winter or in different years. Variation in the use of resources
among populations is likely due to differences in the availability of habitats to these
herds and/or management/industrial activities that have altered availability of
particular habitats directly (e.g., destruction of forage) or indirectly (e.g., created
more favorable habitat characteristics for other ungulates and/or predators).
Sensitivity of woodland caribou to anthropogenic and environmental
disturbances, particularly during winter, is well documented and an important
consideration in establishing a population’s resiliency (Bradshaw et al. 1997; Stuart-
Smith et al. 1997; James and Stuart-Smith 2000; Dyer et al. 2001, 2002; Dzuz 2001;
Weclaw and Hudson 2004). Loss of functional winter habitat because of strong
spatial avoidance of industrial developments is a significant factor in the decline of
woodland caribou in Alberta (Weclaw and Hudson 2004). Avoidance of industrial
developments may be a secondary result from an increased risk of predation. For
example, linear corridors associated with industrial development tended to increase
wolf predation rates on caribou (James and Stuart-Smith 2000). Industrial activity,
including seismic exploration, may increase energetic costs for caribou by increasing
movements and/or decrease foraging times during times of high nutritional stress in
the winter (Bradshaw et al. 1997).
Prescribed burning and its effects also may influence caribou-wolf ecology.
Historically, moose and elk (Cervus elaphus) were either absent (elk) or occurred in
low densities (moose) in northern British Columbia (Bergerud and Elliot 1986;
Bergerud and Page 1987; Seip 1991; Bergerud 1996). Prescribed burning between
1950 and the mid-1990s greatly increased the abundance of early seral habitats that

5
favored expansion of moose and elk populations (Bergerud 1974; Peck and Peek
1991; Bergerud 1996; Seip and Cichowski 1996). Bergerud’s (1983) prey-switching
theory postulated that an increase in moose densities has caused wolves to switch
from caribou as a primary food source to moose as an additional alternative. This
switch effectively eliminated the functional response between caribou and wolf
populations (Bergerud 1983; Seip 1991). Furthermore, the expansion of elk in
northern British Columbia provided an additional prey source that enhanced wolf
populations. Increasing wolf numbers are suspected to be a significant factor in
declining caribou herds (Bergerud 1974; Bergerud et al. 1984; Bergerud and Elliot
1986; Bergerud and Page 1987; Seip 1991).
The introduction of disturbance to wintering and calving areas coupled with
low reproductive potential (relative to other cervids) could have short and long-term
deleterious effects on populations of woodland caribou. These effects include loss
of actual (Joly et al. 2003) and functional habitat (Dyer et al. 2001; Weclaw and
Hudson 2004), and/or elevated predation risk (James and Stuart-Smith 2000; Dyer
et al. 2001, 2002). An increase in applications for petroleum exploration in northern
British Columbia accentuates the need for research to identify wintering and calving
areas to ensure industrial access can be designed to minimize impacts. Quantitative
evaluation of predation risk and its influence on selection of resources, and
identification of ‘trade-off’ mechanisms between the risk of predation and forage
availability are needed. The following objectives were addressed to identify
processes and areas on the landscape that are important to the resiliency of
woodland caribou populations in northern British Columbia and to provide insights

6
into the importance of predation risk and nutrition in the selection of calving
strategies.
Objectives
1) To determine relationships among calving strategies, calf survival, and cause-
specific mortality.
Wolf predation appears to be the primary source of mortality for caribou
calves (Gasaway et al. 1983; Bergerud and Elliot 1986; Seip 1991; Adams et al.
1995), but other factors also contribute to rates of neonatal mortality (Downes et al.
1986; Ballard 1994; Griffith et al. 2002). Caribou may select calving areas and/or
calving sites in response to predation risk (Bergerud and Page 1987; Seip 1992;
Barten et al. 2001). In my study, I collared 50 neonatal caribou, determined sources
and timing of mortality, modelled the risk of predation to caribou neonates from
grizzly bears and wolves, and examined the relationship between the risk of
predation and neonatal survival.
2) To assess the roles of predation risk and forage availability at different scales in
determining successful calving strategies of northern woodland caribou.
Studies suggest that predation risk is a driving factor in selection of calving
habitat(s), and that parturient caribou use an alternate foraging strategy to non-
parturient caribou (Bergerud and Page 1987; Barten et al. 2001). Because calving
caribou use body reserves during early lactation (White and Luick 1984; Chan-
McLeod et al. 1999), nutritional demands may be an important component in the

7
selection of resources. Calving areas should provide for this nutritional need, while
minimizing the level of predation risk. Identifying possible relationships among the
risk of predation, spacing out from areas of high predation risk, and characteristics of
forage (quantity and quality) during calving and summer should provide insights into
whether calving caribou exhibit trade-off ‘decisions’ in response to predation risk. In
my study, I used large- and small-scale characteristics (i.e., predation risk and
characteristics of vegetation) of the landscape, calving strategies, and calving sites
to examine hierarchical responses of woodland caribou to the risk of predation and
forage availability.
3) To model resource selection by woodland caribou in the winter and late winter
seasons in the Greater Besa Prophet area of northern British Columbia.
The confounding influence of scale and variation in selection among
individuals within a population can make biological interpretation of the mechanisms
of selection difficult (Wiens 1989; Levin 1992; Aebischer et al. 1993). The
importance of environmental and ecological components of selection is likely to vary
across scales (Johnson 1980; Johnson 2000; Rettie and Messier 2000). To
adequately define resource selection for caribou in winter and late winter in the
Greater Besa Prophet area of northern British Columbia, I identified the role of body
condition relative to the importance of energetic cost of movement, risk of predation,
and distance to areas of high risk in the selection of resources at a relatively small
spatial scale; identified the importance of the components of risk at 2 spatial scales;
quantified the variation in resource selection among individual caribou; and

8
qualitatively evaluated the utility of resource selection models pooled across
individuals compared to individual models for collared caribou.
ORGANIZATION OF THESIS
I organized this thesis as 2 separate chapters to be submitted for journal
publication, followed by a chapter on implications for management. The portion of
my research that addresses calf survival, cause-specific mortality and the risk-forage
trade-off (objectives 1 and 2) is presented in Chapter 2 (Calving strategies and calf
survival of woodland caribou in a multi-predator ecosystem in northern British
Columbia). Chapter 3 (Interpreting resource selection between scales among
individual woodland caribou in winter) presents methods, results, and discussion for
addressing objective 3. The last chapter (Management implications for the Greater
Besa Prophet area) summarizes important considerations for managing woodland
caribou in the Greater Besa Prophet area in northern British Columbia.
9
CHAPTER 2: CALVING STRATEGIES AND CALF SURVIVAL OF WOODLAND
CARIBOU IN A MULTI-PREDATOR ECOSYSTEM IN NORTHERN BRITISH
COLUMBIA1
ABSTRACT
The proximate role of predation in limiting caribou (Rangifer tarandus)
populations is well documented, but the long-term effects of predation pressure on
selection of calving habitats and the subsequent impacts to calving success remain
unclear. We examined the relationships among calf survival, predation risk, and
forage characteristics among 3 calving areas and across spatial scales in the Besa
Prophet River drainage of northern British Columbia. Fifty woodland caribou (R. t.
tarandus) neonates were collared and monitored twice daily for the first month and
once weekly during the second month of life over the summers of 2002 and 2003.
Predation risk for 2002-2003 was determined using resource selection functions
(RSFs) from global positioning system (GPS) locations of 15 grizzly bears (Ursus
arctos) and 5 wolf (Canis lupus) packs. The Normalized Difference Vegetation Index
(NDVI) derived from Landsat Thematic Mapper (TM) and Enhanced Thematic
Mapper (ETM) data was used to quantify indices of large-scale characteristics of
forage (i.e., vegetation vigor and an index of forage quality). We incorporated small-
and large-scale characteristics (i.e., risk, forage, and movement of caribou calves) of
neonatal calving sites into logistic regression models to predict survival for the
1A version of this chapter will be submitted for publication with the following authorship: Gustine, D. D., K. L. Parker, R. J. Lay, M. P. Gillingham, and D. C. Heard.

10
calving (25 May-14 June) and summer (15 June-15 August) seasons. Risk and
forage characteristics were highly variable among calving areas and calving sites,
and parturient caribou responded to these characteristics at different scales.
Minimizing wolf risk and selecting against areas of high biomass were important at
large scales; avoidance of areas with high biomass was likely associated with an
increased risk of predation. Calving in areas high in forage quality was important
across scales, as parturient caribou ‘took’ higher levels of risk for access to areas of
high vegetative change. Models using small-scale characteristics of calving sites to
predict survival performed better in the calving than summer season; large-scale
characteristics predicted survival of caribou neonates better in summer than in the
calving season. Wolverines and wolves were the main cause of mortality during the
calving and summer seasons, respectively. Movement away from calving sites was
an important covariate in the calf survival models and appeared to be in response to
increased access to forage during the peak demands of lactation and/or minimizing
the risk of wolf predation in the summer. High variation in risk and forage attributes
among calving areas and at calving sites within calving areas, with no differences in
calf mortality related to that variation, illustrates the importance of plasticity as a life-
history strategy for woodland caribou.
INTRODUCTION
Risk of predation is an important component in understanding foraging
strategies and habitat selection (Lima and Dill 1990; Sweitzer 1996; Rachlow and
Bowyer 1998; Kie 1999; Grand 2002; Ben-David et al. 2004). For animals to
11
maximize reproductive success, they must make trade-off ‘decisions’ between the
risk of predation and securing adequate forage to meet nutritional demands
(Sweitzer 1996; Bowyer et al. 1998; Rachlow and Bowyer 1998; White et al. 2001;
Ben-David et al. 2004). Trade-offs are dependant on various biological (e.g.,
nutritional condition, reproductive status, age; Berger and Cunningham 1988;
Sweitzer 1996; Rachlow and Bowyer 1998; Barten et al. 2001; White et al. 2001;
Ben-David et al. 2004), environmental (e.g., heterogeneity of vegetation on the
landscape, densities and/or distribution of other prey species and predators;
Bergerud et al. 1984; Seip 1991; Kie 1999; Altendorf et al. 2001), and/or social
variables (e.g., group size, gregariousness, status; Lima and Dill 1990; Molvar and
Bowyer 1994; Hebblewhite and Pletscher 2002; Miller 2002). Actual or perceived
risk may alter species-specific foraging strategies (Krebs 1980; Lima and Dill 1990).
Reproductive females within a species may be the most sensitive to foraging in high-
risk habitats due to the susceptibility of neonates to predators (Bergerud et al. 1984;
Lima and Dill 1990; Bowyer et al. 1998; Rachlow and Bowyer 1998; Miller 2002;
Ben-David et al. 2004). Both sexes of a species must ensure that body reserves are
sufficient for breeding and over-winter survival, but females must also secure
adequate energy and protein inputs to meet the additional demands of gestation and
lactation, and minimize the risk of predation to themselves and their offspring. Costs
of foraging decisions, in the form of increased risk, are likely to vary spatially and
temporally, but depend on the relationship between the risk of predation and forage
characteristic(s) (Bowyer et al. 1998; Bowyer et al. 1999).
Studies have evaluated the behavioral response(s) of reproductive female

12
cervids in response to variation in the relationship between small-scale risk and
forage characteristics (e.g., vegetative characteristics of birth sites; Molvar and
Bowyer 1994; Bowyer et al. 1998; Bowyer et al. 1999; Barten et al. 2001; White and
Berger 2001; White et al. 2001), but rarely has the risk-forage relationship been
investigated at larger scales (Heard et al. 1996; Griffith et al. 2002). The advent of
GPS and remote-sensing technologies offer unique opportunities to quantify risk and
forage characteristics over large, diverse landscapes (Boyce and McDonald 1999;
Griffith et al. 2002; Boyce et al. 2003; Nielsen et al. 2003; Johnson et al. 2004).
Woodland caribou are an excellent species to examine trade-off ‘decisions’ at large-
scales because individuals use large areas to meet their seasonal demands,
generally have low reproductive potential, and are demographically sensitive to
predation. Caribou are also notable among ungulates in that their protein balance
may be negative for much of the year (Gerhart et al. 1996). This may increase the
importance of access, particularly to spring forage, to meet high nitrogen demands
following winters on low protein diets and, therefore, the predation risk-foraging
‘trade-off’ my be more obvious than in other species.
Woodland caribou have low rates of recruitment even though pregnancy rates
range from 90-100% (Cumming 1992; Seip and Cichowski 1996; Rettie and Messier
1998; Mahoney and Virgl 2003; McLoughlin et al. 2003). Precise estimates of
parturition for woodland caribou are unavailable, but estimates for barren-ground
caribou (R. t. groenlandicus) among years range from 71-92% ( x = 81%, Griffith et
al. 2002). Low recruitment rates appear to be related to high calf mortality by wolf
predation during the early neonatal period (Gasaway et al. 1983; Bergerud and Elliot

13
1986; Bergerud and Page 1987; Seip 1992; Adams et al. 1995; Wittmer 2004), but
other causes of death such as predation from bears (Ursus spp.) (Ballard 1994;
Young and McCabe 1997; Mahoney and Virgl 2003), golden eagles (Aquila
chrysaetos) (Dale et al. 1994; Adams et al. 1995; Griffith et al. 2002), and lynx (Lynx
canadensis) (Bergerud 1983), congenital defects, insect harassment, sickness
and/or disease, malnourishment, and exposure may play important roles in calf
mortality (Seip 1991; Dale et al. 1994; Bergerud 1996; Heard et al. 1996). In some
populations, mortality rates through the first winter of life appear to be as important
to recruitment as mortality through the early neonatal period. Over-winter calf
mortality rates in British Columbia range between 20-40% and in declining caribou
populations, 60% of calves observed in late June died during their first winter (Seip
and Cichowski 1996).
Selection of calving areas is likely influenced by the level(s) of predation risk
in adjacent habitats (Bergerud et al. 1990; Bergerud 1996; Cumming et al. 1996;
Heard et al. 1996; Barten et al. 2001). Calving areas for woodland caribou are often
in rugged mountainous areas in the alpine or shrub-krummholz zones (Oosenbrug
and Theberge 1980; Barten et al. 2001). Calving success can be higher for females
that calve in alpine areas, presumably due to a decreased exposure to predation
(Bergerud et al. 1984; Seip 1992; Poole et al. 2000; Barten et al. 2001). Bergerud
and Page (1987) proposed that calving caribou maximize distance from predators
and alternate prey species regardless of vegetative phenology. The ability of calving
caribou to disperse across the landscape may decrease calf mortality (Seip 1992)
because the dispersal by parturient females increases the search time and lowers

14
the encounter rates of predators, thereby decreasing hunting efficiency (Bergerud
and Page 1987; Bergerud 1992; Barten et al. 2001). Bergerud (1996) hypothesized
that for caribou, “forage selection will occur in the summer, but only within the
options provided by low predation risk habitats.” Indeed, calving caribou in Alaska
used sites with fewer predators and a lower abundance of forage when compared to
non-parturient caribou; forage quality, however, was not compromised (Barten et al.
2001).
Although predation risk appears to play a role in selection of habitat(s) for
successful calving, other factors, such as forage characteristics and/or snow cover
at large scales, may play equally important roles (Eastland et al. 1989; Barten et al.
2001; Griffith et al. 2002). Maternal condition has a direct impact on fetal viability
and subsequent calf survival, primarily resulting from available resources (i.e.,
energy and protein) of the dam towards calf production, birth weight, and weight gain
(Cameron et al. 1993; Adams and Dale 1998a,b; Russell et al. 1998). Heavier
calves have higher rates of survival than those born at lighter weights (Cameron et
al. 1993), but survival also depends on maternal condition at parturition (Post and
Klein 1999). Selection of productive early summer range has direct effects on
perinatal mortality (Post and Klein 1999) because physiological demands of lactation
are highest during the first 3 weeks following calving (White and Luick 1984; Parker
et al. 1990); parturient caribou experience their lowest condition of the year during
this time (Chan-McLeod et al. 1999). The importance of forage characteristics has
been documented for arctic caribou where the relative amount of forage available on
the calving grounds, as indexed by the NDVI, was the best predictor of early calf
15
survival (Griffith et al. 2002). A plausible explanation for discrepancies on the
importance of predation and nutrition in limiting caribou populations is that the
relative importance of predation risk and/or forage availability may be area- or herd-
specific, vary within an area or herd, or more likely, be a ‘trade-off’ between the 2
factors. This ‘trade-off’ may vary across spatial and temporal scales (Wiens 1989;
Levin 1992).
Caribou in mountainous environments in winter use multiple strategies to
accommodate a predictable food source, varying snow depths, and predation risk
from wolves (Johnson et al. 2000; Johnson et al. 2001). Such strategies could be a
product of a heterogeneous environment and/or a response to a dynamic risk
‘landscape’, where variation in use of resources (i.e., plasticity) by caribou may
make them less predictable in space and time. Indeed, plasticity among individuals
and populations appears high for woodland caribou in British Columbia (Johnson et
al. 2002a,b; Johnson et al. 2004; see Chapter 3), and as in other cervids (Bowyer et
al. 1999), this plasticity may extend to other important times of the year (i.e.,
calving). In addition to spatial separation from non-parturient caribou, parturient
caribou may use different strategies to cope with varying costs of risk across a
diverse landscape to meet the demands of lactation and calf survival (Bergerud et al.
1984; Bergerud and Page 1987; Barten et al. 2001).
The goal of this study was to compare risk and forage characteristics among
and within 3 different calving areas (i.e., calving strategies) within the Greater Besa
Prophet area of northern British Columbia. We examined risk and forage
characteristics and calf survival by calving strategy. If predation risk ‘drives’ the

16
selection of calving strategies, then risk within each of the calving strategies should
be lower than the landscape as a whole. Alternatively, if nutrient acquisition ‘drives’
the selection of calving strategies, then forage characteristics for all calving
strategies should be relatively higher than for the landscape. If trade-offs are
occurring, then relative risk and forage characteristics could vary among calving
strategies. Within any single calving strategy, however, there may be a smaller
scale-dependant response to risk and forage characteristics and/or the trade-off
between them. In these cases, risk and forage characteristics at calving sites within
each calving strategy would differ from what was available within that strategy. If
risk is limiting, then calf survival should be lower in ‘riskier’ calving strategies.
Alternatively, if forage is limiting, calf survival should be higher in strategies with
higher relative forage quantity and/or quality. The following hypotheses were
evaluated: 1) calf survival and cause-specific mortality differ among calving
strategies, 2) calving occurs at high elevations, 3) calving occurs in areas with the
lowest risk of predation, 4) calving occurs in areas with the highest nutritional value,
and 5) forage characteristics affect the level of risk that caribou take within a calving
strategy. Therefore, we assessed the roles of predation risk and forage availability
at different scales in determining successful calving strategies of northern woodland
caribou.
STUDY AREA
The Greater Besa Prophet area (GBPA) encompasses 740,800 ha, the
majority of which is within the 6.2 million-ha Muskwa-Kechika Management Area in

17
northern British Columbia (Fig. 2.1). The GBPA is located between 57o11’ and
57o15’ N latitude, and 121o51’ and 124o31’ W longitude. Elevations range from 700-
2,200 m, with treeline occurring between 1,450-1,600 m. Valleys in the GBPA are
often covered with hybrid (Picea glauca x engelmanni) and/or black spruce (Picea
mariana), quaking aspen (Populus tremuloides), and poorly drained willow-birch
(Salix spp., Betula glandulosa) communities with infrequent white spruce (Picea
glauca). Mature lodgepole pine (Pinus contorta) is uncommon. Dominant
understory species are soapberry (Sheperdia canadensis), Labrador tea (Ledum
groenlandicum), sedges (Carex spp.), horsetail (Equisetum spp.), crowberry
(Empetrum nigrum), alder (Alnus spp.), and various mosses with few lichens. Alpine
areas consist of permanent snowfields, glaciers, barren rock with sparse or mat
vegetation, and grasslands with trees in krummholz form (Demarchi 1996).
Common alpine species are mountain avens (Dryas integrifolia), northern rough or
altai fescue (Festuca altaica), arctic white heather (Cassiope tetragona), moss
campion (Silene acaulis), and a variety of terrestrial lichens and mosses.
The area is characterized by repeated east-west drainages with south-facing
slopes that support one of the most diverse ungulate predator-prey ecosystems in
North America. Large mammals found in the GBPA are elk (Cervus elaphus),
moose (Alces alces), woodland caribou, white-tailed (Odocoileus virginianus) and
mule deer (Odocoileus hemionus), Stone’s sheep (Ovis dalli stonei), mountain goat
(Oreamnos americanus), bison (Bison bison), wolf, grizzly and black bear (U.
americanus), coyote (Canis latrans), lynx, and wolverine (Gulo gulo).
The GBPA is currently unaffected by large-scale industrial activity, but

18
Figure 2.1. The Greater Besa Prophet area of the Muskwa-Kechika Management Area in northern British Columbia, Canada, 2004.

19
historical and current human activities include hunting and prescribed burning.
Terrestrial access is restricted except for low all-terrain vehicle/snowmobile activity
in the southern portion of the study area. Moose, deer, elk, caribou, Stone’s sheep,
mountain goat, grizzly bear, and wolf hunting occur throughout the area. Seismic oil
exploration has been infrequent in the mountainous portions of the GBPA (Fig. 2.2),
but applications for oil and gas exploration have increased. The Besa Prophet pre-
tenure planning area within the GBPA is designated as a special management zone
of the Muskwa-Kechika Management Area (Fig. 2.1). This designation allows
exploration and/or extraction of natural resources if concerns for wildlife populations
are addressed prior to development.
There are 3 general calving areas for caribou in the GBPA as defined by
differences in small- and large-scale vegetation characteristics, elevation,
topography, geographic location, and presence of adult female caribou and calves
during May-July 2002 and 2003 (Fig. 2.2). These calving areas are the Foothills,
Western High Country, and North Prophet. The Foothills area on the eastern front of
the Rocky Mountains, with elevations ranging from 1,000-2,000 m, is defined by
timbered valleys and steep, vegetated mountains. Vegetation types are
heterogeneous with spruce-lined valleys transitioning into shrubby subalpine and
alpine habitats with little non-vegetated cover and no permanent snowfields. The
Western High Country area west of the Foothills ranges from 1,400-2,500 m and is
characterized by rugged and steep mountains with little vegetative cover and narrow
valleys. Rock, permanent snowfields, and glaciers dominate this area with
vegetative cover in the form of spruce-lined river bottoms, and subalpine and alpine

20
Figure 2.2. The Foothills, North Prophet, and Western High Country calving areas and calving sites for woodland caribou
and linear features of the Greater Besa Prophet area, northern British Columbia, 2004.

21
habitats in the north- and south-facing hanging valleys. The North Prophet is north
of the Western High Country and northwest of the Foothills with elevations ranging
from 1,200-2,400 m. This area is characterized by wide valleys with no forest cover,
and rugged and steep mountains. Subalpine-shrub and subalpine habitats in the
valley bottoms grade into alpine habitats on mountainsides. Permanent snowfields
and talus and scree fields are common at high elevations.
METHODS
Cow and calf capture
Forty-eight female caribou were captured and fit with GPS collars (Simplex,
Televilt, Lindesberg, Sweden) during the winters of 2001/2002 and 2002/2003. We
took blood samples to determine reproductive condition via serum progesterone
concentrations (Prairie Diagnostics Services, Saskatoon, SK, Canada). Animals
were monitored from fixed-wing aircraft (Piper Super Cub 18A) twice daily to identify
calving areas, onset of parturition, and parturition rates. Collared individuals were
determined to be parturient or non-parturient by calf-at-heel. Once parturition
began, calf captures were by helicopter (Bell 206).
We captured 25 caribou neonates during each of the summers of 2002 and
2003. Calves from collared caribou were targeted for capture, but we captured other
calves if the capture of these ‘targeted’ calves was not possible. A two-person
capture crew, net-gunner, and helicopter pilot canvassed calving areas of collared
females for calves that were old enough for processing (>24 h) (Adams et al. 1995).
22
We captured calves by hand or by net-gun. To capture calves by hand, one
member of the capture crew was dropped from the helicopter close to and below the
cow-calf pair, while the other member was dropped above the pair; calves were then
pursued on foot. For net-gun capture, we deployed a light-weight 3.7-m2 net with
10.2-cm mesh and a tensile strength of 77.3 kg (model 5608.19, Coda Enterprises,
Inc., Mesa, AZ, USA) from the helicopter.
During processing, the crew wore clean latex gloves for each capture to
minimize scent transfer among calves and humans (Adams et al. 1995; T. Pojar,
Colorado Division of Wildlife, pers. comm.). Calves were sexed by the presence or
absence of a vulva (Bergerud 1961). We weighed calves using a disposable cotton
sling (approx. 33-cm diameter) and a 20-kg hand-held spring scale. Coordination
and hoof and umbilicus condition were examined to estimate age (days) from birth
(Haugen and Speake 1958). General examinations included notations on presence
of diarrhea, and/or injuries.
Each calf was fitted with a drop-off radio-collar weighing approx. 120 g
(approx. 1.3% of the average body mass of a captured calf). Collars consisted of a
leather-belted and elastic (1:1.5 expansion ratio) neckband with a weather- and
impact-resistant motion-sensitive transmitter (Advanced Telemetry Systems, Isanti,
MN; as designed by T. Pojar, Colorado Division of Wildlife, pers. comm.; Appendix
A: Table A.1, Fig. A.1); the pulse rate of the transmitter increased from 60 to 90
pulses/min if stationary for >2 h. The manufacturer-supplied collar was cut across
the leather belting and reattached with 2 lengths of surgical tubing approx. 57 mm
long (7 mm inner and 10 mm outer diameters) (Appendix A). The combination of

23
surgical tubing and elastic ensured that the collars would accommodate calf growth.
Surgical tubing is sensitive to exposure from ultra-violet radiation and collars were
expected to drop off in 4-5 months.
For subsequent analyses, the calving site was defined as the site where the
cow-calf pair was first observed, and was marked as a GPS location. We used a t-
test to assess differences between birth weights of male and female caribou calves
(estimated from weight at capture (a) and age in days (x), where y = a-0.571x;
Parker 1989). We used analysis of variance (ANOVA) to examine birth weights
among calving areas, and Tukey’s honest significant difference was employed for
unequal sample sizes for multiple comparisons (Zar 1998). Annual and pooled sex
ratios of captured calves were compared using chi-squared (χ2) analyses (Zar 1998).
Cause-specific mortality and calf survival
Collared calves were monitored by fixed-wing aircraft (Piper Super Cub 18A)
twice daily (0700-1100 and 1800-2300), weather permitting, for 28 d after captures
and then once weekly until the end of July per field season. To quantify monitoring
frequency during 28 d post capture, we randomly selected an animal and averaged
the time (hrs) between relocations. General locations of all adult female caribou and
calves observed during monitoring flights were counted and recorded. A movement
event was defined as the movement of a calf >1 km from its calving site. In the case
of movement events that occurred over more than 1 d, the day the calf left the
calving site was defined as the day of the movement. After detecting a mortality
signal, the mortality site was visited by helicopter as soon as possible (<16 hrs). A

24
GPS location was taken on the ground where the collar was found.
At each mortality site, photos were taken, whole or partial carcasses
recovered, and/or any evidence (e.g., scat, tracks, and hairs) recorded. If possible,
we conducted partial necropsies of predation mortalities to identify timing of wounds.
Whole carcasses were weighed, and then frozen for subsequent analysis. Cause-
specific mortality was assigned, as outlined by Acorn and Dorrance (1998), to one of
the following causes of death: 1) accident/abandonment, or predation by 2) bear, 3)
eagle, 4) wolverine, 5) wolf, or 6) unknown predator.
Observed versus expected frequencies of cause-specific mortalities (annual,
pooled over 2 yrs, and by calving area) and sex ratios of calves that died were
compared using χ2 analyses. Identified predation-specific mortality among the 3
calving areas was examined using observed (nFoothills = 6, nWestern High Country = 6, and
nNorth Prophet = 2) and expected (n = 14) frequencies of identified mortalities from
predation. The probability of calf survival from predation for a specific time period
was determined using the Kaplan-Meier (KM) estimator on an annual and pooled
basis (Pollock et al. 1989). Non-predation mortalities were censored from the
survival estimate at the time of death. Survival rates by age were determined in
days for the first 28 d and in weeks for the next 28 d. Mortality rate was estimated
by week and defined as the number of animals that died by the end of weekx divided
by the number of animals alive at the beginning of weekx. Survival for each calving
area was calculated using pooled survival data. Survival curves across years were
compared using the log-rank test with a conservative estimate of variance (Pollock
et al. 1989). To increase sample size, we pooled data across years and defined 2

25
seasons of survival for small- and large-scale models: survival to the end of calving
(25 May-14 June) and through summer (15 June-15 August). Survival was
compared between these seasons and among calving areas, with a Bonferroni
adjustment, using the difference in proportions test (Zar 1998). The number of
animals at risk at the beginning of seasonx was defined as the sample size for
seasonx, except for calving when sample size was determined at the termination of
capture effort (n = 48). Survival for seasonx was equal to the KM estimate of survival
at the end of seasonx.
Small-scale characteristics of calving sites
We collected small-scale habitat information at calving sites in the first week
of July during 2002 and 2003. A 100-m cloth tape was placed on the ground at a
random bearing with the calving site as the center point. We noted general
vegetation community types within 100 m of each calving site. The line-intercept
method was used to calculate absolute cover of trees, shrubs, and dwarf shrubs by
species, and rocks/soil and cliffs (Higgins et al. 1996). If a transect extended over a
cliff, the intercept value was noted, and the survey was terminated.
Five plots (50 x 50 cm) were placed randomly on either side of the transect at
25-m intervals. We recorded the number of individual plants for each graminoid,
lichen, and forb species within the plots to estimate plant density. Percent cover by
each species, and rocks/soil was estimated visually with the aid of laminated
cardboard circle with an area approx. 1% of the plot (0.0025 m2). To evaluate the
relationship between percent cover of lichens and lichen biomass (g/m2), we

26
sampled lichen biomass by removing a 20 x 20-cm sample of soil and vegetation
from a randomly chosen corner of each plot. The first 7 transects were not sampled
for biomass, as the decision to evaluate the percent cover-biomass relationship was
made in the first field season after we started collected calving site data. Biomass
samples were air-dried in paper bags and subsequently sorted, identified to genus,
and weighed to the nearest 0.001 g. The Shannon-Wiener index of diversity (H’) for
lichen biomass and herbaceous species at each calving site was calculated as in
Krebs (1989).
Each calving site characteristic (as measured above) was compared for
calves that lived and died using t-tests, for both the calving and summer seasons,
after testing for normality (Levene’s test) and employing a Mann-Whitney U-test if
the assumption of normality was violated (Siegel 1956; Zar 1998). The relationship
between lichen biomass and percent-cover of lichens for total biomass and biomass
by genus was evaluated using linear regression. Vegetation characteristics
(including lichen biomass), slope (o), and elevation (m) of calving sites were
compared across calving areas using ANOVA and Tukey’s test for unequal sample
sizes for all post-hoc analyses (Zar 1998). In cases of non-normality, we used the
Kruskal-Wallis ANOVA of ranks and a multiple comparisons of mean ranks for post-
hoc analyses (Siegel 1956; Siegel and Castellan 1988).
The relationships between small-scale characteristics of calving sites and calf
survival to the end of calving and during summer were evaluated using logistic
regression. Twelve ecologically plausible models were derived from small-scale
characteristics (i.e., grass/grass-likes cover (%), forb cover (%), total herbaceous
27
cover (%), density of herbaceous vegetation (plants per m2), lichen biomass (g/m2),
lichen diversity (H’), herbaceous diversity (H’), shrub intercept (%), dwarf shrub
intercept (%), cliff intercept (%), and rocks/soil intercept (%)) to predict calf survival.
All model inputs for logistic regression analyses were assessed for collinearity and
multicollinearity using tolerance scores. In both cases, if tolerance scores were
<0.20, covariates were not included in the same model (Menard 2002). The most
parsimonious models were identified using Akaike’s Information Criterion (AIC)
values corrected for small sample size (AICc), the difference in AICc ( i∆ ), Akaike
weights ( iw ), and evidence ratios (Er) (Burnham and Anderson 2002). Models were
validated using areas under the receiver operating characteristic curves (ROC)
(Boyce et al. 2002). A ROC of >0.70 was considered to have an acceptable level of
discrimination (Manel et al. 2001; Boyce et al. 2002). Robust estimations of
variance for the odds ratios ( ieβ ) were obtained using the Huber-White sandwich
estimator (Stata Corporation, College Station, TX, USA). Transects without lichen
biomass data (n = 7) were excluded from analyses.
Significance for all tests was assumed at α = 0.05. Statistica 6.1 (Statsoft,
Inc., Tulsa, OK, USA) was used for all tests; Stata 7 and 8 (Stata Corporation,
College Station, TX, USA) were used for all model development, evaluation, and
validation. The phrase ‘no difference’ is used in place of ‘means were similar’.
Large-scale characteristics of calving sites and calving areas
Components of Predation Risk
Predation risk to caribou was quantified using logistic regression to form
28
RSFs that identified habitats selected by grizzly bears and wolves in the GBPA from
14 May to 15 August in 2002 and 2003. The models incorporated bear and wolf
GPS data, vegetation class as determined from Landsat TM and ETM imagery,
distance to linear features (e.g., seismic lines, roads, and pipelines), an index of
vegetation fragmentation, and topographical features (i.e., slope, elevation, and
aspect). Risk of predation was defined as the probability of being killed during a
season (Lima and Dill 1990). We assumed that the components of predation risk
(as in Lima and Dill 1990) were directly related to the relative selection of habitats by
predators as defined by RSFs, and these components of risk could be assessed by
caribou (Kats and Dill 1998); assumptions for RSFs were as outlined in Boyce and
McDonald (1999).
Locations of GPS-collared predators were determined for 15 female grizzly
bears and 22 wolves from 5 packs that were being monitored in a concurrent study
(B. Milakovic, University of Northern British Columbia, unpublished data). Collars
had been programmed to acquire locations every 6 hrs for approx. 2 yrs. Data were
recovered via remote download or by retrieving the collar. Bear and wolf data were
divided into 2 caribou seasons: calving (15 May-14 June) and summer (14 June-15
August), as defined by field observations of calving caribou, estimates of early
calving, and changes in environmental conditions. GPS data were divided into
season and year subsets for individual bears, and pack, season, and year subsets
for wolves. All but one of duplicate wolf locations (i.e., same date and time) within a
pack were randomly selected and removed to address issues of independence. We
used 100% minimum convex polygons (MCP) to define areas of resource availability

29
for each individual bear and wolf pack by caribou season and year (Mohr 1947;
Hooge et al. 1999). After MCPs were identified, any GPS data that fell outside of the
GBPA were ‘clipped’ to the boundaries of the GBPA. Five availability points per use
point were randomly selected within each MCP for individual bears and wolf packs
using the random point generator extension (Jenness 2003) in Arcview 3.2
(Environmental Systems Research Institute, Redlands, CA, USA).
Covariates in the resource selection models for bears and wolves were 25-m
resolution raster geographic information system (GIS) data. A digital elevation
model was obtained from the 1:20,000 British Columbia Terrain and Resource
Inventory Management program (Ministry of Crown Lands 1990); this dataset was
used to create the aspect and slope layers. Vegetation classes were identified using
an August 2001 Landsat ETM image (R. Lay, University of Northern British
Columbia, unpublished data). Fifteen vegetation classes with a minimum mapping
unit of 75 x 75 m were combined into 9 classes to address concerns with accuracy
and complete separation in logistic regression models while maintaining biologically
important differences for wolves and bears (Appendix B: Table B.1, Fig. B.1). These
classes were spruce, shrubs, subalpine, Carex spp., non-vegetated, pine, riparian
spruce, alpine, and burned/disturbed. Aspect was categorized into north (316-45o),
east (46-135o), south (136-225o), and west (226-315o) directions to address
problems with northerly values having the same aspect but different values (0o and
360o). Pixels with slope ≤1o were assigned no aspect.
Because linear features can be associated with a higher risk of wolf predation
(James and Stuart-Smith 2000), we created a distance to linear features layer using
30
existing 1997-2000 databases (G. Haines, British Columbia Oil and Gas
Commission, pers. comm.). Age, level of use, and type of linear features, such as
seismic line, pipeline, and road, were not distinguished. Accuracy of linear features
was assessed using orthophotographs (2000) and Landsat ETM panchromatic
images (2001) of the GBPA; linear features were added as necessary using ArcGIS
8.3 (Environmental Systems Research Institute, Redlands, CA, USA). All linear
features were rasterized and buffered by 10 m to address locational error and
resolution limitations of topographical data. A distance surface (25-m cell size) was
generated based on the perpendicular distance (m) to the edge of linear features.
An index of vegetation fragmentation was created using Idrisi32 (Clark Labs,
Worcester, MA, USA) from 15 vegetation classes (see Appendix B: Table B.1) that
were grouped according to coarse vegetation cover type (CVCT) to represent
fragmentation as open or closed cover types (R. Lay, University of Northern British
Columbia, unpublished data). Open cover types included open-water (gravel bar
and water classes), open-rock (rocks and rock-crustose classes), and open-alpine
(dry and wet alpine classes). The closed coniferous cover type incorporated pine,
spruce, and riparian spruce classes. The snow/glacier, subalpine spruce,
burned/disturbed, Carex, shrub, and low productivity spruce classes were
considered as separate cover types. The raster layer of linear features was
incorporated into the CVCT classification as a shrub component, so contiguous
vegetation polygons were bisected by these shrub-dominated linear features. This
new linear-shrub class was used only in the fragmentation index, and not as a new
class in the vegetation classification. The index of vegetation fragmentation (Fi)
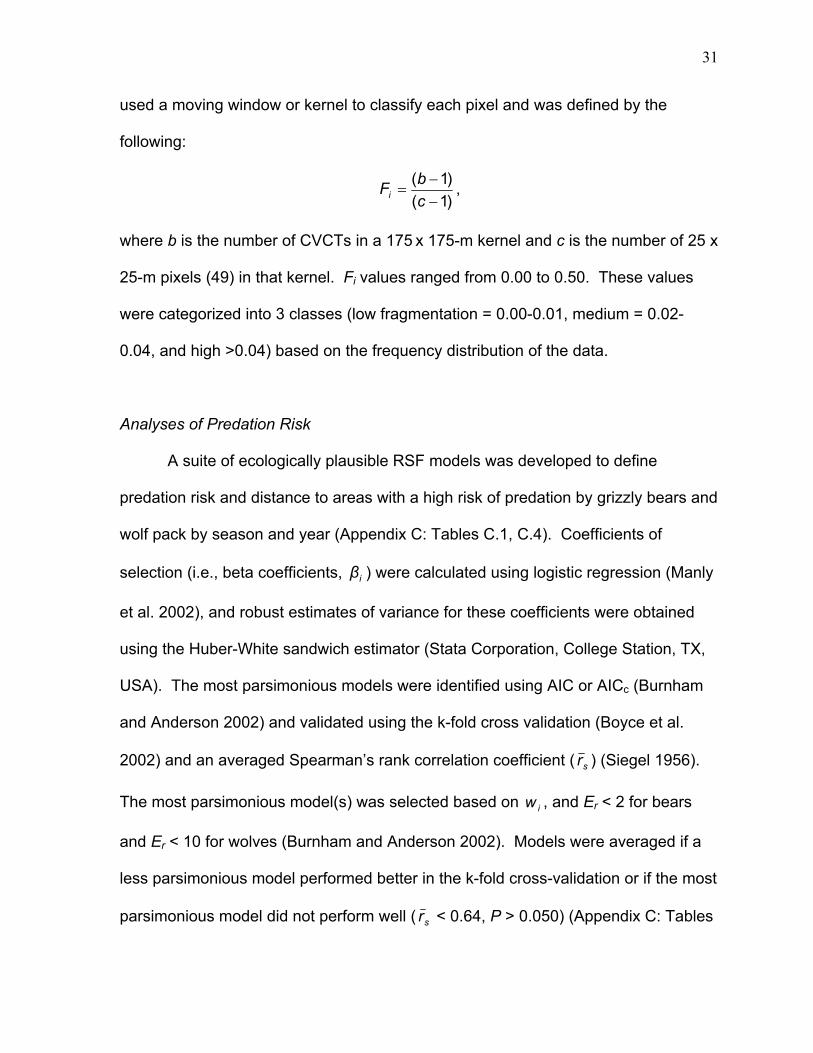
31
used a moving window or kernel to classify each pixel and was defined by the
following:
)1()1(
−−
=cbFi ,
where b is the number of CVCTs in a 175 x 175-m kernel and c is the number of 25 x
25-m pixels (49) in that kernel. Fi values ranged from 0.00 to 0.50. These values
were categorized into 3 classes (low fragmentation = 0.00-0.01, medium = 0.02-
0.04, and high >0.04) based on the frequency distribution of the data.
Analyses of Predation Risk
A suite of ecologically plausible RSF models was developed to define
predation risk and distance to areas with a high risk of predation by grizzly bears and
wolf pack by season and year (Appendix C: Tables C.1, C.4). Coefficients of
selection (i.e., beta coefficients, iβ ) were calculated using logistic regression (Manly
et al. 2002), and robust estimates of variance for these coefficients were obtained
using the Huber-White sandwich estimator (Stata Corporation, College Station, TX,
USA). The most parsimonious models were identified using AIC or AICc (Burnham
and Anderson 2002) and validated using the k-fold cross validation (Boyce et al.
2002) and an averaged Spearman’s rank correlation coefficient ( sr ) (Siegel 1956).
The most parsimonious model(s) was selected based on iw , and Er < 2 for bears
and Er < 10 for wolves (Burnham and Anderson 2002). Models were averaged if a
less parsimonious model performed better in the k-fold cross-validation or if the most
parsimonious model did not perform well ( sr < 0.64, P > 0.050) (Appendix C: Tables

32
C.2, C.7, C.8). Estimates of averaged coefficients and variance were calculated as
outlined in Burnham and Anderson (2002:150, 162).
All model inputs were assessed for collinearity and multicollinearity as in
analyses of calving site characteristics, except if tolerance scores were <0.40, then
collinear and multicollinear covariates were not included. This conservative
threshold, which was lower than Menard’s (2002) recommendation of 0.20, was set
to minimize any unknown effects of collinearity or multicollinearity because model
predictions were inputs for other models and subsequent analyses. Slope (°),
distance to linear features (km), and elevation (km) were maintained as continuous
variables. Elevation and distance to linear features (km) were entered as quadratic
terms unless selection for covariates was clearly linear (i.e., coefficients of both
terms of the quadratic were the same sign). Vegetation and aspect categories that
were rare or did not occur (i.e., near-perfect or perfect separation) in use and/or
available data were not included in analyses. Deviation contrasts were used to code
all categorical variables (i.e., vegetation, aspect, and fragmentation) (Menard 2002).
Bear data were pooled by season and year because there was little or no
social exclusion of individual bears and a high degree of overlap occurred among
MCPs (B. Milakovic, University of Northern British Columbia, unpublished data).
Consequently, 4 RSFs defined the risk of predation to caribou from grizzly bears
(Appendix C: Tables C.2, C.3). In contrast to bears, RSFs were developed for each
wolf pack in the GBPA because wolf packs specifically prey on different prey items
at different times of the year, and selection of habitat features likely varies (B.
Milakovic, University of Northern British Columbia, unpublished data). Twenty-two

33
RSFs were formed to define risk by wolf pack, season, and year (Appendix C:
Tables C.7-C.13). Because MCPs of wolf packs did not provide full coverage of the
GBPA in any season or year, and because there was at least one other known
uncollared pack in the GBPA, we used pooled RSFs to predict wolf occurrence for
those areas without data (Appendix C: Tables C.5, C.6). Selection, validation, and
averaging of wolf models was identical to that of the bear models, except that the Er
criteria for averaging pack models was increased from <2 to <10 because model
performance for some packs and seasons was lower than bear models, and in some
cases, no pack models performed well for a season or year (Appendix C: Tables
C.7, C.8). In these cases, models were averaged (Burnham and Anderson 2002).
Risk landscapes for caribou from bears and wolves by season and year were
developed from the iβ in the logistic regression models using a raster GIS (PCI
Imageworks 9.1, Richmond Hill, ON, Canada) and the following log-linear model
(Boyce and McDonald 1999; Manly et al. 2002):
)ii2211 xβxβxexp(βw(x) K++=
where i21 x,x,x K are the raster data layers (e.g., elevation, slope, vegetation); this
model estimated the relative probability of use by a predator for each 25 x 25-m pixel
in the GBPA. We used the SCALE command in XPACE (PCI 9.1, Richmond Hill,
ON, Canada) to scale the data from 0-1. Bear RSFs by season and year were
applied to the GBPA, whereas wolf RSFs were applied to each pack’s MCP for that
season and year. The pack and pooled wolf RSF values were combined into one
risk landscape for each season and year. In areas where pack boundaries
overlapped within a season and year, the lower RSF value was assigned to that

34
pixel, due to likely decreased vigilance by pack members in those areas and,
subsequently, a lower risk of predation (Mech 1977; Rogers et al. 1980; Mech 1994).
For all risk layers, a mask for snow/glaciers (i.e., areas >2,400 m in rugged
mountains to the west) and water (i.e., large bodies of water in the west and west-
central portion of the GBPA) was created where the likelihood of encountering
predators was rare, and those areas were given RSF values of zero. Risk surfaces
were smoothed using a 75 x 75-m median filter. Risk values were binned into
quartiles to create distance surfaces to high risk predator habitats (i.e., the
perpendicular distance (km) to the third quartile RSF value for each season and year
layer) using Idrisi32 (Clark Labs, Worcester, MA, USA). GIS layers for change in
wolf risk and change in bear risk were created for each season and year. Change in
risk was equal to the summer risk layer subtracted from the calving risk layer for that
species, season, and year.
Indices of Forage Biomass and Quality
NDVI data from partial Landsat TM and ETM images acquired on 4 June
(TM), 22 July (TM), and 15 August 2001 (ETM) were used to model NDVI and the
changes in NDVI for the GBPA. Our assumptions were that 1) NDVI was correlated
with above-ground net primary productivity and leaf area index (i.e., biomass)
(Tucker and Sellers 1986; Ruimy et al. 1994), 2) change in NDVI was an index of the
amount of plant growth that occurred within a pixel (Griffith et al. 2002; Oindo 2002),
and 3) the timing of change important to caribou was likely to occur between 4 June
and 22 July (the dates of TM image data) in 2002 and 2003 (R. Lay and D. Gustine,
35
University of Northern British Columbia, unpublished data).
All images were geocorrected (root mean squared error < 0.50), and raw
imagery was converted to spectral radiance to address differences in sensor
calibration (Chander and Markum 2003; R. Lay and D. Gustine, University of
Northern British Columbia, unpublished data). NDVI was modelled for each image
(n = 2062, the number of pixels equal to 0.01% of the smallest Landsat data set)
using multiple regression with slope (o), categorized aspect, vegetation, elevation
(km), and/or incidence (i.e., the angle the sun strikes the surface of the ground at the
time the image was recorded) as independant variables in a suite of models
(Appendix D: Table D.1). All model inputs for multiple regression analyses were
assessed for collinearity and multicollinearity, and categorical variables were coded
as in analyses of calving site characteristics.
Models were selected using the highest adjusted R2 values and validated with
a resampling procedure and pixel-to-pixel rectification with the original NDVI data
(Appendix D: Table D.2). Models that were within 0.05 of the best model’s adjusted
R2 value were included in validation procedures. A new random sample without
replacement (n = 2062) was drawn from each set of image data for validation.
Predicted NDVI values from the original models were regressed on actual NDVI
values from this new data set. Final models were those with the highest average
adjusted R2 values; if 2 models explained the same variation within 0.1%, the more
efficient model (i.e., model with fewest parameters) was selected.
NDVI models were used to create large-scale data layers in a raster GIS (PCI
Imageworks 9.1, Richmond Hill, ON, Canada) that estimated indices of biomass and

36
relative forage quality across the GBPA. These layers were created using
techniques identical to the risk models, except that we used the coefficients of the
multiple regression models (Appendix D: Table D.3) as weighting factors and added
those to the intercept to estimate NDVI per pixel as an index of biomass in the
GBPA for that image date. Actual NDVI values were regressed against modelled
NDVI for cloud-free areas on a pixel-to-pixel basis for a final validation of modelled
data (R. Lay and D. Gustine, University of Northern British Columbia, unpublished
data) (Appendix D: Table D.1, D.2). Change in modelled NDVI values as an index of
quality was calculated by subtracting the 4 June image from the 22 July image.
Change was not calculated for non-vegetated cover types that had negative NDVI
values throughout the summer (Oindo 2002). The change in NDVI (quality)
modelled data were scaled (0-1) as for the risk models; NDVI modelled data
(biomass) were left as modelled NDVI values.
Continuous and binned data were used in analyses. Biomass and quality
surfaces were smoothed and categorized and distance surfaces to high-biomass
and high-quality areas were generated as for the risk surfaces.
Analyses of Large-Scale Characteristics of Calving Sites and Calving Areas
We sampled the modelled risk, quality, and biomass data for 3 scales of
analyses pooled across years to compare 1) characteristics among calving
strategies (i.e., the 3 calving areas) and the landscape (i.e., the GBPA), 2)
characteristics of calving sites in a calving strategy versus characteristics of random
points in that calving strategy, and 3) characteristics of calving sites versus random

37
points on the landscape. The number of random points within each calving strategy
was set at 10 times the number of calves captured within an area (nFoothills = 200,
nWestern High Country = 180, and nNorth Prophet = 100) and was directly proportional to size of
the calving areas. The sample size for random points on the landscape was equal
to the total number of data points across calving areas (n = 480). Random points
were distributed using the random point generator extension (Jenness 2003) in
Arcview 3.2 (Environmental Systems Research Institute, Redlands, CA, USA). A
raster GIS (PCI 9.1 XPACE, Richmond Hill, ON, Canada) was used to query
modelled risk (by season and year) and forage (by season) data for all random
points and calving sites.
Logistic regression and an ecologically plausible set of models for calving and
summer seasons were used to determine the importance of risk, forage
characteristics, and movement towards the survival of calves in 2002 and 2003.
Bear risk, distance to areas of high bear risk (km), wolf risk, distance to areas of high
wolf risk (km), biomass, quality, and calving area were covariates. Movement was
added a posteriori to models in the summer to evaluate the importance of movement
towards calf survival. Movement was not used to predict calf survival during the
calving season because movement events were rare in calves that died. We then
developed a model set with forage and risk characteristics and calving area as
covariates to predict movement events through the summer season and added 4
new covariates: change in wolf risk and change in bear risk between seasons, and
distance to high biomass and distance to high quality forage. Model covariates were
assessed for collinearity and multicollinearity; models were selected, validated, and

38
estimates of variance were calculated as in small-scale analyses of calving site
characteristics.
Nonparametric tests were used for all analyses of risk and forage attributes
among calving areas, the landscape, and calving sites because preliminary analyses
suggested violation of the homogeneity of variances assumption (Siegel 1956). The
Mann-Whitney U-test (Siegel 1956) was used to examine risk attributes between
years by calving area and the landscape, risk and forage characteristics (pooled
across years) at calving sites versus characteristics of that calving area, risk and
forage characteristics of all calving sites versus random points on the landscape,
and the independant effects of risk and forage characteristics towards survival and
movement. To evaluate the differences in forage and risk attributes, slope (°), and
elevation (m) among calving areas and the landscape, we used Kruskal-Wallis
ANOVA by ranks with multiple comparisons of mean ranks for post-hoc analyses
(Siegel and Castellan 1988). Changes in risk and forage characteristics (pooled
across years) within calving areas and the landscape between seasons were
evaluated with the Wilcoxon matched pairs test (Siegel 1956).
The trade-off, or cost, of foraging in areas of higher relative quality or biomass
was determined by evaluating the relationship between risk and forage
characteristics with linear regression (Bowyer et al. 1998; Bowyer et al. 1999). Cost
by season was defined as the change in predator-specific risk (y) as biomass or
quality (x) increased (i.e., slope of the regression). We assumed that animals
experience a cost to foraging if there is a positive relationship between risk and
forage characteristics (i.e., slopes > 0), whereas no cost in risk is incurred if there is

39
no relationship or a negative one (i.e., slopes ≤ 0) (Bowyer et al. 1998; Bowyer et al.
1999). We used a t-test with a Bonferroni adjustment to compare confidence
intervals of slopes ≠ 0 among calving areas and the landscape within and between
seasons by predator (Sokal and Rohlf 1995).
RESULTS
Reproductive characteristics
Blood samples were obtained from 47 of the 48 adult female caribou collared
during the winters of 2001/2002 and 2002/2003. Forty-three of those animals (91.5
± 4.1%, x ± binomial SE) were pregnant, with similar estimates between years
(Table 2.1). We were not able to determine reproductive rates for all these animals
because the GPS data loggers for 44 of the collars (22 per yr) failed prior to calving.
By observing animals for which the very high frequency (VHF) signals on GPS
collars continued to function to calving, we determined that 15 of 22 pregnant adult
females (68.2 ± 10.2%, x ± binomial SE) had their calves in the summers of 2002
and 2003. Parturition rates were varied with small sample sizes and high estimates
of standard error for both years (Table 2.1). Calving dates ranged from 25 May to
10 June, including observations of many non-collared caribou, with peak calving
occurring on 28 May ± 0.3 d ( x ± SE).
Twenty-one, 19, and 10 calves were captured in the Foothills, Western High
Country, and North Prophet calving areas, respectively (Appendix E: Table E.1).
Only 10 calves were with collared adult females (5 per yr). More captures were by

40
Table 2.1. Reproductive parameters of female woodland caribou and age, weight, sex, and peak calving data from captured calves in the Greater Besa Prophet area, northern British Columbia, 2002-2003.
Parameter Year x ± SE Range n
Pregnancy (%) 2002 91.7 ± 5.8 24
2003 91.3 ± 6.0 23
Parturition (%) 2002 55.6 ± 17.6 9
2003 76.9 ± 12.2 13
Calving date 2002 30 May ± 0.4 d 27 May-3 June 25
2003 26 May ± 0.2 d 25 May-10 June 25
Sex ratio (F : M) 2002 16 : 9 25
2003 15 : 10 25
Weight of calves at capture (kg) 2002 9.5 ± 0.4 6.8-13.5 25
2003 9.7 ± 0.5 6.0-19. 0 25
Estimated birth weight (kg)† 2002 7.7 ± 0.2 5.6-10.1 25
2003 8.1 ± 0.7 5.1-16.1 25
Age of calves at capture (days) 2002 3.1 ± 0.3 0.5-6.0 25
2003 2.8 ± 0.2 1.0-6.0 25 † Using the equation y = a-0.571x, where y = estimate of birth weight (kg), a = weight of calf at capture (kg), and x = age in days at capture (from Parker 1989).

41
net-gun (2002, n = 11; 2003, n = 22) than by hand (2002, n = 14; 2003, n = 3). A
total of 31 females and 19 males were captured, with no difference in sex ratios
across or between years (all P > 0.090). Calf weights at capture were similar
between years, with an average weight of 9.6 ± 0.3 kg ( x ± SE). There was no
difference in the estimates of birth weights for males and females (P = 0.604), or
among calves captured in the 3 different calving areas (F(2, 49) = 2.18, P = 0.125).
Age of captured calves ranged from 0.5-6.0 d, with the average age at capture being
3.0 ± 0.2 d. Average handling time per calf was ≤2 min, not including pursuit time (in
the helicopter or on foot).
Cause-specific mortality and survival
Caribou calves were monitored during the 28 d post-capture once every 16 ±
2.3 hrs ( x ± SE) and 18 ± 2.2 hrs in 2002 and 2003, respectively. Pooled data by
year on animal movements away from calving sites peaked from 15-21 d of age,
although movements continued to occur through 22-28 d of age in 2003 (Fig. 2.3a).
No calves moved away from calving sites when they were <8 d of age. Peaks in
mortality rate were observed at 8-14 and 29-35 d of age (Fig. 2.3a).
Thirteen female and 6 male calves died in the first 2 months of life during the
2 yrs of the study (Fig. 2.3b). There was no difference in the observed versus
expected number of mortalities for males and females (P = 0.629). One calf died at
6 d of age probably from abandonment due to handling in 2002 and another calf
died at 4 d of age from accidental drowning in 2003. The remainder of mortalities (n
= 17) were predator-caused (Fig. 2.3b). There was one eagle- and one bear-caused

42
2002 Movements
Bear W olf W olverine Eagle Unknown Predator
Age of the Calf (days)
1-7 8-14 15-21 22-28 29-35 36-42 43-49 50-56 >56
Num
ber o
f Mor
talit
ies
0
1
2
3
4
5
6
7
Num
ber o
f Mov
emen
ts
0
2
4
6
8
10
12
14
16
Mor
talit
y R
ate
0.00
0.02
0.04
0.06
0.08
0.10
0.12
0.14
0.16
2003 Movements2002-2003 Mortality Rate
Figure 2.3. Timing of calf movements (>1 km) by age in days away from caribou
calving sites compared with mortality (i.e., number of animals that died by the end of weekx divided by the number of animals alive at the beginning of weekx) during the first two months of life (a) and timing of predation-caused mortalities of collared caribou calves (b) in the Greater Besa Prophet area, northern British Columbia, 2002 and 2003.
b
a

43
mortality each year. In 2002, there were 3 mortalities from wolves and 4 mortalities
from wolverines; in 2003, there were mortalities from one wolverine and 2 wolves.
We were unable to conclusively identify predators in 3 cases (2002, n = 2; 2003, n =
1). We also recorded mortalities of uncollared caribou calves by a wolverine and
eagle at approx. 1 and 2 weeks of age, respectively. Four of the 5 wolverine-caused
mortalities of collared calves occurred between 9-15 d of age, whereas all wolf-
caused mortalities occurred after calves were 18 d of age (Fig. 2.3b). There were no
mortalities <14 d of age in the Foothills and no mortalities by wolves in the North
Prophet. There were no differences in observed versus expected frequencies of
causes of mortality using all data pooled over 2 yrs or among calving areas (all P >
0.340).
Survival through 56 d of life appeared lower, although not significantly, in
2002 than 2003 (0.54 ± 0.11 versus 0.79 ± 0.08, P = 0.066) (Fig. 2.4a). Survival
was higher through the calving season (0.88 ± 0.05) than through the summer
season (0.69 ± 0.07) (P = 0.032). Pooled survival also was not different through 56
d of age among the Foothills (0.65 ± 0.11), Western High Country (0.61 ± 0.12), and
North Prophet (0.80 ± 0.13) calving areas (all P > 0.560) (Fig. 2.4b).
Small-scale characteristics of calving sites and calf survival
There were no differences in vegetation characteristics of calving sites among
calving areas, except for percent intercept of shrubs (Kruskal-Wallis ANOVA, H(2, 48)
= 8.12) (Table 2.2). Although, not always significant, shrub cover tended to be
higher at calving sites in the Foothills than the North Prophet (P = 0.050) and the

44
1 2 3 4 5 6 7 8 9 10 11 12 13 14 15 16 17 18 19 20 21 22 23 24 25 26 27 2829
-3536
-4243
-4950
-56
0.0
0.4
0.5
0.6
0.7
0.8
0.9
1.0
20022003
t (age in days)
1 2 3 4 5 6 7 8 9 10 11 12 13 14 15 16 17 18 19 20 21 22 23 24 25 26 27 2829
-3536-
4243-
4950-
56
Sur
viva
l (t)
0.0
0.4
0.5
0.6
0.7
0.8
0.9
1.0
FTHILLSW HCNP
Figure 2.4. Kaplan-Meier estimates of survival rate by time (t) for woodland caribou
neonates in a) 2002 and 2003 and b) by calving area (Foothills (FTHILLS), Western High Country (WHC), and North Prophet (NP)) using pooled data for both years, in the Greater Besa Prophet area, northern British Columbia.
a
b

45
Table 2.2. Small-scale characteristics of calving sites ( x ± SE) among the Foothills (FTHILLS), Western High Country (WHC), and North Prophet (NP) calving areas in the Greater Besa Prophet area, northern British Columbia, 2002-2003. Characteristics sharing the same letter were not significantly different, as determined by nonparametric (†) and parametric analyses (‡).
Small-Scale Characteristic FTHILLS WHC NP P (n = 21) (n = 19) (n = 10) Shrub Intercept (%) 29.6 ± 6.0a 15.1 ± 5.5ab 4.6 ± 1.8b 0.017† Rock/Soil Intercept (%) 5.8 ± 2.7a 18.6 ± 6.0a 51 ± 10.0b 0.001† Slope (o) 27.8 ± 1.6a 16.6 ± 1.9b 22.6 ± 2.7ab <0.001‡ Elevation (m) 1767 ± 30a 1783 ± 38a 2033 ± 31b <0.001‡ Cliff Intercept (%) 2 ± 0.4a 3.8 ± 2.6a n/a 0.473† Dwarf Shrub Intercept (%) 22.5 ± 5.2a 36.4 ± 6.3a 19.4 ± 7.4 a 0.132‡ Tree Intercept (%) 4.3 ± 1.7a 4.2 ± 3.6a n/a 0.536‡ Herbaceous Cover (%) 21.2 ± 2.4a 17.6 ± 2.6a 11.9 ± 3.5a 0.097‡ Herbaceous Diversity (H') 1.63 ± 0.1a 1.29 ± 0.1a 1.21 ± 0.2a 0.070‡ Herbaceous Density (per m2) 111.3 ± 23.3a 135.5 ± 27.9a 112.6 ± 34.3a 0.773‡ Grass (%) 8.1 ± 2.0a 4.1 ± 1.3a 2.8 ± 1.1a 0.082‡ Grass-likes (%) 3.2 ± 1.04a 6.4 ± 1.71a 2.3 ± 0.9a 0.210† Forbs (%) 9.9 ± 1.7a 7.1 ± 1.3a 6.8 ± 1.7a 0.300‡ Lichen Biomass (g/m2) 44.4 ± 8.9a 28.5 ± 7.5a 31.2 ± 10.7a 0.372‡ Lichen Diversity (H’) 1.28 ± 0.10a 1.09 ± 0.17a 1.29 ± 0.23a 0.582‡ † Kruskal-Wallis Analysis of variance and multiple comparison of mean ranks ‡ Analysis of variance and Tukey’s honest significant difference for unequal sample sizes

46
Western High Country (P = 0.058). Cover of rocks/soil (H(2, 48) = 19.25), slope
(ANOVA, F(2, 47) = 8.90), and elevation (F(2, 47) = 13.80) also differed among calving
areas (Table 2.2). Rocks/soil cover was lower at calving sites in the Foothills (P <
0.001) and the Western High Country (P = 0.041) than the North Prophet. Calving
sites in the Western High Country were not as steep as the Foothills sites (P <
0.001). The North Prophet calving sites were higher than the Foothills (P < 0.001)
and Western High Country (P < 0.001) sites.
Variation was high within small-scale characteristics at calving sites
(Appendix F: F.1); consequently, there were no vegetative differences at sites
between calves that lived and died during the calving season or in summer within or
between years. Percent cover of lichens was a poor predictor of total lichen
biomass (n = 169, r2 = 0.25, P < 0.001), and within each lichen genus except for
Cladina spp. (n = 48, r2 = 0.72, P < 0.001) (Appendix G: Fig. G.1).
Herbaceous cover (%) and shrub intercept (%) at calving sites best predicted
survival of caribou calves during calving (Table 2.3). Each 1% increase in
herbaceous cover ( ie β ± SE, 0.81 ± 0.07, P = 0.011), as determined from plots along
the transect, decreased the odds of survival by approx. 19%, whereas a 1%
increase in shrub cover from line-intercept data increased the odds of survival by
approx. 13% ( ie β ± SE, 1.13 ± 0.07, P = 0.045) when the other variable was held
constant in both cases. Discrimination of this model was excellent (ROC = 0.946).
Models with cliff line-intercept data (%) could not be evaluated during the calving
season because no calves died at those calving sites. A model using rocks/soil
intercept (%) was the most parsimonious during summer, but discrimination was
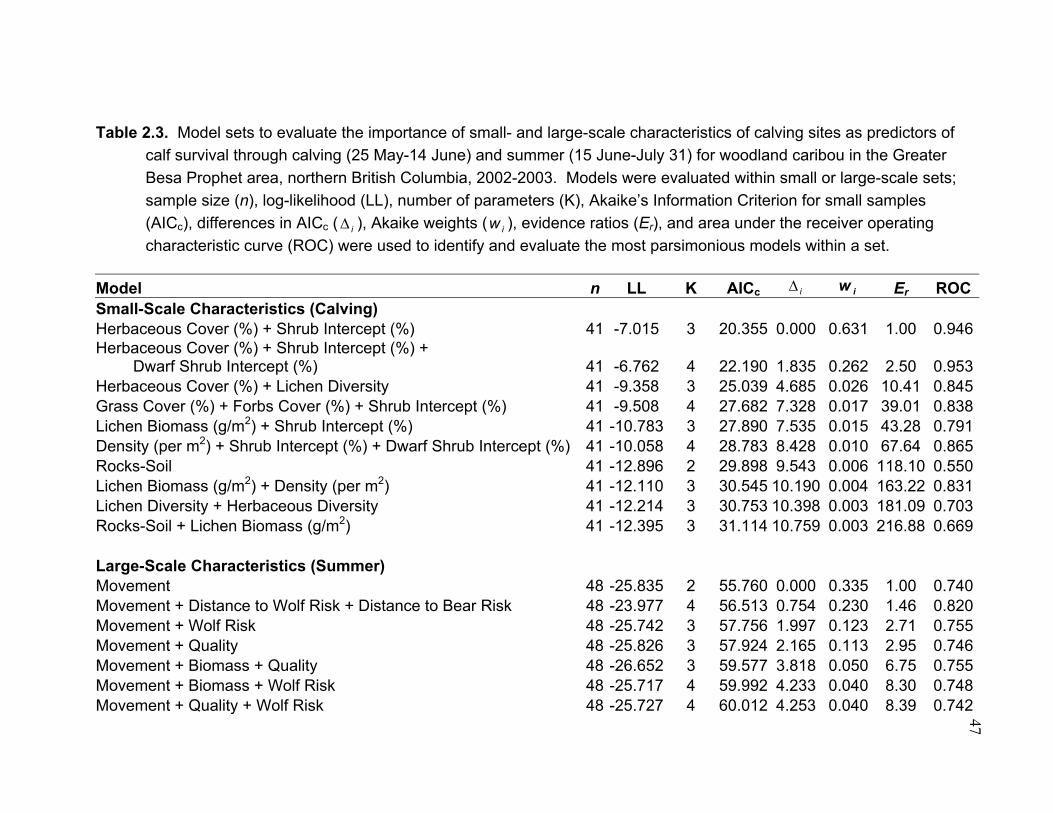
47
Table 2.3. Model sets to evaluate the importance of small- and large-scale characteristics of calving sites as predictors of calf survival through calving (25 May-14 June) and summer (15 June-July 31) for woodland caribou in the Greater Besa Prophet area, northern British Columbia, 2002-2003. Models were evaluated within small or large-scale sets; sample size (n), log-likelihood (LL), number of parameters (K), Akaike’s Information Criterion for small samples (AICc), differences in AICc ( i∆ ), Akaike weights ( iw ), evidence ratios (Er), and area under the receiver operating characteristic curve (ROC) were used to identify and evaluate the most parsimonious models within a set.
Model n LL K AICc i∆ iw Er ROCSmall-Scale Characteristics (Calving) Herbaceous Cover (%) + Shrub Intercept (%) 41 -7.015 3 20.355 0.000 0.631 1.00 0.946Herbaceous Cover (%) + Shrub Intercept (%) +
Dwarf Shrub Intercept (%) 41 -6.762 4 22.190 1.835 0.262 2.50 0.953Herbaceous Cover (%) + Lichen Diversity 41 -9.358 3 25.039 4.685 0.026 10.41 0.845Grass Cover (%) + Forbs Cover (%) + Shrub Intercept (%) 41 -9.508 4 27.682 7.328 0.017 39.01 0.838Lichen Biomass (g/m2) + Shrub Intercept (%) 41 -10.783 3 27.890 7.535 0.015 43.28 0.791Density (per m2) + Shrub Intercept (%) + Dwarf Shrub Intercept (%) 41 -10.058 4 28.783 8.428 0.010 67.64 0.865Rocks-Soil 41 -12.896 2 29.898 9.543 0.006 118.10 0.550Lichen Biomass (g/m2) + Density (per m2) 41 -12.110 3 30.545 10.190 0.004 163.22 0.831Lichen Diversity + Herbaceous Diversity 41 -12.214 3 30.753 10.398 0.003 181.09 0.703Rocks-Soil + Lichen Biomass (g/m2) 41 -12.395 3 31.114 10.759 0.003 216.88 0.669 Large-Scale Characteristics (Summer) Movement 48 -25.835 2 55.760 0.000 0.335 1.00 0.740Movement + Distance to Wolf Risk + Distance to Bear Risk 48 -23.977 4 56.513 0.754 0.230 1.46 0.820Movement + Wolf Risk 48 -25.742 3 57.756 1.997 0.123 2.71 0.755Movement + Quality 48 -25.826 3 57.924 2.165 0.113 2.95 0.746Movement + Biomass + Quality 48 -26.652 3 59.577 3.818 0.050 6.75 0.755Movement + Biomass + Wolf Risk 48 -25.717 4 59.992 4.233 0.040 8.30 0.748Movement + Quality + Wolf Risk 48 -25.727 4 60.012 4.253 0.040 8.39 0.742
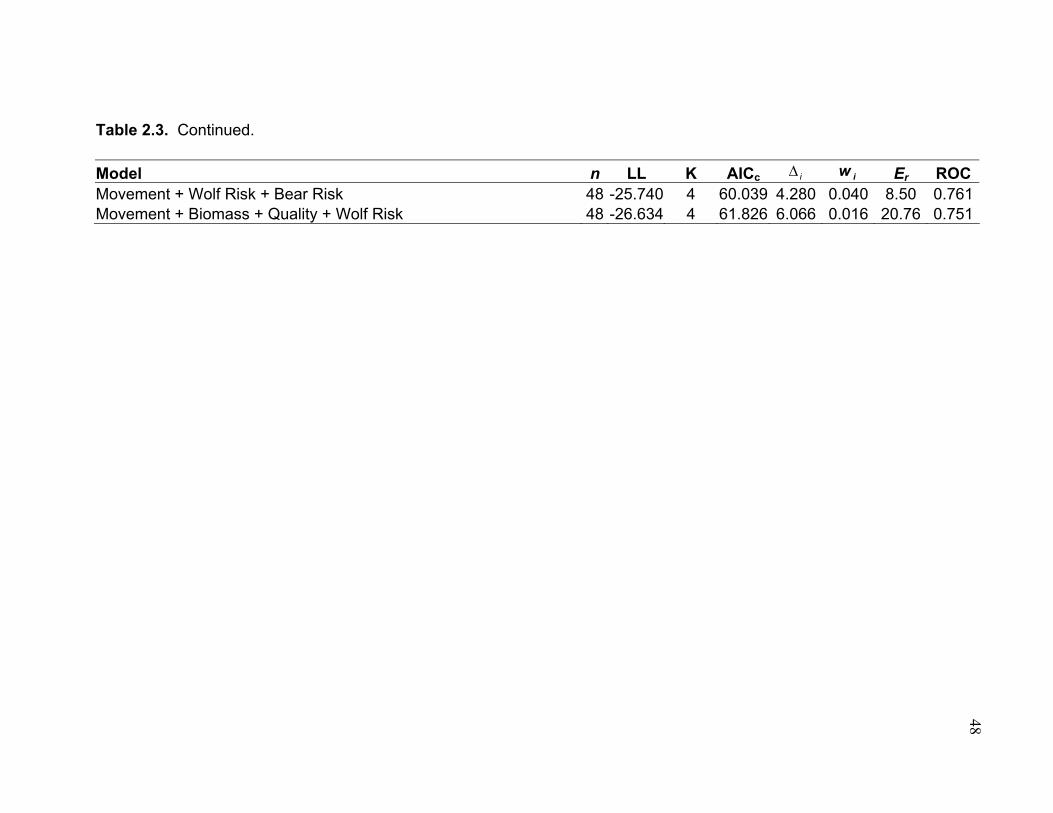
48
Table 2.3. Continued. Model n LL K AICc i∆ iw Er ROCMovement + Wolf Risk + Bear Risk 48 -25.740 4 60.039 4.280 0.040 8.50 0.761Movement + Biomass + Quality + Wolf Risk 48 -26.634 4 61.826 6.066 0.016 20.76 0.751

49
poor (ROC = 0.685).
Large-scale characteristics of calving sites and calving areas and calf survival
Detailed results on the performance of models defining predation risk by
season, year, and predator, and relative forage quality and biomass by season are
presented in Appendix C (risk) and Appendix D (forage). Some predation-risk
characteristics of calving areas varied between years. The risk of bear predation
and the distance to areas of high bear risk did not change from 2002 to 2003 in any
calving area or on the landscape during calving or in summer (all P > 0.115). Nor
did the risk of wolf predation and distance to areas of high wolf risk differ (all P >
0.205), except in the Foothills. Risk of wolf predation was higher in 2002 than 2003
in the Foothills only during the calving season (P = 0.049). Consequently, because
risk appeared to change little across years within calving areas and the landscape,
all risk data were pooled across years to facilitate evaluating trends in risk at all
scales of analyses.
Risk, forage, and topographical characteristics varied among calving areas in
both the calving and summer seasons (all H(3, 958) > 27.91, all P < 0.001) (Table 2.4).
The Foothills area was higher in bear risk and closer to areas of high bear risk than
the landscape and the other calving areas (all P < 0.001). The North Prophet was
lower in bear risk than the landscape and farthest from areas of high bear risk during
calving (all P < 0.001). Trends in bear risk during summer were similar to calving
except the North Prophet did not differ from the Western High Country in the
distance to bear risk (P = 1.000) (Table 2.4). Between seasons, risk of bear
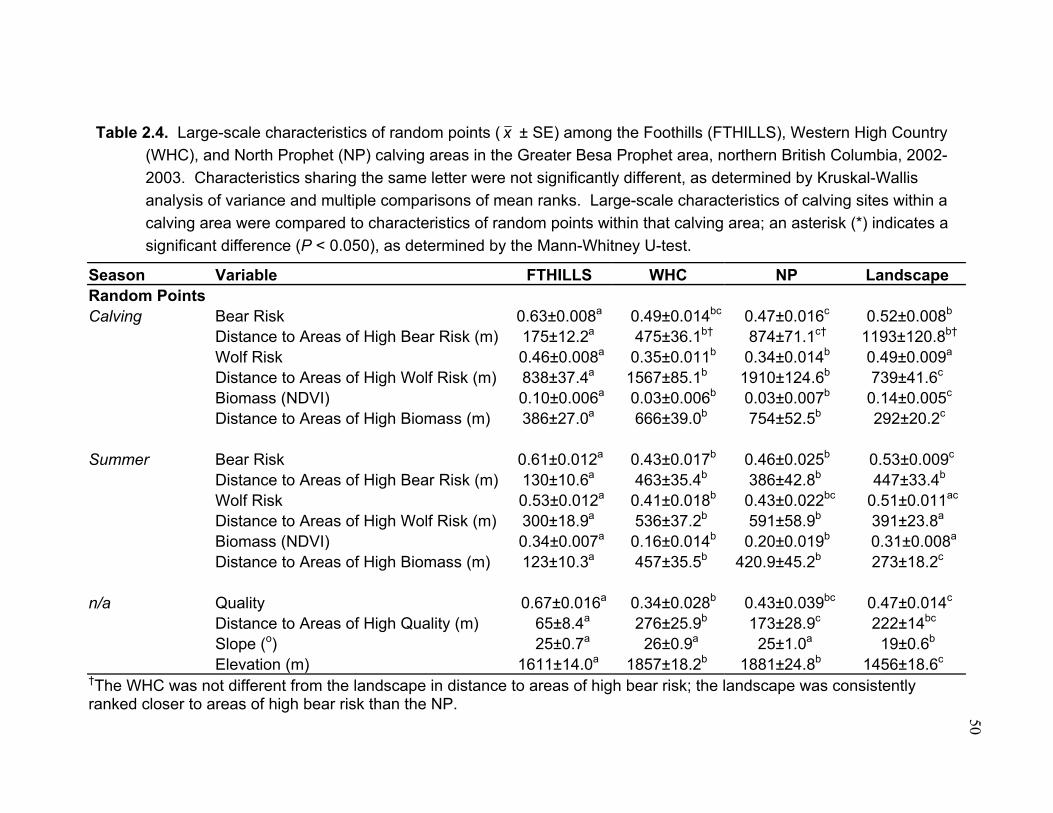
50
Table 2.4. Large-scale characteristics of random points ( x ± SE) among the Foothills (FTHILLS), Western High Country (WHC), and North Prophet (NP) calving areas in the Greater Besa Prophet area, northern British Columbia, 2002-2003. Characteristics sharing the same letter were not significantly different, as determined by Kruskal-Wallis analysis of variance and multiple comparisons of mean ranks. Large-scale characteristics of calving sites within a calving area were compared to characteristics of random points within that calving area; an asterisk (*) indicates a significant difference (P < 0.050), as determined by the Mann-Whitney U-test.
Season Variable FTHILLS WHC NP Landscape Random Points Calving Bear Risk 0.63±0.008a 0.49±0.014bc 0.47±0.016c 0.52±0.008b Distance to Areas of High Bear Risk (m) 175±12.2a 475±36.1b† 874±71.1c† 1193±120.8b† Wolf Risk 0.46±0.008a 0.35±0.011b 0.34±0.014b 0.49±0.009a Distance to Areas of High Wolf Risk (m) 838±37.4a 1567±85.1b 1910±124.6b 739±41.6c Biomass (NDVI) 0.10±0.006a 0.03±0.006b 0.03±0.007b 0.14±0.005c Distance to Areas of High Biomass (m) 386±27.0a 666±39.0b 754±52.5b 292±20.2c Summer Bear Risk 0.61±0.012a 0.43±0.017b 0.46±0.025b 0.53±0.009c Distance to Areas of High Bear Risk (m) 130±10.6a 463±35.4b 386±42.8b 447±33.4b Wolf Risk 0.53±0.012a 0.41±0.018b 0.43±0.022bc 0.51±0.011ac
Distance to Areas of High Wolf Risk (m) 300±18.9a 536±37.2b 591±58.9b 391±23.8a Biomass (NDVI) 0.34±0.007a 0.16±0.014b 0.20±0.019b 0.31±0.008a Distance to Areas of High Biomass (m) 123±10.3a 457±35.5b 420.9±45.2b 273±18.2c n/a Quality 0.67±0.016a 0.34±0.028b 0.43±0.039bc 0.47±0.014c Distance to Areas of High Quality (m) 65±8.4a 276±25.9b 173±28.9c 222±14bc Slope (o) 25±0.7a 26±0.9a 25±1.0a 19±0.6b Elevation (m) 1611±14.0a 1857±18.2b 1881±24.8b 1456±18.6c †The WHC was not different from the landscape in distance to areas of high bear risk; the landscape was consistently ranked closer to areas of high bear risk than the NP.
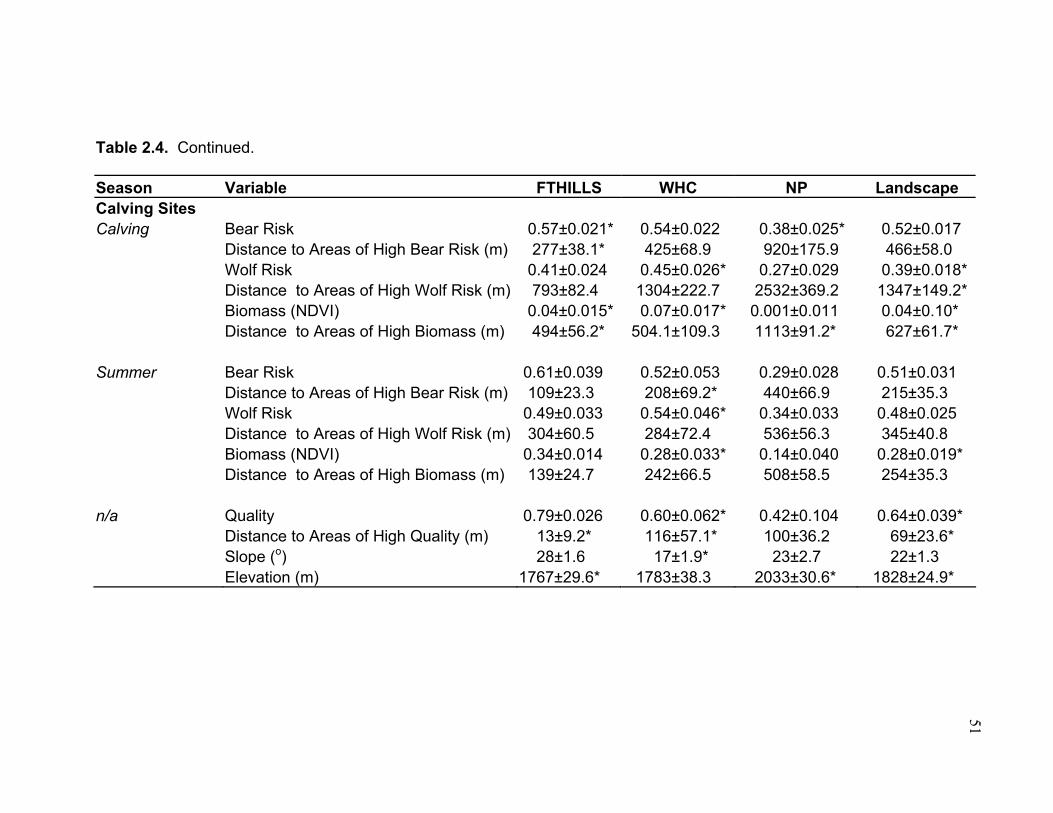
51
Table 2.4. Continued. Season Variable FTHILLS WHC NP Landscape Calving Sites Calving Bear Risk 0.57±0.021* 0.54±0.022 0.38±0.025* 0.52±0.017 Distance to Areas of High Bear Risk (m) 277±38.1* 425±68.9 920±175.9 466±58.0 Wolf Risk 0.41±0.024 0.45±0.026* 0.27±0.029 0.39±0.018* Distance to Areas of High Wolf Risk (m) 793±82.4 1304±222.7 2532±369.2 1347±149.2* Biomass (NDVI) 0.04±0.015* 0.07±0.017* 0.001±0.011 0.04±0.10* Distance to Areas of High Biomass (m) 494±56.2* 504.1±109.3 1113±91.2* 627±61.7* Summer Bear Risk 0.61±0.039 0.52±0.053 0.29±0.028 0.51±0.031 Distance to Areas of High Bear Risk (m) 109±23.3 208±69.2* 440±66.9 215±35.3 Wolf Risk 0.49±0.033 0.54±0.046* 0.34±0.033 0.48±0.025 Distance to Areas of High Wolf Risk (m) 304±60.5 284±72.4 536±56.3 345±40.8 Biomass (NDVI) 0.34±0.014 0.28±0.033* 0.14±0.040 0.28±0.019* Distance to Areas of High Biomass (m) 139±24.7 242±66.5 508±58.5 254±35.3 n/a Quality 0.79±0.026 0.60±0.062* 0.42±0.104 0.64±0.039* Distance to Areas of High Quality (m) 13±9.2* 116±57.1* 100±36.2 69±23.6* Slope (o) 28±1.6 17±1.9* 23±2.7 22±1.3 Elevation (m) 1767±29.6* 1783±38.3 2033±30.6* 1828±24.9*
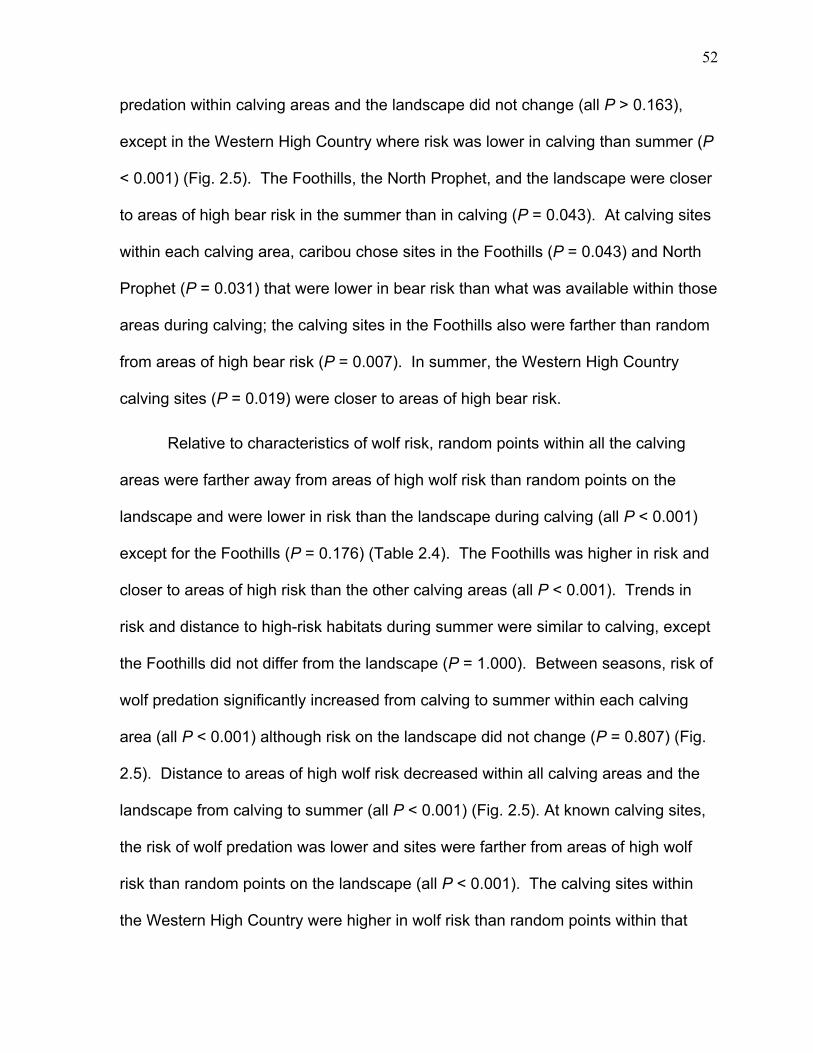
52
predation within calving areas and the landscape did not change (all P > 0.163),
except in the Western High Country where risk was lower in calving than summer (P
< 0.001) (Fig. 2.5). The Foothills, the North Prophet, and the landscape were closer
to areas of high bear risk in the summer than in calving (P = 0.043). At calving sites
within each calving area, caribou chose sites in the Foothills (P = 0.043) and North
Prophet (P = 0.031) that were lower in bear risk than what was available within those
areas during calving; the calving sites in the Foothills also were farther than random
from areas of high bear risk (P = 0.007). In summer, the Western High Country
calving sites (P = 0.019) were closer to areas of high bear risk.
Relative to characteristics of wolf risk, random points within all the calving
areas were farther away from areas of high wolf risk than random points on the
landscape and were lower in risk than the landscape during calving (all P < 0.001)
except for the Foothills (P = 0.176) (Table 2.4). The Foothills was higher in risk and
closer to areas of high risk than the other calving areas (all P < 0.001). Trends in
risk and distance to high-risk habitats during summer were similar to calving, except
the Foothills did not differ from the landscape (P = 1.000). Between seasons, risk of
wolf predation significantly increased from calving to summer within each calving
area (all P < 0.001) although risk on the landscape did not change (P = 0.807) (Fig.
2.5). Distance to areas of high wolf risk decreased within all calving areas and the
landscape from calving to summer (all P < 0.001) (Fig. 2.5). At known calving sites,
the risk of wolf predation was lower and sites were farther from areas of high wolf
risk than random points on the landscape (all P < 0.001). The calving sites within
the Western High Country were higher in wolf risk than random points within that
5353
Biom
ass
(ND
VI)
0 .0
0.1
0.2
0.3
0.4
0.5
0.6
0.7
Bear
Ris
k
0 .0
0.1
0.2
0.3
0.4
0.5
0.6
0.7
Wol
f Ris
k
0 .0
0.1
0.2
0.3
0.4
0.5
0.6
0.7
FTHILLSW HC NP
LAND
Dis
tanc
e to
Are
as o
f Hig
h Be
ar R
isk
(m)
250
750
1250
1750
2250
0
500
1000
1500
2000
FTHILLSW HC NP
LAND
Dis
tanc
e to
Are
as o
f Hig
h W
olf R
isk
(m)
250
750
1250
1750
2250
0
500
1000
1500
2000
FTHILLSW HC NP
LAND
Dis
tanc
e to
Are
as o
f Hig
h Bi
omas
s (m
)
250
750
1250
1750
2250
0
500
1000
1500
2000
*
*
*
*
*
* *
*
*
*
*
*
*
**
**
*
Figure 2.5. The change in characteristics of predation risk and forage biomass ( x ± SE) from calving (●) to summer
seasons (○) for random points within the Foothills (FTHILLS), Western High Country (WHC), and North Prophet (NP) calving areas and in the Greater Besa Prophet landscape (LAND) in northern British Columbia, 2002-2003. Significant differences between seasons, as determined by the Mann-Whitney U-test, are indicated by an asterisk.
54
calving area during calving (P = 0.003) and in summer (P = 0.008).
During calving, calving areas had lower biomass and were farther from areas
of high biomass than the random points on the landscape (P < 0.001) (Table 2.4).
Among calving areas, the Foothills had the highest biomass and was closer to areas
of high biomass (P < 0.001). Trends in summer were similar to calving except there
was no difference in biomass between the Foothills and the landscape (P = 1.000),
and the Foothills was closer to areas of high biomass than the landscape (P < 0.001)
(Table 2.4). Biomass increased and the distance to areas of high biomass
decreased from calving to summer in all the calving areas and the landscape (all P <
0.001) (Fig. 2.5). All calving sites had lower biomass than random points on the
landscape (P < 0.001). Biomass was lower at calving sites than what was available
in the Foothills (P = 0.006), but higher in the Western High Country in the calving
season (P = 0.032). All the calving sites were farther from areas of high biomass
than what was available in the calving areas (P < 0.030). In the summer, all the
calving sites (P = 0.003) were lower in biomass than random points on the
landscape.
Relative to forage quality, the Foothills was higher in quality and closer to
areas of high quality than the other calving areas (all P < 0.019) and the landscape
(all P < 0.001) (Table 2.4). In contrast, the Western High Country was lower in
quality than the landscape (P = 0.002). The North Prophet, with insignificantly
higher quality than the Western High Country (P = 0.086), was the next closest to
areas of high quality forage. All the specific calving sites chosen by caribou were
higher in quality and closer to areas of high quality than random points on the
55
landscape (all P < 0.001). Calving sites within the Western High Country were
higher in quality (P = 0.006) and closer to areas of high quality in that calving area (P
= 0.049) (Table 2.4). Calving caribou also selected sites closer to areas of high
quality than random points in the Foothills calving areas (P = 0.019).
Topography varied among calving areas and the landscape and also at
calving sites within calving areas and the landscape (Table 2.4). Calving areas were
steeper and higher than random points on the landscape, and the Foothills was
lower in elevation than the other calving areas (all P < 0.001). Within the calving
areas, slopes at the Western High Country calving sites were not as steep as
random points (P = 0.001). Except for the Western High Country (P = 0.299),
calving sites compared to the calving areas (Foothills, P < 0.001; North Prophet, P =
0.025) and all calving sites compared to the landscape were higher in elevation (P <
0.001).
Forage and risk characteristics were positively related, with few exceptions, in
all seasons for all calving areas and the landscape (all P < 0.030) (Table 2.5).
Exceptions were in the Foothills, where there was no relationship between quality
and bear risk (P = 0.583) and a negative relationship between quality and wolf risk
during calving (P = 0.011). Cost (i.e., the slope of the relationship between predator
risk and a forage characteristic) varied among predators, forage characteristics,
calving areas, and seasons (Table 2.5). During calving, predation cost in bear and
wolf risk associated with biomass was lower in the Foothills than the Western High
Country and the North Prophet; the North Prophet was the highest in cost for bear
risk (all P < 0.009). For both calving and summer, the cost in wolf risk per unit

56
Table 2.5. Cost (slope ± SE) from the linear relationship of predator risk versus forage characteristics of random points within the Foothills (FTHILLS), Western High Country (WHC), and North Prophet (NP) calving areas in the Greater Besa Prophet area, northern British Columbia, 2002-2003. Slopes sharing the same letter were not significantly different among calving areas and slopes in the summer marked by an asterisk were different from the calving season; both comparisons were determined by a t-test of slopes with a Bonferroni adjustment for comparisons among calving areas.
Season Risk v. Forage Characteristic FTHILLS WHC NP Landscape Calving Bear Risk v. Biomass 0.24 ± 0.09a 1.79 ± 0.08b 1.35 ± 0.17b 0.25 ± 0.07a Wolf Risk v. Biomass 0.86 ± 0.08a 1.47 ± 0.10bc 1.31 ± 0.14ac 1.05 ± 0.06a Bear Risk v. Quality No relationship 0.30 ± 0.03a 0.24 ± 0.03a 0.28 ± 0.02a Wolf Risk v. Quality -0.09 ± 0.04a 0.23 ± 0.02b 0.22 ± 0.03b 0.24 ± 0.03b Summer Bear Risk v. Biomass 1.33 ± 0.07a* 1.17 ± 0.04ab* 1.21 ± 0.05ab 1.01 ± 0.03b* Wolf Risk v. Biomass 1.16 ± 0.08ab 1.31 ± 0.05b 0.99 ± 0.06 0.93 ± 0.05a Bear Risk v. Quality 0.47 ± 0.04a* 0.53 ± 0.02a* 0.54 ± 0.04a* 0.55 ± 0.02a* Wolf Risk v. Quality 0.33 ± 0.05a* 0.52 ± 0.03a* 0.46 ± 0.03a* 0.38 ± 0.03a

57
biomass was higher in the Western High Country than the landscape (all P < 0.009).
In the summer, the cost in bear risk per unit biomass was higher in the Foothills than
the landscape (P < 0.009). The cost in risk per unit quality usually did not differ
among calving areas and the landscape during calving and summer for bears or
wolves (Table 2.5). The exception was in the Foothills, where cost in wolf risk was
lower than the other calving areas and the landscape (all P < 0.009). From calving
to summer, cost in bear risk per unit biomass increased in the Foothills and on the
landscape, and decreased in the Western High Country (all P < 0.050). Cost in risk
for both bears and wolves per unit quality increased in every calving area for both
bears and wolves (all P < 0.050) (Table 2.5).
Models using large-scale characteristics (predation risk, biomass, and quality)
to predict survival of calves through calving and summer showed poor discrimination
(all ROC < 0.657) when movement was not included. All summer models improved,
as indexed by decreased AICc (3.00-9.14) and increased discrimination (0.06-0.23),
when movement was added as a covariate (Table 2.3). The most parsimonious
models (i.e., Er < 2.00) were Movement (ROC = 0.740) and Movement + Distance to
High Wolf Risk + Distance to High Bear Risk (ROC = 0.820). These models were
averaged, and the odds ratios for the distance to wolf and bear risk covariates did
not differ from 1.00; the odds ratio for caribou calves that stayed at the calving site
( ie β ± SE, 0.34 ± 0.12, P = 0.002) or moved away ( ie β ± SE, 2.96 ± 0.12, P = 0.002)
during the summer was ≠ 1.00. If a calf remained at its calving site to the end of
summer, assuming distances to areas of high wolf and bear risk were held constant,
the odds of survival decreased by approx. 66%. Models using large-scale

58
characteristics to predict movement of caribou calves from calving sites during the
calving and summer seasons had poor discrimination (all ROC < 0.660). There
were no differences in the independent effects of risk and forage characteristics on
survival of calves and movement events during any season (all P > 0.082).
DISCUSSION
Plasticity in life-history strategies may enable animals to decrease
predictability to large predators in space and time (Bowyer et al. 1999; Mitchell and
Lima 2002). Calving strategies of woodland caribou in the GBPA offered parturient
animals a landscape dynamic in both risk avoidance and forage acquisition. This
diversity provided options for female caribou that may increase the likelihood of
persistence under dynamic environmental and ecological conditions.
Hierarchical scales and trade-offs in risk and forage for calving caribou
The importance of predation risk in the selection of calving strategies and
calving sites by woodland caribou varied by predator and the scale of analyses.
Minimizing bear risk was important in the selection of calving sites within calving
areas, but not at the scale of the calving area (i.e., calving strategy). Caribou calved
in areas with bear risk no different or higher than what was available in 2 of the 3
calving areas. The Foothills was the ‘riskiest’ area to calve and remain during the
summer, as bear risk was higher and random locations within this area were closer
to areas of high bear risk in both seasons. Within this high bear-risk strategy and in
the North Prophet, however, calving caribou minimized the risk of bear predation by
59
selecting low-risk, high-elevation sites that increased the distance between calving
sites and areas of high risk (Table 2.4). Although the risk of bear predation to
caribou neonates has not been previously reported at the scale of the calving site or
calving area, bears have been documented to be effective predators of caribou
neonates (Ballard 1994; Adams et al. 1995; Young and McCabe 1997; Mahoney and
Virgl 2003).
Components of wolf risk, in contrast, were generally important in the selection
of calving strategies (Bergerud et al. 1984; Bergerud 1992), but not in selecting
calving sites within those strategies. Calving strategies (except for the Foothills)
were lower in wolf risk than what was found on the landscape, and all calving
strategies were further than random to areas of high wolf risk during calving. Again,
the Foothills was the ‘riskiest’ strategy, as it was higher in risk and closer to areas of
high wolf risk than the other calving strategies during calving and summer. Our
findings are consistent with previous research regarding the importance of
minimizing the risk of wolf predation by woodland caribou (Bergerud et al. 1984;
Bergerud and Page 1987; Seip 1991; Bergerud 1992; Bergerud 1996; Rettie and
Messier 2000) and other ungulates (Bowyer et al. 1999) at larger scales. There was
considerable variation, however, in wolf risk and distances to areas of high wolf risk
(approx. 800-2,000 m) among calving strategies (Table 2.4); no calving sites within
any calving strategy maximized distance from areas of high wolf risk within that
strategy.
The importance of nutrient acquisition in the selection of calving strategies by
caribou varied by forage characteristic and the scale of analyses. Avoiding areas of
60
high biomass appeared to be most important (Barten et al. 2001; Griffith et al. 2002).
Caribou calved in areas low in biomass that increased their distance from areas of
high biomass during calving and summer. The Foothills was higher in biomass and
closer to areas of high biomass (approx. 400 m) than the other calving areas, and in
some cases much closer (i.e., North Prophet, approx. 750 m) (Table 2.4). Within
calving strategies, however, response to different levels of biomass was variable.
Calving sites in the high-biomass strategy (i.e., Foothills) were relatively lower in
biomass, while sites in a lower biomass strategy (e.g., Western High Country) were
higher in biomass. The contribution of forage quality to the selection of calving
strategies and calving sites was variable. The Foothills was higher in quality and
closer to areas of high quality than the other calving strategies and the landscape.
Conversely, the Western High Country was lower in relative quality and farther away
from areas of high quality than random points on the landscape. The importance of
relative quality was more apparent in the selection of calving sites (Griffith et al.
2002), which were higher in quality and closer to areas of higher quality than what
was available in both low- and high-quality calving areas.
Calving caribou may have used topography to minimize risk or increase
access to forage, as evidenced by the selection of certain topographical features of
calving strategies and calving sites. Topography may increase separation (e.g.,
altitudinal separation) from predation and/or serve as a form of escape terrain (e.g.,
steep slopes) (Bergerud et al. 1984; Bergerud and Page 1987; Bergerud et al. 1990;
Barten et al. 2001). Terrain in all the calving areas of our study was steeper and
higher in elevation than what was available on the landscape, although elevation

61
varied among calving strategies. The high-risk strategy (i.e., Foothills) was lower
(approx. 1,600 m) than the other calving strategies (approx. 1,870 m) (Table 2.4).
Within the high-risk strategy, caribou selected calving sites higher in elevation than
what was available within this strategy, whereas caribou in the lower risk areas
showed no selection for higher elevations. In addition, variation in topography may
have provided better micro-site characteristics for vegetation (Barten et al. 2001)
because calving caribou in the Western High Country selected for gentler slopes
than what was found within this strategy.
Variation and trends in the large-scale components of bear and wolf risk,
topographical features, biomass, and relative forage quality among calving
strategies and calving sites suggest that trade-off ‘decisions’ were made by caribou
at several spatial scales. Avoidance of high biomass within calving strategies
(Whitten and Cameron 1980; Bergerud et al. 1984; Heard et al. 1996), and selection
for areas and calving sites high in relative quality (Bowyer et al. 1999; Barten et al.
2001), suggested that calving caribou foraged selectively in an attempt to address
their nutritional requirements (Whitten and Cameron 1980) and minimize their risk
(Barten et al. 2001; Griffith et al. 2002). All components of risk and forage were
higher in the Foothills than the other calving areas, and based on these data, we
assumed animals were taking an increased cost in risk for access to relatively higher
biomass and/or quality. Calving caribou that used this strategy, however, did so at a
higher risk, but not at a higher cost in risk per unit forage component. The relative
cost in both bear and wolf risk per unit biomass was lower in the high-risk strategy
than the other calving areas during calving, and there was no cost in increased risk
62
associated with foraging in areas with high relative quality (Table 2.5). In the high-
risk strategy, caribou calved at sites low in biomass that increased the separation
from areas of high biomass and this likely decreased the susceptibility of calving
caribou and/or their calves to predation, as evidenced by cost in the risk of predation
per unit biomass (Bowyer et al. 1998; Bowyer et al. 1999). Non-parturient and male
caribou and moose are known to forage in areas higher in biomass and at lower
elevations than parturient caribou; avoidance of these areas, therefore, was likely in
response to the presence of conspecifics, other ungulates, and/or predators
(Bergerud et al. 1984; Bergerud and Page 1987; Seip 1991; Barten et al. 2001).
Parturient caribou probably foraged selectively in areas of high quality to address the
nutritional requirements of lactation while avoiding areas of high biomass to
minimize the risk of predation (Barten et al. 2001; Griffith et al. 2002). The high-risk
strategy also increased opportunities for caribou to calve in sites with access to, or
that were in, high-quality areas with no increase in risk per unit quality. We recorded
no early predation mortalities (<14 d) in this strategy, and our data do not support
observations that caribou disperse to calve regardless of vegetative phenology
(Bergerud e al. 1984; Bergerud and Page 1987). Alternatively, in the Western High
Country, calving caribou selected calving sites that were relatively higher in biomass
and quality in a strategy that had the highest cost in wolf risk per unit biomass. Most
of this area is unsuitable (i.e., largely non-vegetated with steep and rugged terrain)
for large, productive areas of vegetation, so caribou calved at sites in hanging
valleys, and did so at a high cost in risk per unit forage component within that calving
area. Additionally, in the North Prophet, calving caribou did not select sites lower in

63
biomass or wolf risk even though cost in risk for biomass was high; rather, caribou
selected non-vegetated, high-elevation calving sites that were low in bear risk and
that increased separation from areas of high biomass. In this area, minimizing the
risk of bear predation appeared to be more important than minimizing wolf risk; our
models may actually have underestimated bear risk because this area was at the
northern extent of the bear GPS data.
Predictions of calf survival
Despite the spatial variation in the risk of predation, forage, and cost
characteristics, survival of caribou calves and cause-specific mortality did not differ
among calving strategies. There appears to be no proximate benefit(s) (i.e., higher
birth weights, and/or increased survival through summer) of calving in one strategy
over another. Models using small- and large-scale characteristics of calving sites,
however, performed well in predicting survival of calves during calving and summer,
respectively.
Herbaceous and shrub cover were excellent predictors of early calf survival,
with cover of shrubs increasing the odds of survival (approx. 13% per 1% increase in
shrub cover) through the calving season (Table 2.3). Deciduous shrubs, primarily in
the form of willow and bog birch, could obscure neonates from the view of predators
(Bowyer et al. 1998; Bowyer et al. 1999; White and Berger 2001) and/or be an
important spring forage for parturient caribou (Boertje 1984; Ferguson et al. 1988;
Crête et al. 1990a). The role of herbaceous cover in decreasing the survival of
caribou calves was less clear. Herbaceous and shrub cover were inversely

64
correlated, but this relationship may have been confounded by measurements at
different scales (i.e., plot versus line-intercept data). It is possible that the influence
of shrubs on calf survival was an effect of calving strategy, because the Foothills had
higher cover of shrubs than the other calving strategies and only one mortality during
calving (age of calf = 14 d); the large-scale model with calving area as a covariate,
however, did not perform well in predicting survival of calves for any season. Cliffs
may be important refugia for calving caribou from terrestrial predators, but models
with cliff-intercept data could not be evaluated because no mortalities occurred at
sites near (<50 m) these topographical features. The poor model performance of
small-scale characteristics in predicting calf survival through summer suggested that
either the importance of small-scale characteristics of calving sites in calf survival
diminished during the summer and/or that other factors (e.g., movement away from
calving sites) became more important for calf survival.
Large-scale characteristics of calving sites were not good predictors of
caribou calf survival; this is not surprising given the cause-specific mortality data.
Calving strategies appeared to have a high risk of wolverine predation during
calving, as the first increase in mortality was caused by wolverines with eagles and
bears to a lesser extent (see Fig. 2.3a and 2.3b). Consequently, the influence of
bear and wolf risk was not important in our models predicting early calf survival.
Wolverines are known to range over large areas, use a variety of habitats (Whitman
et al. 1986), and commonly feed on reindeer (Rangifer tarandus) during the denning
period in Norway (Landa et al. 1997; Vangen et al. 2001). Although data on
densities and diets of wolverines in the northern Canadian Rockies are currently

65
lacking, anecdotal evidence from the GBPA suggested that it was productive
wolverine habitat.
Movement was an important variable in our models to predict survival of
calves in the summer. Twenty-one cow-calf pairs left the calving sites when calves
were 2-4 weeks of age (Fig. 2.3a). Movement away from calving sites significantly
increased the odds of calf survival (approx. 196% when other covariates were held
constant). The reasons for these movements were not clear, but the timing of
movements suggested that caribou may have responded to changes in vegetation,
nutritional demands, and/or risk at smaller temporal scales than those measured in
our risk and forage models. Greening of vegetation and timing of change in
vegetative phenology are important attributes of forage quality for parturient caribou
(Oosenbrug and Theberge 1980; Post and Klein 1999; Griffith et al. 2002; Post et al.
2003). The first peak of movement followed an increase in mortality (Fig. 2.3a and
2.3b) that corresponded with the time of high nutritional demands for lactation (White
and Luick 1984) and the time when lactating females experience their worst
condition of the year (Chan-McLeod et al. 1999), and, therefore, movement may
have been in response to changes in vegetation within calving areas. In a
mountainous environment, vegetative change is likely to vary both spatially and
temporally among vegetation types, aspects, and elevations (Reed et al. 1994). Our
index of forage quality was based on areas of vegetation that experienced the
largest amount of growth from the calving to summer season, but we can offer no
estimate as to the rate or timing of that growth; the relationship of the change in
NDVI and forage quality at smaller temporal scales remains an open area for

66
research (R. Lay and D. Gustine, University of Northern British Columbia,
unpublished data). Caribou likely responded to the change in vegetative phenology
as it happened (i.e., at a temporal scale smaller than the seasonal scale)
(Oosenbrug and Theberge 1980; Post and Klein 1999; Barten et al. 2001; Griffith et
al. 2002; Post et al. 2003). Nonetheless, caribou calved in areas (Foothills) or at
sites (i.e., Foothills, Western High Country) near, or in, these areas of high
vegetative change between seasons.
A second extended peak in movement (i.e., 8 cow-calf pairs left the calving
site) occurred during weeks 5-7 (Fig. 2.3a and 2.3b) following an increase in caribou
calf mortality. This timing appeared to coincide with the ability of wolves to leave the
dens and, subsequently, a possible change in prey species in the diet (B. Milakovic,
University of Northern British Columbia, unpublished data). Indeed, survival for
caribou calves was higher through calving than summer; wolves were responsible
for 5 of the 8 identified mortalities in the summer season (Fig. 2.3b). The risk of wolf
predation increased and the distance to areas of high wolf risk decreased in all the
calving areas from the calving to summer season. Nonetheless, calving strategies
of woodland caribou were relatively successful in minimizing losses of neonates to
wolves during calving compared to other predators even though risk of wolf
predation was dynamic in the GBPA. Wolf predation has been identified as an
important factor in survival of caribou calves, particularly for neonates (Gasaway et
al. 1983; Bergerud et al. 1984; Bergerud and Elliot 1986; Bergerud and Page 1987;
Seip 1992; Adams et al. 1995).
Caribou started to form post-calving aggregations (approx. 20-40 cows and

67
calves) in the Foothills and North Prophet calving areas at the end of June; this
grouping behavior is contrary to observations by Poole et al. (2000), but similar to
Bergerud et al. (1984). Concurrently, there was an increase in the cost in both bear
and wolf risk associated with forage quality in all calving strategies from the calving
to summer season (Table 2.5), which suggested that wolves and bears could be
responding to caribou as a more predictable prey item (i.e., larger groups)
(Hebblewhite and Pletscher 2002) or were actively searching these areas of high
vegetative change for other prey. Bears may be feeding on vegetation in these
areas of high change (Nielsen et al. 2003), so this relationship was less clear;
nevertheless, cost in bear predation per unit forage quality increased for caribou
foraging in areas with high relative quality. Alternatively, the gregariousness of
caribou in late June could be a social response to the increased risk of wolf
predation within the calving areas (Bøving and Post 1997; Barten et al. 2001;
Hebblewhite and Pletscher 2002), as a caribou with a calf could minimize the risk of
predation by decreasing the chances of being selected from the group (Hamilton
1971), while simultaneously foraging in areas with higher forage biomass and/or
relative forage quality (Molvar and Bowyer 1994; Bowyer et al. 1999; Kie 1999).
Implications to understanding successful calving strategies
The interpretation of our data was dependant on the spatial scale of analyses.
Analyses of characteristics of all calving sites versus characteristics of random
points on the landscape provided some information on large-scale processes that
caribou may have responded to, but more often, these pooled analyses collapsed
68
important variation in risk and forage characteristics. Conclusions from analyses at
the ‘landscape’ scale would have failed to provide insights into how animals
responded to risk, forage, and topography in a hierarchical fashion at smaller spatial
scales. Our definitions of the ‘landscape’ and calving areas may have confounded
analyses. We acknowledge that processes important to life-history requirements of
caribou and their predators are not constrained within the boundaries of the GBPA
and/or our ‘defined’ calving areas. Indeed, a few collared bears and a collared
caribou calf did leave the study area; collared caribou, wolves, and bears moved
among calving areas. Historical telemetry data (adult caribou, wolves, and bears)
and 2 yrs of extensive observations (calving caribou), however, provided good
information on the distribution and social structure of animals in the GBPA, and
these data were used to identify important areas for capturing and collaring efforts.
The assumption that bear and wolf GPS data were representative samples of
animal locations has some limitations. Fix-rate bias in GPS data has been reported
for areas with varied topography or cover types (Dussault et al. 1999; D. Heard,
British Columbia Ministry of Water, Land, and Air Protection, unpublished data),
particularly when fix rates are low (<90%). This bias may have led to an under- or
overestimate in the selection of any individual resource by wolves and bears, which
would subsequently increase Type I (overestimated selection) and/or II
(underestimated selection) error rates (Frair et al. 2004). Our ability to detect
whether risk was actually ‘the same’ between years was reduced because fix rates
for wolves and bears were <90%. The responses of calving caribou to modelled
risk, however, were similar, with some exceptions, to what has been observed,

69
quantified, or postulated in other studies (Bergerud et al. 1984; Bergerud and Page
1987; Bergerud et al. 1990; Bergerud 1992; Seip 1992; Barten et al. 2001). The
timing of calf mortality coincided with an increase in modelled wolf risk in all of our
calving areas. Our results suggest that modelling risk with RSFs is a valid technique
in evaluating predator-prey interactions at large spatial scales, and may become
more useful as bias in GPS fix rate is identified and corrected.
Low power was also a concern in the use of nonparametric tests, because
these tests usually have lower power than their parametric counterparts (Siegel
1956); this reduced discussion of the ‘indifferences’ in the attributes of risk and
forage among calving strategies and at calving sites within calving strategies.
Transformation of the data was a possibility, but we wanted to avoid further
manipulation of modelled data. The conservative nature of nonparametric tests (i.e.,
higher P) may have helped to address some concerns of cumulative error
throughout the modelling process, although error terms for RSFs integrated with
raster and vector GIS and GPS data are difficult to quantify and remain a topic for
future research (Corsi et al. 2000).
We may have misinterpreted the responses of parturient caribou to modelled
risk. As in Johnson (2000), we can estimate animals’ responses only to actual
and/or perceived risk (Lima and Dill 1990). Additionally, what we perceived as
responses to predation risk may have been responses to the primary prey of wolves
and/or bears (Johnson 2000). We submit that our models of risk tracked relative risk
in the GBPA at the seasonal scale, but, how caribou ‘measured’ this risk is
uncertain. We do not know if caribou were actively reducing their risk of predation or

70
simply experiencing a reduced risk (Johnson 2000). Responses to risk may be a
product of social learning (Lima and Dill 1990; Caro 1994; Byers 1997; Miller 2002),
individual experience (Lima and Dill 1990), visual and/or chemical cues (Kats and
Dill 1998), and/or ‘luck’. Nonetheless, the predictable fashion in how animals
responded to components of risk within calving areas (e.g., minimized bear risk in an
area with high bear risk) and on the landscape suggested calving caribou were
sensitive to parameters of risk among spatial scales.
Despite these concerns, our results confirm the importance of predation and
forage characteristics on the distribution of calving caribou. Parturient caribou
generally selected for areas high in relative quality (i.e., vegetated areas with high
change in NDVI) and data were consistent with research that has examined the
importance of forage quality at large (Griffith et al. 2002) and small scales (Barten et
al. 2001). Lowering wolf risk and the ability of caribou to ‘space out’ from wolves
was important in selection of all calving strategies (Bergerud et al. 1984), although
variation in the components of risk was high among strategies. In all calving areas,
caribou used small-scale features (e.g., cliffs, shrub-cover, steeper slopes),
movement, and/or possibly gregariousness (Molvar and Bowyer 1994) to minimize
the risk of predation and ‘cope’ with the increase in wolf risk from calving to summer.
Small-scale features and movement had prominent effects on calf survival through
calving and summer, respectively. A more precise measure of movement combined
with measures of risk and forage characteristics at smaller temporal scales could
provide further insights into important mechanisms defining woodland caribou-wolf
interactions in a multi-predator multi-prey system.

71
Plasticity by caribou was high among calving strategies, and although our
data showed no proximate benefits to any one calving strategy, there may be factors
that maximize reproductive fitness. Characteristics of forage affected the level of
risk that caribou ‘took’ within a calving strategy. The high-risk strategy offered
caribou more opportunities to forage in areas of high quality, and possibly high
biomass later in the summer. These characteristics could have increased the rate of
weight gain in calves through the summer and allowed the dam to replenish body
reserves (Reimers et al. 1983; Crête et al. 1990b), following the nutritional demands
of lactation, necessary for breeding and over-winter survival. Consequently, an
improved condition in autumn could have direct effects on reproductive fitness and
possibly increase calf survival through winter (Dauphiné 1976; Cameron et al. 1993;
Adams and Dale 1998a,b; Cook et al. 2003). Benefits of the lower risk strategies
were less apparent, as survival did not differ from the high-risk area. The
persistence of these strategies, however, suggests that these areas could become
more important as ecological conditions change (e.g., changes in ungulate and/or
predator distributions and densities) (Bergerud 1983; Bergerud et al. 1984; Bergerud
and Elliot 1986; Dale et al. 1994; Bergerud and Elliott 1998).
Diversity of vegetation, topography, and large mammals in the GBPA offered
caribou a diversity of ‘choices’ among scales. Mechanisms (e.g., social learning,
(Caro 1994; Byers 1997), nutritional condition (Lima 1988; Boertje 1990; Clark 1994;
Sweitzer 1996)) that may, or may not, ‘drive’ selection of a risk-averse or risk-prone
calving strategy (Stephens and Krebs 1986) remains an important area for research.
In particular, there is a need to identify the effect(s) of a calving strategy on
72
physiological parameters of calving caribou and their offspring as well as on calf
survival through winter. Current technologies and methodologies (e.g., remotely
sensed data and indices of vegetative change, GPS telemetry, RSFs, ultrasound
estimates of body fat, stable isotope ecology) are likely to improve and may assist in
identifying physiological and/or ecological conditions that ‘drive’ woodland caribou to
‘select’ areas to calve, and the subsequent effects on reproductive fitness.
Plasticity as a life-history strategy during calving and summer is likely to be
successful as long as caribou have ‘choices’ on the landscape. If woodland caribou
have fewer choices at large scales, they may become more predictable in space and
time for their main predators and have difficulty meeting nutritional requirements,
with possible consequences to survival, reproductive success, and, ultimately,
population persistence. ‘Choices’ available to woodland caribou at large scales
appear to have a direct impact on how animals use smaller scale features to
maximize access to forage and/or minimize risk (Rettie and Messier 2000; Johnson
et al. 2001; Johnson et al. 2002a,b). Sensitivity of woodland caribou to the direct
and indirect effects of anthropogenic (Bradshaw et al. 1997; Stuart-Smith et al. 1997;
James and Stuart-Smith 2000; Dyer et al. 2001; Weclaw and Hudson 2004) and
environmental disturbances (Schaefer and Pruitt 1991; Joly et al. 2003) has been
well documented. Management or industrial activities that alter the distribution of
caribou during calving and summer should be avoided until they can be evaluated
for possible long-term effects on population productivity. This will become
increasingly important as weather patterns, which may affect the availability of
forage (e.g., altering the timing of spring snows and/or greening of vegetation; Post
73
and Klein 1999; Lenart et al. 2002; Weladji and Holand 2003; R. Farnell, Yukon
Government, Department of Environment, pers. comm.) and/or the ability of calving
caribou to disperse from areas of high risk (Bergerud et al. 1984; Bergerud and
Page 1987; Bergerud et al. 1990; Seip 1991), become more unpredictable and could
have direct and indirect consequences to the survival of woodland caribou neonates.

74
CHAPTER 3: INTERPRETING RESOURCE SELECTION BETWEEN SCALES
AMONG INDIVIDUAL WOODLAND CARIBOU IN WINTER1
ABSTRACT
Resource selection functions (RSFs) are commonly used to identify areas
and/or mechanisms important to large herbivores. Defining availability of resources
is scale-dependant and may limit inference on biological mechanisms of selection,
particularly if variation in selection of resources among individuals within a
population is high. We used logistic regression, the information-theoretic approach,
and global position systems (GPS) data from 10 woodland caribou (Rangifer
tarandus caribou) and 5 wolf (Canis lupus) packs to model resource selection by
individual animals in the winter and late winter seasons. We evaluated the influence
of spatial scale on the relative importance of cost of movement and components of
predation risk. We examined the attributes of the risk of wolf predation within
availability data at 2 spatial scales, and quantified variation in resource selection
among individual caribou to determine the appropriateness of using selection
models from data pooled across individuals. Energetic cost of movement was the
most important covariate for all caribou at a spatial scale defined by seasonal
movement, whereas increasing distance to areas of high wolf risk was more
important at the larger spatial scale of home range. Variation was high in the
1A version of this chapter will be submitted for publication with the following authorship: Gustine, D. D., K. L. Parker, M. P. Gillingham, and D. C. Heard.

75
selection of resources among caribou, although commonalities among individuals
facilitated pooling use/available data into 2 selection strategies. We caution that
using pooled models to define areas important to large herbivores and to infer
biological mechanisms for selection should be done only after variation among
individuals is quantified.
INTRODUCTION
Evaluating mechanisms in ecological processes may be confounded by the
influence of both spatial and temporal scales (Johnson 1980; Wiens 1989; Levin
1992). Animals typically respond to environmental factors in a hierarchical fashion
(Johnson 1980; Senft et al. 1987; Schaefer and Messier 1995; Johnson 2000;
McLoughlin et al. 2002), and therefore, inferences on ecological mechanisms are
likely to vary with the scale of analyses (Wiens 1989; Danell et al. 1991; Johnson
2000). Problems that add further complexity to the issue of scale are that the
selection of resources may vary among individuals by age (Nielsen et al. 2002), sex
(McLoughlin et al. 2002), and/or reproductive condition (Rachlow and Bowyer 1998)
within a population (Aebischer et al. 1993; Garshelis 2000; Nielsen et al. 2002) and
that the variation in the selection of habitats among individuals (i.e., plasticity) may
be an important life-history trait for the species (see Chapter 1; Bowyer et al. 1999).
Factors that influence selection of habitats by ungulates include year (Wood 1996),
time of year (i.e., season, Apps et al. 2001), forage abundance and/or availability
(Schaefer and Messier 1995), cover (Boyce et al. 2003), anthropogenic disturbance
(Nellemen and Cameron 1998), energetic cost of movement (Johnson 2000), and/or
76
the risk of predation (Lima and Dill 1990; Bowyer et al. 1998; Kie 1999). Factors
may vary in relative importance across scales (Wiens 1989) with those most limiting
to individual fitness possibly important at coarser scales (Rettie and Messier 2000).
Resource selection functions have been used to identify and model
characteristics of areas that are selected and inferred as important to ungulate
populations at a variety of scales (Schaefer and Messier 1995; Poole et al. 2000;
Rettie and Messier 2000; Apps et al. 2001; Boyce et al. 2003; Johnson et al. 2004).
The RSFs are often defined using logistic regression in use versus availability
designs (Boyce and McDonald 1999; Boyce et al. 2002; Manly et al. 2002).
Because availability is commonly limited to the study area (McClean et al. 1998) or
home range(s) of a population (Johnson 1980), inferences are typically made
relative to the selection of resources by a population, and rarely on the selection of
resources by individuals (Aebischer et al. 1993) within that population (i.e., Type I or
II versus Type III design, Thomas and Taylor 1990), particularly for large mammals
(Nielsen et al. 2002). Defining availability as the study area, or as the sum of the
availabilities of individual animals, to model selection across animals may provide
good predictive models of animal distribution (Boyce et al. 2003), but could be
limited in delineating mechanisms of resource use, particularly if variation in
resource selection is high among individuals (Aebischer et al. 1993; Manly et al.
2002; Nielsen et al. 2002). Johnson et al. (2002a,b) suggested using parameters of
movement to define availability for woodland caribou because movement events
(i.e., migration, and intra- and inter-patch movements) could provide insights into
scale-dependant mechanisms of selection and future research should be conducted

77
at multiple scales to identify important habitats. Management agencies, however,
frequently have limited resources and/or locational data to conduct multi-scale
analyses, and therefore, recent research has attempted to ascertain the ‘best’ scale
of analysis in predicting habitats important to large herbivores (Apps et al. 2001;
Boyce et al. 2003). Although a ‘best’ scale is unlikely to exist for examining
mechanisms that underlie selection behavior(s) (Wiens 1989), some scales,
particularly the patch scale (i.e., Johnson’s (1980) third order of selection), and
corresponding definitions of availability (i.e., home ranges) may be more appropriate
and/or useful to managers. Woodland caribou are an excellent species to evaluate
the importance of different covariates in resource selection at different scales, the
interaction between scale and definitions of availability, and the variation in the
selection of resources among individuals. Caribou require large areas to over-winter
(Cumming 1992; Zimmerman et al. 2002), exhibit scale-dependant responses to
habitat factors (Apps et al. 2001; Johnson 2000; Poole et al. 2000; Rettie and
Messier 2000; Mosnier et al. 2003), and appear sensitive to physiological (e.g.,
energetic costs of movement, Gerhart et al. 1996; Johnson et al. 2002a) and
ecological parameters (i.e., risk of predation; Bergerud et al. 1984; Bergerud and
Elliot 1986; Seip 1991, 1992; Bergerud 1992; Johnson et al. 2002a).
Woodland caribou move on the landscape to capitalize on habitat
components that provide welfare factors (Cumming 1992). The northern ecotype of
woodland caribou in British Columbia (Heard and Vagt 1998) over-winters in wind-
swept alpine areas (Cichowski 1993; Wood 1996), low elevation pine-lichen stands
when snow depths are low (Johnson 2000; Zimmerman et al. 2002), or intermediate

78
to high-elevation spruce-fir forests (Cichowski 1993; Poole et al. 2000). Sizes of
winter home ranges and movement rates vary among regions and individuals, and
are largely dependant on the types of available habitats and the scale of analyses
(Wood 1996; Poole et al. 2000; Johnson et al. 2002a,b). Minimizing energetic costs
in winter may be important for female caribou moving among patches, often in areas
with a high risk of predation (Johnson 2000). The importance of minimizing costs
may be influenced by body condition. Data show that non-pregnant females have
lower fat reserves than pregnant animals (Dauphiné 1976; Appendix H); this
difference in body condition may affect movement rates and the availability of
resources, and, subsequently, resource selection.
Woodland caribou appear sensitive to distribution of other ungulates and
wolves during the winter (Bergerud 1992; Seip 1992; Cumming et al. 1996; James
1999; James and Stuart-Smith 2000; Johnson et al. 2002a). Increased densities of
caribou often stimulate a functional response in wolf populations (Bergerud and Elliot
1986; Seip 1991; Bergerud 1992; Dale et al. 1994). Dispersal by caribou over large
areas is thought to be an effective life-history strategy against wolf predation during
all times of the year (Bergerud 1992; James 1999), and may play a role in survival
(Seip 1992; Wittmer 2004). By increasing the distance between conspecifics, other
ungulates (e.g., moose (Alces alces)), and wolves, dispersal by individuals increases
search time and lowers encounter rates for wolves, therefore decreasing hunting
efficiency (Bergerud et al. 1984; Bergerud and Page 1987; Cumming et al. 1996;
James 1999; Barten et al. 2001).
The goal of this study was to identify habitats and ecological parameters

79
important to female woodland caribou during the winter (November-February) and
late-winter seasons (March-April) in a multi-predator multi-prey ecosystem in north-
central British Columbia. Our objectives were 1) to identify the relative importance of
the cost of movement, the risk of predation, and the distance to areas of high risk for
pregnant and non-pregnant animals at a relatively small spatial scale defined by
seasonal movement, 2) to identify the consequences of defining availability at the
scale of seasonal movements versus the relatively large seasonal home range on
the importance of the components of predation risk, 3) to quantify the variation in the
selection of resources among individual caribou at the management-oriented scale
of the seasonal home range, and identify common selection strategies among
individuals, and 4) to qualitatively evaluate the utility of resource selection models
pooled across individuals compared to individual models for collared caribou.
STUDY AREA
The Greater Besa Prophet area (GBPA) (approximately 741,000 ha) is part of
the 6.2 million-ha Muskwa-Kechika Management Area in northern British Columbia
and is located between 57o11’ and 57o15’ N latitude, and 121o51’ and 124o31’ W
longitude. A detailed description is provided in Chapter 2:16 (see Fig. 2.1).
METHODS
Animal capture and locational data
Twenty-five adult female caribou and 23 wolves from 6 packs were captured

80
and fitted with GPS collars (Simplex, Televilt, Lindesberg, Sweden) in November-
December 2001. Collars were programmed to acquire locations every 6 hrs for 2
yrs. Previous telemetry data on wintering areas of female caribou and territories of
wolf packs in the GBPA were used to target areas for animal capture. Caribou were
captured from a helicopter (Bell 206) using a net-gun. We took blood samples to
determine reproductive condition of caribou via serum progesterone concentrations
(Prairie Diagnostics Services, Saskatoon, SK, Canada).
GPS data were recovered via remote download or by collar retrieval. Data on
individual caribou were included in analyses if there were locational data from the
date of capture to the date of download. All GPS data were screened for erroneous
easting and/or northing coordinates (i.e., points beyond realistic animal movement
between successive locations as defined by biological and/or statistical significance
(D’Eon 2002) and dilution of precision >25) which were removed from analysis using
a spatial analysis program (M. Gillingham, University of Northern British Columbia).
Fix rate per caribou (i.e., per GPS collar) was defined as the number of quality fixes
(i.e., fixes that met aforementioned criteria) acquired from capture to the end of the
late winter season divided by the total number of possible fixes within that time
period. Caribou locations acquired on the day of and after capture were not included
in analyses because preliminary analyses suggested movement rates immediately
post capture tended to be atypical.
Movement rates (m/hrr) of caribou and changes in environmental conditions
from November to April were used to define 2 caribou seasons: winter (November-
February) and late winter (March-April). Movement rates per individual (i.e.,
81
distance between consecutive 6-hr fixes) were averaged by month and then
averaged across individuals for a pooled estimate of monthly movement rate; n for
the SE was the number of caribou.
We used movement rates and seasonal home ranges to define availability of
resources for individual caribou and wolf packs. Availability was defined at 2 scales
for caribou, both within Johnson’s (1980) third order of selection: seasonal
movement and seasonal range. Seasonal movement was an individual caribou’s
potential for movement within a season. Movement potential was a circle, centered
on each use point (i.e., a GPS location), with a radius equal to the distance
determined from the 95th percentile movement rate for 6-hr fixes; 5 points for
availability locations were randomly selected within this distance from the use point.
A seasonal range was the home range, as defined by a 100% minimum convex
polygon (MCP) (Mohr 1947), of an individual caribou for that season, ‘buffered’ by
the movement potential distance. Resource availability for each wolf pack was also
defined using 100% MCPs for each pack by caribou season (i.e., winter and late
winter). MCPs were estimated using the animal movement extension (Hooge et al.
1999) in Arcview 3.2 (Environmental Systems Research Institute, Redlands, CA,
USA) and MCPs and GPS data were ‘clipped’ to the boundaries of the GBPA. All
but one of duplicate wolf locations (i.e., same date and time) within a pack were
randomly removed to address issues of independence. Five availability points per
use point were randomly selected within each MCP for each wolf pack and individual
caribou using the random point generator extension (Jenness 2003) in Arcview 3.2
(Environmental Systems Research Institute, Redlands, CA, USA).

82
Inputs to resource selection models for caribou
Vegetation, Topography, and Distance to Linear Features
Vegetative and topographical covariates in resource selection model sets for
caribou and wolves were 25-m resolution raster geographic information system
(GIS) data. A digital elevation model (DEM) was obtained from the 1:20,000 British
Columbia Terrain and Resource Inventory Management program (Ministry of Crown
Lands 1990); this dataset was used to create the slope (°) and aspect layers. For
wolves, aspect was categorized into north (316-45°), east (46-135°), south (136-
225°), and west (226-315°) directions to address problems with northerly values
having the same aspect but different values (0° and 360°); pixels with slope ≤1°
were assigned no aspect. For caribou, aspect was maintained as 2 continuous
variables to minimize issues of perfect separation; these were northness (i.e.,
cosine(aspect)) and eastness (i.e., sine(aspect)) (Palmer 1993). Northness values
of 1.00 and -1.00 suggest selection for north and south aspects, respectively, while
values near 0.00 suggest selection for east and west aspects. Eastness values
show selection for east (i.e., 1.00) and west (i.e., -1.00) aspects; values of 0.00 show
selection for northern/southern exposures (Palmer 1993). Vegetation classes were
identified using an August 2001 Landsat Enhanced Thematic Mapper image (R. Lay,
University of Northern British Columbia, unpublished data). Fifteen vegetation
classes with a minimum mapping unit of 75 x 75 m were combined into 9 classes to
allow for accuracy levels >80% and complete separation in logistic regression
models, while maintaining biologically important differences (Appendix B: Table B.1,
Fig. B.1). These classes were spruce, shrubs, subalpine, Carex spp., non-

83
vegetated, pine, riparian spruce, alpine, and burned/disturbed. Measures of
vegetative diversity or juxtaposition also may be an important component of
resource selection (Johnson 2000). Therefore, we created an index of vegetation
fragmentation from grouped vegetation cover types representing fragmentation as
closed, open, or unique cover types as in Chapter 2:30-31. Because linear features
may be important travel routes for wolves in winter (James and Stuart-Smith 2000),
we created a distance to linear features layer as in Chapter 2:30.
Risk of Predation and Distance to Areas of High Predation Risk
Predation risk to caribou was quantified using logistic regression to form
resource selection functions that identified habitats important to wolves in the GBPA
from 1 November 2001 to 30 April 2002. The models incorporated wolf GPS data,
elevation (km), categorized aspect, slope (°), vegetation, distance to linear features
(km), and the index of fragmentation. Risk of predation was defined as the
probability of being killed during a season (Lima and Dill 1990); assumptions were
as in Chapter 2:28. Ecologically plausible RSF risk models (Appendix C.4) were
developed to define predation risk and distance to habitats with a high risk of
predation from each wolf pack by season. We calculated coefficients of selection
(i.e., beta coefficients, iβ ) using logistic regression (Manly et al. 2002), and
identified the most parsimonious models, as in Chapter 2:31-32. Nine RSFs were
formed to define risk by wolf pack and season (winter and late winter).
84
Estimated Costs of Movement for Caribou
We used the change in elevation and the distance between use and available
points to model the energetic cost of movement (kJ/kg/hr) by female caribou across
variable terrain (Johnson et al. 2002a). Cost of movement was estimated from
equations developed by Fancy and White (1987), ignoring snow depth or slope
because the time between fixes (i.e., 6 hrs) probably allowed access to numerous
microsite conditions. Therefore, these equations underestimate actual cost because
topography and snow depths are extremely variable across the GBPA. The DEM
(Ministry of Crown Lands 1990) was used to determine if a caribou moved uphill,
horizontal, or downhill from one location to another; therefore, ‘use’ cost was from
use locationx to use locationx+1, and ‘available’ costs were from use pointx to each of
the 5 available points within the potential for movement distance around use pointx.
The cost of locomotion for moving uphill (3.640 kJ/kg/km), on a horizontal surface
(1.722 kJ/kg/km), or downhill (1.293 kJ/kg/km) was multiplied by the distance (km)
between points divided by the duration of time between GPS fixes to give an
estimate per unit time (kJ/kg/hr).
Relative importance of covariates and scale
Logistic regression and Akaike’s Information Criterion for small sample sizes
(AICc) were used to form RSFs that identified habitats important to individual female
caribou in the GBPA from 1 November 2001 to 30 April 2002. All variable coding,
and model estimation, selection, averaging, and assessments of inputs were as in
the predation risk models, except for a stricter evidence ratio (Er) criterion (<2) and

85
less stringent tolerance score threshold (<0.20) (Burnham and Anderson 2002;
Menard 2002). For all caribou, elevation (km) and the risk of wolf predation were
entered as quadratic (i.e., linear and squared terms) and linear terms, respectively.
The effects (i.e., linear versus Gaussian or bell-shaped) of slope (°) and the distance
to areas of high wolf risk (km) were evaluated for each individual caribou by
examining the change in AICc after adding or removing the squared term of the
quadratic; if the addition of the quadratic term to the saturated model decreased
AICc, then the variable was entered as a squared term. Vegetation classes that
were rare or did not occur in use and/or available data were not included in model
formulation.
We evaluated the relative importance of the risk and cost covariates at the
scale of seasonal movement and the risk covariates at the scale of the seasonal
range by examining Akaike weights ( iw ) after the addition of these covariates to a
core model set (Burnham and Anderson 2002). High iw (i.e., the likelihood of the
model given the data and other models in the set) and a lower AICc suggest the
model ‘improved’ by the additional information provided by the covariate(s), whereas
a lower iw and higher AICc suggest the information from the covariate(s) was
redundant (Burnham and Anderson 2002). We evaluated 9 ecologically plausible
‘core’ models that included elevation (km), aspect (i.e., northness and eastness),
slope, vegetation, and the index of fragmentation. The risk of predation, distance to
areas of high wolf risk (km), and cost of movement (kJ/kg/hr) covariates were added
individually to each model in the core set for each caribou by season. At the scale of
seasonal range, we added only the risk covariates, as cost could not be evaluated

86
effectively at this scale. The complete model set (core models plus the cost, risk,
and distance to areas of high risk covariates) for each caribou, season, and scale
was evaluated in the same manner as the predation risk models. We estimated the
relative importance of covariatej (i.e., cost, risk, or distance to areas of high risk) by
summing the iw across all models for individual caribou by season where covariatej
was included in the model ( )( jw + , Burnham and Anderson:168); the larger the
)( jw + , the more important covariatej was relative to the other covariates (Burnham
and Anderson 2002:168). We averaged )( jw + across caribou by season ( )( jw + ) to
evaluate the relative importance of covariatej among all caribou.
To examine the importance of the risk components at both scales in reference
to the core model set, we calculated the change in AICc ( i∆ ) when covariatej was
added to the ‘best’ core model for each caribou by season and scale; we then
averaged the i∆ when covariatej was included in the model across animals within a
season and scale ( i∆ ). We used frequency histograms and t-tests (Zar 1998) to
compare the attributes of the available risk and distance to areas of high risk data
between scales (i.e., seasonal range and seasonal movement) by season for each
individual caribou.
Quantifying variation in the selection of resources among individuals
Resource selection by individual caribou was determined from the most
parsimonious models that performed the ‘best’ at the scale of the seasonal range
(i.e., defined by the sr from the k-fold cross-validation for each individual caribou by
season (Boyce et al. 2002)). We used the scale of seasonal range because 1) this
87
is the scale most commonly used by management agencies, 2) all covariates can be
easily transferred to habitat maps, and 3) selection at larger spatial scales is typically
easier to detect (McClean et al. 1998; Apps et al. 2001); therefore, models at the
larger scale (i.e., without energetic cost) should enable easier classification of
resource selection strategies among individuals. The Wald’s statistic was used to
determine if the iβ differed from zero, which identified significant selection ( iβ > 0)
or avoidance ( iβ < 0) of a resource (Boyce and McDonald 1999; Manly et al. 2002);
we defined avoidance as negatively selecting a resource. Selection coefficients of
the ‘best’ model(s) that differed from zero were evaluated graphically for similarities
(i.e., value and sign of iβ ) among caribou within and between seasons. We used a
log-linear model, as in predation risk, to estimate RSFs for each individual caribou
by season. To facilitate comparisons among caribou, however, we scaled the RSFs
from 0-1 using the following equation:
minmax
mini10 RSFRSF
RSFRSFRSF−−
=−
where RSFi is the product of the log-linear model, and RSFmin and RSFmax are the
smallest and largest RSF values (Boyce and McDonald 1999). Values approaching
1.0 indicated a greater likelihood of selection of a resource by caribou, while values
nearing 0.0 indicated avoidance. RSF0-1 values were plotted as a function of use
data for continuous covariates (i.e., elevation, slope, and distance to areas of high
risk) using the ‘best’ model for each caribou by season while other covariates in the
model were held constant. We qualitatively compared iβ s different from zero
among caribou and pooled models by season for aspect and fragmentation.

88
Selection and avoidance of vegetation classes were examined graphically among
animals by counting the number of animals that showed significant selection or
avoidance of a vegetation class; avoidance included classes of vegetation with >30
available points and no use data (i.e., classes that were not included in resource
selection models due to concerns of complete separation). If selection or avoidance
of resources was similar among animals within a season, use and availability data
were pooled (Nielsen et al. 2002) and models were re-evaluated (i.e., most
parsimonious models identified, selected, validated, and averaged if necessary).
Pooled models were validated with the k-fold cross-validation (Boyce et al. 2002),
and covariates from the ‘best’ model(s) were compared graphically to individual
models by season; all variables, other than vegetation, were evaluated as outlined
above, while iβ s from the pooled model(s) for vegetation were compared with the
number of animals that showed significant selection or avoidance of a vegetation
class. Significance of all tests was assumed at α = 0.05, and Stata 7.0 was used for
all statistical procedures (Stata Corporation, College Station, TX, USA).
RESULTS
Reproductive condition of caribou, collar performance, and movement
Of the 25 animals captured and collared, 24 were adults; 22 of 24 adult
caribou were pregnant (91.7 ± 5.8%, x ± binomial SE). Eleven of the 25 GPS
collars on female caribou functioned as programmed from date of capture to 30 April
2002, but because >90% of the locations for one animal was east of the GBPA, we
used data for 10 individuals in our analyses; the 2 non-pregnant individuals were in

89
that sample. After screening the GPS data for quality of locations, 3,254 (552
fornon-pregnant animals) and 2,123 (452 for non-pregnant animals) data points
were analyzed for female caribou during winter and late winter, respectively. Fix
rates were high (91.3 ± 2.1%, x ± SE) with 7 collars acquiring fixes >92% of the
time and 3 collars >80%.
Movement rates were highly variable within and among individuals at all
temporal scales (i.e., day, week, and month). Pooled monthly movement rates and
variation in rates declined from approximately 100 m/hr in November to 40 m/hr in
April (Fig. 3.1).
Performance of predation-risk models
Most models for risk by wolf pack and season performed adequately (all sr >
0.70, all P < 0.024) in the k-fold cross-validation, with few exceptions (Appendix I:
Tables I.1, I.3, and I.4). Variation was high in the use of resources among packs.
Most packs selected for shrubs (all iβ > 0.821, all P ≤ 0.001) and/or
burned/disturbed habitats (all iβ > 0.605, all P ≤ 0.004), and avoided pine (all iβ <
-0.743, all P ≤ 0.027) and spruce stands (all iβ < -0.407, all P ≤ 0.031); trends in the
selection coefficients of the pooled models were similar (Appendix I: Tables I.2 and
I.5-I.10). There were no 2001 winter wolf data for packs in the west-central portion
of the GBPA, and, therefore, we pooled the wolf GPS data from all the packs to
estimate risk in this area.

90
Month
November December January February March April
Mov
emen
t rat
e (m
/hr)
0
20
40
60
80
100
120
140
Figure 3.1. Movement rates (m/hr, x ± SE) of 10 adult female caribou averaged within a month by individual and then averaged across individuals, during winter (November-February) and late winter (March-April) months in the Greater Besa Prophet area, northern British Columbia, 2001-2002.

91
Relative importance of covariates and scale
At the scale of seasonal movement, wolf risk and distance to areas of high
wolf risk contributed little information to the core model set as explanatory covariates
(all )( jw + < 0.059). Risk was not a parameter in any of the selected models (i.e.,
the most parsimonious) for any caribou in either season. Distance to areas of high
risk was important in one model for one animal (caribou 17, iw = 0.589), but the iβ s
for both the linear (P = 0.179) and squared (P = 0.503) terms of the quadratic were
not different from zero. At the scale of seasonal movement, cost of movement
(kJ/kg/hr) contributed the most information as an explanatory covariate in both
seasons for all (all )( jw + > 0.912) but one caribou (caribou 17 in late winter). Most
individuals strongly minimized the cost of locomotion in winter and late winter, with
non-pregnant animals showing a stronger avoidance of high-cost movements than
most pregnant animals (except caribou 10, Table. 3.1). In the late winter, our
models suggested that non-pregnant caribou continued to strongly minimize their
cost of movement, whereas the importance of minimizing the cost of locomotion
varied for pregnant animals (caribou 10 was the most sensitive to minimizing cost,
Table 3.1).
At the scale of seasonal range, the relative importance of wolf risk varied
among individuals, but generally contributed little information to the core model set
as an explanatory covariate during winter or late winter (all )( jw + ≤ 0.282, Table
3.2); risk was included in the final models for only 3 animals in both seasons (Tables
3.3, 3.4). Conversely, distance to areas of high wolf risk was more important, with

92
Table 3.1. Coefficients of selection ( iβ ) relating to the energetic cost of movement (kJ/kg/hr) in the final resource selection models at the scale of seasonal movement for 10 adult female caribou during winter (November-February) and late winter (March-April) seasons in the Greater Besa Prophet area, northern British Columbia, 2001-2002. Animals 22 and 25 were not pregnant, as defined by serum progesterone assays.
Caribou Winter Late Winter
iβ ± SE iβ ± SE
2 -0.544 ± 0.092**† -0.918 ± 0.428*†
6 -0.691 ± 0.169**† -1.524 ± 0.710*
10 -1.203 ± 0.235** -2.133 ± 0.366**†
11 -0.523 ± 0.141** -0.459 ± 0.155*
16 -0.523 ± 0.128** -1.091 ± 0.306**
17 -0.392 ± 0.091**
20 -0.513 ± 0.156* -0.849 ± 0.228**
22 -0.857 ± 0.282* -1.921 ± 0.441**
23 -0.677 ± 0.365 -1.124 ± 0.406**†
25 -1.410 ± 0.291** -1.687 ± 0.393**†
*P < 0.050
**P < 0.001
†iβ is from an averaged model
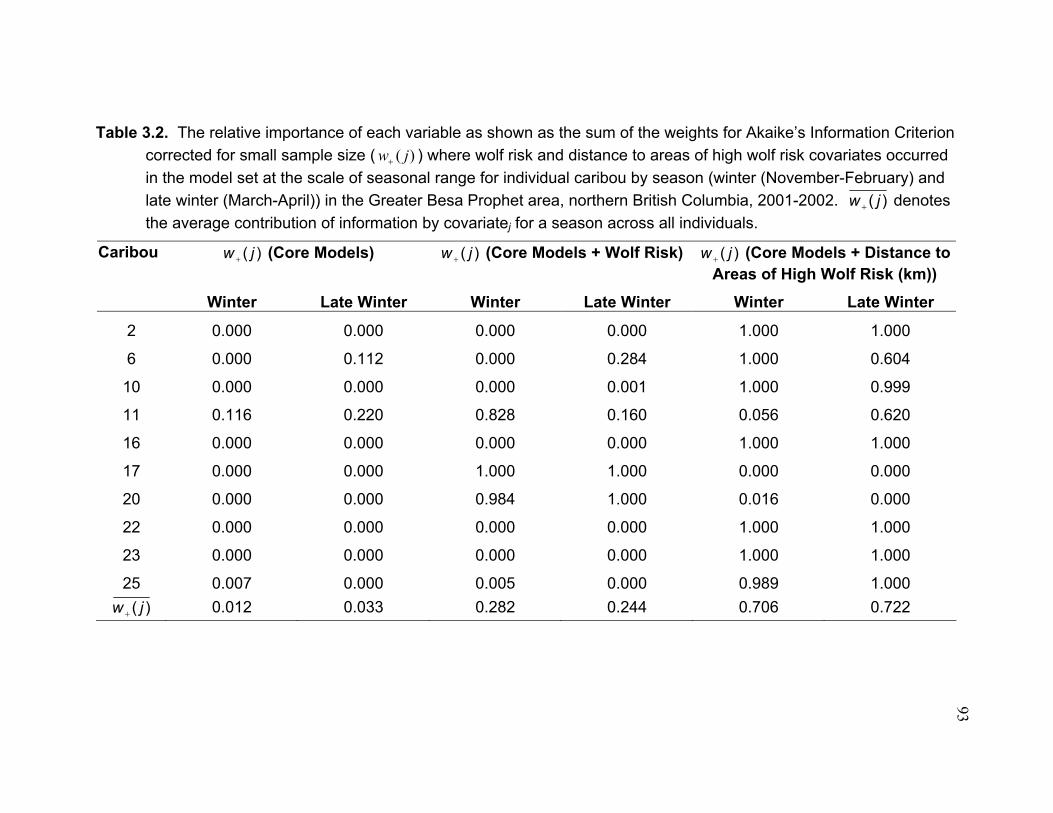
93
Table 3.2. The relative importance of each variable as shown as the sum of the weights for Akaike’s Information Criterion corrected for small sample size ( )( jw+ ) where wolf risk and distance to areas of high wolf risk covariates occurred in the model set at the scale of seasonal range for individual caribou by season (winter (November-February) and late winter (March-April)) in the Greater Besa Prophet area, northern British Columbia, 2001-2002. )( jw + denotes the average contribution of information by covariatej for a season across all individuals.
Caribou )( jw + (Core Models) )( jw + (Core Models + Wolf Risk) )( jw + (Core Models + Distance to Areas of High Wolf Risk (km))
Winter Late Winter Winter Late Winter Winter Late Winter
2 0.000 0.000 0.000 0.000 1.000 1.000
6 0.000 0.112 0.000 0.284 1.000 0.604
10 0.000 0.000 0.000 0.001 1.000 0.999
11 0.116 0.220 0.828 0.160 0.056 0.620
16 0.000 0.000 0.000 0.000 1.000 1.000
17 0.000 0.000 1.000 1.000 0.000 0.000
20 0.000 0.000 0.984 1.000 0.016 0.000
22 0.000 0.000 0.000 0.000 1.000 1.000
23 0.000 0.000 0.000 0.000 1.000 1.000
25 0.007 0.000 0.005 0.000 0.989 1.000 )( jw + 0.012 0.033 0.282 0.244 0.706 0.722
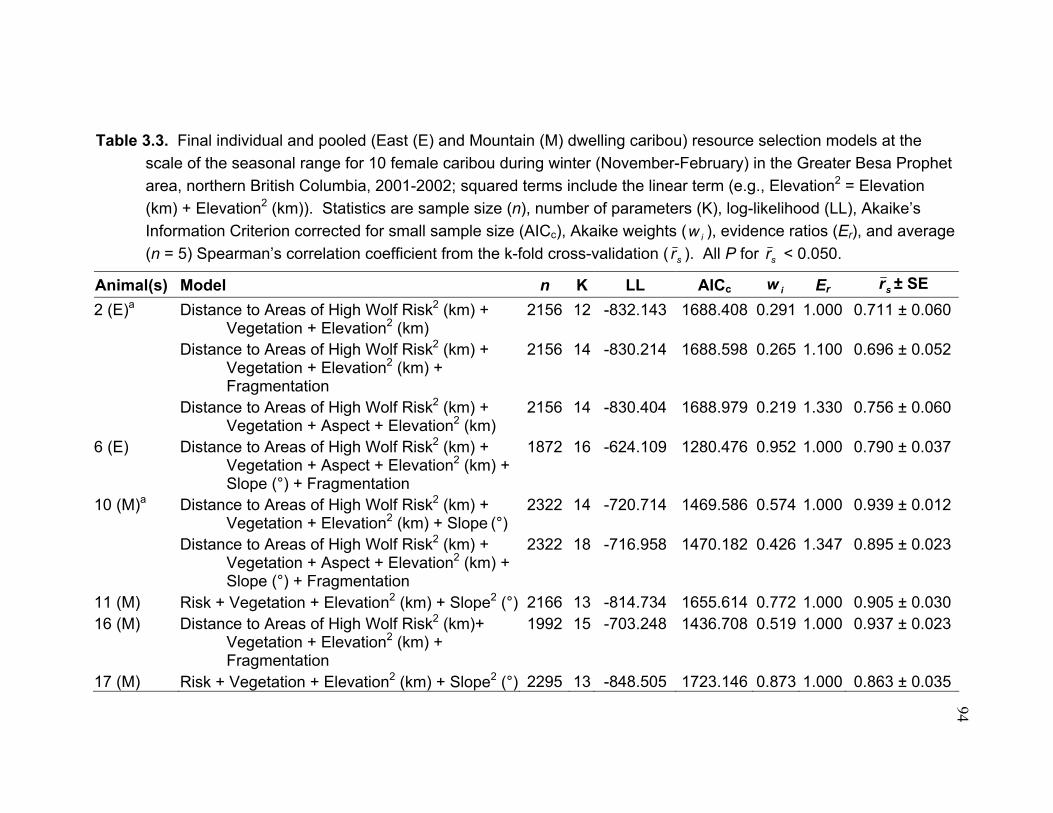
94
Table 3.3. Final individual and pooled (East (E) and Mountain (M) dwelling caribou) resource selection models at the scale of the seasonal range for 10 female caribou during winter (November-February) in the Greater Besa Prophet area, northern British Columbia, 2001-2002; squared terms include the linear term (e.g., Elevation2 = Elevation (km) + Elevation2 (km)). Statistics are sample size (n), number of parameters (K), log-likelihood (LL), Akaike’s Information Criterion corrected for small sample size (AICc), Akaike weights ( iw ), evidence ratios (Er), and average (n = 5) Spearman’s correlation coefficient from the k-fold cross-validation ( sr ). All P for sr < 0.050.
Animal(s) Model n K LL AICc iw Er sr ± SE 2 (E)a Distance to Areas of High Wolf Risk2 (km) +
Vegetation + Elevation2 (km) 2156 12 -832.143 1688.408 0.291 1.000 0.711 ± 0.060
Distance to Areas of High Wolf Risk2 (km) + Vegetation + Elevation2 (km) + Fragmentation
2156 14 -830.214 1688.598 0.265 1.100 0.696 ± 0.052
Distance to Areas of High Wolf Risk2 (km) + Vegetation + Aspect + Elevation2 (km)
2156 14 -830.404 1688.979 0.219 1.330 0.756 ± 0.060
6 (E) Distance to Areas of High Wolf Risk2 (km) + Vegetation + Aspect + Elevation2 (km) + Slope (°) + Fragmentation
1872 16 -624.109 1280.476 0.952 1.000 0.790 ± 0.037
10 (M)a Distance to Areas of High Wolf Risk2 (km) + Vegetation + Elevation2 (km) + Slope (°)
2322 14 -720.714 1469.586 0.574 1.000 0.939 ± 0.012
Distance to Areas of High Wolf Risk2 (km) + Vegetation + Aspect + Elevation2 (km) + Slope (°) + Fragmentation
2322 18 -716.958 1470.182 0.426 1.347 0.895 ± 0.023
11 (M) Risk + Vegetation + Elevation2 (km) + Slope2 (°) 2166 13 -814.734 1655.614 0.772 1.000 0.905 ± 0.03016 (M) Distance to Areas of High Wolf Risk2 (km)+
Vegetation + Elevation2 (km) + Fragmentation
1992 15 -703.248 1436.708 0.519 1.000 0.937 ± 0.023
17 (M) Risk + Vegetation + Elevation2 (km) + Slope2 (°) 2295 13 -848.505 1723.146 0.873 1.000 0.863 ± 0.035

95
Table 3.3. Continued. Animal(s) Model n K LL AICc iw Er sr ± SE 20 (M) Risk + Vegetation + Aspect + Elevation2 (km)
+ Slope (°) + Fragmentation 1686 18 -638.172 1312.711 0.948 1.000 0.908 ± 0.017
22 (M) Distance to Areas of High Wolf Risk2 (km)+ Vegetation + Aspect + Elevation2 (km) + Slope (°) + Fragmentation
1227 17 -466.876 968.201 0.907 1.000 0.781 ± 0.050
23 (M)a Distance to Areas of High Wolf Risk2 (km)+ Vegetation + Aspect + Elevation2 (km)
1470 13 -472.176 970.566 0.386 1.000 0.800 ± 0.049
Distance to Areas of High Wolf Risk2 (km)+ Vegetation + Aspect + Elevation2 (km) + Slope (°) + Fragmentation
1470 17 -468.727 971.829 0.205 1.880 0.772 ± 0.050
25 (M) Distance to Areas of High Wolf Risk2 (km)+ Vegetation + Aspect + Elevation2 (km) + Slope2 (°) + Fragmentation
1569 17 -526.407 1087.165 0.912 1.000 0.890 ± 0.035
East a Distance to Areas of High Wolf Risk2 (km) + Vegetation + Elevation2 (km) + Fragmentation
4071 14 -1536.44 3100.979 0.289 1.000 0.840 ± 0.020
Distance to Areas of High Wolf Risk2 (km) + Vegetation + Elevation2 (km)
4071 12 -1538.56 3101.192 0.260 1.112 0.840 ± 0.050
Mountain Distance to Areas of High Wolf Risk2 (km) + Vegetation + Aspect + Elevation2 (km) + Slope (°) + Fragmentation
15384 18 -6108.040 12252.120 0.505 1.000 0.980 ± 0.010
aThese models were averaged within an individual or pooled model as in Burnham and Anderson (2002:150, 162).

96
Table 3.4. Final individual and pooled (East (E) and Mountain (M) dwelling caribou) resource selection models at the scale of the seasonal range for 10 female caribou during late winter (March-April) in the Greater Besa Prophet area, northern British Columbia, 2001-2002; squared terms include the linear term (e.g., Elevation2 = Elevation (km) + Elevation2 (km)). Statistics are sample size (n), number of parameters (K), log-likelihood (LL), Akaike’s Information Criterion corrected for small sample size (AICc), Akaike weights ( iw ), evidence ratios (Er), and average (n = 5) Spearman’s correlation coefficient from the k-fold cross-validation ( sr ). All P for sr < 0.050.
Animal(s) Model n K LL AICc iw Er sr ± SE 2 (E) Distance to Areas of High Wolf Risk2 (km)+
Vegetation + Aspect + Elevation2 (km) + Slope (°) + Fragmentation
1272 14 -421.591 871.471 0.631 1.000 0.726 ± 0.051
6 (E)a Distance to Areas of High Wolf Risk2 (km)+ Vegetation + Elevation2 (km) + Fragmentation
1092 10 -463.276 946.719 0.322 1.000 0.734 ± 0.030
Risk + Vegetation + Elevation2 (km) + Fragmentation
1092 9 -464.946 948.025 0.168 1.921 0.765 ± 0.061
10 (M) Distance to Areas of High Wolf Risk2 (km)+ Vegetation + Aspect + Elevation2 (km) + Slope (°) + Fragmentation
1368 17 -406.006 846.415 0.798 1.000 0.688 ± 0.067
11 (M) Distance to Areas of High Wolf Risk2 (km)+ Vegetation + Aspect + Elevation2 (km) + Slope (°) + Fragmentation
1395 18 -395.458 827.360 0.482 1.000 0.823 ± 0.044
16 (M) Distance to Areas of High Wolf Risk2 (km)+ Vegetation + Aspect + Elevation2 (km) + Slope (°) + Fragmentation
1260 18 -434.685 905.863 0.936 1.000 0.703 ± 0.030
17 (M) Risk + Vegetation + Aspect + Elevation2 (km) + Slope2 (°) + Fragmentation
1293 13 -460.648 947.541 1.000 1.000 n/ab
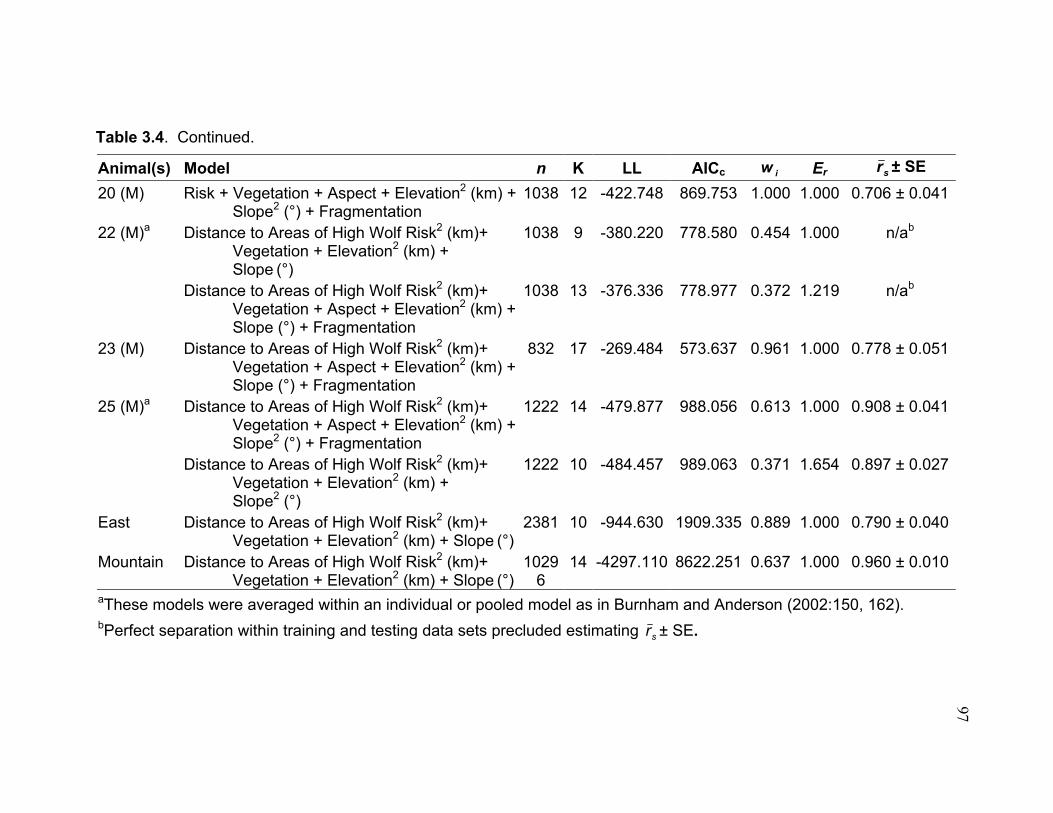
97
Table 3.4. Continued.
Animal(s) Model n K LL AICc iw Er sr ± SE 20 (M) Risk + Vegetation + Aspect + Elevation2 (km) +
Slope2 (°) + Fragmentation 1038 12 -422.748 869.753 1.000 1.000 0.706 ± 0.041
22 (M)a Distance to Areas of High Wolf Risk2 (km)+ Vegetation + Elevation2 (km) + Slope (°)
1038 9 -380.220 778.580 0.454 1.000 n/ab
Distance to Areas of High Wolf Risk2 (km)+ Vegetation + Aspect + Elevation2 (km) + Slope (°) + Fragmentation
1038 13 -376.336 778.977 0.372 1.219 n/ab
23 (M) Distance to Areas of High Wolf Risk2 (km)+ Vegetation + Aspect + Elevation2 (km) + Slope (°) + Fragmentation
832 17 -269.484 573.637 0.961 1.000 0.778 ± 0.051
25 (M)a Distance to Areas of High Wolf Risk2 (km)+ Vegetation + Aspect + Elevation2 (km) + Slope2 (°) + Fragmentation
1222 14 -479.877 988.056 0.613 1.000 0.908 ± 0.041
Distance to Areas of High Wolf Risk2 (km)+ Vegetation + Elevation2 (km) + Slope2 (°)
1222 10 -484.457 989.063 0.371 1.654 0.897 ± 0.027
East Distance to Areas of High Wolf Risk2 (km)+ Vegetation + Elevation2 (km) + Slope (°)
2381 10 -944.630 1909.335 0.889 1.000 0.790 ± 0.040
Mountain Distance to Areas of High Wolf Risk2 (km)+ Vegetation + Elevation2 (km) + Slope (°)
10296
14 -4297.110 8622.251 0.637 1.000 0.960 ± 0.010
aThese models were averaged within an individual or pooled model as in Burnham and Anderson (2002:150, 162). bPerfect separation within training and testing data sets precluded estimating sr ± SE.

98
few exceptions, in models for most caribou in both seasons (all )( jw + ≥ 0.706, Table
3.2). Distance to areas of high risk was a covariate in the final models for 7 and 8 of
the 10 animals in winter and late winter, respectively (Tables 3.3, 3.4).
Effect of scale on the components of risk in resource selection
Wolf risk marginally improved the core models in winter and late winter (all i∆
> -1.574) at the scale of seasonal movement, but increased the AICc for 6 animals in
each season (Table 3.5). At the scale of seasonal range, risk (with few exceptions)
generally improved the core models in winter ( i∆ = -38.687) and late winter ( i∆ =
-3.783), but also increased AICc for 5 animals in late winter (Table 3.5). Distance to
areas of high wolf risk generally improved the ‘best’ core model for each caribou and
season at the scale of seasonal movement (all i∆ < -2.935), but may have provided
redundant information (higher AICc) for 3 animals in late winter (Table 3.5). At the
scale of seasonal range, the distance covariate, with few exceptions, improved the
core models in winter ( i∆ = -54.424) and late winter ( i∆ = -17.301), but again
marginally increased AICc for one animal in winter and 2 in late winter (Table 3.5).
Availability data for the components of risk (i.e., wolf risk and the distance to
areas of high risk) varied with the definition of scale. In both seasons, the
distribution of available points for wolf risk at the scale of seasonal movement was
shifted to the left (i.e., consistently lower in risk) of available points in the seasonal
range; conversely, the distribution of available points for the distance to areas of
high wolf risk was shifted to the right (i.e., farther from areas of high risk) (Fig. 3.2).
Available points for 7 of the 10 caribou at the seasonal movement scale were lower

99
Table 3.5. Change in the Akaike’s Information Criterion corrected for small sample size ( i∆ ) when wolf risk and distance to areas of high wolf risk were added to the most parsimonious core model for individual caribou by season (winter (November-February) and late winter (March-April)) and scale (seasonal movement and seasonal range) in the Greater Besa Prophet area, northern British Columbia, 2001-2002. i∆ denotes the average contribution of information by a covariate for a season across all individuals.
Season Caribou i∆ (Core Models + Wolf Risk) i∆ (Core Models + Distance to Areas of High Wolf Risk (km))
Seasonal Movement Seasonal Range Seasonal Movement Seasonal Range Winter 2 1.553 -69.052 -8.558 -48.073
6 -2.358 -3.510 -13.091 -121.435 10 -11.347 -25.091 -24.010 -32.439 11 -0.744 -3.594 -1.714 1.422 16 1.923 -32.329 -8.639 -115.103 17 4.641 -2.346 -2.506 -9.000 20 0.729 -72.601 -3.842 -18.166 22 0.749 -122.963 -5.406 -98.040 23 1.740 -23.851 -7.101 -93.582 25 -0.575 -31.535 -0.693 -9.823 i∆ -0.369 -38.687 -7.556 -54.424

100
Table 3.5. Continued.
Season Caribou i∆ (Core Models + Wolf Risk) i∆ (Core Models + Distance to Areas of High Wolf Risk (km))
Seasonal Movement Seasonal Range Seasonal Movement Seasonal Range Late Winter 2 0.126 0.901 -10.192 -14.473
6 -3.079 -1.812 1.477 -71.670 10 -5.572 -11.667 -3.257 -8.077 11 0.063 0.732 -12.849 -3.880 16 1.903 3.391 -4.301 -21.433 17 0.969 0.699 -1.540 -32.995 20 -7.112 -4.090 -0.037 -10.024 22 1.814 -27.296 1.776 1.167 23 0.830 -0.513 1.013 -9.627 25 -5.687 1.825 -1.444 0.699 i∆ -1.574 -3.783 -2.935 -17.031
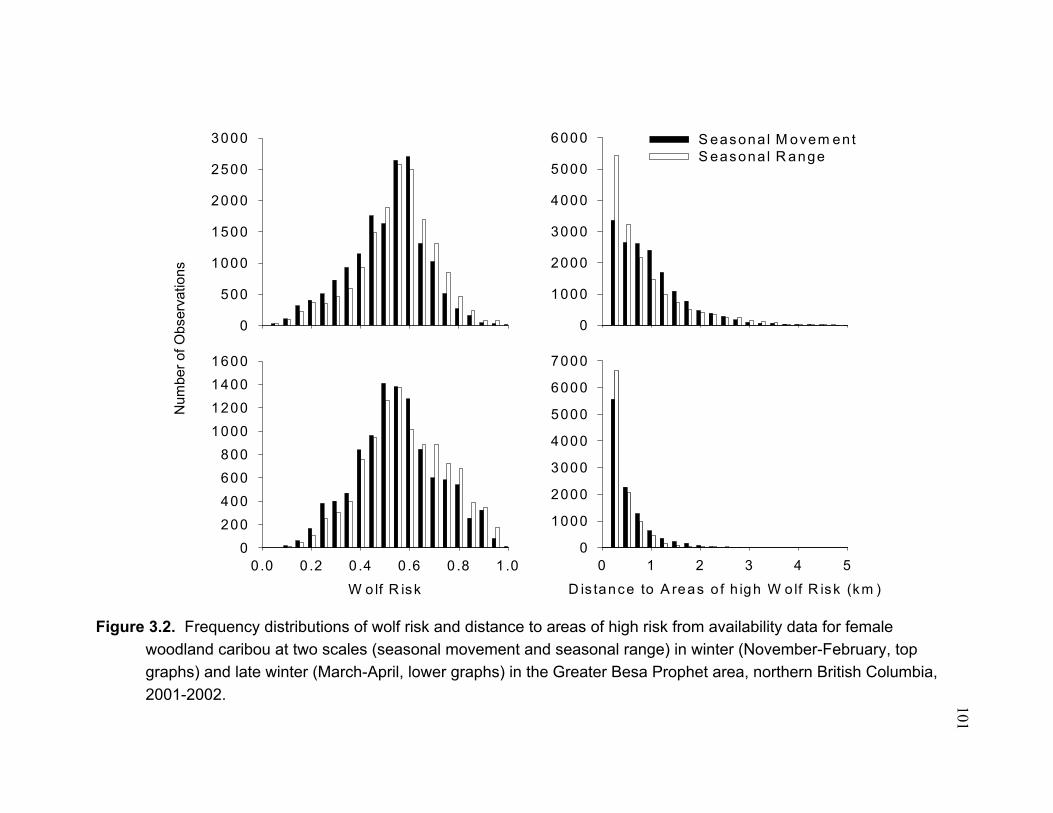
101
D is tance to A reas o f h igh W olf R isk (km )
0 1 2 3 4 50
1000
2000
3000
4000
5000
6000
7000
0
500
1000
1500
2000
2500
3000 S easona l M ovem entS easona l R ange
W olf R isk
0 .0 0 .2 0 .4 0 .6 0 .8 1 .0
Num
ber o
f Obs
erva
tions
0200400600800
1000120014001600
0
1000
2000
3000
4000
5000
6000
Figure 3.2. Frequency distributions of wolf risk and distance to areas of high risk from availability data for female woodland caribou at two scales (seasonal movement and seasonal range) in winter (November-February, top graphs) and late winter (March-April, lower graphs) in the Greater Besa Prophet area, northern British Columbia, 2001-2002.

102
in risk than the scale of seasonal range in both the winter and late winter seasons
(all P < 0.026). In winter, risk did not differ between scales for 2 animals (all P <
0.103), and was higher at the scale of seasonal movement for caribou 22 (all P <
0.001); during late winter, risk did not differ between scales for 3 animals (all P >
0.075). Relative to the distance to high-risk areas, available points at the scale of
seasonal movement were farther away than at the scale of seasonal range for 7 and
5 caribou in the winter (all P < 0.002) and late winter (all P < 0.001) seasons,
respectively. In both seasons, the distance to areas of high risk did not differ for 2
caribou (all P > 0.122), while during winter, the available points for caribou 16 were
closer (P = 0.001) at the scale of seasonal movement than the scale of seasonal
range. In the late winter, the available points for 3 caribou were closer at the scale
of seasonal movement than at the scale of seasonal range (all P < 0.040).
Variation in the selection of resources among caribou
Variation was high among individuals in the selection for topographic
variables and components of risk at the scale of seasonal range (Fig. 3.3). We
noted similar patterns in the selection of elevations (i.e., the direction of the
quadratic form as determined by the signs (+ or -) of the squared and linear terms)
and, to a lesser extent, slopes (Tables 3.3, 3.4); therefore, we pooled use and
available data into 2 groups (animals that resided in the eastern (East, n = 2) and
mountainous portions (Mountain, n = 8) of the GBPA). There also were some
consistencies in selection of vegetation classes among all caribou. In winter, all
individual models could be validated with the k-fold cross-validation with an average

103
Figure 3.3. Relative likelihood of female caribou selecting elevations (a, b), slopes (c, d), and distances to areas of high
risk (e, f) during winter (November-February) and late winter (March-April) assuming other covariates are constant in the final resource selection models for individual caribou (light shading) and pooled models (heavy shading) for animals living in the East ( ) and Mountain ( ) regions of the Greater Besa Prophet area, northern British Columbia, 2001-2002. Resource selection functions were scaled 0-1 (RSF0-1) as in Boyce and McDonald (1999) to evaluate selection of resources among individuals and pooled models. Slope was not included in the final pooled East model in the winter (c); points are data from GPS locations.
0.0
0.2
0.4
0.6
0.8
1.0
RSF
0-1
Distance to Areas of High Wolf Risk (km)
0.0 1.0 2.0 3.0 4.0 5.0
Elevation (km)
0.6 0.8 1.0 1.2 1.4 1.6 1.8 2.0 2.2 2.40.0
0.2
0.4
0.6
0.8
1.0
Slope (0)
0.0 10.0 20.0 30.0 40.0 50.0 60.0
a
b
c
d
e
f
Winter
Late Winter

104
sr of 0.832 ± 0.026 (± SE) across individuals; pooled models also performed well
(East, P = 0.002; Mountain, P < 0.001, average sr = 0.887 ± 0.047). In late winter,
individual models had an average sr of 0.773 ± 0.025 and pooled models (East, P =
0.007; Mountain, P < 0.001) an average of 0.875 ± 0.085 (Table 3.4).
Elevation
Elevation was an important parameter in the selection models for all individual
caribou in both seasons (Tables 3.3, 3.4). In winter, both the linear and squared
terms of the quadratic were significantly different from zero (all P < 0.008) for every
model; in late winter, either one or both terms of the quadratic (all P < 0.004) were
significant for 7 caribou. During winter, both caribou that resided in the east showed
low variation in the selection of elevations and the iβ s of elevation in the East model
were similar to individual models (Fig. 3.3a). Conversely, in both seasons mountain-
dwelling individuals showed high variation in the selection of elevation with some
individuals choosing moderate (n = 3, 1,200-1,400 m) to high elevations (n = 2,
1,400-1,600 m and 1,500-1,800 m); the Mountain model collapsed all of this
variation into selection for elevations ranging from approximately 1,400-1,750 m
(Fig. 3.3a). In late winter, using the East model, caribou showed selection for
elevations >1,200 m, but only one caribou had iβ s different from zero (Fig. 3.3b).
Slope
Slope helped define habitat selection for 8 and 9 caribou in winter and late
winter, respectively (Tables 3.3, 3.4). In the winter, however, slope was only

105
significant for 4 animals (all P < 0.038), whereas in late winter, slope was a stronger
factor in the selection of resources ( iβ ≠ 0 for 8 caribou; all P < 0.029). During
winter, slope did not enter the East model for 2 individuals because one caribou
showed a decreasing linear avoidance of steeper slopes and slope did not enter the
final model for the other caribou (Fig. 3.3c). Individuals in the mountains also
showed a similar response to steep slopes (also reflected in the Mountain model),
although one individual selected for slopes between approximately 10-25° (Fig.
3.3c). In late winter, selection for slopes by caribou fit the Gaussian function (i.e.,
selected for middle slopes from what was available), with one exception. That
individual, from the east, selected for slopes >30°, and the East model displayed a
similar trend (Fig. 3.3d). Caribou in the mountains showed selection for gentle to
steep slopes, but avoided flat (<5°) and steep areas (>40°), with high variation
among individuals (Fig. 3.3d). The Mountain model indicated selection for slopes
from approximately 5-30° (Fig. 3.3d).
Aspect
Aspect was important in selection models by 6 and 7 caribou in winter and
late winter, respectively (Tables 3.3, 3.4). The selection coefficient was significant,
however, only for 2 animals (all P < 0.004) in winter, and 3 caribou in late winter (all
P < 0.014). In both seasons, caribou 6 selected for north and westerly aspects and
caribou 20 selected for north and eastern aspects. In late winter, another animal
(caribou 16) selected for eastern exposures. Aspect entered the Mountain model
only in winter, but northness and eastness did not differ from zero (all P > 0.097).
106
Vegetation
Vegetation was an important parameter in habitat selection by all caribou in
both seasons (Tables 3.3, 3.4). Selection coefficients were significant for at least
one vegetation class for all (all P < 0.046) but 2 individuals in late winter (caribou 2
and 22, all P > 0.134). In the winter, caribou generally selected riparian spruce (all
iβ > 0.859, all P < 0.001) and spruce (all iβ > 0.488, all P < 0.006) classes and
avoided the shrub (n = 5, all iβ > 0.697, all P < 0.033) and subalpine shrub (n = 3,
all iβ > 0.832, all P < 0.001) classes; one animal, however, did avoid spruce ( iβ =
-0.795 ± 0.184, iβ ± SE, P < 0.001) (Fig. 3.4). In the east, both caribou showed
strong selection for Carex spp. (all iβ > 0.924, all P < 0.004); in the mountains, 4
caribou strongly avoided burned/disturbed areas (all iβ > -1.232, all P < 0.001) and
3 caribou selected alpine areas (all iβ > 0.979, all P < 0.001) (Fig. 3.4). The
selection coefficients for vegetation classes in the East and Mountain models
generally tracked the number of individual animals that selected or avoided these
vegetation classes (Fig. 3.4). The East model showed selection for the Carex spp.
class (P < 0.001) and avoidance of the non-vegetated and alpine areas (all P <
0.040). The Mountain model showed strong selection for Carex spp. (P < 0.001)
and avoidance of subalpine shrub areas (P < 0.001) (Fig. 3.4). During late winter,
trends were less similar in the selection of vegetation among individuals. One
caribou in the east showed significant selection for shrub areas ( iβ = 0.506, P =
0.040). In the mountains, some caribou selected for spruce (n = 4, all iβ > 0.712, all
P < 0.004), some animals strongly selected against pine (n = 2, all iβ < -1.192, all P

107
Figure 3.4. Number of GPS-collared caribou that selected or avoided a vegetation class (left axes) and the strength of significant (P < 0.050) coefficients of selection for the pooled models of animals living in the eastern (East, n = 2) and mountainous (Mountain, n = 8) portions of the Greater Besa Prophet area during winter (November-February ) and late winter (March-April), in northern British Columbia, 2001-2002.
Vegetation Classes
Sele
ctio
n C
oeffi
cien
ts (
) fo
r Poo
led
Mod
els
-2.5
-2.0
-1.5
-1.0
-0.5
0.0
0.5
1.0
1.5
2.0
2.5
Carex spp.
Riparian Spruce
SprucePine
Shrubs
Subalpine Shrubs
Burned/Disturbed
Non-vegetatedAlpine
-2.5
-2.0
-1.5
-1.0
-0.5
0.0
0.5
1.0
1.5
2.0
2.5
8
6
4
2
0
2
4
6
8
8
6
4
2
0
2
4
6
8
(+)
(-)
(+)
(-)
Num
ber o
f Car
ibou
that
Sho
wed
Sel
ectio
n (+
) or A
void
ance
(-)
of a
Veg
etat
ion
Cla
ss
Carex spp.
Number of Caribou
Coefficients for Mountain ModelCoefficients for East Model
Winter
Late Winter

108
< 0.001) and some selected for non-vegetated habitats (n = 2, all iβ > 0.651, all P <
0.024); for half of the mountain dwelling caribou (n = 4), animals strongly avoided the
burned/disturbed class (all iβ < -1.192, all P < 0.001) (Fig. 3.4). The East model
showed selection for the shrub class (P < 0.001) and a very strong avoidance of pine
(P < 0.004); the Mountain model showed selection for the non-vegetated and alpine
areas with strong avoidance of the burned and disturbed class (all P < 0.001) (Fig.
3.4).
Fragmentation of Vegetation
Fragmentation helped define resource selection by 8 and 10 of the 10 caribou
in the winter and late winter seasons, respectively (Tables 3.3, 3.4). At least one
category of fragmentation was significantly selected for by 5 animals in winter (all P
< 0.024) and 6 caribou in late winter (all P < 0.043). During the winter, one caribou
in the east avoided low fragmented habitats (-0.458 ± 0.154, iβ ± SE, P = 0.003)
and selected for highly fragmented areas (0.253 ± 0.112, P = 0.024), and although
fragmentation entered the model for the other caribou and the East model, the iβ s
did not differ from zero (all P > 0.150). Caribou in the mountains generally selected
for areas with low fragmentation (n = 3, all iβ > 0.255, all P < 0.016) and avoided
highly fragmented areas (n = 3, all iβ < -0.231, all P < 0.020), with one exception
(caribou 20) that selected against low fragmentation (-0.295 ± 0.126, P = 0.020). In
the Mountain model, caribou avoided areas of high fragmentation (-0.074 ± 0.032, P
= 0.022). In late winter, a caribou in the east avoided areas with low fragmentation
(-0.468 ± 0.149, P = 0.002); iβ s for fragmentation were not different from zero for

109
the other caribou in the east, and subsequently, fragmentation did not enter the East
model. For animals in the mountains, response to the fragmentation covariate in
late winter was varied. Two caribou avoided areas low in fragmentation ( iβ <
-0.473, all P < 0.015) and selected highly fragmented areas (all iβ > 0.530, all P <
0.002), while 2 other caribou avoided highly fragmented areas (all iβ < -0.467, all P
< 0.004) and selected for areas low in fragmentation (all iβ > 0.984, all P < 0.001);
fragmentation did not enter the Mountain model.
Components of the Risk of Predation
Risk was not a significant parameter in the final individual or pooled models
for caribou that lived in the eastern portion of the study area during winter. In the
mountains, responses to risk were variable for individuals with risk as a covariate in
their final models (Table 3.2). In winter, caribou 11 minimized risk (-0.201 ± 0.092,
iβ ± SE, P = 0.028) whereas caribou 17 ( iβ = 0.660 ± 0.100, P < 0.001) and 20
( iβ = 0.341 ± 0.080, P < 0.001) were at a higher risk in their selection of resources;
consequently, the risk parameter was not important in the Mountain model. In late
winter, the risk iβ for the averaged model for caribou 6 in the east was not different
from zero (P = 0.656); risk did not enter the pooled East model. In the mountains,
caribou 17 continued to select resources at a high risk ( iβ = 0.794 ± 0.158, P <
0.001), whereas caribou 20 was at a lower risk ( iβ = -0.721 ± 0.139, P < 0.001); risk
did not enter the Mountain model.
Specific responses to distance to high-risk areas varied among animals, but
110
generally followed a Gaussian function in both seasons, with 2 exceptions in late
winter (Fig. 3.3e, 3.3f). In the winter, one caribou in the east selected for distances
approximately 1.25-3.00 km away from high-risk areas; the East model showed
selection for distances from 0.50-2.25 km (Fig. 3.3e). Mountain-dwelling animals
showed selection for a range of distances from areas of high risk (e.g., 0.25-1.25
km, 1.00-1.50 km) with caribou showing initial avoidance of distances <0.40 km from
areas of high risk and strong selection for distances >0.75 km, and another
individual showing similar selection, but in an almost linear fashion, for distances
>0.75 km (Fig. 3.3e). The Mountain model indicated selection for distances of
approximately 0.50-1.50 km from high wolf risk (Fig. 3.3e). In late winter, the East
and Mountain models also both indicated selection for distances approximately 0.50-
1.50 km from high risk (Fig. 3.3f). In the east, one caribou selected for distances
from approximately 1.00-1.75 km. In the mountains, 2 caribou selected for distances
approximately 1.00-1.75 km from areas of high risk, and 2 individuals showed
selection for increasing the distance to areas of high risk (caribou 10, 2.121 ± 0.354,
iβ ± SE, P < 0.001; caribou 16, 1.742 ± 0.292, P < 0.001) (Fig. 3.3f).
DISCUSSION
Our interpretation of habitat selection and the relative importance of different
factors contributing to resource selection by female caribou was scale-dependant
(Wiens 1989) and complicated by high variation in selection among individuals
(Aebischer et al. 1993; Garshelis 2000). Although this individual variation may pose
technical difficulties in modelling resource selection, identifying variation is an

111
important step in interpreting these data biologically (Aebischer et al. 1993; Nielsen
et al. 2002). Use of resources by western woodland caribou populations typically
varies among regions (Cichowski 1993; Wood 1996; Johnson 2000; Poole et al.
2000) and this may be due, in part, to differential availability of resources (Garshelis
2000) and/or distributions of predators among regions (e.g., elevation gradients and
slopes, and/or human activities that may have shaped vegetative patterns and
distributions of other ungulates and wolves (Seip 1998)). Therefore, in a highly
diverse area such as the Greater Besa Prophet in northern British Columbia, high
variation among individuals should be expected.
Relative importance of risk, energetic costs of movement, and scale
Caribou generally did not respond to the components of risk at the scale of
seasonal movement. Risk was not a significant parameter for any individual, and
the distance to areas of high wolf risk was important only for one animal (and the
selection coefficients in that model did not differ from zero). Conversely, all
individuals except one in both seasons strongly minimized the energetic costs of
movement (Table 3.1). Minimizing the costs of movement was identified previously
as the most important parameter in selection models for adult female caribou during
inter-patch movements at several temporal scales in winter (Johnson 2000). In our
study, non-pregnant individuals appeared to be more sensitive to minimizing costs in
winter and possibly late winter than the pregnant animals, although our sample size
was low for non-pregnant animals (n = 2). The one animal (caribou 10) that
minimized the cost of movement more than the 2 non-pregnant individuals was killed

112
by a grizzly bear (Ursus arctos) on 7 May 2002. Data from ultrasound
measurements of back fat from animals in the GBPA (Appendix H) and from
Dauphiné (1976) show that non-pregnant caribou have less fat than pregnant
individuals in winter. High mobility has high energetic costs associated with snow
depth (Parker et al. 1984; Fancy and White 1987). Females in poorer condition
might attempt to minimize energetic costs earlier in winter than animals with higher
fat reserves, but, in doing so, may be unable to capitalize on food resources
distributed over large areas (Barrett 1982). An increased sensitivity to minimizing
energetic costs of movement and the trend towards reduced movement rates in late
winter (Fig. 3.1) may be in response to changes in snow depth (Stuart-Smith et al.
1997), low or declining body condition (Dauphiné 1976), and/or reduced movement
rates of wolves (B. Milakovic, University of Northern British Columbia, unpublished
data). Our measure of the energetic costs of movement is conservative because we
did not incorporate snow depths and steepness of slopes in the equations for cost.
In rare cases when animal movements were beyond the 95th percentile movement,
the random distances ‘chosen’ for available points would be relatively short, and
therefore provide lower estimates of energetic costs. Therefore, given that we likely
underestimated costs, the actual importance of minimizing energetic costs of
movement in selection of resources by female woodland caribou in winter and late
winter is even higher.
At the scale of seasonal range, spacing out from areas of high risk was an
important parameter for female woodland caribou in both seasons. With few
exceptions, the distance to high-risk areas contributed substantial information to final

113
resource-selection models. Risk per se provided little additional information to the
core model set in winter, although its importance increased in late winter. These
data support the importance of increasing the distance to high-risk areas at larger
scales (Bergerud 1992; Seip 1992; Cumming et al. 1996; James 1999; Rettie and
Messier 2000). The impracticality of defining the energetic costs of movement at
such a larger scale precludes a conclusion on which parameter was more important.
Because the spatial scale of availability had a prominent effect on the
importance of the components of risk in the selection of resources by female
caribou, it should be considered when evaluating any inferences from RSFs
(McClean et al. 1998). Caribou made selection ‘decisions’ in a hierarchical fashion
(Johnson 1980; Johnson et al. 2001), with increased sensitivity to components of
risk at the larger scale (Bergerud 1996; Johnson 2000; Rettie and Messier 2000).
The distributions of availability data were sensitive to scale (Fig. 3.2), suggesting
that at the scale of seasonal movement, caribou had already ‘selected’ areas lower
in risk and farther from areas of high risk within the seasonal range (Bergerud and
Page 1987; Bergerud 1996; Rettie and Messier 2000). There were some
inconsistencies in attributes of availability between scales among individuals,
suggesting further individuals may respond variably to risk at different spatial scales.
Differential responses to risk could be due, in part, to body condition because
females in poorer condition may ‘take’ a higher risk in their wintering foraging
strategy to slow the depletion of body reserves throughout the winter (Lima 1988;
Skogland 1991; Clark 1994; Sweitzer 1996). A female with more body reserves
could ‘afford’ to have reduced intake in a relatively ‘safer’ area. Finer scale data on

114
body condition (e.g., change in body reserves throughout the winter months) and
predation risk are needed to evaluate the ‘asset protection’ hypothesis (Clark 1994).
Variation in the selection of resources among caribou
Specific comparisons to patterns in the selection of habitat factors by
woodland caribou in areas with less topographic relief east of the Rocky Mountains
(e.g., Gaspé Peninsula, Mosnier et al. 2003) and/or increased industrial disturbance
(e.g., northern Alberta, James and Stuart-Smith 2000) are difficult because of
dissimilarities in topography, vegetation, and/or land management activities that
have altered distributions of other ungulates and large carnivores. Historic industrial
activity in the eastern portion of the GBPA may have affected selection of habitats by
caribou but we assumed this would take the form of higher risk (i.e., distance to
linear features in risk models; James and Stuart-Smith 2000). Currently, the GBPA
is mostly free of industrial activity during winter, and therefore, distance to
anthropogenic edge was not included in selection models for caribou. We primarily
compared our results with the few studies that have examined both biotic and abiotic
factors in the selection of resources in the winter by the northern ecotype of
woodland caribou in British Columbia (Cichowski 1993; Johnson 2000; Poole et al.
2000; Wood 1996; Zimmerman et al. 2002).
Pooled models in our study had better predictive capacity, as defined by the
k-fold cross-validation, but collapsed possibly important biological variation in the
selection of resources among caribou. Generally, the East model offered a good
estimate of resource selection in both seasons, and this is probably due to the low

115
number of animals it represented (n = 2) as well as a less diverse landscape, both in
topography and vegetation, in the eastern portion of the GBPA. The Mountain
model, which pooled use/available data from 8 animals, collapsed the variation
within a season.
Elevation
Selection of elevations was more variable among individual caribou in areas
with greater topographic diversity (i.e., the mountains) for both seasons, as noted for
other cervids (Kie et al. 2002; Lingle 2002). In winter, caribou in the east exhibited
similar patterns in the selection of elevations, as this area has relatively little
topographical relief (approximately 700-1,100 m). It is difficult to comment on
variation between the 2 individuals in the east in late winter as the iβ s for elevation
were only different from zero for one animal. Selection for these lower elevations is
similar to some caribou in the Tweedsmuir-Entiako herd, as individuals in that herd
wintered in either lower (approx. 1,000 m) or upper (approx. 1,600 m) elevations
(Cichowski 1993). Alternatively, in the mountains, variation in selection of elevations
was lower in late winter than winter, and the range in elevations selected by
elevations was much greater in both seasons than individuals in the east. In both
seasons, the Mountain models collapsed this variation into a range of elevations that
was not common among animals (Fig. 3.3a, 3.3b). The large variation in elevational
range among individuals makes it difficult to compare with other herds, but estimates
from the Mountain model appear similar to caribou near Takla Lake (Poole et al.
2000) and to the Tweedsmuir-Entiako, Itcha-Ilgachuz, and Rainbow herds

116
(Cichowski 1993).
Slope
Caribou in the GBPA exhibited considerable variation in the selection of
slopes and the form of that selection (i.e., linear versus quadratic), which also may
be related to high topographic diversity (Kie et al. 2002; Lingle 2002). The East
model seemed to provide a representative estimate of selection in late winter when
slope was an important parameter (Fig. 3.4c). The Mountain model did not really
represent selection of slopes among individuals in either season, particularly in late
winter. In late winter, the Mountain model ‘stretched’ the quadratic over a range of
slopes (approximately 5-30°) that some animals clearly did not select, thereby
generalizing selection when some animals were being quite selective of slopes
within their home ranges (Fig. 3.4d). Selection of slopes from the Mountain model
were similar to the slopes used by caribou near Takla Lake (Poole et al. 2000).
Aspect and Fragmentation of Vegetation
The components of aspect and fragmentation were difficult to interpret,
because the selection coefficients in the final individual models often were not
different from zero, particularly for aspect. Variation in the responses to
fragmentation increased in late winter, making it difficult to generalize among
caribou. Individuals living in the mountains generally displayed the more typical
response to fragmentation of vegetation in the winter (i.e., selecting less fragmented
areas and/or avoiding areas with high fragmentation) (Seip 1998; Zimmerman et al.

117
2002); this may be in response to the risk of predation (Seip 1991) and/or
abundance or availability of winter forage in less fragmented vegetation types (e.g.,
large spruce stands) (Zimmerman et al. 2002).
Vegetation
There was less variation in the selection of vegetation types among caribou
than other parameters, and the pooled models appeared to adequately represent
selection among individuals. In winter, most caribou selected for sedge (Carex spp.)
meadows, and riparian spruce and spruce stands (Fig. 3.5a). Selection for these
vegetation types was similar to other research conducted on the northern ecotype of
woodland caribou (spruce, Poole et al. 2000; riparian spruce and Carex spp.,
Johnson 2000), suggesting that animals may have foraged on arboreal lichens
and/or sedges, although we conducted no feeding site investigations and did not
observe stands with abundant arboreal lichens in the GBPA. As noted in Johnson
(2000), sedges may be an important source of supplemental protein (Skoog 1968) to
lichen diets that are typically low in protein and high in digestible energy (Russell et
al. 1993). Using the pooled models, mountain-dwelling individuals, with one
exception, tended to avoid shrub, subalpine shrub, and burned/disturbed habitats
(Fig. 3.5a, 3.5b). Selection against the subalpine shrub and burned/disturbed
classes occurred in both seasons and against shrub areas in winter, which was likely
in response to the risk of predation, as these vegetation types were consistently
selected for by wolf packs in the GBPA. Avoidance of areas burned within 50 yrs
has been documented in Alaska (Joly et al. 2003) and Manitoba (Schaefer and Pruitt

118
1991). In the short term, burns appear to negatively effect population productivity
either directly (i.e., loss of forage, Seip 1990) or indirectly (e.g., increases in moose
populations and wolves, Bergerud and Elliot 1986; Seip 1991), but fires may benefit
caribou in the long term (>100 yrs) (Klein 1982).
In late winter, using the East model, animals strongly avoided the pine
vegetation class, which was in contrast to other research on selection of vegetation
types in winter for woodland caribou (Cichowski 1993; Wood 1996; Johnson 2000),
and showed strong selection for the shrub class. The strong avoidance of the pine
cover type may be explained partially by the lack of mature, lichen-producing pine
stands in the GBPA; selection for the shrub class likely put these animals at a higher
risk in the selection of resources (see above). In the Mountain model, some animals
showed selection for alpine and non-vegetated areas in the late winter, whereas
other animals avoided these areas. Animals that selected for these areas may have
benefited from terrestrial lichens in windswept areas (Cichowski 1993; Wood 1996)
and/or a lower risk of predation (Bergerud et al. 1984; Bergerud and Page 1987;
Seip 1991, 1992).
Components of Risk
Caribou were not sensitive to modelled risk, but rather animals responded to
distances to areas of high wolf risk (James 1999). There was high variation among
individuals in the distances that caribou ‘spaced away’ from areas of high risk, but
the form of the response was similar among most caribou. In both seasons animals
did not respond to this parameter in a linear fashion, but rather, most selection fit a

119
Gaussian function (Fig. 3.5e, 3.5f). Distances past a threshold (i.e., the Gaussian
function begins to approach zero) were not seen as ‘safer’. It is likely that these
responses were related to other components of habitat, such as feeding areas,
where animals could not disperse themselves far away from areas of high risk all the
time. The importance of ‘spacing out’ from areas of high wolf risk in resource
selection at the scale of seasonal range is consistent with other research on caribou
(Bergerud and Page 1987; Seip 1991; Bergerud 1992; James 1999; Rettie and
Messier 2000).
Interpreting resource selection between scales and among individuals
Modelling resource selection at one scale would have severely limited
interpretation of our selection models (Wiens 1989; Levin 1992). Our two definitions
of availability were within Johnson’s (1980) third order of selection, but still resulted
in different interpretations of responses by caribou to biological (i.e., energetic cost
of movement) and ecological factors (e.g., the risk of predation). For example,
examination of selection at the scale of seasonal movement would have suggested
that components of risk were unimportant to female woodland caribou, when at a
larger spatial scale, the importance of ‘spacing out’ from areas of high wolf risk
became more apparent (Bergerud and Page 1987; Seip 1991; Bergerud 1992;
James 1999). We examined the contribution of the components of risk relative only
to biotic (i.e., vegetation) and abiotic (e.g., elevation) habitat factors; future research
should incorporate other factors such as age, sex, and reproductive status at various
scales (Lima and Dill 1990; Molvar and Bowyer 1994; Bowyer et al. 1998; Bowyer et

120
al. 1999; Nielsen et al. 2002). Our findings that the risk of predation becomes more
important at larger spatial scales are similar to those of Rettie and Messier (2000),
but they also identify the importance of minimizing the energetic costs of movement
by female woodland caribou in a mountainous environment in the winter and late
winter months (as in Johnson 2000).
Interpreting the importance of modelled risk was difficult, particularly in the
framework of the information-theoretic approach. We modelled risk using the same
covariates that were included in the model set to determine resource selection for
caribou, and although no variables were strongly collinear, if risk was important, the
continuous risk covariate would have contributed little information to the suite of
covariates already in the model (i.e., if animals selected against risk, a suite of
habitat factors within the most parsimonious models may have already provided this
refugia from predation) (Burnham and Anderson 2002). Models for all individuals
with risk as the only covariate, however, were never selected from the model set as
the most parsimonious.
Prior to pooling use/availability data, researchers should quantify variation in
the selection of resources among individuals (Thomas and Taylor 1990; White and
Garrott 1990; Aebischer et al. 1993; Garshelis 2000; Manly et al. 2002). Our
justification for pooling models was based on large-scale geographic differences in
abiotic factors, and, to a lesser extent, similarities in the selection of biotic and
abiotic factors, not in the use (i.e., percent of locations) of these factors. By
grouping animals, we placed subjective constraints on what appeared to be a
selection ‘strategy’, but not identifying commonalities in selection among groups of
121
individuals likely would have provided a model with little biological and/or possibly
predictive value (Aebischer et al. 1993; Nielsen et al. 2002). Animals that resided in
the ‘flatter’ eastern portion of the GBPA clearly responded to abiotic factors quite
differently than animals living in the mountainous region. Intuitively, individual
models should have higher predictive capacity than pooled models, as selection
coefficients within each model are specific to an individual’s selection behavior.
Results from the k-fold cross-validation, however, did not support this assertion.
This may possibly result from lower variation in biotic and abiotic factors in
use/availability data for individuals (i.e., spatial autocorrelation; Apps et al. 2001;
Nielsen et al. 2002; Boyce et al. 2003), rare cases of categorical covariates (e.g.,
vegetation; Menard 2002), smaller data sets, and/or individual animals responding to
unidentified habitat factors at finer scales (Johnson 2000). Spatial autocorrelation
could be an artifact of restrictive definitions of availability (e.g., reduced movement
would lead to smaller areas of availability). These issues may become more clear
with possible solutions as more researchers model resource selection for individual
animals.
Perfect or near-perfect separation (i.e., zero or very low cell values) within
individual models is a technical problem that may interfere with biological
interpretation (Menard 2002). We had several cases where use of a vegetation
class was rare or did not occur, but the vegetation class was abundant in availability
data, and most often, these occurred in classes selected by wolf packs. Vegetation
classes that were not used, however, were biologically significant, because animals
avoided these cover types. We attempted to account for this by counting the
122
animals that clearly avoided certain vegetation classes. Issues of separation will
continue to cause problems in modelling selection among individuals with
categorical covariates. One potential technical solution may be to buffer GPS points
by locational error and sample areas of vegetation rather than discrete points (G.
Pendleton, Alaska Department of Fish and Game, pers. comm.).
We acknowledge that interpreting selection among individuals graphically
could be overly simplistic. Evaluating selection coefficients while holding other
covariates in the model constant may not be an accurate representation of selection,
because selection likely occurs for combinations of biotic and abiotic factors (Boyce
et al. 2003). Quantifying variation among individual animals, however, is an
important first step in modelling resource selection for a population (White and
Garrott 1990; Aebischer et al. 1993; Garshelis 2000; Nielsen et al. 2002) and this
offers a simple technique to do so. Research efforts should be directed towards
more rigorous methods that quantify variation in selection among individuals using
RSFs. Other concerns for interpreting model results include bias in locational data
which may lead to an increase in Type I (overestimate selection) or Type II
(underestimate selection) error rates (Friar et al. 2004; D. Heard, British Columbia
Ministry of Water, Land, and Air Protection, unpublished data). Our fix rates were
high ( x = 91.3%), which suggested low bias (Friar et al. 2004), although some
locational bias was likely present for individuals with lower fix rates.
Variation in resource selection among individual caribou is a source of
concern relative to the utility of pooled models, particularly in the context of
interpreting biological mechanisms behind selection (Aebischer et al. 1993; Nielsen

123
et al. 2002; Boyce et al. 2003). One of the benefits of RSFs is that researchers can
examine variation in selection among individuals within a particular time period, yet
Type III designs (Thomas and Taylor 1990) for large mammals are rarely conducted
and/or rarely published (Nielsen et al. 2002). Models from pooled data are
essentially an ‘average’ animal, but prior to pooling, we should identify whether an
‘average’ animal properly represents the population in question (White and Garrott
1990; Aebischer et al. 1993). We recommend that even with some of the above
concerns, future studies should interpret selection for environmental and ecological
factors within and across individuals at multiple scales (Wiens 1989; Aebischer et al.
1993). Scale-dependant responses among individuals are most likely to help us
understand the mechanisms behind selection of resources (Wiens 1989; Danell et
al. 1991).

124
CHAPTER 4: MANAGEMENT IMPLICATIONS FOR THE GREATER BESA
PROPHET AREA
INTRODUCTION
Management agencies most often want to know where and when animals
select areas within a management’s jurisdiction, and why animals use these areas.
This research illustrates concerns that should be addressed prior to examining the
where, when, and why of predicting distributions of animals. Models of where and
when can be generated if managers and researchers quantify variation among
individuals (Nielsen et al. 2002) and seasons (Wood 1996; Apps et al. 2001). I
agree with Nielsen et al. (2002) that if similarities in resource selection exist within
groups of animals within a season, it may be technically feasible and biological
appropriate to pool data into selection ‘strategies’, as this may address limited
sample sizes as well as other technical concerns (e.g., complete separation,
validation procedures, etc.). If variation is high among individuals and, therefore,
pooling data is unjustified, unique approaches may be required to map selection of
resources by a population that maintains individual selection strategies or the spatial
scale of investigation should be adjusted for better predictive capacity (i.e., decrease
resolution and/or increase extent; McClean et al. 1998; M. Boyce, University of
Alberta, pers. comm.). The latter approach assumes that larger scale models
maintain habitat factors that are important to animals among scales, but appropriate
validation procedures must be used to qualify this assertion. Albeit time intensive,
these precautions should help provide products (e.g., maps) that more precisely

125
portray a species’ selection of resources within an area. As to why animals select
particular areas within a landscape, it should be expected that large herbivores
respond to habitat factors in a hierarchical fashion (Johnson 1980; Senft et al. 1987;
Schaefer and Messier 1995; Johnson 2000; Apps et al. 2001; Boyce et al. 2003).
Consequently, multi-scale analyses (Schaefer and Messier 1995; Johnson 2000;
Apps et al. 2001; Boyce et al. 2003) with varied definitions of availability (McClean et
al. 1998; Meyer et al. 1998) are necessary to identify mechanisms of selection
(Wiens 1989), particularly if covariates include ecological factors such as predation
risk. I offer the following recommendations on where and when woodland caribou
select resources, reasons as to why they may select or avoid these areas, as well as
concerns for current and future management of caribou in the Greater Besa Prophet
area (GBPA).
IMPLICATIONS
Calving and summer
Reproductive parameters for female woodland caribou in the GBPA were
generally typical (Table 2.1), but more research is needed for better estimates of
parturition rates. Pregnancy rates of caribou in the GBPA (91.5 ± 4.1%, x ± SE)
were within previously observed estimates (90-100%) of woodland (Seip and
Cichowski 1996; Mahoney and Virgl 2003; McLoughlin et al. 2003) and barren
ground caribou (Griffith et al. 2002). Estimates of parturition were highly variable
between years (2002, n = 9, 55.6 ± 17.6%, x ± SE; 2003, n = 13, 76.9 ± 12.2%) and
were probably related to small sample sizes as 44 of the 48 global positioning

126
system collars (GPS) (22 per yr) failed prior to calving. These estimates, however,
did not differ from the 81% (range = 71-92%) documented for barren ground caribou
in Alaska (Griffith et al. 2002). Low parturition rates may be an indication of poor
quality winter and/or summer range because fetal adsorption and abortion, although
rare (Dauphiné 1976; Cameron and Ver Hoef 1994), likely result from poor body
condition (Russell et al. 1998). Therefore, more precise estimates of parturition
would be useful in the GBPA to assist in monitoring population condition and trends.
Calving peaked on 28 May with observations of caribou with neonates
ranging from 25 May-10 June; these estimates are similar to calving dates of other
woodland caribou herds (Oosenbrug and Theberge 1980; Vik Stronen 2000).
Caribou possibly calved earlier than 25 May, as early to late calving can last up to 4
weeks (Adams et al. 1995). Consequently, the extent of calving may have ranged
from 14 May-11 June (Oosenbrug and Theberge 1980).
I identified 3 distinct calving areas in the GBPA: the Foothills, Western High
Country, and North Prophet (Fig 2.2). Delineation of these areas was based on two
summers of intensive monitoring and distributions of parturient caribou, and
geographic, vegetative, and topographic differences (see Chapter 2). Each of these
calving areas may provide calving caribou a unique combination of habitat factors
that are likely to vary in importance among years as environmental and ecological
conditions change. Caribou calved in areas away from linear features (e.g., seismic
lines) that were steeper and higher than random (i.e., moved into the mountains to
calve) (Fig. 2.2). The Foothills area provides large areas of highly productive alpine
and subalpine vegetation types in close proximity to steep terrain that may be used

127
as escape cover for caribou with calves (Bergerud et al. 1984). This area appeared
to ‘green up’ earlier than the other calving areas, which may provide nutritious forage
for lactating females (Barten et al. 2001; Griffith et al. 2002; Oosenbrug and
Theberge 1980) that reach their lowest body condition of the year during the 3
weeks after calving (White and Luick 1984; Chan-McLeod et al. 1999). Although
high in wolf and bear risk, the Foothills is so productive vegetatively that parturient
females can calve in a variety of habitats that allow them to forage in high-quality
areas without an increased cost (i.e., increase in risk per unit of forage) in risk (see
Chapter 2). Conversely, the Western High Country provides areas lower in the risk
of predation, but also lower in forage biomass and quality. In this area, caribou
calved in hanging valleys (e.g., valleys running north-south near the head of Keily
Creek or Richards Creek) or on ridges between valleys (e.g., ridge to the north of
Colledge Lake). Animals that calve in these areas, however, may become more
predictable prey for predators (i.e., higher cost in risk per unit of forage) that reside
in adjacent areas. Caribou typically calved in the vegetated portions of these valleys
that offer few options to evade predation (see Chapter 2). The importance of this
area may vary annually and/or with changes in ungulate densities, particularly
moose and elk, because these areas are unlikely calving habitats for moose and elk.
As moose and elk densities increase, predators may respond to and concentrate on
areas with more abundant neonatal prey items to minimize search times and
increase encounter rates (Bergerud 1983); this could increase neonatal survival of
calves born in the Western High Country. The North Prophet is a unique area of the
GBPA in that it is generally free of forest cover, provides large areas of subalpine
128
and alpine vegetation, and has access to steep, rocky terrain. Caribou calved in
high-elevation talus fields or moist-alpine sites; this area likely offers benefits of both
abundant and productive alpine/subalpine vegetation that may ‘green-up’ relatively
soon and access to steep terrain that may act as escape cover for caribou with
young. For these same reasons, the North Prophet may be attractive to grizzly
bears (Ursus arctos) in early summer (Nielsen et al 2002; Nielsen et al. 2003).
Minimizing the risk of bear predation was an important factor in the selection of
calving sites within the North Prophet (see Chapter 2). Caribou in the North Prophet
generally calved in larger groups than the other areas, with as many as 10-15 adult
females. Regardless of the differences in environmental and ecological conditions
among calving areas, calf mortality did not differ among areas (see Chapter 2). The
persistence of these calving areas may be important because calf production in an
area is likely to vary with changing environmental (e.g., timing of late spring snows)
and/or ecological conditions (e.g., changes in ungulate and predator densities).
During calving, calving areas should be free of anthropogenic disturbance that may
alter distributions of parturient female caribou, other ungulates, and/or predators;
caribou are sensitive to these types of disturbances (Bradshaw et al. 1997;
Nelleman and Cameron 1998; James and Stuart Smith 2000; Dyer et al. 2001;
Weclaw and Hudson 2004).
The Foothills and North Prophet calving areas are important summer (15
June-15 August) range for woodland caribou in the GBPA. Large aggregations of
caribou (approx. 20-40) started to form during the third week after calving (i.e.,
approximately the second to third week in June) in these two calving areas; there

129
was another increase in movement towards these areas in the second week in July.
Five cows with collared calves left the Western High Country the third week of June;
of this sample, three pairs went to the Foothills, one pair went to the North Prophet,
and another pair went to the Akie drainage to the west (outside of the GBPA), and
no pairs moved to the Western High Country. Twenty-nine cow-calf pairs left their
calving sites by the end of July, and this movement had obvious impacts to calf
survival. Calves that remained at their calving sites through the end of summer
decreased their odds of survival by 66%. Formation of large groups of caribou may
be an important social response to simultaneously minimize the risk of wolf
predation (Bøving and Post 1997; Barten et al. 2001; Hebblewhite and Pletscher
2002) and forage in more productive areas within a calving area to address the
nutritional demands of lactation (White and Luick 1984; Barten et al. 2001). High-
quality summer range could have direct impacts to population productivity from the
potential increase in mass by parturient females and neonates and the subsequent
impacts to survival and reproductive condition (Cameron et al. 1993; Cameron and
Ver Hoef 1994; Post and Klein 1999; Adams and Dale 1998a,b; Cook et al. 2003).
Because of its relatively easier access, the Foothills area is most susceptible to
anthropogenic activity; cow-calf pairs should have choices in routes to this area to
form post-calving aggregations that are important to calf survival. Any disturbance
during either times of movement or formation of post-calving aggregations may have
significant direct (e.g., increased predation) and/or indirect consequences (e.g.,
displacement to lower quality summer range) to calf survival and population
productivity. In addition, the Foothills and North Prophet calving areas also provide

130
areas where snow persists through summer. Woodland caribou in the GBPA and
the Yukon likely use snowfields as refugia from insect harassment and/or provide
thermal cover on warm summer days (R. Farnell, Yukon Government, Department of
Environment, pers. comm.).
Wolverines and wolves were important sources of mortality for calves <14
and >18 d, respectively. Observations and anecdotal evidence suggest the GBPA is
productive wolverine habitat. Wolverines can be effective predators of reindeer and
caribou neonates (Landa et al. 1997; Vangen et al. 2001). Activating traplines north
of the Sikanni River may decrease mortality from wolverines and wolves during
calving and summer, although calf survival was relatively high during the calving
season (88 ± 5.0%, x ± SE). Based on this study, there are no additional
recommendations for lowering the rate of calf mortality from wolf predation since
wolves were regularly trapped in the Sikanni drainage. Adult wolf mortality within the
GBPA appeared high (11 of 27 GPS collared wolves, approx. 41%) throughout the
duration of the 2-yr study (B. Milakovic, University of Northern British Columbia,
unpublished data). Additionally, there were likely unsanctioned efforts to ‘control’
wolf populations occurring in the Upper Prophet River watershed; this unsanctioned
activity probably occurred during the 2002-2003 winter and may partially explain the
increase in caribou calf survival that year (54 ± 1.1% in 2002 vs. 79 ± 8.0% in 2003).
Winter and late winter
Adult female caribou exhibited considerable variation in the selection of
resources in winter (November-February) and late winter (March-April) of 2001-

131
2002. To define areas important for each individual caribou (n = 10), I used a raster
geographic information system (GIS) (PCI 9.1, Richmond Hill, ON, Canada),
seasonal home ranges for individual caribou, and resource selection functions
(RSFs) developed from logistic regression and the log-linear model (Boyce and
McDonald 1999; Manly et al. 2002) were used (Fig. 4.1). To maintain variation in
the selection of resources among individuals, I used the maximum RSF value,
scaled (0-1) (Manly et al. 2002) for each pixel from among the individual models.
For example, if 3 caribou models overlapped a single pixel, and RSFs for caribou A,
B, and C were equal to 0.25, 0.50, and 0.75 respectively, the highest value (0.75)
was assigned to that pixel. RSF values were then divided in 5 quantiles (i.e., 20th,
40th, 60th, 80th, and 100th percentile values) representing low to high relative
probabilities of female caribou occupying a pixel. For areas where I had no
estimates of use for individuals (i.e., a vegetation class did not occur in the use data
for a season), data were ‘filled in’ using estimates of selection from either the East or
Mountain models (see Chapter 3). I did not estimate relative selection for the entire
GBPA because our technique to define availability (i.e., 100% minimum convex
polygons buffered by the movement potential of an individual caribou within a
season, see Chapter 3) did not cover the study area. Because selection is likely to
change with availability, RSF models applied to areas outside the definitions of
availability are likely to provide unreliable estimates of selection (Garshelis 2000).
For all caribou, selection for late winter habitats was within areas selected during
winter; therefore, I provide one map of areas important to female woodland caribou
over winter (Fig. 4.1). These areas were not the only areas selected by caribou in

132
Figure 4.1. Areas selected by GPS-collared female woodland caribou in winter and late winter in the Greater Besa Prophet, northern British Columbia, 2001-2002.

133
the GBPA because observations, telemetry data from 1998-2000 (R. Woods,
Ministry of Water, Land, and Air Protection, unpublished data), and Zimmerman et
al. (2002) indicated that animals also were wintering near Hewer Creek, and Mounts
Dopp and Trimble. Additional locational data from 19 GPS collars that were
deployed in January 2004 will be available in January 2005, and used to update Fig.
4.1.
Current management actions and historic and future industrial development
may negatively affect caribou in the GBPA. Prescribed burning is a common
management activity in the GBPA to enhance Stone’s sheep populations, but it may
adversely affect the caribou population by increasing numbers of moose and elk,
which provides more abundant prey for wolves and bears (Gasaway et al. 1983;
Bergerud and Elliot 1986; Seip 1991, 1992; Ballard et al. 2000), and by reducing the
amount of forage for caribou (Klein 1982; Seip 1990; Schaefer and Pruitt 1991;
Thomas 1998). Preliminary selection models suggest moose (K. Parker and M.
Gillingham, University of Northern British Columbia, unpublished data), Stone’s
sheep (A. Walker, University of Northern British Columbia, unpublished data), grizzly
bears, and wolves (B. Milakovic, University of Northern British Columbia,
unpublished data) select for burned/disturbed areas at some time during the year in
the GBPA; elk in the area are likely benefiting from burns (Peck and Peek 1991).
Assuming this activity is increasing numbers of moose and elk, the wolf population
may also be increasing (Gasaway et al. 1983; Gasaway et al. 1992; Ballard et al.
2000). Grizzly bears may also benefit from burning, as they feed on early seral
vegetation typical of recent burns (Nielsen et al. 2003) as well as the ungulates that

134
are attracted to these areas (B. Milakovic, University of Northern British Columbia,
unpublished data). Caribou in Alaska (Joly et al. 2003) and Manitoba (Schaefer and
Pruitt 1991) avoided burns <50 yrs old; individuals in the Beverly herd did not use
burned areas until approx. 40-60 yrs post-burn (Thomas 1998). Fires may benefit
populations in the long term (>100 yrs) (Klein 1982; Thomas 1998), but the recovery
of lichens after a fire is slow (Schaefer and Pruitt 1991). Four of the 8 caribou in the
mountains strongly avoided burned/disturbed areas while the others tended to avoid
these areas (see Chapter 3).
Linear corridors in the eastern section of the GBPA could be negatively
affecting the woodland caribou population. Assuming the average width for lines
that can be observed from aerial photography or satellite imagery is 5 m, there are
approx. 6,000 ha of the GBPA covered by linear features as of December 2003 (Fig.
2.2); most of these linear features have been converted from spruce (Picea spp.) to
shrub species, primarily in the form of willow (Salix spp.). With the development of
linear corridors, there is often increased recreational use of all-terrain vehicles and
snowmobiles. Linear developments and seismic activity during the winter months in
Alberta have been linked to increased predation from wolves that use the corridors
to increase encounter rates with prey (James 1999; James and Stuart-Smith 2000).
Woodland caribou in the GBPA are sensitive to distances to areas of high risk in
winter and late winter (see Chapter 3) and linear corridors are associated with a
higher risk of predation (Dyer et al. 2001, 2002; McLoughlin et al. 2003). Indeed,
wolves from the Pocketknife pack used linear features disproportionately to their
availability in the GBPA from November-April in 2002 and 2003.
135
The impact of current and historic industrial development on the loss of
habitat appears to be the largest factor in the decline of woodland caribou in Alberta
(Weclaw and Hudson 2004). Nellemen and Cameron (1998), Dyer et al. (2001), and
Weclaw and Hudson (2004) noted that the impact of industrial complexes on caribou
exceeded the area of the actual ‘footprint’ of development (e.g., area of well sites
and roads) because animals tended to avoid well sites by approx. 1.0 km and roads
by 0.25 km; this avoidance was strongest during late winter and calving (Dyer et al.
2002). Linear corridors and industrial activity have been associated with higher
movement rates (Murphy and Curatolo 1987) and decreased foraging activity in
caribou (Bradshaw et al. 1997). Woodland caribou in the GBPA are sensitive to
minimizing the energetic costs of movement, particularly during late winter (see
Chapter 3). The cumulative effects of increased energetic costs from increased
movement (Murphy and Curatolo 1987), reduced foraging times (Bradshaw et al.
1997), the increased risk of predation (James and Stuart-Smith 2000), and loss of
functional habitat due to anthropogenic disturbance (Dyer et al. 2001; Weclaw and
Hudson 2004) would likely decrease productivity of the population(s) of caribou in
the GBPA. As proposals for seismic developments increase, all efforts should be
made to minimize the aforementioned effects of access associated with seismic and
industrial activity increases in the mountainous regions of GBPA. These cautions
are strongly advised if caribou are to remain in perpetuity in the GBPA, and to avoid
the declines in numbers that have resulted as a consequence of industrial
development in other areas (Dzuz 2001; McLoughlin et al. 2003; Weclaw and
Hudson 2004).

136
LITERATURE CITED
Acorn, R. S., and M. J Dorrance. 1998. Methods of investigating predation of livestock. Alberta Agriculture, Food and Rural Development, Edmonton, Alberta.
Adams, L. G., and B. W. Dale. 1998a. Reproductive performance of female Alaskan caribou. Journal of Wildlife Management 62:1184-1195.
Adams, L. G., and B. W. Dale. 1998b. Timing and synchrony of parturition in Alaskan caribou. Journal of Mammalogy 79:287-294.
Adams, L. G., F. J. Singer, and B. W. Dale. 1995. Caribou calf mortality in Denali, National Park, Alaska. Journal of Wildlife Management 59:584-594.
Aebischer, N. J., P. A. Robertson, and K. E. Kenward. 1993. Compositional analysis of habitat use from animal radio-tracking data. Ecology 74:1313-1325.
Altendorf, K. B., J. W. Laundré, C. A. Lopez Gonzales, and J. S. Brown. 2001. Assessing effects of predation risk on foraging behavior of mule deer. Journal of Mammalogy 82:430-439.
Apps, C. D., B. N. McLellan, T. A. Kinley, and J. P. Flaa. 2001. Scale-dependant habitat selection by mountain caribou, Columbia Mountains, British Columbia. Journal of Wildlife Management 65:65-77.
Ballard, W. B. 1994. Effects of black bear predation on caribou--a review. Alces 30:25-35.
Ballard, W. B., P. R. Krausman, S. Boe, S. Cunningham, and H. A. Whitlaw. 2000. Short-term response of gray wolves (Canis lupis) to wildfire in northwestern Alaska. Canadian Field-Naturalist 114:241-247.
Barrett, G. W. 1982. Distribution, behavior, and mortality of pronghorns during a severe winter in Alberta. Journal of Wildlife Management 46:991-1002.
Barten, N. L., R. T. Bowyer, and K. J. Jenkins. 2001. Habitat use by female caribou: tradeoffs associated with parturition. Journal of Wildlife Management 65:77-92.
Ben-David, M., K. Titus, and L. R. Beier. 2004. Consumption of salmon by Alaskan brown bears: a trade-off between nutritional requirements and the risk of infanticide? Oecologia 138:465-474.
Berger, J., and C. Cunningham. 1988. Size-related effects on search times in North American grassland female ungulates. Ecology 69:177-183.

137
Bergerud, A. T. 1961. Sex determination of caribou calves. Journal of Wildlife Management 25:199.
Bergerud, A. T. 1974. Decline of caribou in North America following settlement. Journal of Wildlife Management 38:757-770.
Bergerud, A. T. 1983. Prey switching in a simple ecosystem. Scientific American
249:130-136.
Bergerud, A. T. 1992. Rareness as an antipredator strategy to reduce the risk of predation for moose and caribou. Pages 1008-1021 in D. R. McCullough and R. H. Barrett, editors. Wildlife 2001: Populations. Elsevier, London, U.K.
Bergerud, A. T. 1996. Evolving perspectives on caribou population dynamics, have we got it right yet? Rangifer, Special Issue No. 9:95-115.
Bergerud, A. T., H. E. Butler, and D. R. Miller. 1984. Antipredator tactics of calving caribou: dispersion in mountains. Canadian Journal of Zoology 62:1566-1575.
Bergerud, A. T., R. Ferguson, and H. E. Butler. 1990. Spring migration and dispersion of woodland caribou at calving. Animal Behaviour 39:360-368.
Bergerud, A. T., and J. P. Elliot. 1986. Dynamics of caribou and wolves in British Columbia. Canadian Journal of Zoology 64:1515-1529.
Bergerud, A. T., and J. P. Elliott. 1998. Wolf predation in a multiple-ungulate system in northern British Columbia. Canadian Journal of Zoology 76:1551-1569.
Bergerud, A. T., and R. E. Page. 1987. Displacement and dispersion of parturient caribou at calving as antipredator tactics. Canadian Journal of Zoology 65:1597-1606.
Boertje, R. D. 1984. Seasonal diets of the Denali Caribou Herd, Alaska. Arctic 37:161-165.
Bøving, P. S., and E. Post. 1997. Vigilance and foraging behavior of female caribou in relation to predation risk. Rangifer 17:55-63.
Bowyer, R. T., J. G. Kie, and V. Van Ballenberghe. 1998. Habitat selection by neonatal black-tailed deer: climate, forage, or risk of predation? Journal of Mammalogy 79:415-425.
Bowyer, R. T., V. Van Ballenberghe, J. G. Kie, and J. A. Maier. 1999. Birth-site selection by Alaskan moose: maternal strategies for coping with a risky environment. Journal of Mammalogy 80:1070-1083.
138
Boyce, M. S., J. S. Mao, E. H. Merrill, D. Fortin, M. G. Turner, J. Fryxell, and P. Turchin. 2003. Scale and heterogeneity in habitat selection by elk in Yellowstone National Park. Ecoscience 10:421-431.
Boyce, M. S., and L. L. McDonald. 1999. Relating populations to habitats using resource selection functions. Trends in Ecology and Evolution 14:268-272.
Boyce, M. S., P. R. Vernier, S. E. Nielsen, and F. K. Schmiegelow. 2002. Evaluating resource selection functions. Ecological Modelling 157:281-300.
Bradshaw, C.J., S. Boutin, and D.M. Hebert. 1997. Effects of petroleum exploration on woodland caribou in northeastern Alberta. Journal of Wildlife Management 61:1127-1133.
Burnham, K. P., and D. R. Anderson. 2002. Model selection and multi-model
inference: a practical information-theoretic approach. Second edition. Springer-Verlag, New York, New York.
Byers J. A. 1997. American pronghorn: social adaptations and the ghosts of
predators past. University of Chicago Press, Chicago, IL. Cameron, R. D., W. T. Smith, S. G. Fancy, K. L. Gerhart., and R. G. White. 1993.
Calving success of female caribou in relation to body weight. Canadian Journal of Zoology 71:480-486.
Cameron, R. D., and J. M. Ver Hoef. 1994. Predicting parturition rate of caribou
from autumn body mass. Journal of Wildlife Management 58:674-679. Caro, T. M. 1994. Ungulate antipredator behaviour: preliminary and comparative
data from African bonds. Behaviour 128:189-228. Chander, G., and B. L. Markum. 2003. Revised Landsat-5 TM radiometric
calibration procedures, and post-calibration dynamic ranges. IEEE Transactions on Geoscience and Remote Sensing 41:2674-2677.
Chan-McLeod, A. C. A., R. G. White, and D. E. Russell. 1999. Comparative body
composition strategies of breeding and non-breeding caribou. Canadian Journal of Zoology 77:1901-1907.
Cichowski, D.B. 1993. Seasonal movements, habitat use, and winter feeding
ecology of woodland caribou in west-central British Columbia. British Columbia Ministry of Environment, Lands, and Parks Land Management Report No. 79.
Clark, C. W. 1994. Antipredator behaviour and the asset-protection principle.
Behavioural Ecology 5:159-170.

139
Crête, M., J. Huot, and L. Gauthier. 1990a. Food selection during early lactation by caribou calving on the tundra in Quebec. Arctic 43:60-65.
Crête, M., J. Huot, R. Nault, and R. Patenaude. 1990b. Reproduction, growth, and body composition of Rivière George caribou in captivity. Arctic 46:189-196.
Committee on the Status of Endangered Wildlife. 2002. Summary of the full list of Canadian species at risk. Canadian Wildlife Service, Environment Canada, Ottawa, Ontario, Canada
Cook, J. G., B. K. Johnson, R. C. Cook, R. A. Riggs, T. Delcurto, L. D. Bryant, and L. L. Irwin. 2003. Effects of summer-autumn nutrition and parturition date on reproduction and survival of elk. Wildlife Monographs 155:1-61.
Corsi, F., J. de Leeuw, and A. K. Skidmore. 2000. Modeling Species Distribution with GIS. Pages 389-434 in L. Boitani and T. K. Fuller , editors. Research Techniques in Animal Ecology: Controversies and Consequences. Columbia University, New York, New York, USA.
Cumming, H. G. 1992. Woodland caribou: facts for forest managers. Forestry Chronicle 68:481-491.
Cumming, H. G., D. B. Beange, and Lavoie, G. 1996. Habitat partitioning between woodland caribou and moose in Ontario: the potential role of shared predation risk. Rangifer, Special Issue No. 9:81-94.
Dale, B. W., L. G. Adams, and R. T. Bowyer. 1994. Functional response of wolves preying on barren-ground caribou in a multiple-prey ecosystem. Journal of Animal Ecology 63:644-652.
Danell, K., L. Edenuis, and P. Lundberg. 1991. Herbivory and tree stand composition: moose patch use in winter. Ecology 72:1350-1357.
Dauphiné, T. C. 1976. Biology of the Kaminuriak population of barren-ground
caribou. Part 4: Growth, reproduction, and energy reserves. Canadian Wildlife Service Report Series No. 38.
Demarchi, D. A. 1996. Introduction to the Ecoregions of British Columbia. British
Columbia Wildlife Branch, Ministry of Environment, Lands and Parks, Victoria, British Columbia, Canada.
D’Eon, R. G., R. Serrouya, G. Smith, and C. O. Kochanny. 2002. GPS
radiotelemetry error and bias in mountainous terrain. Wildlife Society Bulletin 30:430-439.
Downes, C. M., J. B. Thebarge, and S. M. Smith. 1986. The influence of insects on
the distribution, microhabitat choice, and behavior of the Burwash caribou herd. Canadian Journal of Zoology 64:622-629.

140
Dussault, C., R. Courtois, J. P. Ouellet, and J. Huot. 1999. Evaluation of GPS telemetry collar performance for habitat studies in the boreal forest. Wildlife Society Bulletin 27:965-972.
Dyer, S. J., O’Neill, J. P., S. M. Wasel, and S. Boutin. 2001. Avoidance of industrial
development by woodland caribou. Journal of Wildlife management 65:531-542.
Dyer, S. J., O’Neill, J. P., S. M. Wasel, and S. Boutin. 2002. Quantifying barrier
effects of roads and seismic lines on movements of female woodland caribou in northeastern Alberta. Canadian Journal of Zoology 80:839-845.
Dzus, E. 2001. Status of the Woodland Caribou (Rangifer tarandus caribou) in
Alberta. Alberta Environment, Fisheries and Wildlife Management Division, and Alberta Conservation Association, Wildlife Status Report No. 30, Edmonton, Alberta, Canada.
Eastland, W. G., R. T. Bowyer, and S. G. Fancy. 1989. Effects of snow cover on
selection of calving sites by caribou. Journal of Mammalogy 70:824-828. Fancy, S. G., and R. G. White. 1987. Energy expenditures for locomotion by
barren-ground caribou. Canadian Journal of Zoology 65:122-128. Ferguson, S. H., A. T. Bergerud, and R. Ferguson. 1988. Predation risk and habitat
selection in the persistence of a remnant caribou population. Oecologia 76:236-245.
Frair, J. L., S. E. Nielsen, E. H. Merrill, S. R. Lele, M. S. Boyce, R. H. Munro, G. B.
Stenhouse, and H. L. Beyer. 2004. Removing GPS collar bias in habitat selection studies. Journal of Applied Ecology 41:201-212.
Garshelis, D. L. 2000. Delusions in habitat evaluation: measuring use, selection,
and importance. Pages 111-164 in L. Boitani and T. K. Fuller , editors. Research Techniques in Animal Ecology: Controversies and Consequences. Columbia University, New York, New York, USA.
Gasaway, W. C., R. D. Boertje, D. V. Grangaard, D. G. Kelleyhouse, R. O.
Stephenson, and D. G. Larsen. 1992. The role of predation in limiting moose at low densities in Alaska and Yukon and implications for conservation. Wildlife Monographs 120.
Gasaway, W. C., R. O. Stephenson, J. L. Davis, P. E. K. Shepherd, and O. E. Burris.
1983. Interrelations of wolves, prey, and man in interior Alaska. Journal of Wildlife Management 47:1-50.
Gerhart, K. L., R. G. White, R. D. Cameron, and D. E. Russell. 1996. Body

141
composition and nutrient reserves of arctic caribou. Canadian Journal of Zoology 74:136-146.
Grand, T. C. 2002. Alternative forms of competition and predation dramatically
affect habitat selection under foraging-predation risk trade-offs. Behavioural Ecology 13:280-290.
Griffith, B., D. C. Douglas, N. E. Walsh, D. D. Young, T. R. McCabe, D. E. Russell,
R. G. White, R. D. Cameron, and K. R. Whitten. 2002. The Porcupine caribou herd. Pages 8-37 in Arctic Refuge coastal plain terrestrial wildlife research summaries. U.S. Geological Survey, Biological Resources Division, Biological Science Report USGS/BRD/BSR-2002-0001.
Hamilton, W. D. 1971. Geometry for the selfish herd. Journal of Theoretical
Biology 31:295-311. Haugen, A. O., and D. W. Speake. 1958. Determining age of young fawn white-
tailed deer. Journal of Wildlife Management 22:319-321. Heard, D. C., and K. L. Vagt. 1998. Caribou in British Columbia: a 1996 status
report. Rangifer, Special Issue No. 10:117-123. Heard, D. C., T. M. Williams, and D. A. Melton. 1996. The relationship between
food intake and predation risk in migratory caribou and implications to caribou and wolf population dynamics. Rangifer, Special Issue No. 9:37-44.
Hebblewhite, M., and D. H. Pletscher. 2002. Effects of elk group size on predation
by wolves. Canadian Journal of Zoology 80:800-809. Higgins, K. F., J. L. Oldemeyer, K. J. Jenkins, G. K. Clambey, and R. F. Harlow.
1996. Vegetation sampling and measurement. Pages 567-591 in T. A. Bookhout, editor. Research and management techniques for wildlife and habitats. The Wildlife Society, Bethesda, Maryland.
Hooge, P. N., W. Eichenlaub, and E. K. Solomon. 1999. The animal movement
program, v. 2.0. Available for review and download from the U.S. Geologic Survey at the Alaska Biological Center at http://www.absc.usgs.gov/glba/gistools/index.htm
James A. R. C. 1999. Effects of industrial development on the predator-prey
relationship between wolves and caribou in northeastern Alberta. PhD Dissertation, University of Alberta, Edmonton, Alberta, Canada.
James, A. R. C., and A. K. Stuart-Smith. 2000. Distribution of caribou and wolves in
relation to linear corridors. Journal of Wildlife Management 64:154-159.

142
Jenness, J. 2003. Random Point Generator, v. 1.27. Available for review and download at http://www.jennessent.com/arcview/random_points.htm
Johnson, D. H. 1980. The comparison of usage and availability measurements for
evaluating resource preference. Ecology 61:65-71. Johnson, C. J. 2000. A multi-scale approach to understanding the movements of
woodland caribou. PhD Dissertation, University of Northern British Columbia, Prince George, British Columbia, Canada.
Johnson, C. J., K. L. Parker, and D. C. Heard. 2000. Feeding site selection by
woodland caribou in north-central British Columbia. Rangifer, Special Issue No. 12:159-172.
Johnson, C. J., K. L. Parker, and D. C. Heard. 2001. Foraging across a variable
landscape: behavioral decisions made by woodland caribou at multiple spatial scales. Oecologia 127:590-602.
Johnson, C. J., K. L. Parker, D. C. Heard, and M. P. Gillingham. 2002a. Movement
parameters of ungulates and scale-specific responses to the environment. Journal of Animal Ecology 71:225-235.
Johnson, C. J., K. L. Parker, D. C. Heard, and M. P. Gillingham. 2002b. A
multiscale behavioral approach to understanding the movements of woodland caribou. Ecological Applications 12:1840-1860.
Johnson, C. J., D. R. Seip, and M. S. Boyce. 2004. Characterizing woodland
caribou habitat in sub-boreal and boreal forests. Journal of Applied Ecology 41:238-251.
Joly, K., B. W. Dale, W. B. Collins, and L. G. Adams. 2003. Winter habitat use by
female caribou in relation to wildland fires in interior Alaska. Canadian Journal of Zoology 81:1192-1201.
Kats, L. B., and Dill, L. M. 1998. The scent of death: chemosensory assessment of
predation risk by prey animals. Ecoscience 5:361-394. Kie, J. G. 1999. Optimal foraging and risk of predation: effects on behavior and
social structure in ungulates. Journal of Mammalogy 80:1114-1129. Kie, J. G., R. T. Bowyer, M. C. Nicholson, B. B. Boroski, and E. R. Loft. 2002.
Landscape heterogeneity at differing scales: effects on spatial distribution of mule deer. Ecology 83:530-544.
Klein, D. R. 1982. Fire, lichens, and caribou. Journal of Range Management
35:390-395.

143
Krebs, C. J. 1989. Ecological Methodology. First edition. Harper and Row, New York.
Krebs, J. R. 1980. Optimal foraging, predation risk, and territory defence. Ardea
68:83-90. Landa, A., J. Strand, J. E. Swenson, and T. Skogland. 1997. Wolverines and their
prey in southern Norway. Canadian Journal of Zoology 75:1292-1299. Lenart, E. A., R. T. Bowyer, J. Ver Hoef, and R. W. Ruess. 2002. Climate change
and caribou: effects of summer weather on forage. Canadian Journal of Zoology 80:664-678.
Levin, S. A. 1992. The problem of pattern and scale in ecology. Ecology 73:1943-
1967. Lima S. L. 1988. Initiation and termination of daily feeding in dark-eyed juncos:
influences of predation risk and energy reserves. Oikos 53:3-11. Lima, S. L., and L. M. Dill. 1990. Behavioral decisions made under the risk of
predation: a review and prospectus. Canadian Journal of Zoology 68:619-640.
Lingle, S. 2002. Coyote predation and habitat segregation of white-tailed deer and
mule deer. Ecology 83:2037-2048. Mahoney, S. P., and J. A. Virgl. 2003. Habitat selection and demography of a
nonmigratory woodland caribou population in Newfoundland. Canadian Journal of Zoology 81:321-334.
Manel, S., H. C. Williams, and S. J. Ormerod. 2001. Evaluating presence-absence
models in ecology: the need to account for prevalence. Journal of Applied Ecology 38:921-931.
Manly, B. F., L. L. McDonald, and D. L. Thomas. 2002. Resource selection by
animals: statistical design and analysis for field studies. Second edition. Chapman-Hall, London, U.K.
McClean, S. A., M. A. Rumble, R. M. King, and W. L. Baker. 1998. Evaluation of
resource selection methods with different definitions of availability. Journal of Wildlife Management 62:793-801.
McLoughlin, P. D., R. L. Case, R. J. Gau, H. D. Cluff, R. Mulders, and F. Messier.
2002. Hierarchical habitat selection by barren-ground grizzly bears in the central Canadian Arctic. Oecologia 132:102-108.
McLoughlin, P. D., E. Dzuz, B. Wynes, and S. Boutin. 2003. Declines in

144
populations of woodland caribou. Journal of Wildlife Management 64:755-761.
Mech, L. D. 1977. Wolf pack buffer zones as prey reservoirs. Science 198:320-
321. Mech, L. D. 1994. Buffer zones of territories of gray wolves as regions of
intraspecific strife. Journal of Mammalogy 75:199-202. Menard, S. 2002. Applied logistic regression analysis. Second edition. Sara Miller
McCune, Sage, Thousand Oaks, California, USA. Miller, L. E. 2002. Introduction to predator sensitive foraging. Pages 1-17 in L. E.
Miller, editor. Eat or be eaten: predator sensitive foraging among primates. Cambridge University, Cambridge, United Kingdom.
Ministry of Crown Lands. 1990. Terrain and Resource Inventory Management in
British Columbia Specifications and Guidelines for Geomatics: Digital Baseline Mapping at 1:20,000. Ministry of Crown Lands for the Government of British Columbia, Victoria, British Columbia, Canada.
Mitchell, W. A., and S. L. Lima. 2002. Predator-prey shell games: large-scale
movement and its implications for decision-making by prey. Oikos 99:249-259.
Mohr, C. O. 1947. Table of equivalent populations in North American mammals.
The American Midland Naturalist 37:223-249. Molvar, E. M., and R. T. Bowyer. 1994. Costs and benefits of group living in a
recently social ungulate: the Alaskan moose. Journal of Mammalogy 75:621-630.
Mosnier, A., J. Ouellet, L. Sirois, and N. Fournier. 2003. Habitat selection and
home-range dynamics of the Gaspé caribou: a hierarchical analysis. Canadian Journal of Zoology 81:1174-1184.
Murphy, S. M., and J. A. Curatolo . 1987. Activity budgets and movement rates of
caribou encountering pipelines, roads, and traffic in northern Alaska. Canadian Journal of Zoology 65:2483-2490.
Nelleman, C., and R. D. Cameron 1998. Cumulative impacts of an evolving oil-field
complex on the distribution of calving caribou. Canadian Journal of Zoology 76:1425-1430.
Nielsen, S. E., M. S. Boyce, G. B. Stenhouse, and R. H. M. Munro. 2002. Modelling
grizzly bear habitats in the Yellowhead ecosystem of Alberta: taking
145
autocorrelation seriously. Ursus 13:45-56. Nielsen, S. E., M. S. Boyce, G. B. Stenhouse, and R. H. Munro. 2003.
Development and testing of phenologically driven grizzly bear habitat models. Ecoscience 10:1-10.
Oindo, B. 2002. Predicting Mammal Species Richness and Abundance Using Multi-
temporal NDVI. Photogrammetric Engineering and Remote Sensing 68:623-629.
Oosenbrug, S. M., and J. B. Theberge. 1980. Altitudinal movements and summer
habitat preferences of woodland caribou in the Kluane Ranges, Yukon Territory. Arctic 33:59-72.
Palmer, M. W. 1993. Putting things in even better order: the advances of canonical
correspondence analysis. Ecology 74:2215-2230. Parker, K. L. 1989. Growth rates and morphological measurements of caribou
calves. Rangifer 9:9-13.
Parker, K. L., C. T. Robbins, and T. A. Hanley. 1984. Energy expenditures for locomotion by mule deer and elk. Journal of Wildlife Management 48:474-488.
Parker, K. L., R. G. White, M. P. Gillingham, and D. F. Holleman. 1990.
Comparison of energy metabolism in relation to daily activity and milk consumption by caribou and muskox neonates. Canadian Journal of Zoology 68:106-114.
Peck, R., and J. M. Peek. 1991. Elk (Cervus elaphus) habitat use related to
prescribed fire, Tuchodi River, British Columbia. Canadian Field-Naturalist 105:354-362.
Pollock, K. H., S. R. Winterstein, C. M. Bunck, and P. D. Curtis. 1989. Survival
analysis in telemetry studies: the staggered entry design. Journal of Wildlife Management 53:7-15.
Poole, K. G., D. C. Heard, and G. Mowat. 2000. Habitat use by woodland caribou
near Takla Lake in central British Columbia. Canadian Journal of Zoology 78:1552-1561.
Post, E., P. S. Bøving, C. Pederson, and M. A. MacArthur. 2003. Synchrony between caribou calving and plant phenology in depredated and non-depredated populations. Canadian Journal of Zoology 81:1709-1714.
Post, E., and D. R. Klein. 1999. Caribou calf production and seasonal range quality
during a population decline. Journal of Wildlife Management 63:335-345.

146
Rachlow, J. L., and R. T. Bowyer. 1998. Habitat selection by Dall's sheep (Ovis dalli): maternal trade-offs. Journal of Zoology 245:457-465.
Reed, B. C., J. F. Brown, D. Vander Zee, T. R. Loveland, J. W. Merchant, and D. O.
Ohlen. 1994. Measuring the phenological variability from satellite imagery. Journal of Vegetation Science 5:703-714.
Reimers, E., D. R. Klein, and R. Sørumgård. 1983. Calving time, growth rate, and
body size of Norwegian reindeer on different ranges. Alpine Arctic Research 15:107-118.
Rettie, W. J., and F. Messier. 1998. Dynamics of woodland caribou populations at
the southern limit of their range in Saskatchewan. Canadian Journal of Zoology 76:251-259.
Rettie, W. J., and F. Messier. 2000. Hierarchical habitat selection by woodland
caribou: its relationship to limiting factors. Ecography 23:466-478 Rogers, L. L., L. D. Mech, D. K. Dawson, J. M. Peek, and M. Korb. 1980. Deer
distribution in relation to wolf pack territory edges. Journal of Wildlife Management 44:253-258.
Ruimy, A., G. Dedieu, and B. Saugier. 1994. Methodology for the estimation of
terrestrial net primary production from remotely sensed data. Journal of Geophysical Research 99:5263-5283.
Russell, D. E., K. L. Gerhart, R. G. White, and D. Van de Wetering. 1998. Detection of early pregnancy in caribou: evidence for embryonic mortality. Journal of Wildlife Management 62:1066-1075.
Russell, D. E., A. M. Martell, and W. A. C. Nixon. 1993. Range ecology of the
Porcupine Caribou Herd in Canada. Rangifer Special Issue No. 8:1-168. Schaefer, J. A., and F. Messier. 1995. Habitat selection as a hierarchy: the spatial
scales of winter foraging by muskoxen. Ecography 18:333-344. Schaefer, J. A., and W. O. Pruitt Jr. 1991. Fire and woodland caribou in
southeastern Manitoba. Wildlife Monographs 116. Seip, D. R. 1990. Ecology of woodland caribou in Wells Gray Provincial Park.
British Columbia Ministry of Environment Wildlife Bulletin B-68. Seip, D. R. 1991. Predation and caribou populations. Rangifer 11:46-52. Seip, D. R. 1992. Factors limiting woodland caribou populations and their
interrelationships with wolves and moose in southeastern British Columbia. Canadian Journal of Zoology 70:1494-1503.
147
Seip, D. R. 1998. Ecosystem management and the conservation of caribou habitat in British Columbia. Rangifer Special Issue No. 10:203-212.
Seip, D. R., and D. B. Cichowski. 1996. Population ecology of caribou in British
Columbia. Rangifer Special Issue No. 9:73-80. Senft, R. L.., M. B. Coughenour, D. W. Bailey, L. R. Rittenhouse, O. E. Sala, and D.
M. Swift. 1987. Large herbivore foraging ecology and ecological hierarchies. BioScience 37:789-791.
Siegel, S. 1956. Nonparametric statistics for the behavioral sciences. First edition.
McGraw-Hill, New York, New York. Siegel, S., and N. J. Castellan. 1988. Nonparametric statistics for the behavioral
sciences. Second edition. McGraw-Hill, New York, New York. Skogland, T. 1991. What are the effects of predators on large ungulate populations.
Oikos 61:401-410. Skoog, R. O. 1968. Ecology of the caribou (Rangifer tarandus grantii) in Alaska.
PhD Dissertation. University of California, Berkeley, CA, USA. Sokal, R. R., and F. J. Rohlf. 1995. Biometry: the principles and practice of
statistics in biological research. Third edition. W. H. Freeman and Co., New York.
Stephens, D. W., and J. R. Krebs. 1986. Foraging theory. First edition. Princeton
University, New Jersey. Stuart-Smith, A. K., C. J. A. Bradshaw, S. Boutin, D. M. Hebert, and A. B. Rippin.
1997. Woodland caribou relative to landscape patterns in northeastern Alberta. Journal of Wildlife Management 61:622-633.
Sweitzer, R. A. 1996. Predation or starvation: foraging decisions by porcupines
(Erethizon dorsatum). Journal of Mammalogy 77:1068-1077. Thomas, D. C. 1998. Fire caribou relationships: (VII) Fire management on the
winter range of the Beverly herd: final conclusions and recommendations. Technical Report Series No. 315. Canadian Wildlife Service, Edmonton, Alberta, Canada.
Thomas, D. L., and E. J. Taylor. 1990. Study designs and tests for comparing resource use and availability. Journal of Wildlife Management 54:322-330.
Tucker, C. J., and P. J. Sellers. 1986. Satellite remote sensing of primary
production. International Journal of Remote Sensing 7:1395-1416.

148
Vangen, K. M., J. Persson, A. Landa, R. Andersen, and P. Segerström. 2001. Characteristics of dispersal in wolverines. Canadian Journal of Zoology 79:1641-1649.
Vik Stronen, A. 2000. Habitat selection and calf survival in the Telkwa caribou herd,
British Columbia 1997-2000. Master of Environmental Design Thesis, University of Calgary, Calgary, Alberta.
Weclaw, P., and R. J. Hudson. 2004. Simulation of conservation and management
of woodland caribou. Ecological Modelling 177:75-94. Weladji, R. B., and O. Holand. 2003. Global climate change and reindeer: effects of
winter weather on the autumn weight and growth of calves. Oecologia 136:317-323.
White, G. C., and R. A. Garrott. 1990. Analysis of wildlife radio-tracking data.
Academic Press, San Diego, California, USA. White, K. S., and J. Berger. 2001. Antipredator strategies of Alaskan moose: are
maternal trade-offs influenced by offspring activity? Canadian Journal of Zoology 79:2055-2062.
White, K. S., J. W. Testa, and J. Berger. 2001. Behavioral and ecologic effects of
differential predation pressure on moose in Alaska. Journal of Mammalogy 82:422-429.
White, R. G., F. L. Bunnell, E. Gaare, T. Skogland, and B. Hubert. 1981. Ungulates
on arctic ranges. Pages 397-483 in L. C. Bliss, O. W. Heal, and J. J. Moore, editors. Tundra ecosystems: a comparative analysis. International Biological Progam 25. Cambridge University, Cambridge, England, U.K.
White, R. G., and J. R. Luick. 1984. Plasticity and constraints in the lactational
strategy of reindeer and caribou. Symposia of the Zoological Society of London 51:215-232.
Whitman, J. S., W. B. Ballard, and C. L. Gardner. 1986. Home range and habitat
use by wolverines in south-central Alaska. Journal of Wildlife Management 50:460-463.
Whitten, K. R., and R. D. Cameron. 1980. Nutrient dynamics of caribou forage on
Alaska’s Arctic slope. Proceedings of the Second International Reindeer/Caribou Symposium:159-166.
Wiens, J. A. 1989. Spatial scaling in ecology. Functional Ecology 3:385-397. Wittmer, H. 2004. Mechanisms underlying the decline of mountain caribou in British

149
Columbia. PhD Dissertation, University of British Columbia, Vancouver, British Columbia, Canada.
Wood, M. 1996. Seasonal habitat use and movements of woodland caribou in the
Omineca Mountains, north central British Columbia, 1991-1993. Rangifer, Special Issue No. 9:365-378.
Young, D. D., and T. R. McCabe. 1997. Grizzly bear predation rates on caribou
calves in northeastern Alaska. Journal of Wildlife Management 61:1056-1066.
Zar, J. H. 1998. Biostatistical analysis. Fourth edition. Prentice-Hall, New Jersey,
USA. Zimmerman, K. L., R. S. McNay, L. Gigure, J. J. Joy, K. Schmidt, P. Hengeveld, S.
Walshe, G. Keddie, and L. Wilson. 2002. Ecological factors affecting northern caribou in the Omineca Region, British Columbia: 2001. Pacific Slope Consulting, Vancouver, British Columbia, Canada.

150
Appendix A: Specifications and schematic of the expandable drop-off radiocollar for woodland caribou (Rangifer tarandus caribou) calves that were captured and monitored in the Greater Besa Prophet area, northern British Columbia.
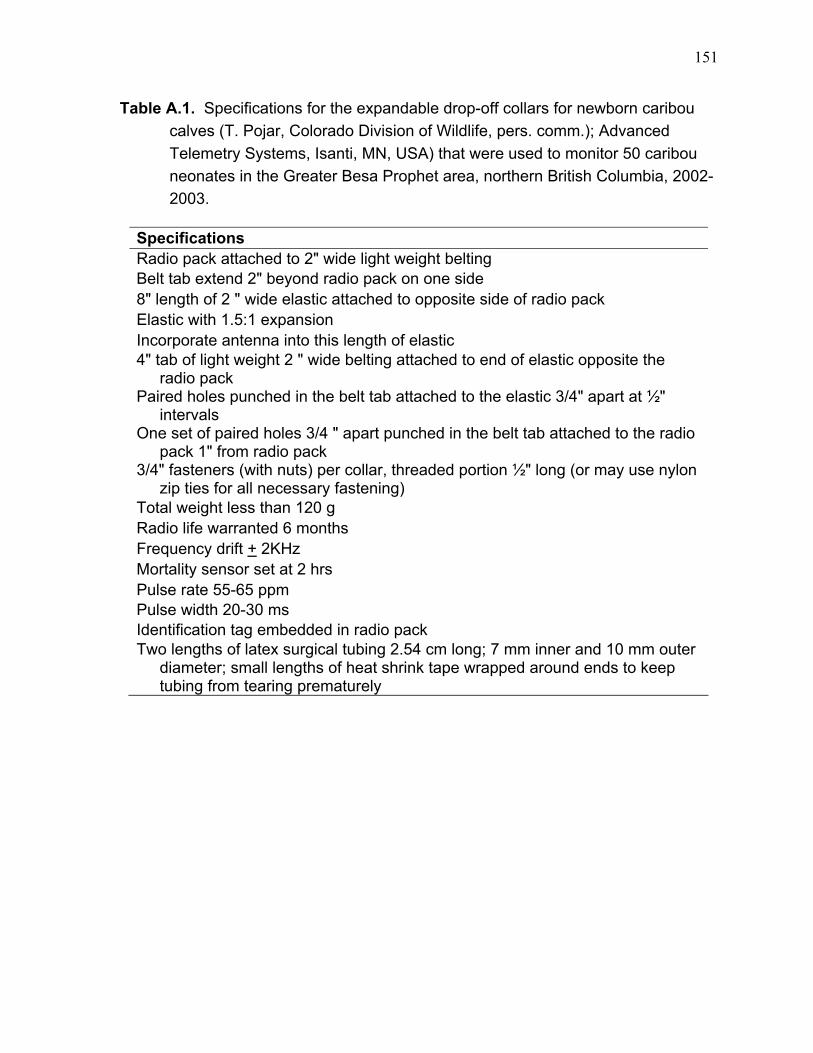
151
Table A.1. Specifications for the expandable drop-off collars for newborn caribou calves (T. Pojar, Colorado Division of Wildlife, pers. comm.); Advanced Telemetry Systems, Isanti, MN, USA) that were used to monitor 50 caribou neonates in the Greater Besa Prophet area, northern British Columbia, 2002-2003.
Specifications Radio pack attached to 2" wide light weight belting Belt tab extend 2" beyond radio pack on one side 8" length of 2 " wide elastic attached to opposite side of radio pack Elastic with 1.5:1 expansion Incorporate antenna into this length of elastic 4" tab of light weight 2 " wide belting attached to end of elastic opposite the
radio pack Paired holes punched in the belt tab attached to the elastic 3/4" apart at ½"
intervals One set of paired holes 3/4 " apart punched in the belt tab attached to the radio
pack 1" from radio pack 3/4" fasteners (with nuts) per collar, threaded portion ½" long (or may use nylon
zip ties for all necessary fastening) Total weight less than 120 g Radio life warranted 6 months Frequency drift + 2KHz Mortality sensor set at 2 hrs Pulse rate 55-65 ppm Pulse width 20-30 ms Identification tag embedded in radio pack Two lengths of latex surgical tubing 2.54 cm long; 7 mm inner and 10 mm outer
diameter; small lengths of heat shrink tape wrapped around ends to keep tubing from tearing prematurely

152
Surgical tubing (57 mm long with 7 mm inner and 10 mm outer diameter)
Heat shrink wrap to keep tubing from tearing
Small “tuck” (2.54 cm) in collar fabric; stitched very loosely with cotton thread
Leather belting of collar is cutfor drop-off mechanism
Figure A.1. Schematic of the expandable drop-off collar for neonatal caribou calves (T. Pojar, Colorado Division of
Wildlife; Advanced Telemetry Systems, Isanti, MN, USA) that was used to monitor 50 neonates in the Greater Besa Prophet area, northern British Columbia, 2002-2003.

153
Appendix B: Classification of habitats in the Greater Besa Prophet area, northern British Columbia.
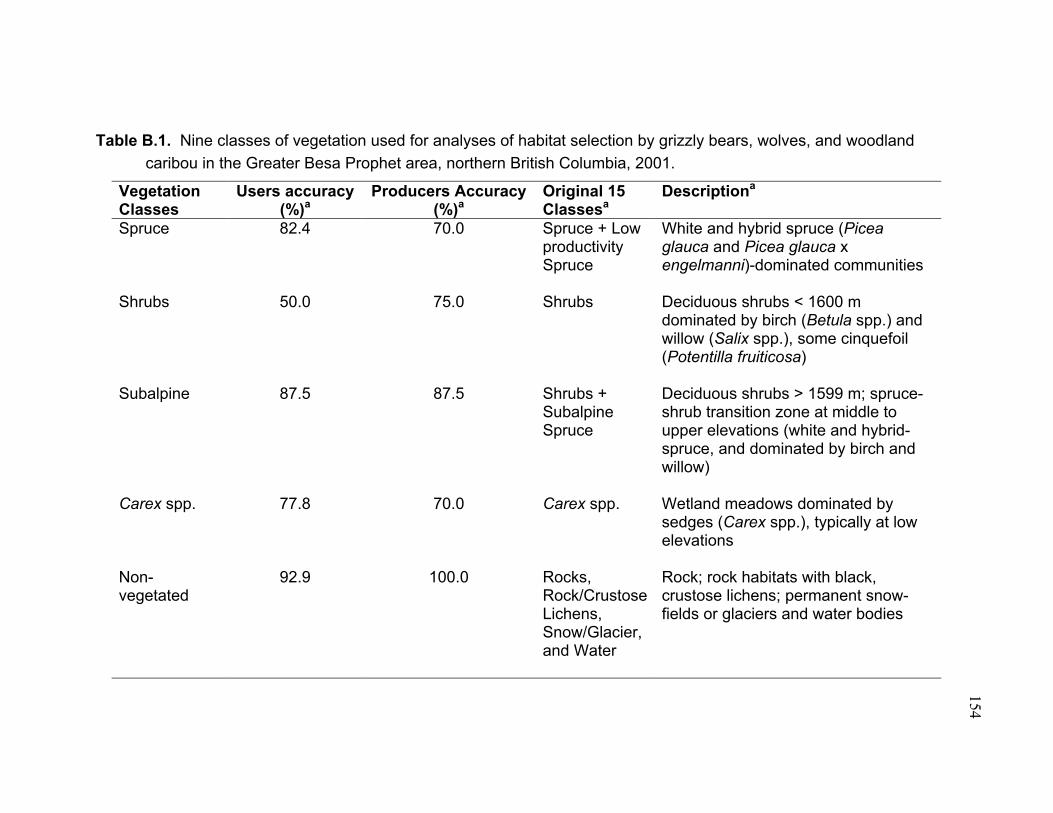
154
Table B.1. Nine classes of vegetation used for analyses of habitat selection by grizzly bears, wolves, and woodland caribou in the Greater Besa Prophet area, northern British Columbia, 2001.
Vegetation Classes
Users accuracy (%)a
Producers Accuracy (%)a
Original 15 Classesa
Descriptiona
Spruce 82.4 70.0 Spruce + Low productivity Spruce
White and hybrid spruce (Picea glauca and Picea glauca x engelmanni)-dominated communities
Shrubs 50.0 75.0 Shrubs Deciduous shrubs < 1600 m dominated by birch (Betula spp.) and willow (Salix spp.), some cinquefoil (Potentilla fruiticosa)
Subalpine 87.5 87.5 Shrubs + Subalpine Spruce
Deciduous shrubs > 1599 m; spruce-shrub transition zone at middle to upper elevations (white and hybrid-spruce, and dominated by birch and willow)
Carex spp. 77.8 70.0 Carex spp. Wetland meadows dominated by sedges (Carex spp.), typically at low elevations
Non-vegetated
92.9 100.0 Rocks, Rock/Crustose Lichens, Snow/Glacier, and Water
Rock; rock habitats with black, crustose lichens; permanent snow-fields or glaciers and water bodies

155
Table B.1. Continued. Vegetation Classes
Users accuracy (%)a
Producers Accuracy (%)a
Original Classesa
Descriptiona
Pine 60.0 60.0 Pine Lodgepole pine (Pinus contorta)-dominated communities
Riparian Spruce
78.3 90.0 Riparian Spruce and Gravel Bar
Low elevation, wet areas with black (Picea mariana) and hybrid spruce; often with standing water in spring and summer; exposed gravel bars adjacent to rivers and creeks
Alpine 94.1 80.0 Wet and Dry Alpine
Herbaceous alpine vegetation
Burned/ Disturbed
88.9 80.0 Burned/Disturbed Previously burned areas, grass, deciduous trees, or avalanche chutes
Overall Accuracy
83.9
aAs determined by R.J. Lay (University of Northern British Columbia, unpublished data).

156
Vegetation Classes
¯ Besa-Prophet Pre-tenure Planning Area
0 5 10 15 202.5Kilometers
Carex spp.
Non-vegetated
Pine
Riparian Spruce
Alpine
Burned/disturbedSubalpine
Shrubs
Spruce
Figure B.1. Nine habitats, as defined using a vegetation classification from an August 15, 2001 Landsat Enhanced Thematic Mapper image (see Table B.1), in the Greater Besa Prophet area, northern British Columbia.

157
Appendix C: Defining the risk of predation from grizzly bears (Ursus arctos) and wolves (Canis lupus) for female caribou during the calving and summer seasons in the Greater Besa Prophet area, northern British Columbia.
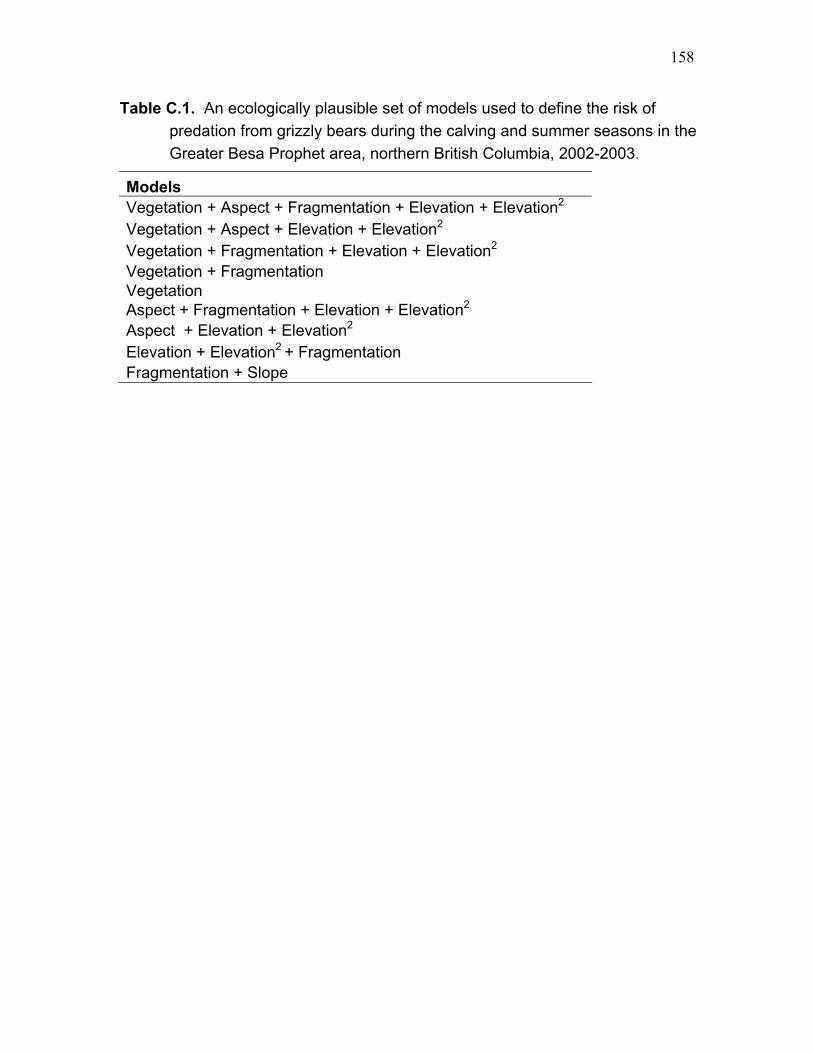
158
Table C.1. An ecologically plausible set of models used to define the risk of predation from grizzly bears during the calving and summer seasons in the Greater Besa Prophet area, northern British Columbia, 2002-2003.
Models Vegetation + Aspect + Fragmentation + Elevation + Elevation2 Vegetation + Aspect + Elevation + Elevation2 Vegetation + Fragmentation + Elevation + Elevation2 Vegetation + Fragmentation Vegetation Aspect + Fragmentation + Elevation + Elevation2 Aspect + Elevation + Elevation2 Elevation + Elevation2 + Fragmentation Fragmentation + Slope

159
Table C.2. Final pooled models of bear risk (based on locations from 15 female grizzly bears) by season and year in the Greater Besa Prophet area, northern British Columbia, 2002-2003 showing sample size (n), log-likelihood (LL), number of parameters (K), Akaike’s Information Criterion (AIC), change in AIC ( i∆ ), Akaike weights ( iw ), evidence ratios (Er), and average (n = 5) Spearman’s correlation coefficient from k-fold cross-validation ( sr ) with associated p-values (P).
Year Season Model n LL K AIC i∆a iw a Er
a srbc Pc
2002 Calving Vegetation + Fragmentation + Elevation + Elevation2
1986 -824.886 13 1675.773 0.000 0.954 1.00 0.90 < 0.001
Summerd Vegetation + Fragmentation + Elevation + Elevation2
6645 -2720.525 13 5467.050 0.000 0.508 1.00 0.95 < 0.001
Vegetation + Aspect + Fragmentation + Elevation + Elevation2
6645 -2716.638 17 5467.275 0.226 0.454 1.12 0.97 < 0.001
2003 Calving Vegetation + Aspect + Fragmentation + Elevation + Elevation2
4931 -2102.896 17 4239.791 0.000 0.994 1.00 0.91 < 0.001
Summer Vegetation + Aspect + Fragmentation + Elevation + Elevation2
10307 -4220.158 17 8474.316 0.000 0.999 1.00 0.97 < 0.001
aBurnham and Anderson (2002) bBoyce et al. (2002)
cSiegel (1956)
dModels were averaged

160
Table C.3. Coefficients of selection ( iβ and iβ for an averaged model from Table C.2) and standard errors (SE) of the covariates for the final pooled models of bear risk by season and year in the Greater Besa Prophet area, northern British Columbia, 2002-2003. Significant parameters are indicated by asterisk(s).
Covariates Calving 2002 Summer 2002 Calving 2003 Summer 2003 iβ ± SE iβ ± SE iβ ± SE iβ ± SE Elevation (km) 21.512 ± 5.193** 5.128 ± 1.537** 14.270 ± 2.439** 6.196 ± 1.130** Elevation2 (km) -7.088 ± 1.688** -1.608 ± 0.478** -4.836 ± 0.757** -2.238 ± 0.370** Low fragmentation -0.336 ± 0.106** -0.232 ± 0.047** -0.240 ± 0.066** -0.178 ± 0.045** Medium fragmentation -0.101 ± 0.091 0.037 ± 0.040 0.014 ± 0.056 0.126 ± 0.038** High fragmentation 0.437 ± 0.088** 0.196 ± 0.041** 0.226 ± 0.057** 0.053 ± 0.041 Slope (°) North 0.044 ± 0.036 -0.194 ± 0.101 0.182 ± 0.061* East -0.038 ± 0.034 -0.190 ± 0.095* -0.255 ± 0.059** South -0.067 ± 0.039 0.180 ± 0.087* -0.271 ± 0.059** West -0.059 ± 0.043 -0.118 ± 0.104 -0.083 ± 0.069 No aspect (flat) 0.120 ± 0.090 0.323 ± 0.256 0.427 ± 0.137* Spruce -0.037 ± 0.153 -0.186 ± 0.075* -0.094 ± 0.114 -0.453 ± 0.076** Shrubs -0.557 ± 0.289 0.322 ± 0.106* -0.375 ± 0.188* 0.317 ± 0.098** Subalpine -0.209 ± 0.175 0.618 ± 0.072** -0.031 ± 0.119 0.901 ± 0.070** Carex spp. 1.082 ± 0.439* 0.412 ± 0.186* -0.384 ± 0.368 -0.026 ± 0.189 Non-vegetated -0.315 ± 0.209 -1.323 ± 0.140** 0.511 ± 0.122** -0.879 ± 0.132** Pine -1.111 ± 0.478* -0.165 ± 0.154 -0.472 ± 0.243 -0.314 ± 0.154* Riparian spruce 1.146 ± 0.299** 0.319 ± 0.137* 0.169 ± 0.239 -0.115 ± 0.134 Alpine -0.226 ± 0.237 -0.527 ± 0.122** 0.207 ± 0.147 -0.258 ± 0.120* Burned/disturbed 0.227 ± 0.182 0.530 ± 0.083** 0.468 ± 0.120** 0.825 ± 0.078** *P < 0.05 **P < 0.001

161
Table C.4. An ecologically plausible set of models used to define the risk of predation from wolves in the Greater Besa Prophet area, northern British Columbia, 2002-2003. Models were developed for 5 wolf packs: pack 1 (Dopp-Keily), pack 2 (Lower Besa), pack 3 (Neves), pack 4 (Pocketknife), and pack 5 (Richards-Upper Prophet).
Models
Vegetation + Aspect + Fragmentation + Elevation + Elevation2
Vegetation + Aspect + Elevation + Elevation2
Vegetation + Fragmentation + Elevation + Elevation2
Vegetation + Fragmentation
Vegetation
Aspect + Elevation + Elevation2
Aspect + Fragmentation
Slope + Aspect
Elevation + Elevation2 + Fragmentation aVegetation + Fragmentation + Distance to Linear Features + Distance to Linear
Features2 aLinear Distance + Distance to Linear Features + Distance to Linear Features2 aVegetation + Distance to Linear Features + Distance to Linear Features2 aFragmentation + Distance to Linear Features + Distance to Linear Features2 aModels evaluated only for pack 4 which occurs on the eastern edge of the study area where linear features are present
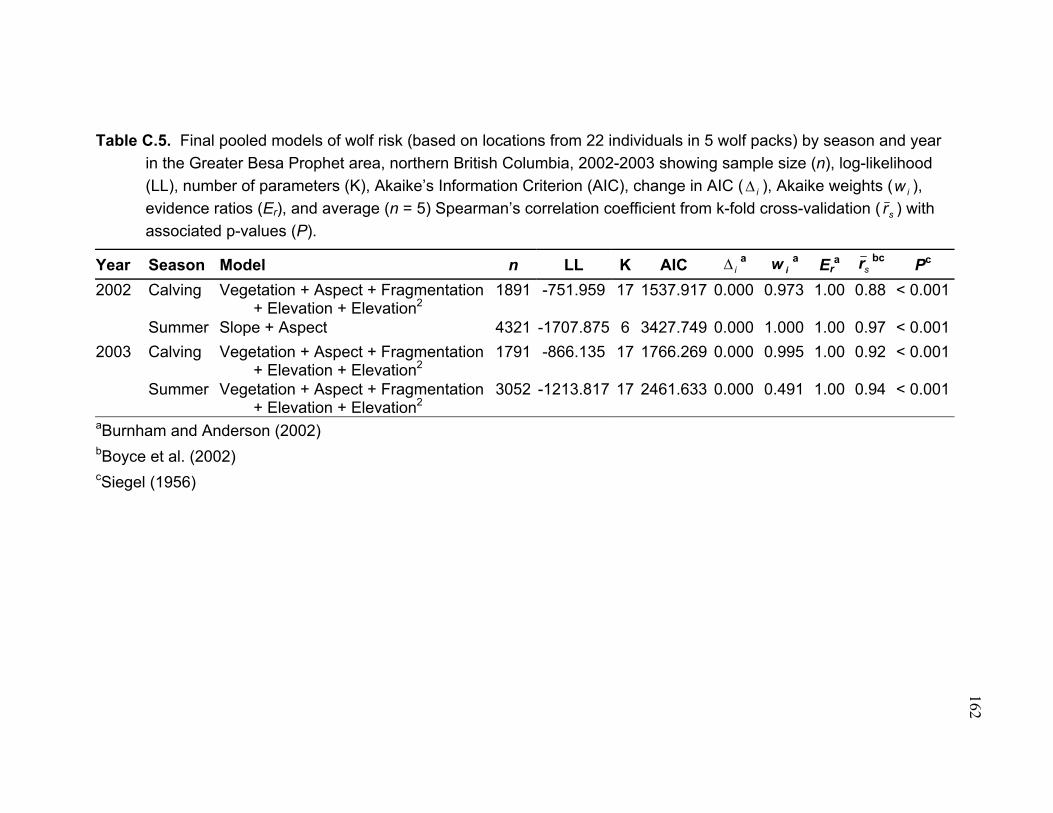
162
Table C.5. Final pooled models of wolf risk (based on locations from 22 individuals in 5 wolf packs) by season and year in the Greater Besa Prophet area, northern British Columbia, 2002-2003 showing sample size (n), log-likelihood (LL), number of parameters (K), Akaike’s Information Criterion (AIC), change in AIC ( i∆ ), Akaike weights ( iw ), evidence ratios (Er), and average (n = 5) Spearman’s correlation coefficient from k-fold cross-validation ( sr ) with associated p-values (P).
Year Season Model n LL K AIC i∆a iw a Er
a srbc Pc
2002 Calving Vegetation + Aspect + Fragmentation + Elevation + Elevation2
1891 -751.959 17 1537.917 0.000 0.973 1.00 0.88 < 0.001
Summer Slope + Aspect 4321 -1707.875 6 3427.749 0.000 1.000 1.00 0.97 < 0.0012003 Calving Vegetation + Aspect + Fragmentation
+ Elevation + Elevation2 1791 -866.135 17 1766.269 0.000 0.995 1.00 0.92 < 0.001
Summer Vegetation + Aspect + Fragmentation + Elevation + Elevation2
3052 -1213.817 17 2461.633 0.000 0.491 1.00 0.94 < 0.001
aBurnham and Anderson (2002) bBoyce et al. (2002)
cSiegel (1956)

163
Table C.6. Coefficients of selection ( iβ for models from Table C.5) and standard errors (SE) of the covariates for the final pooled models of wolf risk across packs by season and year in the Greater Besa Prophet area, northern British Columbia, 2002-2003. Significant parameters are indicated by asterisk(s).
Covariates Calving 2002 Summer 2002 Calving 2003 Summer 2003 iβ ± SE iβ ± SE iβ ± SE iβ ± SE Elevation (km) 7.234 ± 2.839* 6.812 ± 1.827** 4.647 ± 1.459** Elevation2 (km) -3.090 ± 1.056* -2.982 ± 0.740** -1.695 ± 0.566* Low fragmentation -0.374 ± 0.117* -0.368 ± 0.105** 0.001 ± 0.080 Medium fragmentation 0.192 ± 0.092* 0.244 ± 0.082* -0.156 ± 0.073* High fragmentation 0.182 ± 0.096 0.124 ± 0.087 0.155 ± 0.073* Slope (°) -0.089 ± -0.005** North -0.130 ± 0.128 0.371 ± 0.081** -0.373 ± 0.120* 0.024 ± 0.098 East -0.386 ± 0.131* 0.021 ± 0.082 -0.346 ± 0.122* -0.229 ± 0.104* South 0.219 ± 0.123 0.234 ± 0.085* 0.269 ± 0.109* -0.158 ± 0.102 West -0.546 ± 0.181* -0.410 ± 0.117** -0.270 ± 0.135* -0.018 ± 0.115 No aspect (flat) 0.843 ± 0.168** -0.216 ± 0.143 0.720 ± 0.177** 0.381 ± 0.164* Spruce -0.604 ± 0.184** -0.152 ± 0.15 -0.140 ± 0.135 Shrubs 0.659 ± 0.188** 0.864 ± 0.166** 1.087 ± 0.147** Subalpine -0.158 ± 0.262 0.130 ± 0.221 0.561 ± 0.137** Carex spp. 0.395 ± 0.234 0.329 ± 0.218 0.524 ± 0.202* Non-vegetated 0.171 ± 0.272 -0.115 ± 0.273 -1.558 ± 0.310** Pine -0.811 ± 0.304* -0.235 ± 0.265 -0.237 ± 0.224 Riparian spruce 0.215 ± 0.186 0.497 ± 0.182* 0.541 ± 0.173* Alpine 0.211 ± 0.361 -1.063 ± 0.496* -0.414 ± 0.259 Burned/disturbed -0.078 ± 0.193 -0.254 ± 0.195 -0.364 ± 0.209 * P < 0.05 ** P < 0.001
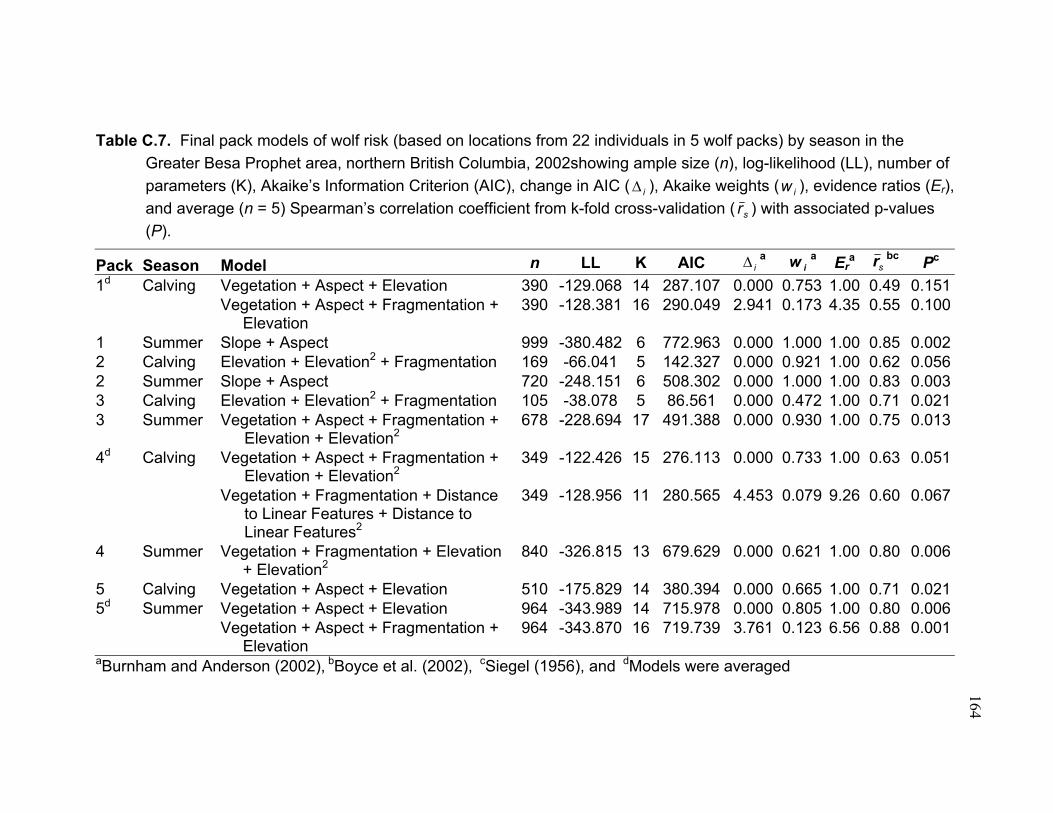
164
Table C.7. Final pack models of wolf risk (based on locations from 22 individuals in 5 wolf packs) by season in the Greater Besa Prophet area, northern British Columbia, 2002showing ample size (n), log-likelihood (LL), number of parameters (K), Akaike’s Information Criterion (AIC), change in AIC ( i∆ ), Akaike weights ( iw ), evidence ratios (Er), and average (n = 5) Spearman’s correlation coefficient from k-fold cross-validation ( sr ) with associated p-values (P).
Pack Season Model n LL K AIC i∆a iw a Er
asr
bc Pc 1d Calving Vegetation + Aspect + Elevation 390 -129.068 14 287.107 0.000 0.753 1.00 0.49 0.151 Vegetation + Aspect + Fragmentation +
Elevation 390 -128.381 16 290.049 2.941 0.173 4.35 0.55 0.100
1 Summer Slope + Aspect 999 -380.482 6 772.963 0.000 1.000 1.00 0.85 0.0022 Calving Elevation + Elevation2 + Fragmentation 169 -66.041 5 142.327 0.000 0.921 1.00 0.62 0.0562 Summer Slope + Aspect 720 -248.151 6 508.302 0.000 1.000 1.00 0.83 0.0033 Calving Elevation + Elevation2 + Fragmentation 105 -38.078 5 86.561 0.000 0.472 1.00 0.71 0.0213 Summer Vegetation + Aspect + Fragmentation +
Elevation + Elevation2 678 -228.694 17 491.388 0.000 0.930 1.00 0.75 0.013
4d Calving Vegetation + Aspect + Fragmentation + Elevation + Elevation2
349 -122.426 15 276.113 0.000 0.733 1.00 0.63 0.051
Vegetation + Fragmentation + Distance to Linear Features + Distance to Linear Features2
349 -128.956 11 280.565 4.453 0.079 9.26 0.60 0.067
4 Summer Vegetation + Fragmentation + Elevation + Elevation2
840 -326.815 13 679.629 0.000 0.621 1.00 0.80 0.006
5 Calving Vegetation + Aspect + Elevation 510 -175.829 14 380.394 0.000 0.665 1.00 0.71 0.0215d Summer Vegetation + Aspect + Elevation 964 -343.989 14 715.978 0.000 0.805 1.00 0.80 0.006 Vegetation + Aspect + Fragmentation +
Elevation 964 -343.870 16 719.739 3.761 0.123 6.56 0.88 0.001
aBurnham and Anderson (2002), bBoyce et al. (2002), cSiegel (1956), and dModels were averaged

165
Table C.8. Sample size (n), log-likelihood (LL), number of parameters (K), Akaike’s Information Criterion (AIC), change in AIC ( i∆ ), Akaike weights ( iw ), evidence ratios (Er), and average (n = 5) Spearman’s correlation coefficient from k-fold cross-validation ( sr ) with associated p-values (P) for the final pack models of wolf risk (based on locations from 22 individuals in 5 wolf packs) by season in the Greater Besa Prophet area, northern British Columbia, 2003.
Pack Season Model n LL K AIC i∆a iw a Er
asr
bc Pc 1 Calving Vegetation + Aspect + Fragmentation +
Elevation 522 -226.110 16 485.171 0.000 0.889 1.00 0.79 0.007
1d Summer Vegetation 809 -293.722 9 605.444 0.000 0.573 1.00 0.64 0.046 Vegetation + Fragmentation + Elevation +
Elevation2 809 -290.788 13 607.576 2.132 0.197 2.90 0.86 0.001
Vegetation + Aspect + Elevation + Elevation2 809 -289.257 15 608.513 3.069 0.124 4.64 0.88 0.0012d Calving Vegetation + Aspect + Elevation + Elevation2 346 -106.841 12 238.475 0.000 0.567 1.00 0.61 0.061 Vegetation + Fragmentation + Elevation +
Elevation2 346 -108.324 11 239.307 0.966 0.350 1.62 0.64 0.046
Vegetation + Aspect + Fragmentation + Elevation + Elevation2
346 -105.782 15 242.837 3.882 0.082 6.97 0.56 0.092
2 Summer Vegetation + Fragmentation + Elevation 406 -128.960 10 278.375 0.000 0.807 1.00 0.74 0.0143 Calving Vegetation + Fragmentation + Elevation +
Elevation2 238 -79.500 13 186.393 0.000 0.812 1.00 0.67 0.034
3 Summer Vegetation + Aspect + Elevation + Elevation2 564 -212.066 14 452.794 0.000 0.684 1.00 0.67 0.0344d Calving Vegetation + Aspect + Elevation + Elevation2 302 -143.091 13 313.265 0.000 0.644 1.00 0.58 0.079 Vegetation + Aspect + Fragmentation +
Elevation + Elevation2 302 -141.947 15 315.363 1.713 0.274 2.35 0.52 0.123
4 Summer Fragmentation + Distance to Linear Features + Distance to Linear Features 2
420 -176.011 4 360.080 0.000 0.684 1.00 0.69 0.027
5 Calving Elevation + Elevation2 + Fragmentation 357 -169.374 5 348.861 0.000 0.962 1.00 0.70 0.0245 Summer Vegetation + Fragmentation + Elevation +
Elevation2 779 -283.188 13 592.375 0.000 0.728 1.00 0.85 0.002
aBurnham and Anderson (2002), bBoyce et al. (2002), cSiegel (1956), and dmodels were averaged
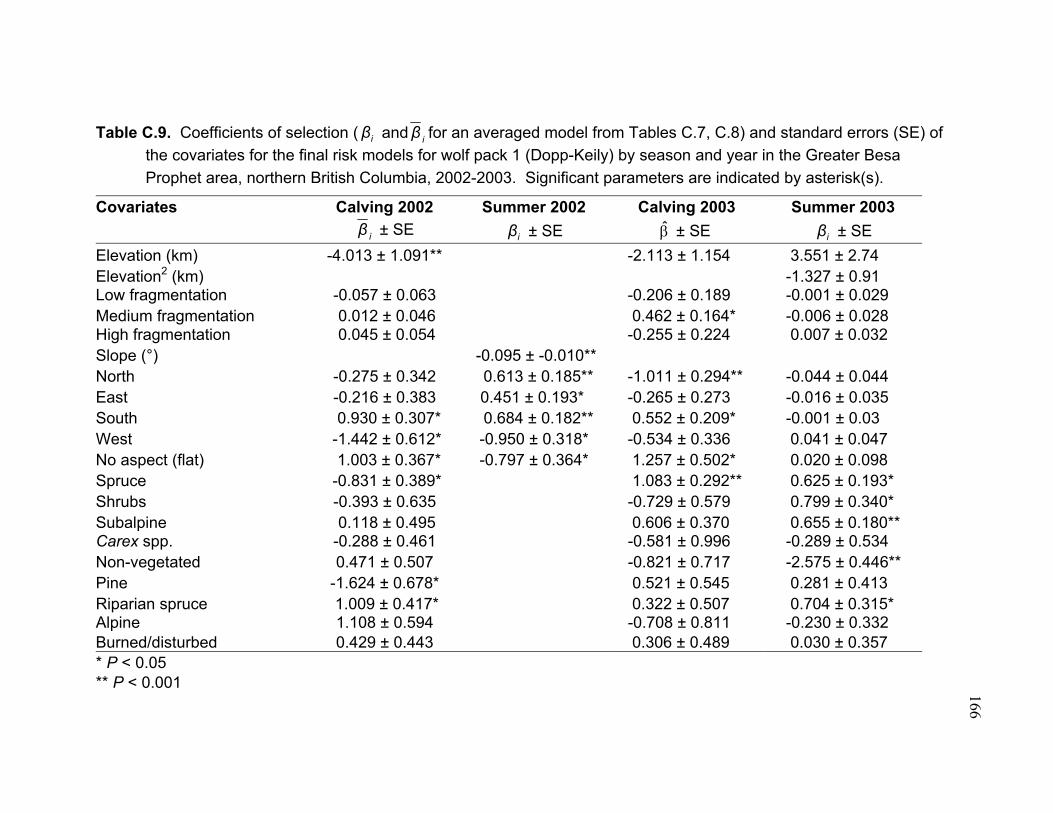
166
Table C.9. Coefficients of selection ( iβ and iβ for an averaged model from Tables C.7, C.8) and standard errors (SE) of the covariates for the final risk models for wolf pack 1 (Dopp-Keily) by season and year in the Greater Besa Prophet area, northern British Columbia, 2002-2003. Significant parameters are indicated by asterisk(s).
Covariates Calving 2002 Summer 2002 Calving 2003 Summer 2003 iβ ± SE iβ ± SE β̂ ± SE iβ ± SE Elevation (km) -4.013 ± 1.091** -2.113 ± 1.154 3.551 ± 2.74 Elevation2 (km) -1.327 ± 0.91 Low fragmentation -0.057 ± 0.063 -0.206 ± 0.189 -0.001 ± 0.029 Medium fragmentation 0.012 ± 0.046 0.462 ± 0.164* -0.006 ± 0.028 High fragmentation 0.045 ± 0.054 -0.255 ± 0.224 0.007 ± 0.032 Slope (°) -0.095 ± -0.010** North -0.275 ± 0.342 0.613 ± 0.185** -1.011 ± 0.294** -0.044 ± 0.044 East -0.216 ± 0.383 0.451 ± 0.193* -0.265 ± 0.273 -0.016 ± 0.035 South 0.930 ± 0.307* 0.684 ± 0.182** 0.552 ± 0.209* -0.001 ± 0.03 West -1.442 ± 0.612* -0.950 ± 0.318* -0.534 ± 0.336 0.041 ± 0.047 No aspect (flat) 1.003 ± 0.367* -0.797 ± 0.364* 1.257 ± 0.502* 0.020 ± 0.098 Spruce -0.831 ± 0.389* 1.083 ± 0.292** 0.625 ± 0.193* Shrubs -0.393 ± 0.635 -0.729 ± 0.579 0.799 ± 0.340* Subalpine 0.118 ± 0.495 0.606 ± 0.370 0.655 ± 0.180** Carex spp. -0.288 ± 0.461 -0.581 ± 0.996 -0.289 ± 0.534 Non-vegetated 0.471 ± 0.507 -0.821 ± 0.717 -2.575 ± 0.446** Pine -1.624 ± 0.678* 0.521 ± 0.545 0.281 ± 0.413 Riparian spruce 1.009 ± 0.417* 0.322 ± 0.507 0.704 ± 0.315* Alpine 1.108 ± 0.594 -0.708 ± 0.811 -0.230 ± 0.332 Burned/disturbed 0.429 ± 0.443 0.306 ± 0.489 0.030 ± 0.357 * P < 0.05 ** P < 0.001

167
Table C.10. Coefficients of selection ( iβ and iβ for an averaged model from Tables C.7, C.8) and standard errors (SE) of the covariates for the final risk models for wolf pack 2 (Lower Besa) by season and year in the Greater Besa Prophet area, northern British Columbia, 2002-2003. Significant parameters are indicated by asterisk(s).
Covariates Calving 2002 Summer 2002 Calving 2003 Summer 2003 iβ ± SE iβ ± SE iβ ± SE iβ ± SE
Elevation (km) -27.960 ± 10.267* -41.949 ± 7.320** -8.854 ± 1.358** Elevation2 (km) 9.267 ± 4.230 14.674 ± 3.044** Low fragmentation -0.315 ± 0.444 -0.041 ± 0.160 -0.135 ± 0.304 Medium fragmentation -0.537 ± 0.379 -0.006 ± 0.114 -0.335 ± 0.263 High fragmentation 0.852 ± 0.307* 0.046 ± 0.120 0.470 ± 0.214* Slope (°) -0.158 ± 0.021** North -0.239 ± 0.222 -0.391 ± 0.234 East 0.305 ± 0.195 -0.077 ± 0.182 South 0.600 ± 0.232* -0.030 ± 0.236 West -0.561 ± 0.304 0.293 ± 0.198 No aspect (flat) -0.104 ± 0.346 0.206 ± 0.232 Spruce -0.909 ± 0.357* -0.030 ± 0.347 Shrubs 1.623 ± 0.566* 1.153 ± 0.366* Subalpine Carex spp. -0.478 ± 0.401 -0.587 ± 0.408 Non-vegetated -1.359 ± 1.156 Pine 1.359 ± 0.591* -0.303 ± 1.005 Riparian spruce 0.523 ± 0.385 0.455 ± 0.353 Alpine Burned/disturbed -0.759 ± 0.484 -0.688 ± 0.551 * P < 0.05 ** P < 0.001
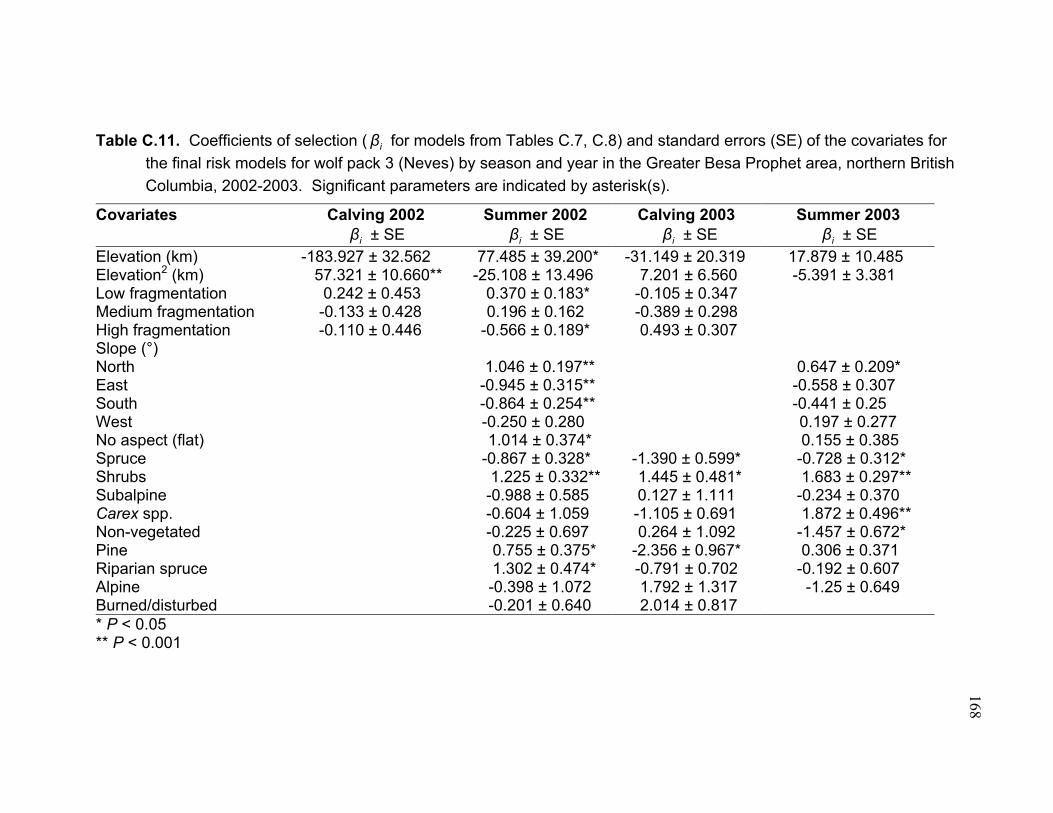
168
Table C.11. Coefficients of selection ( iβ for models from Tables C.7, C.8) and standard errors (SE) of the covariates for the final risk models for wolf pack 3 (Neves) by season and year in the Greater Besa Prophet area, northern British Columbia, 2002-2003. Significant parameters are indicated by asterisk(s).
Covariates Calving 2002 Summer 2002 Calving 2003 Summer 2003 iβ ± SE iβ ± SE iβ ± SE iβ ± SE Elevation (km) -183.927 ± 32.562 77.485 ± 39.200* -31.149 ± 20.319 17.879 ± 10.485 Elevation2 (km) 57.321 ± 10.660** -25.108 ± 13.496 7.201 ± 6.560 -5.391 ± 3.381 Low fragmentation 0.242 ± 0.453 0.370 ± 0.183* -0.105 ± 0.347 Medium fragmentation -0.133 ± 0.428 0.196 ± 0.162 -0.389 ± 0.298 High fragmentation -0.110 ± 0.446 -0.566 ± 0.189* 0.493 ± 0.307 Slope (°) North 1.046 ± 0.197** 0.647 ± 0.209* East -0.945 ± 0.315** -0.558 ± 0.307 South -0.864 ± 0.254** -0.441 ± 0.25 West -0.250 ± 0.280 0.197 ± 0.277 No aspect (flat) 1.014 ± 0.374* 0.155 ± 0.385 Spruce -0.867 ± 0.328* -1.390 ± 0.599* -0.728 ± 0.312* Shrubs 1.225 ± 0.332** 1.445 ± 0.481* 1.683 ± 0.297** Subalpine -0.988 ± 0.585 0.127 ± 1.111 -0.234 ± 0.370 Carex spp. -0.604 ± 1.059 -1.105 ± 0.691 1.872 ± 0.496** Non-vegetated -0.225 ± 0.697 0.264 ± 1.092 -1.457 ± 0.672* Pine 0.755 ± 0.375* -2.356 ± 0.967* 0.306 ± 0.371 Riparian spruce 1.302 ± 0.474* -0.791 ± 0.702 -0.192 ± 0.607 Alpine -0.398 ± 1.072 1.792 ± 1.317 -1.25 ± 0.649 Burned/disturbed -0.201 ± 0.640 2.014 ± 0.817 * P < 0.05 ** P < 0.001

169
Table C.12. Coefficients of selection ( iβ and iβ for an averaged model from Tables C.7, C.8) and standard errors (SE) of the covariates for the final risk models for wolf pack 4 (Pocketknife) by season and year in the Greater Besa Prophet area, northern British Columbia, 2002-2003. Significant parameters are indicated by asterisk(s).
Covariates Calving 2002 Summer 2002 Calving 2003 Summer 2003 iβ ± SE iβ ± SE iβ ± SE iβ ± SE Elevation (km) 45.017 ± 21.275* -3.778 ± 8.080 13.712 ± 8.067 Elevation2 (km) -20.024 ± 9.509* 0.802 ± 3.363 -4.854 ± 3.712 Linear distance (km) -0.090 ± 0.053 -0.199 ± 0.042** Linear distance2 (km) 0.048 ± 0.016* Low fragmentation -0.871 ± 0.338* -1.011 ± 0.227** -0.086 ± 0.092 -0.669 ± 0.270* Medium fragmentation 0.297 ± 0.241 0.228 ± 0.157 0.076 ± 0.068 0.191 ± 0.200 High fragmentation 0.616 ± 0.218* 0.782 ± 0.158** 0.010 ± 0.063 0.478 ± 0.196* Slope (°) North 0.128 ± 0.265 0.307 ± 0.250 East -0.045 ± 0.239 -0.586 ± 0.304 South -0.516 ± 0.370 -0.556 ± 0.329 West -1.059 ± 0.429* -0.143 ± 0.349 No aspect (flat) 1.536 ± 0.323** 0.978 ± 0.300* Spruce -0.261 ± 0.395 -0.580 ± 0.327 0.775 ± 0.469 Shrubs 1.527 ± 0.487* 0.834 ± 0.368* 0.873 ± 0.401* Subalpine 0.078 ± 1.162 Carex spp. 0.033 ± 0.450 0.679 ± 0.361 0.988 ± 0.383* Non-vegetated 1.086 ± 0.908 -0.979 ± 0.805 -0.204 ± 0.973 Pine -1.619 ± 0.807* -0.241 ± 0.407 0.146 ± 0.554 Riparian spruce -0.383 ± 0.345 0.311 ± 0.353 0.625 ± 0.392 Alpine 0.204 ± 0.855 Burned/disturbed -0.529 ± 0.671 -0.307 ± 0.424 -1.654 ± 0.899 * P < 0.05 ** P < 0.001
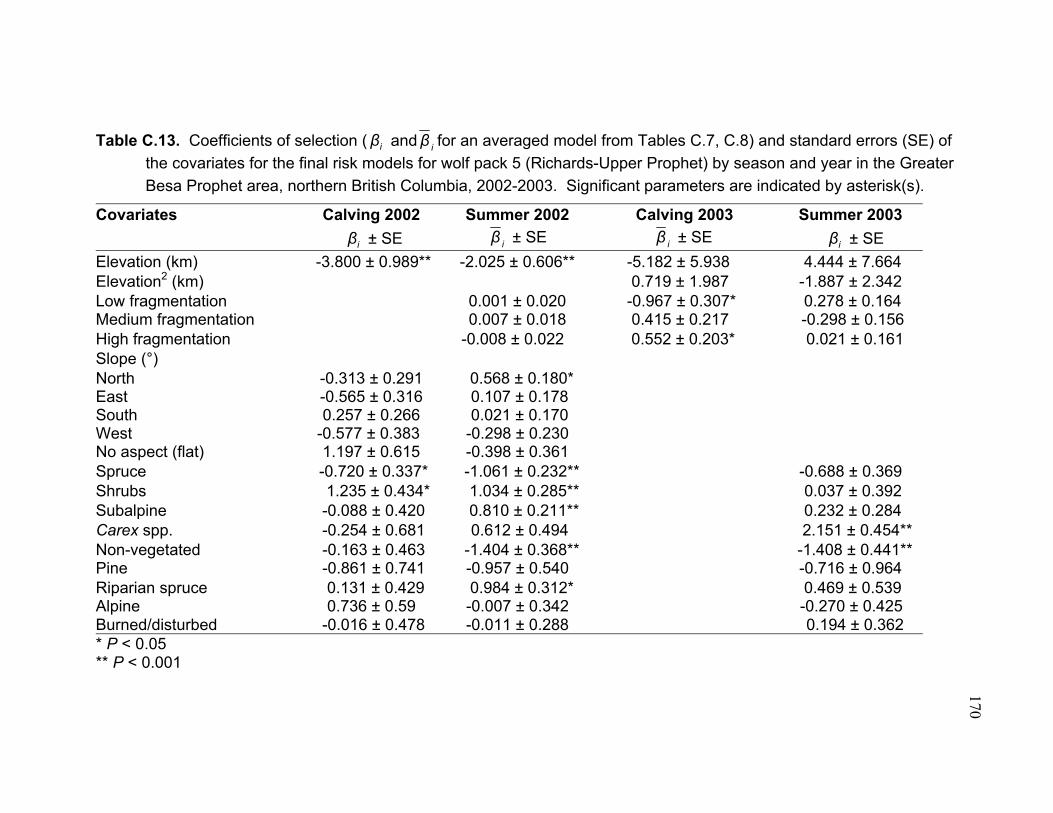
170
Table C.13. Coefficients of selection ( iβ and iβ for an averaged model from Tables C.7, C.8) and standard errors (SE) of the covariates for the final risk models for wolf pack 5 (Richards-Upper Prophet) by season and year in the Greater Besa Prophet area, northern British Columbia, 2002-2003. Significant parameters are indicated by asterisk(s).
Covariates Calving 2002 Summer 2002 Calving 2003 Summer 2003 iβ ± SE iβ ± SE iβ ± SE iβ ± SE Elevation (km) -3.800 ± 0.989** -2.025 ± 0.606** -5.182 ± 5.938 4.444 ± 7.664 Elevation2 (km) 0.719 ± 1.987 -1.887 ± 2.342 Low fragmentation 0.001 ± 0.020 -0.967 ± 0.307* 0.278 ± 0.164 Medium fragmentation 0.007 ± 0.018 0.415 ± 0.217 -0.298 ± 0.156 High fragmentation -0.008 ± 0.022 0.552 ± 0.203* 0.021 ± 0.161 Slope (°) North -0.313 ± 0.291 0.568 ± 0.180* East -0.565 ± 0.316 0.107 ± 0.178 South 0.257 ± 0.266 0.021 ± 0.170 West -0.577 ± 0.383 -0.298 ± 0.230 No aspect (flat) 1.197 ± 0.615 -0.398 ± 0.361 Spruce -0.720 ± 0.337* -1.061 ± 0.232** -0.688 ± 0.369 Shrubs 1.235 ± 0.434* 1.034 ± 0.285** 0.037 ± 0.392 Subalpine -0.088 ± 0.420 0.810 ± 0.211** 0.232 ± 0.284 Carex spp. -0.254 ± 0.681 0.612 ± 0.494 2.151 ± 0.454** Non-vegetated -0.163 ± 0.463 -1.404 ± 0.368** -1.408 ± 0.441** Pine -0.861 ± 0.741 -0.957 ± 0.540 -0.716 ± 0.964 Riparian spruce 0.131 ± 0.429 0.984 ± 0.312* 0.469 ± 0.539 Alpine 0.736 ± 0.59 -0.007 ± 0.342 -0.270 ± 0.425 Burned/disturbed -0.016 ± 0.478 -0.011 ± 0.288 0.194 ± 0.362 * P < 0.05 ** P < 0.001

171
Appendix D: Modelling the Normalized Difference Vegetation Index during the calving and summer seasons in the Greater Besa Prophet area, northern British Columbia.
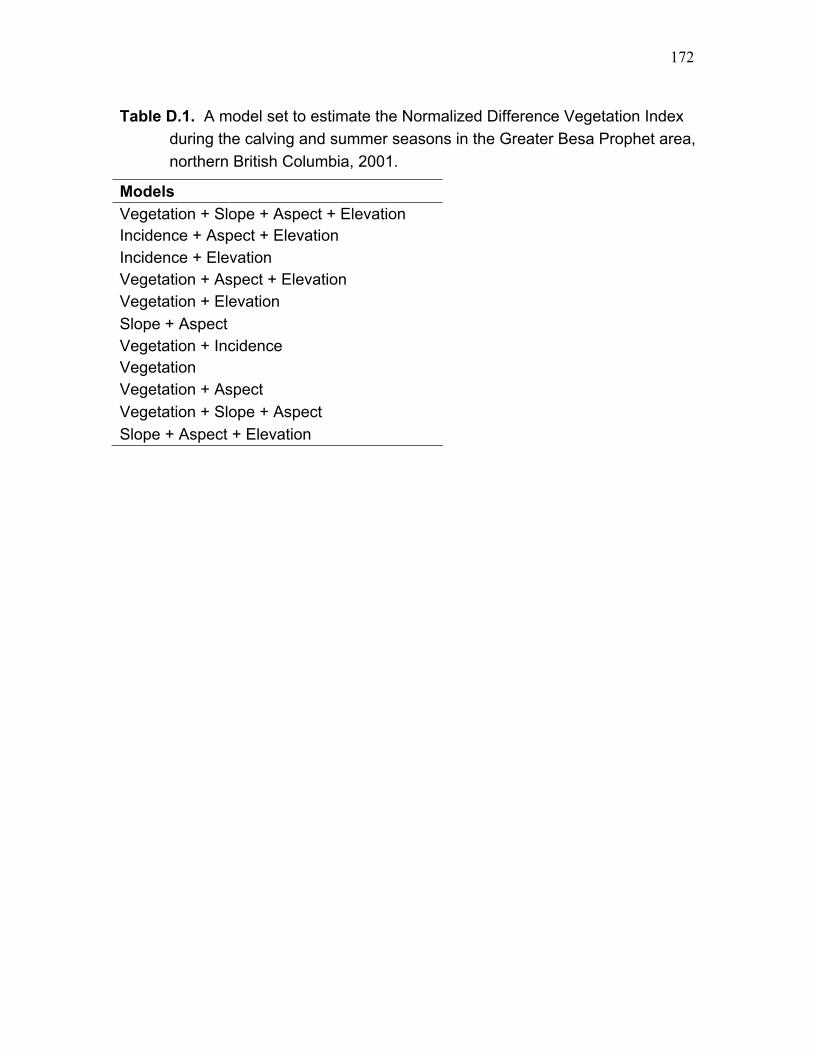
172
Table D.1. A model set to estimate the Normalized Difference Vegetation Index during the calving and summer seasons in the Greater Besa Prophet area, northern British Columbia, 2001.
Models Vegetation + Slope + Aspect + Elevation Incidence + Aspect + Elevation Incidence + Elevation Vegetation + Aspect + Elevation Vegetation + Elevation Slope + Aspect Vegetation + Incidence Vegetation Vegetation + Aspect Vegetation + Slope + Aspect Slope + Aspect + Elevation
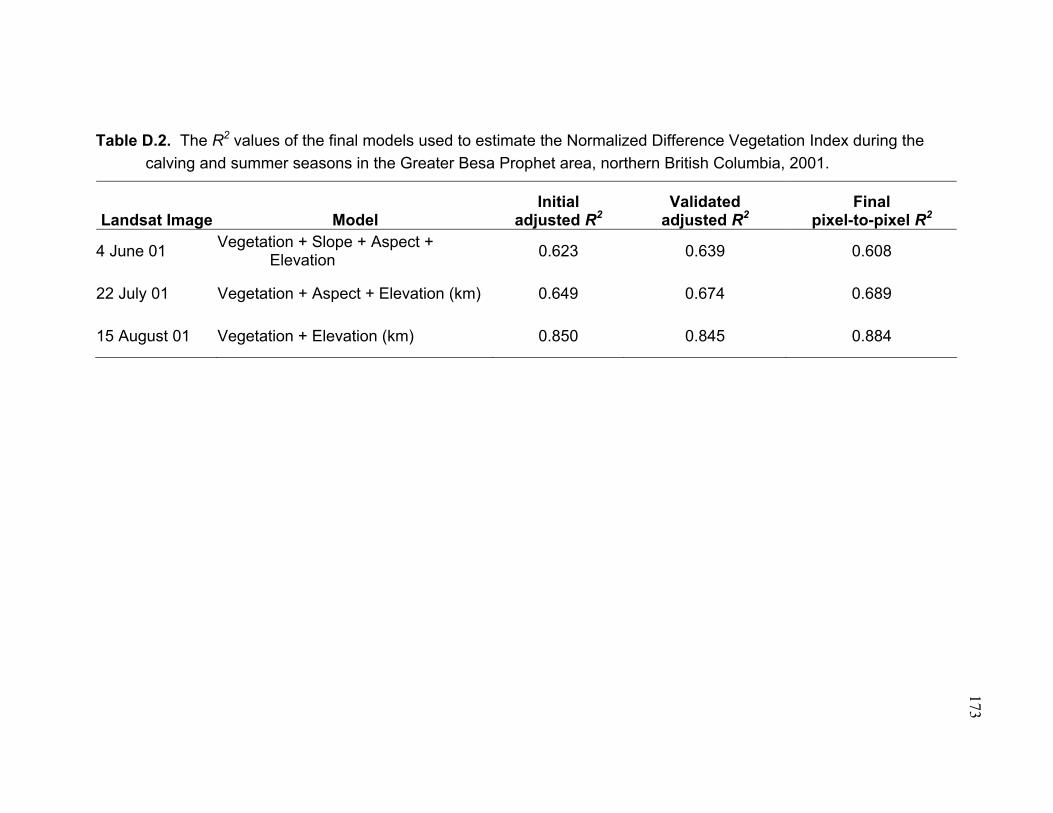
173
Table D.2. The R2 values of the final models used to estimate the Normalized Difference Vegetation Index during the calving and summer seasons in the Greater Besa Prophet area, northern British Columbia, 2001.
Landsat Image Model Initial
adjusted R2 Validated
adjusted R2 Final
pixel-to-pixel R2
4 June 01 Vegetation + Slope + Aspect + Elevation 0.623 0.639 0.608
22 July 01 Vegetation + Aspect + Elevation (km) 0.649 0.674 0.689
15 August 01 Vegetation + Elevation (km) 0.850 0.845 0.884

174
Table D.3. Coefficients of selection ( iβ for a model from Table D.2) and standard errors (SE) of the covariates of the multiple regression models for each Landsat image to estimate the Normalized Difference Vegetation Index during the calving and summer seasons in the Greater Besa Prophet area, northern British Columbia, 2002-2003. Significant parameters are indicated by asterisk(s).
Covariates 4 June 2001 22 July 2001 15 August 2001 iβ ± SE iβ ± SE iβ ± SE Elevation (km) -0.118 ± 0.010** -0.102 ± 0.008** -0.054 ± 0.007** Slope (°) -0.002 ± 0.0002** North -0.038 ± 0.005** -0.001 ± 0.004 East 0.023 ± 0.004** 0.008 ± 0.003* South 0.03 ± 0.005** 0.015 ± 0.004** West 0.004 ± 0.004 -0.003 ± 0.004 No aspect -0.018 ± 0.009* -0.019 ± 0.006** Carex spp. 0.096 ± 0.011** 0.107 ± 0.008** 0.134 ± 0.008** Shrubs -0.012 ± 0.007 0.188 ± 0.007** 0.222 ± 0.006** Low productivity spruce 0.105 ± 0.010** 0.062 ± 0.008** 0.061 ± 0.007** Gravel bar -0.216 ± 0.027** -0.171 ± 0.018** -0.117 ± 0.020** Rocks -0.029 ± 0.008** -0.215 ± 0.009** -0.243 ± 0.006** Rocks/crustose lichens -0.077 ± 0.032* -0.145 ± 0.034** -0.162 ± 0.033** Snow/glacier 0.140 ± 0.019** -0.174 ± 0.025** -0.354 ± 0.015** Water -0.302 ± 0.036** -0.272 ± 0.053** -0.437 ± 0.022** Pine 0.116 ± 0.012** 0.097 ± 0.009** 0.122 ± 0.008** Subalpine spruce 0.04 ± 0.012** 0.182 ± 0.014** 0.196 ± 0.007** Spruce 0.105 ± 0.007** 0.058 ± 0.007** 0.086 ± 0.005** Riparian spruce 0.082 ± 0.009** 0.048 ± 0.007** 0.071 ± 0.007** Dry alpine -0.019 ± 0.011 0.090 ± 0.011** 0.116 ± 0.009** Moist alpine -0.042 ± 0.017* 0.058 ± 0.021** 0.112 ± 0.012**

175
Table D.3. Continued.
Covariates 4 June 2001 22 July 2001 15 August 2001 iβ ± SE iβ ± SE iβ ± SE Burned/disturbed 0.053 ± 0.008** 0.189 ± 0.007** 0.240 ± 0.006** Rock-vegetation transition zone -0.041 ± 0.011** -0.103 ± 0.012** -0.047 ± 0.008** Intercept 0.307 ± 0.014** 0.415 ± 0.012** 0.306 ± 0.011** * P < 0.050 ** P < 0.001

176
Appendix E: Data (age, sex, weight, calving area, and method and date of capture) from the capture of neonatal caribou calves in the Greater Besa Prophet area, northern British Columbia, 2002-2003.

177
Table E.1. Animal identification (ID), date of capture, sex (male (M) and female (F)), and estimates for the date of birth (DOB), age (days), and weight (kg) of newborn caribou calves captured by hand and by net-gun in the Foothills (FTHILLS), Western High Country (WHC), and North Prophet (NP) calving areas within the Greater Besa Prophet area, northern British Columbia, 2002-2003.
ID Capture Date Sex DOB Age (days) Weight (kg) Capture Method Calving Area C01C 31-May-02 F 27-May-02 4.0 10.50 Hand FTHILLS C02C 31-May-02 F 29-May-02 2.0 10.00 Hand FTHILLS C03C 31-May-02 F 29-May-02 2.0 9.50 Hand FTHILLS C04C 1-Jun-02 M 29-May-02 2.5 8.50 Hand WHC C05C 1-Jun-02 F 27-May-02 5.0 9.50 Hand NP C06C 1-Jun-02 F 30-May-02 2.0 6.75 Hand WHC C07C 2-Jun-02 F 30-May-02 3.0 8.50 Hand FTHILLS C08C 2-Jun-02 M 1-Jun-02 0.5 7.25 Hand FTHILLS C09C 2-Jun-02 M 28-May-02 4.5 10.75 Hand NP C10C 2-Jun-02 M 29-May-02 4.0 9.75 Hand NP C11C 2-Jun-02 F 1-Jun-02 0.5 6.75 Hand FTHILLS C12C 2-Jun-02 F 1-Jun-02 1.0 6.75 Hand FTHILLS C13C 2-Jun-02 F 2-Jun-02 0.5 7.25 Hand FTHILLS C14C 3-Jun-02 F 31-May-02 2.5 8.75 Hand WHC C15C 4-Jun-02 M 29-May-02 6.0 12.75 Net gun WHC C16C 4-Jun-02 F 1-Jun-02 3.0 9.00 Net gun WHC C17C 4-Jun-02 M 1-Jun-02 3.0 9.00 Net gun WHC C18C 4-Jun-02 M 31-May-02 4.0 11.75 Net gun FTHILLS C19C 4-Jun-02 F 1-Jun-02 3.0 8.75 Net gun FTHILLS C20C 4-Jun-02 F 29-May-02 6.0 13.00 Net gun FTHILLS C21C 4-Jun-02 M 31-May-02 3.5 8.50 Net gun WHC C22C 4-Jun-02 M 31-May-02 4.0 10.00 Net gun WHC C23C 4-Jun-02 F 1-Jun-02 2.5 11.00 Net gun WHC

178
Table E.1 . Continued.
ID Capture Date Sex DOB Age (days) Weight (kg) Capture Method Calving Area C24C 4-Jun-02 F 29-May-02 6.0 13.50 Net gun WHC C25C 4-Jun-02 F 1-Jun-02 3.0 8.75 Net gun WHC C26C 28-May-03 M 27-May-03 1.0 7.25 Hand WHC C27C 28-May-03 F 25-May-03 2.5 8.75 Net gun WHC C28C 28-May-03 F 25-May-03 2.5 10.50 Net gun WHC C29C 28-May-03 F 25-May-03 2.5 8.00 Net gun FTHILLS C30C 29-May-03 F 25-May-03 4.0 11.00 Net gun FTHILLS C31C 29-May-03 F 25-May-03 3.5 8.50 Net gun FTHILLS C32C 29-May-03 M 27-May-03 1.5 8.75 Net gun FTHILLS C33C 29-May-03 F 25-May-03 3.5 9.75 Net gun WHC C34C 29-May-03 M 26-May-03 2.5 9.00 Net gun WHC C35C 29-May-03 M 26-May-03 3.0 10.25 Net gun FTHILLS C36C 29-May-03 F 26-May-03 3.0 10.25 Net gun FTHILLS C37C 29-May-03 M 26-May-03 3.0 13.00 Net gun FTHILLS C38C 30-May-03 M 28-May-03 1.5 7.00 Net gun FTHILLS C39C 30-May-03 F 27-May-03 2.5 8.00 Net gun NP C40C 30-May-03 F 27-May-03 2.5 8.75 Net gun NP C41C 30-May-03 F 27-May-03 2.5 7.50 Net gun NP C42C 30-May-03 M 28-May-03 1.5 6.00 Net gun NP C43C 30-May-03 F 26-May-03 3.5 9.00 Net gun NP C44C 30-May-03 M 27-May-03 2.5 9.00 Net gun NP C45C 30-May-03 M 27-May-03 2.5 8.75 Hand NP C46C 31-May-03 F 27-May-03 4.0 8.75 Net gun WHC C47C 31-May-03 F 28-May-03 3.0 9.00 Hand WHC C48C 31-May-03 F 29-May-03 2.0 13.50 Net gun WHC C49C 31-May-03 F 27-May-03 3.5 13.50 Net gun FTHILLS C50C 31-May-03 M 26-May-03 6.0 19.00 Net gun FTHILLS
179
Appendix F: Summary of vegetative (line-intercept and plot) data at calving sites of woodland caribou in the Greater Besa Prophet area, northern British Columbia, 2002-2003.

180
Table F.1. Percent cover and density of vegetation by functional group and species and biomass of lichens ( x ± SE) using line-intercept and plot data at calving sites of woodland caribou in the Greater Besa Prophet area, northern British Columbia, 2002-2003.
Functional Group Species 2002 2003 Cover (%) Density (per m2)
or Lichen Biomass (g/m2)
Cover (%) Density (per m2)or Lichen
Biomass (g/m2)Line-Intercept Data Trees Abies lasiocarpa (krummholz) 0.54 ± 0.54 Picea glauca x engelmanni 3.71 ± 2.74 0.14 ± 0.11 Picea mariana 0.47 ± 0.25 0.31 ± 0.18 Shrubs Alnus spp. 0.10 ± 0.10 Betula glandulosa 10.56 ± 4.21 3.10 ± 1.16 Betula glandulosa mix (Salix spp.
and Juniperus spp.) 0.10 ± 0.10 0.97 ± 0.81
Juniperus spp. 0.06 ± 0.06 0.07 ± 0.05 Ledum groenlandicum 0.10 ± 0.10 0.30 ± 0.30 Salix spp. 5.55 ± 2.70 16.89 ± 4.62 Dwarf Shrubs Cassiope mertensiana 1.91 ± 0.71 1.02 ± 0.59 Dryas integrifolia 24.44 ± 5.04 15.89 ± 3.97 Dryas integrifolia mix (Vaccinium
spp. and Salix reticulata) 7.02 ± 4.18 0.27 ± 0.16
Other 14.67 ± 7.32 36.61 ± 11.09 Plot Data Forbs Anemone spp. 0.54 ± 0.30 3.12 ± 1.32 0.34 ± 0.16 1.14 ± 0.53 Antennaria spp. 0.52 ± 0.28 2.49 ± 1.11 0.12 ± 0.06 0.63 ± 0.38 Astragalus alpinus 0.42 ± 0.28 3.99 ± 2.66 0.04 ± 0.04 0.10 ± 0.07

181
Table F.1. Continued.
2002 2003 Functional Group Species Cover (%) Density (per m2)
or Lichen Biomass (g/m2)
Cover (%) Density (per m2)or Lichen
Biomass (g/m2)Forbs Epilobium angustifolium 0.56 ± 0.28 1.10 ± 0.52 0.40 ± 0.32 0.77 ± 0.59 Hedysarum spp. 0.50 ± 0.38 0.96 ± 0.59 1.28 ± 0.68 1.13 ± 0.45 Lupinus arcticus 5.14 ± 1.78 3.94 ± 1.16 3.58 ± 1.26 1.60 ± 0.48 Mertensia paniculata 0.76 ± 0.44 1.78 ± 0.80 0.16 ± 0.10 0.43 ± 0.23 Oxytropis spp. 0.58 ± 0.42 0.68 ± 0.47 0.74 ± 0.32 1.50 ± 0.60 Pedicularis spp. 0.98 ± 0.28 9.72 ± 4.16 1.10 ± 0.42 4.10 ± 1.44 Polemonium spp. 0.54 ± 0.28 1.63 ± 0.70 0.46 ± 0.22 0.80 ± 0.38 Potentilla spp. 1.42 ± 0.62 4.72 ± 2.23 0.54 ± 0.24 1.47 ± 0.60 Saxifraga spp. 1.94 ± 1.50 1.32 ± 0.73 0.46 ± 0.24 0.92 ± 0.51 Silene acaulis 1.30 ± 0.54 1.65 ± 0.59 1.28 ± 0.68 0.67 ± 0.20 Solidago spp. 0.76 ± 0.42 1.93 ± 0.79 0.28 ± 0.14 0.87 ± 0.36 Other 0.06 ± 0.06 0.68 ± 0.54 0.18 ± 0.10 1.44 ± 0.78 Grasses and Grass-
likes Carex spp. 5.56 ± 1.36 43.72 ± 13.23 7.3 ± 2.48 42.93 ± 14.08 Equisetum spp. 1.48 ± 1.04 13.69 ± 9.20 2.40 ± 1.04 41.00 ± 18.50 Festuca spp. 12.46 ± 3.56 5.56 ± 1.07 7.38 ± 1.98 4.10 ± 0.92 Poa spp. 1.54 ± 0.94 3.06 ± 0.94 0.06 ± 0.04 0.70 ± 0.44 Other 0.01 ± 0.01 0.07 ± 0.07 0.58 ± 0.36 2.30 ± 1.14 Lichens Cladina spp. and Cladonia spp. 0.73 ± 0.14 0.43 ± 0.08 Other 42.2 ± 4.87 30.47 ± 5.43

182
Appendix G: Evaluating the relationship between percent cover and biomass of lichens at calving sites of woodland caribou in the Greater Besa Prophet area, northern British Columbia, 2002-2003.

183
Cover (%)
0.0 5.0 10.0 15.0 20.0 25.0 30.0
Bio
mas
s of
Cla
dina
spp
. (g/
m2 )
0.0
1.0
2.0
3.0
4.0
5.0
6.0y = 0.029 + 0.121x
r2
= 0.717
0.0 5.0 10.0 15.0 20.0 25.0 30.0
Lich
en B
iom
ass
(g/m
2 )
0.0
1.0
2.0
3.0
4.0
5.0
6.0y = 0.198 + 0.108x
r2
= 0.246
Figure G.1. Relationship between ocular estimates of percent cover and measured samples of air-dried biomass for a) all lichen species and b) Cladina spp. at calving sites of woodland caribou in the Greater Besa Prophet area, northern British Columbia, 2002-2003.
a)
b)
y = 0.198 + 0.108x r2 = 0.25 P < 0.001
y = 0.029 + 0.121x r2 = 0.72 P < 0.001

184
Appendix H: Reproductive status and ultrasound measurements of back fat for woodland caribou in the Greater Besa Prophet area, northern British Columbia, winters 2002-2004.

185
Table H.1. Reproductive status and ultrasound estimates of back fat for female woodland caribou in the Greater Besa Prophet area in northern British Columbia, 2002-2004; pregnancy for 38A was confirmed via necropsy and A = adult and Y = yearling.
Caribou Capture
Date Progesterone
(ng/ml) Reproductive
Status General Location Age
Class Back Fat
(cm) Body Fat
(%)a 26A 10-Feb-03 4.7 Pregnant Klingzut Mountain A 0.3 6.44 27A 10-Feb-03 4.3 Pregnant Besa-Townsley Flat Mountain A 0.1 5.99 21B 11-Feb-03 3.7 Pregnant Ten Mile Lake A 0.5 6.90 25B 11-Feb-03 3.9 Pregnant Ten Mile Lake A 0.7 7.35 28A 11-Feb-03 7.3 Pregnant Ten Mile Lake A 0.4 6.67 29A 11-Feb-03 4.8 Pregnant Ten Mile Lake A 0.2 6.21 30A 11-Feb-03 2.7 Pregnant Mountain East of Richards Creek A 0.9 7.80 31A 11-Feb-03 3.8 Pregnant Mountain East of Richards Creek A 0.5 6.90 32A 12-Feb-03 5.0 Pregnant Mountain East of Big Flat A 1.3 8.71 33A 12-Feb-03 <.2 Not Pregnant Mountain East of Big Flat Y 0.1 5.99 34A 12-Feb-03 5.8 Pregnant Mountain East of Big Flat A 0.5 6.90 35A 12-Feb-03 3.1 Pregnant Mountain East of Big Flat A 1.6 9.39 36A 12-Feb-03 <.2 Not Pregnant Mid-Klingzut Draw A 0.1 5.99 37A 12-Feb-03 <.2 Not Pregnant South of Ten Mile Lake A 0.1 5.99 38A 13-Feb-03 n/a Pregnant Buckinghorse Flats A 0.4 6.67 39A 13-Feb-03 4.7 Pregnant Buckinghorse Flats A 0.3 6.44 40A 13-Feb-03 10.9 Pregnant Buckinghorse Flats A 0.7 7.35 41A 14-Feb-03 4.3 Pregnant Buckinghorse Flats A 0.9 7.80 42A 14-Feb-03 6.2 Pregnant Buckinghorse Flats A 0.2 6.21 43A 14-Feb-03 4.8 Pregnant Buckinghorse Flats A 1.7 9.62 44A 20-Jan-04 7.2 Pregnant Big Flat Mountain A 0.4 6.67 45A 20-Jan-04 <.2 Not Pregnant Big Flat Mountain A 0.2 6.21

186
Table H.1. Continued.
Caribou Capture Date Progesterone (ng/ml)
Reproductive Status
General Location Age Class
Back Fat (cm)
Body Fat (%)a
46A 20-Jan-04 3.8 Pregnant Big Flat Mountain A 0.5 6.90 47A 20-Jan-04 4.4 Pregnant Big Flat Mountain A 0.3 6.44 48A 20-Jan-04 7.8 Pregnant Big Flat Mountain A 0.9 7.80 49A 20-Jan-04 <.2 Not Pregnant Big Flat Mountain A 0.2 6.21 50A 20-Jan-04 5.7 Pregnant First Mountain-
Pocketknife A 0.4 6.67
51A 20-Jan-04 4.5 Pregnant First Mountain-Pocketknife
A 0.2 6.21
52A 20-Jan-04 5.6 Pregnant First Mountain-Pocketknife
A 0.6 7.12
53A 21-Jan-04 5.0 Pregnant Klingzut Mountain A 0.3 6.44 54A 21-Jan-04 4.8 Pregnant Mid-Klingzut Draw A 0.5 6.90 55A 21-Jan-04 3.9 Pregnant Mountain East of
Richards Creek A 0.6 7.12
56A 21-Jan-04 5.4 Pregnant East of Besa-Townsley Flat Mountain
A 0.2 6.21
57A 21-Jan-04 6.1 Pregnant East of Besa-Townsley Flat Mountain
A 0.3 6.44
58A 21-Jan-04 12.4 Pregnant Granger Lick A 0.3 6.44 59A 21-Jan-04 3.4 Pregnant Granger Lick A 0.4 6.67 60A 21-Jan-04 4.8 Pregnant Granger Lick A 0.9 7.80 61A 21-Jan-04 5.3 Pregnant Besa-Townsley Flat
Mountain A 1.1 8.26
62A 21-Jan-04 5.6 Pregnant Besa-Townsley Flat Mountain
A 0.4 6.67
aUsing the MAXFAT equation for caribou: y = 5.76 + 2.27x, where y = estimate of body fat (%) and x = ultrasound measurement of back fat (cm) (T. Stephenson, California Department of Fish and Game, unpublished data).

187
Appendix I: Defining the risk of predation from wolves (Canis lupus) for female caribou during winter and late winter in the Greater Besa Prophet area, northern British Columbia, 2001-2002.
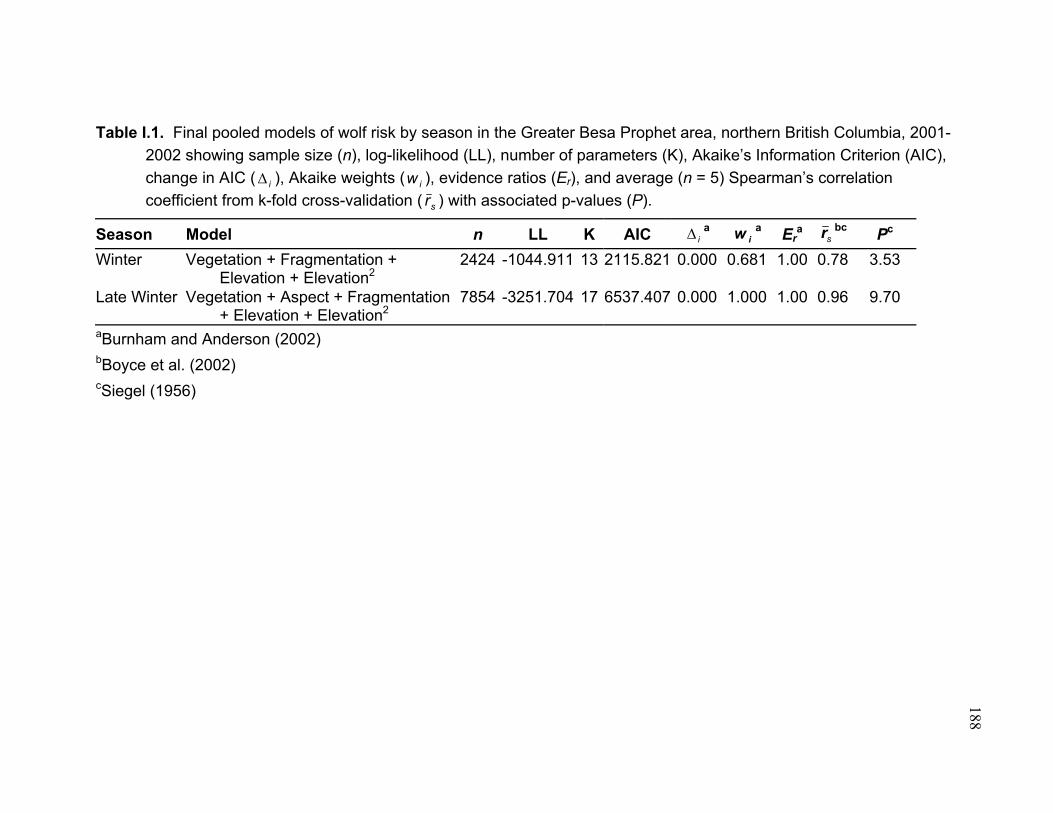
188
Table I.1. Final pooled models of wolf risk by season in the Greater Besa Prophet area, northern British Columbia, 2001-2002 showing sample size (n), log-likelihood (LL), number of parameters (K), Akaike’s Information Criterion (AIC), change in AIC ( i∆ ), Akaike weights ( iw ), evidence ratios (Er), and average (n = 5) Spearman’s correlation coefficient from k-fold cross-validation ( sr ) with associated p-values (P).
Season Model n LL K AIC i∆a iw a Er
a srbc Pc
Winter Vegetation + Fragmentation + Elevation + Elevation2
2424 -1044.911 13 2115.821 0.000 0.681 1.00 0.78 3.53
Late Winter Vegetation + Aspect + Fragmentation + Elevation + Elevation2
7854 -3251.704 17 6537.407 0.000 1.000 1.00 0.96 9.70
aBurnham and Anderson (2002) bBoyce et al. (2002)
cSiegel (1956)

189
Table I.2. Coefficients of selection ( iβ from Table I.1) and standard errors (SE) of the covariates for the final pooled models of wolf risk by season in the Greater Besa Prophet area, northern British Columbia, 2001-2002. Significant parameters are indicated by asterisk(s).
Covariates Winter Late Winter iβ ± SE iβ ± SE Elevation (km) 14.028 ± 3.411** 11.851 ± 1.442** Elevation2 (km) -5.912 ± 1.409** -4.819 ± 0.551** Low fragmentation -0.092 ± 0.090 0.306 ± 0.054** Medium fragmentation -0.039 ± 0.078 0.614 ± 0.044** High fragmentation 0.131 ± 0.078 0.092 ± 0.045* Slope (°) North -0.472 ± 0.075** East -0.185 ± 0.063* South 0.402 ± 0.057** West -0.019 ± 0.074 No aspect (flat) 0.273 ± 0.102* Spruce -0.448 ± 0.144* -0.374 ± 0.077** Shrubs 0.629 ± 0.158** 0.187 ± 0.099 Subalpine 0.252 ± 0.398 -0.133 ± 0.132 Carex spp. 0.191 ± 0.212 0.287 ± 0.132* Non-vegetated -0.292 ± 0.306 -0.005 ± 0.127 Pine -0.827 ± 0.247* -0.837 ± 0.159** Riparian spruce -0.179 ± 0.175 0.057 ± 0.095 Alpine 0.428 ± 0.352 0.482 ± 0.155* Burned/disturbed 0.246 ± 0.150 0.335 ± 0.076** * P < 0.05 ** P < 0.001

190
Table I.3. Final pack models of wolf risk during winter (November-February) in the Greater Besa Prophet area, northern British Columbia, 2001-2002 showing sample size (n), log-likelihood (LL), number of parameters (K), Akaike’s Information Criterion (AIC), change in AIC ( i∆ ), Akaike weights ( iw ), evidence ratios (Er), and average (n = 5) Spearman’s correlation coefficient from k-fold cross-validation ( sr ) with associated p-values (P).
Pack Model n LL K AIC i∆a iw a Er
a srbc Pc
1 n/a 2d Vegetation + Aspect +
Elevation + Elevation2 428 -165.373 16 363.915 0.000 0.517 1.00 0.59 0.073
Vegetation + Fragmentation + Elevation + Elevation2
428 -170.177 12 364.990 1.075 0.302 1.71 0.55 0.100
Vegetation + Aspect + Fragmentation + Elevation + Elevation2
428 -168.566 14 366.013 2.098 0.181 2.85 0.53 0.115
3 n/a 4 Vegetation + Aspect +
Elevation + Elevation2 1079 -448.854 14 925.708 0.000 0.481 1.00 0.75 0.012
5 n/a 6d Vegetation + Fragmentation +
Elevation + Elevation2 888 -374.743 13 775.487 0.000 0.553 1.00 0.56 0.092
Vegetation + Aspect + Elevation + Elevation2
888 -373.234 15 776.469 0.982 0.339 1.63 0.49 0.151
Vegetation + Aspect + Fragmentation + Elevation + Elevation2
888 -372.403 17 778.806 3.319 0.105 5.26 0.53 0.115
aBurnham and Anderson (2002), bBoyce et al. (2002), cSiegel (1956), and dmodels were averaged

191
Table I.4. Final pack models of wolf risk during late winter (March-April) in the Greater Besa Prophet area, northern British Columbia, 2001-2002 showing sample size (n), log-likelihood (LL), number of parameters (K), Akaike’s Information Criterion (AIC), change in AIC ( i∆ ), Akaike weights ( iw ), evidence ratios (Er), and average (n = 5) Spearman’s correlation coefficient from k-fold cross-validation ( sr ) with associated p-values (P).
Pack Model n LL K AIC i∆a iw a Er
a srbc Pc
1
Vegetation + Aspect + Fragmentation + Elevation + Elevation2
1542 -578.667 17 1191.334 0.000 1.000 1.00 0.90 <0.001
2 Vegetation + Aspect +
Elevation + Elevation2 1308 -482.152 15 994.303 0.000 0.601 1.00 0.83 0.003
3
Vegetation + Aspect + Fragmentation + Elevation + Elevation2
1182 -473.747 17 981.494 0.000 0.510 1.00 0.72 0.019
4
Vegetation + Aspect + Fragmentation + Elevation + Elevation2
1266 -507.279 17 1048.557 0.000 0.759 1.00 0.70 0.024
5
Vegetation + Aspect + Fragmentation + Elevation
1308 -428.973 16 889.946 0.000 0.491 1.00 0.86 0.001
6d
Vegetation + Aspect + Fragmentation + Elevation + Elevation2
1248 -484.533 17 1003.066 2.231 0.247 3.05 0.69 0.027
Vegetation + Aspect +
Elevation + Elevation2 1248 -485.417 15 1000.835 0.000 0.753 1.00 0.69 0.027
aBurnham and Anderson (2002), bBoyce et al. (2002), cSiegel (1956), and dmodels were averaged

192
Table I.5. Coefficients of selection ( iβ for an averaged model from Tables I.4) and standard errors (SE) of the covariates for the final risk models for wolf pack 1 (Dopp-Keily) during late winter in the Greater Besa Prophet area, northern British Columbia, 2001-2002. Significant parameters are indicated by asterisk(s).
Covariates Late Winter iβ ± SE Elevation (km) 38.316 ± 10.557** Elevation2 (km) -13.358 ± 3.675** Low fragmentation -0.599 ± 0.139** Medium fragmentation 0.472 ± 0.104** High fragmentation 0.127 ± 0.112 Slope (°) North -0.503 ± 0.174* East -0.587 ± 0.168** South 0.129 ± 0.132 West 0.600 ± 0.17** No aspect (flat) 0.361 ± 0.248 Spruce -0.055 ± 0.183 Shrubs -0.665 ± 0.424 Subalpine -0.109 ± 0.236 Carex spp. 0.400 ± 0.443 Non-vegetated 0.084 ± 0.247 Pine -0.758 ± 0.374* Riparian spruce 0.726 ± 0.243* Alpine -0.228 ± 0.410 Burned/disturbed 0.605 ± 0.211* *P < 0.05 **P < 0.001

193
Table I.6. Coefficients of selection ( iβ and iβ for an averaged model from Tables I.3, I.4) and standard errors (SE) of the covariates for the final risk models for wolf pack 2 (Lower Besa) by season in the Greater Besa Prophet area, northern British Columbia, 2001-2002. Significant parameters are indicated by asterisk(s).
Covariates Winter Late Winter iβ ± SE iβ ± SE Elevation (km) 39.649 ± 8.811** 15.181 ± 5.326* Elevation2 (km) -16.990 ± 3.63** -7.566 ± 2.412* Low fragmentation -0.107 ± 0.227 Medium fragmentation -0.270 ± 0.236 High fragmentation 0.395 ± 0.197* Slope (°) North -0.237 ± 0.159 -0.621 ± 0.224* East -0.191 ± 0.167 -0.367 ± 0.271 South -0.403 ± 0.202* 1.279 ± 0.161** West 0.278 ± 0.166 -0.835 ± 0.281* No aspect (flat) -0.387 ± 0.273 -0.115 ± 0.257 Spruce -0.086 ± 0.397 -1.068 ± 0.357* Shrubs 1.389 ± 0.359** 0.035 ± 0.283 Subalpine 0.949 ± 1.025 1.178 ± 0.746 Carex spp. -0.073 ± 0.449 -0.681 ± 0.337* Non-vegetated 0.518 ± 0.489 0.701 ± 0.351* Pine -0.869 ± 0.563 -1.554 ± 0.578* Riparian spruce 0.031 ± 0.342 0.057 ± 0.261 Alpine 1.335 ± 0.751 Burned/disturbed -0.940 ± 0.405* -0.066 ± 0.235 *P < 0.05 **P < 0.001
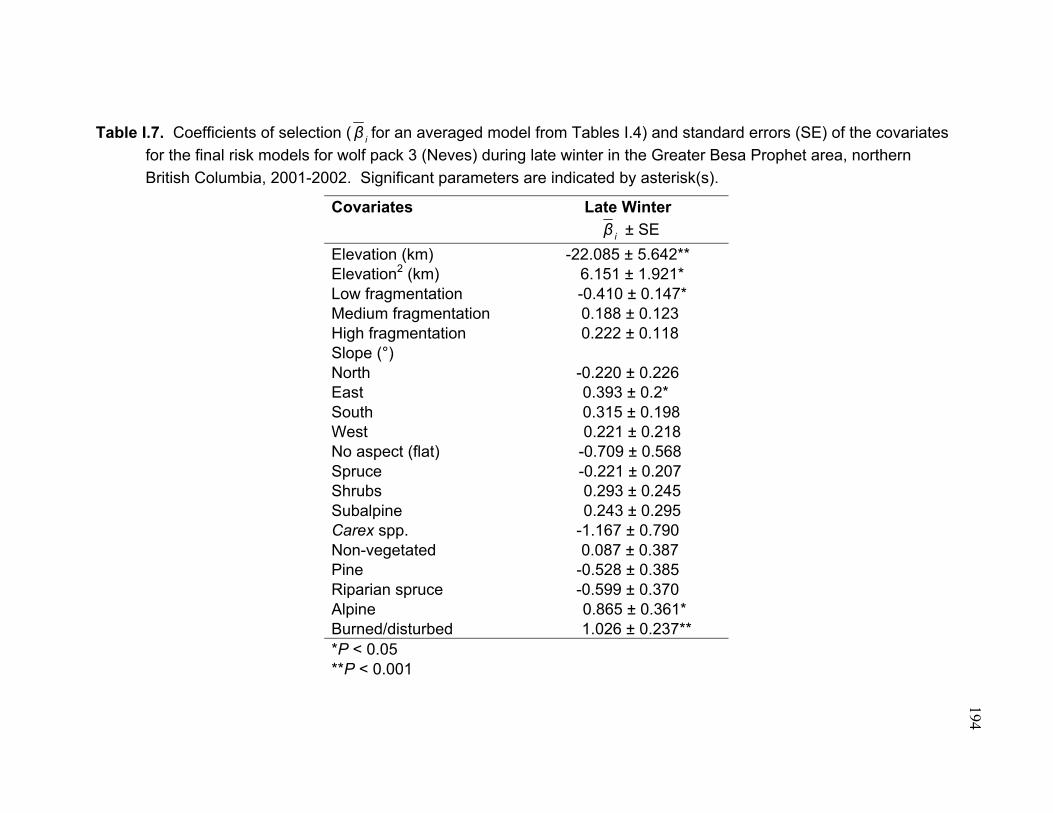
194
Table I.7. Coefficients of selection ( iβ for an averaged model from Tables I.4) and standard errors (SE) of the covariates for the final risk models for wolf pack 3 (Neves) during late winter in the Greater Besa Prophet area, northern British Columbia, 2001-2002. Significant parameters are indicated by asterisk(s).
Covariates Late Winter iβ ± SE Elevation (km) -22.085 ± 5.642** Elevation2 (km) 6.151 ± 1.921* Low fragmentation -0.410 ± 0.147* Medium fragmentation 0.188 ± 0.123 High fragmentation 0.222 ± 0.118 Slope (°) North -0.220 ± 0.226 East 0.393 ± 0.2* South 0.315 ± 0.198 West 0.221 ± 0.218 No aspect (flat) -0.709 ± 0.568 Spruce -0.221 ± 0.207 Shrubs 0.293 ± 0.245 Subalpine 0.243 ± 0.295 Carex spp. -1.167 ± 0.790 Non-vegetated 0.087 ± 0.387 Pine -0.528 ± 0.385 Riparian spruce -0.599 ± 0.370 Alpine 0.865 ± 0.361* Burned/disturbed 1.026 ± 0.237** *P < 0.05 **P < 0.001

195
Table I.8. Coefficients of selection ( iβ and iβ for an averaged model from Tables I.3, I.4) and standard errors (SE) of the covariates for the final risk models for wolf pack 4 (Pocketknife) by season in the Greater Besa Prophet area, northern British Columbia, 2001-2002. Significant parameters are indicated by asterisk(s).
Covariates Winter Late Winter iβ ± SE iβ ± SE Elevation (km) 26.354 ± 5.632** 17.576 ± 6.293* Elevation2 (km) -10.717 ± 2.372** -6.562 ± 2.55* Low fragmentation -0.341 ± 0.144* Medium fragmentation 0.206 ± 0.113 High fragmentation 0.135 ± 0.120 Slope (°) North 0.410 ± 0.169* -0.415 ± 0.166* East 0.098 ± 0.147 -0.381 ± 0.146* South -0.015 ± 0.173 0.031 ± 0.169 West -0.501 ± 0.230* -0.206 ± 0.207 No aspect (flat) 0.008 ± 0.237 0.970 ± 0.184** Spruce -0.662 ± 0.246* -0.417 ± 0.263 Shrubs 0.981 ± 0.267** 0.990 ± 0.269** Subalpine -0.630 ± 0.978 Carex spp. 0.547 ± 0.291 1.178 ± 0.295** Non-vegetated -1.449 ± 0.912 -0.564 ± 0.540 Pine -0.743 ± 0.335* -1.312 ± 0.438* Riparian spruce -0.149 ± 0.251 0.297 ± 0.275 Alpine 1.231 ± 0.608* 0.357 ± 0.582 Burned/disturbed 0.244 ± 0.277 0.100 ± 0.284 *P < 0.05 **P < 0.001

196
Table I.9. Coefficients of selection ( iβ for an averaged model from Tables I.4) and standard errors (SE) of the covariates for the final risk models for wolf pack 4 (Richards-Upper Prophet) by season in the Greater Besa Prophet area, northern British Columbia, 2001-2002. Significant parameters are indicated by asterisk(s).
Covariates Late Winter iβ ± SE Elevation (km) -5.893 ± 0.672** Elevation2 (km) Low fragmentation -0.100 ± 0.139 Medium fragmentation 0.272 ± 0.12* High fragmentation -0.172 ± 0.128 Slope (°) North -0.226 ± 0.185 East 0.027 ± 0.179 South 0.220 ± 0.171 West 0.497 ± 0.204* No aspect (flat) -0.519 ± 0.328 Spruce -0.407 ± 0.184* Shrubs 0.821 ± 0.254* Subalpine -0.644 ± 0.442 Carex spp. 0.431 ± 0.348 Non-vegetated -0.368 ± 0.322 Pine -0.030 ± 0.336 Riparian spruce -0.227 ± 0.263 Alpine 0.490 ± 0.497 Burned/disturbed -0.067 ± 0.248 *P < 0.05 **P < 0.001
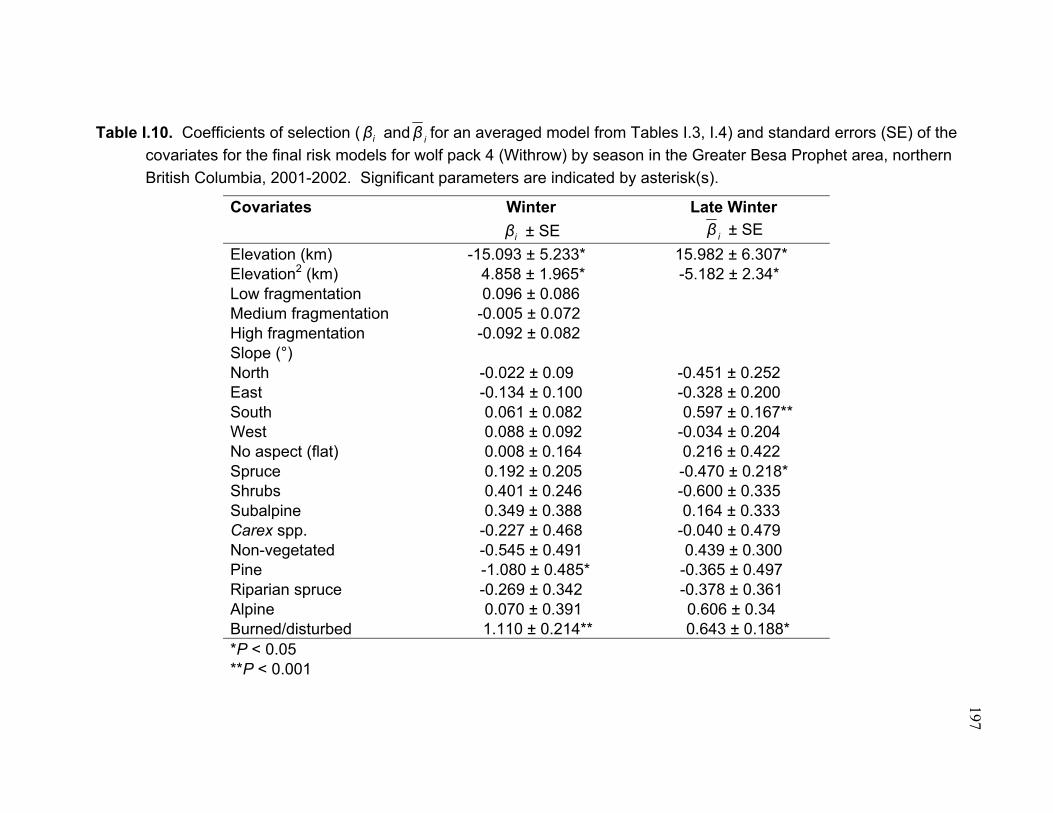
197
Table I.10. Coefficients of selection ( iβ and iβ for an averaged model from Tables I.3, I.4) and standard errors (SE) of the covariates for the final risk models for wolf pack 4 (Withrow) by season in the Greater Besa Prophet area, northern British Columbia, 2001-2002. Significant parameters are indicated by asterisk(s).
Covariates Winter Late Winter iβ ± SE iβ ± SE Elevation (km) -15.093 ± 5.233* 15.982 ± 6.307* Elevation2 (km) 4.858 ± 1.965* -5.182 ± 2.34* Low fragmentation 0.096 ± 0.086 Medium fragmentation -0.005 ± 0.072 High fragmentation -0.092 ± 0.082 Slope (°) North -0.022 ± 0.09 -0.451 ± 0.252 East -0.134 ± 0.100 -0.328 ± 0.200 South 0.061 ± 0.082 0.597 ± 0.167** West 0.088 ± 0.092 -0.034 ± 0.204 No aspect (flat) 0.008 ± 0.164 0.216 ± 0.422 Spruce 0.192 ± 0.205 -0.470 ± 0.218* Shrubs 0.401 ± 0.246 -0.600 ± 0.335 Subalpine 0.349 ± 0.388 0.164 ± 0.333 Carex spp. -0.227 ± 0.468 -0.040 ± 0.479 Non-vegetated -0.545 ± 0.491 0.439 ± 0.300 Pine -1.080 ± 0.485* -0.365 ± 0.497 Riparian spruce -0.269 ± 0.342 -0.378 ± 0.361 Alpine 0.070 ± 0.391 0.606 ± 0.34 Burned/disturbed 1.110 ± 0.214** 0.643 ± 0.188* *P < 0.05 **P < 0.001
