platform for biodiversity and ecosystem services … building for intergovernmental platform for...
TRANSCRIPT

Capacity building for Intergovernmental Platform for Biodiversity and Ecosystem Services (IPBES)
Final report Indo- Norwegian pilot project on capacity building in biodiver-sity informatics for enhanced decision making, improved na-ture conservation and sustainable development.
Frank Hanssen (editor), Vinod B. Mathur, Vidya Athreya, Vijay Barve, Rupa Bhardwaj, Louis Boumans, Mandy Cadman, Vishwas Chavan,
Mousumi Ghosh, Arild Lindgaard, Øystein Lofthus, Fridtjof Mehlum, Bivash Pandav, Girish Arjun Punjabi, Alberto González Talaván, Gautam Talukdar, Nils Valland, Roald Vang
1079
NINA Publications NINA Report (NINA Rapport) This is a electronic series beginning in 2005, which replaces the earlier series NINA commissioned reports and NINA project reports. This will be NINA’s usual form of reporting completed research, monitoring or review work to clients. In addition, the series will include much of the institute’s other reporting, for example from seminars and conferences, results of internal research and review work and literature studies, etc. NINA report may also be issued in a second language where appropri-ate. NINA Special Report (NINA Temahefte) As the name suggests, special reports deal with special subjects. Special reports are produced as required and the series ranges widely: from systematic identification keys to information on im-portant problem areas in society. NINA special reports are usually given a popular scientific form with more weight on illustrations than a NINA report. NINA Factsheet (NINA Fakta) Factsheets have as their goal to make NINA’s research results quickly and easily accessible to the general public. The are sent to the press, civil society organisations, nature management at all lev-els, politicians, and other special interests. Fact sheets give a short presentation of some of our most important research themes. Other publishing In addition to reporting in NINA’s own series, the institute’s employees publish a large proportion of their scientific results in international journals, popular science books and magazines.

Norwegian Institute for Nature Research
Capacity building for Intergovernmental Platform for Biodiversity and Ecosystem Services (IPBES)
Final report: Indo- Norwegian pilot project on capacity building in biodiversity informatics for enhanced decision making, improved nature conservation and sustainable development.
Frank Hanssen1 Vinod B. Mathur2 Vidya Athreya3 Vijay Barve Rupa Bhardwaj2 Louis Boumans6 Mandy Cadman7 Vishwas Chavan4 Mousumi Ghosh2 Arild Lindgaard5 Øystein Lofthus6 Fridtjof Mehlum6 Bivash Pandav2 Girish Arjun Punjabi3 Alberto González Talaván4 Gautam Talukdar2 Nils Valland5 Roald Vang1 1 Norwegian Institute of Nature Research (NINA), Trondheim, Norway. 2 Wildlife Institute of India (WII), Dehradun, India. 3 Wildlife Conservation Society - India, Bangalore, India. 4 Global Biodiversity Information Facility Secretariat (GBIF), Copenhagen, Denmark. 5 Norwegian Bio-diversity Information Centre (NBIC), Trondheim, Norway. 6 Natural History Museum (NMH), University of Oslo (UiO), Norway. Independent Consultant, Port Elizabeth, South Africa.


3
Hanssen, F. (editor), Mathur, V.B. (editor), Athreya, V., Barve, V., Bhardwaj, R., Boumans, L., Cadman, M., Chavan, V., Ghosh, M., Lindgaard, A., Lofthus, Ø., Mehlum, Pandav, B., Punjabi, G. A., F., González Talaván, A., Talukdar, G., Valland, N. and Vang, R. Capacity building for Intergovernmental Platform for Biodiversity and Ecosystem Services (IPBES). Final report 2014: Indo- Norwe-gian pilot project on capacity building in biodiversity informatics for enhanced decision making, improved nature conservation and sus-tainable development. - NINA Report 1079. 116 pp. Except the editors, please note that the sequence of authors are in alphabetical order and should not be interpreted in any other way.
Trondheim, October, 2014
ISSN: 1504-3312 ISBN: 978-82-426-2698-1
COPYRIGHT
© Norwegian Institute for Nature Research The publication may be freely cited where the source is acknowl-edged
AVAILABILITY
[Open]
PUBLICATION TYPE
Digital document (pdf)
EDITION
1-2012
QUALITY CONTROLLED BY
Dr. John Linnell, NINA
SIGNATURE OF RESPONSIBLE PERSON
Director Norunn M. Myklebust (sign.)
CLIENT(S)
The Norwegian Environmental Agency
CLIENTS’ CONTACT PERSON(S)
Nina Vik
COVER PICTURE
Camera trap image, Wildlife Institute of India (WII)
KEY WORDS
India, Norway, IPBES, GBIF, citizen science, biodiversity informat-ics, wildlife camera trapping, training, capacity building, data shar-ing, data repatriation, tiger, snow leopard, leopard, GIS, Database NØKKELORD
India, IPBES, GBIF, citizen science, biodiversitetsinformatikk, viltkamera, kapasitetsbygging, deling av data, tiger, snøleopard, leopard, GIS, Database

NINA Report 1079
4
Abstract This pilot project has been coordinated by The Norwegian Institute of Nature Research (NINA) in close collaboration with the Wildlife Institute of India (WII), the Norwegian Biodiversity Infor-mation Centre (NBIC), The Nature History Museum at the University of Oslo (NHM), the Wildlife Conservation Society- India Program (WCS) and the Centre for Wildlife Studies (CWF) in India. The Norwegian Government has funded the project with support from the Indian Government. The project has collaborated with the Global Biodiversity Information Facility (GBIF) and has implemented several of the capacity building tools, standards and services offered by GBIF. In addition, WII and NHM host the national GBIF- nodes of India and Norway. Furthermore, the project is closely linked to the Indian and international strategies on biodiversity infrastructure development. The project has focused on national user needs, camera trapping techniques, data management, open access and barriers towards open access. Six case studies demonstrate how biodiversity informatics, camera trapping, data mobilization and access policies can contribute to improved decision making. This has led to a better understanding of camera trapping techniques, occu-pancy modelling, DNA-analysis, species distribution, human-wildlife conflicts, human disturb-ance effects on wild mammals, habitat recovery, tiger population management needs and inves-tigation of tiger poaching. The project has conducted a minor data repatriation exercise at Nor-wegian natural history museums. The capacity-building component of this towards international legacy collections is in the description of how to mobilize data through GBIF. WII has developed a national database and a web-portal for mobilizing camera trap data. These developments are important steps towards a national, open biodiversity data management sys-tem for camera trap images and their axillary metadata. The project has developed a Best Prac-tice Guide (BPG) for publishing of biodiversity data derived from camera trapping. This BPG will be maintained by GBIF in the future. This capacity-building pilot project has clearly proved relevance in addressing the capacity build-ing needs identified by IPBES. As the project results show, there are many international syner-gies in capacity-building of biodiversity informatics, camera trapping, data mobilization, data re-patriation, data management and data sharing policy improvement. Finalizing the pilot project, the project partners have decided to look for new possibilities for collaboration under the IPBES. Frank Hanssen ([email protected] Vinod B. Mathur ([email protected]) Vidya Athreya ([email protected]) Vijay Barve ([email protected]) Rupa Bhardwaj ([email protected]) Louis Boumans ([email protected]) Mandy Cadman ([email protected]) Vishwas Chavan ([email protected]) Mousumi Ghosh ([email protected]) Arild Lindgaard ([email protected]) Øystein Lofthus ([email protected]) Fridtjof Mehlum ([email protected]) Bivash Pandav ([email protected]) Girish Arjun Punjabi ([email protected]) Alberto González Talaván ([email protected]) Gautam Talukdar ([email protected]) Nils Valland ([email protected]) Roald Vang ([email protected])

NINA Report 1079
5
Sammendrag Dette pilotprosjektet har vært koordinert av Norsk Institutt for Naturforskning (NINA) i nært samarbeid med Wildlife Insitutute of India (WII), Artsdatabanken, Naturhistorisk Museum ved Universitetet i Oslo, Wildlife Conservation Society- India Program (WCS) og Centre for Wildlife Studies (CWF) i India. Prosjektet er finansiert av den Norske Regjering med støtte fra den og India. Prosjektet har samarbeidet med Global Biodiversity Information Facility (GBIF) og har implementert flere av deres kapasitetsbyggende verktøy, standarder og tjenester. I tillegg er WII og Naturhistorisk Museum nasjonale GBIF- noder. Prosjektet er nært knyttet til indiske og internasjonale strategier for utvikling av biodiversitetsinfrastruktur. Prosjektet har fokusert på nasjonale brukerbehov, viltkamerametodikk, dataforvaltning, åpen datadeling og barrierer for åpen datadeling. Seks casestudier har vist hvordan biodiversitets- informatikk, bruk av viltkamera, datamobilisering og strategier for deling av data kan bidra til forbedrede beslutningsprosesser. Dette har ført til en bedre forståelse for bruk av viltkamera, occupancy-modellering, DNA-analyser, artsutbredelse, rovvilt/samfunn konflikter, effekter av menneskelig aktivitet på ville dyr, habitatrestaurering, behov knyttet til forvaltning av tigre, samt etterforskning av ulovlig jakt på tiger. Prosjektet har gjennomført en mindre datarepatrieringsøvelse ved de norske naturhistoriske mu-seene. Kapasitetsbyggingskomponenten i dette arbeidet overfor internasjonale museumssam-linger ligger primært i beskrivelsen av hvordan repatrierte data kan mobiliseres gjennom GBIF. WII har utviklet en nasjonal database og en webportal for mobilisering av viltkameradata. Dette utviklingsarbeidet er et viktig skritt i retning av å utvikle et nasjonalt åpent system for forvaltning av viltkamerabilder og tilhørende metadata. Prosjektet har også utviklet en Best Practice Guide (BPG) for publisering av biodiversitetsdata avledet fra viltkamerabilder. Denne guiden vil bli ved-likeholdt av GBIF i fremtiden. Dette prosjektet har vist høy relevans i forhold til de kapasitetsbyggingsbehov som er identifisert av IPBES. Som prosjektet viser er det store internasjonale synergier innen kapasitetsbygging knyttet til biodiversitetsinformatikk, bruk av viltkamera, datamobilisering, datarepatriering, data-forvaltning og forbedrede strategier for datadeling. I avslutningsfasen av dette pilotprosjektet har prosjektpartnerne bestemt seg for å se etter nye samarbeidsmuligheter under IPBES. Frank Hanssen ([email protected] Vinod B. Mathur ([email protected]) Vidya Athreya ([email protected]) Vijay Barve ([email protected]) Rupa Bhardwaj ([email protected]) Louis Boumans ([email protected]) Mandy Cadman ([email protected]) Vishwas Chavan ([email protected]) Mousumi Ghosh ([email protected]) Arild Lindgaard ([email protected]) Øystein Lofthus ([email protected]) Fridtjof Mehlum ([email protected]) Bivash Pandav ([email protected]) Girish Arjun Punjabi ([email protected]) Alberto González Talaván ([email protected]) Gautam Talukdar ([email protected]) Nils Valland ([email protected]) Roald Vang ([email protected])

NINA Report 1079
6
Contents
Abstract ....................................................................................................................................... 4
Sammendrag ............................................................................................................................... 5
Contents ...................................................................................................................................... 6
Foreword ..................................................................................................................................... 8
1 Introduction ............................................................................................................................ 9
2 Project background, objectives and national/international context .............................. 10
3 A short introduction to camera trapping .......................................................................... 14 3.1 Methodology .................................................................................................................. 14 3.2 Choosing the right camera trap model .......................................................................... 15 3.3 Setting up camera traps ................................................................................................ 19 3.4 Configure camera traps ................................................................................................. 21
4 Management of camera trap data and objects ................................................................. 23 4.1 Generating or collecting data......................................................................................... 23 4.2 Image coding ................................................................................................................. 24 4.3 Record the data on the datasheets and enter the data ................................................. 25 4.4 Image and image data management ............................................................................. 25 4.5 Quality control and quality enhancement ...................................................................... 26 4.6 Management of camera trap objects ............................................................................. 26
5 Open access: Barriers and needed actions ..................................................................... 29 5.1 Technology, standards and financial framework ........................................................... 29 5.2 Institutional culture and individual researcher attitudes ................................................ 29 5.3 The need for academic accreditation of open data access .......................................... 30 5.4 Data management, strategies and contractual arrangements ...................................... 32
6 Proposed actions for open access to Indian biodiversity data ..................................... 34
7 Project implementation and outcomes ............................................................................. 40 7.1 Field excursion in the Rajaji National Park .................................................................... 40 7.2 Mapping of national user needs .................................................................................... 41 7.3 Case studies .................................................................................................................. 44
Population density estimate of Tigers in the Rajaji National park ...................... 44 Distribution and abundance of herbivores in Sanjay Gandhi National Park ...... 51 Wild mammal biodiversity in the Pune District (Maharashtra) ........................... 55 Occupancy of large-felids in the Sindhudurg district (Maharashtra) .................. 57 A survey for wildlife along the Khanduli River .................................................... 67 Carnivores outside protected areas in India ....................................................... 68
7.4 Mobilizing camera trap data (example from the Rajaji NP)........................................... 69 7.5 The national camera trap database ............................................................................... 70 7.6 The WII camera trap data Web Portal ........................................................................... 71 7.7 Guidelines for Best Practices ........................................................................................ 77 7.8 Planned training workshop at the Wildlife Institute of India........................................... 79 7.9 Legacy data repatriation ................................................................................................ 79
Introduction ......................................................................................................... 79 Relevant material from Tromsø .......................................................................... 80 Relevant material from Trondheim ..................................................................... 80

NINA Report 1079
7
Relevant material from Bergen ........................................................................... 80 Relevant material from Oslo ............................................................................... 81 Conclusion and recommendations for repatriation of legacy data ..................... 83
7.10 Use and reuse of data ................................................................................................... 84 Camera trap image helps identify poached tiger skin ........................................ 84 The proposal for a tiger reserve in Rajaji National Park..................................... 84 Standard operational procedures regarding human wildlife conflicts ................ 85 Discovering primary biodiversity data from social networking sites ................... 85
7.11 Outreach and promotion ................................................................................................ 86
8 Project capacity building towards IPBES ......................................................................... 88 8.1 Collaboration with GBIF ................................................................................................. 88 8.2 International networking across disciplines ................................................................... 88 8.3 The Best Practice Guide ................................................................................................ 89 8.4 Technological development supporting data mobilization ............................................ 89 8.5 Validating the Audubon Core metadata standard ......................................................... 89 8.6 The case studies ............................................................................................................ 89 8.7 Training, workshops and involvement of citizen scientists ............................................ 90 8.8 Repatriation of legacy collection data ............................................................................ 90 8.9 Added values towards the scientists and decision makers ........................................... 91
9 Future collaboration and funding possibilities ................................................................ 92
10 Conclusion and recommendations ................................................................................... 93
11 References ........................................................................................................................... 95
12 Annexes .............................................................................................................................. 100 12.1 The Audubon Core Template ...................................................................................... 100 12.2 Poster at the GBIF Governing Board meeting, Sept. 17-19 2012 (Norway) ............... 114 12.3 Poster at the Conference of the Parties (COP), Oct. 8-19 2012 (India) .................... 115

NINA Report 1079
8
Foreword The project consortium is characterized by the very good collaboration between the project part-ners and the large degree of mandatory support from the Norwegian and Indian Governments. The project partners have willingly exchanged their expertise and knowledge in camera trapping and biodiversity informatics. Capacity building has been identified as an essential component of the IPBES. We are confident that all project outcomes described in the following chapters demonstrate synergies and prove relevance for future regional/national capacity building developments under the IPBES. The pro-ject partners and the Governments of both countries now seek for new collaborative opportuni-ties under the IPBES umbrella. When setting up the IPBES, the participating Governments emphasized the importance of col-laboration with existing initiatives. This project has from the beginning collaborated with the Global Biodiversity Information Facility (GBIF) about the implementation of open data sharing, international standards, common services and user adapted tools as requested by IPBES. The national GBIF nodes (India and Norway) and the global GBIF- Secretariat in Copenhagen (Den-mark) has been very important for the outcomes of this project. GBIF operates at the data-sci-ence interface and represents as such an important support for IPBES operating at the science-policy interface. This project highly emphasize the importance of citizen science in capacity building. Citizen sci-entists have been collaborating with professional scientists in several case studies throughout the entire project period. Mobilization of georeferenced biodiversity data from citizen science project is a very important task for future scientific achievements. Our project address this task with facilitated online user interfaces for data sharing. Many citizen scientists use social network-ing sites to share data. In this report, we describe how biodiversity occurrence records can be mobilized from social networking sites. All project partners are actively involved in several capacity building initiatives both at national and international scales (ecological research, scientific training programs, strategy development, research infrastructure, biodiversity informatics and the development of standards, infrastruc-tures, services and tools). In addition to GBIF, this pool of knowledge and networks represent an important asset to the set up and further development of the IPBES Technical Support Units. Many people have been involved in this work. We would like to thank everyone for his or her valuable inputs, contributions and comments. A special thanks to Vishwas Chavan, Mousumi Ghosh, Mandy Cadman and Alberto Gonzàlez Talavàn for their support and great efforts in com-piling the Best Practice Guide (BPG). We would also like to thank the Norwegian Government for the funding of this project. Frank Hanssen (NINA) Vinod B. Mathur (WII) Project manager Project manager

NINA Report 1079
9
1 Introduction Capacity building has been identified as an essential component of the Intergovernmental Plat-form for Biodiversity and Ecosystem Services (IPBES)1. The Norwegian Government acknowl-edges the need for capacity building and has developed and initiated several projects addressing capacity-building needs in partner countries. The goal of this pilot project was to build capacity and share knowledge and experiences within the field of Biodiversity Informatics in India. The pilot project is initiated and funded by the Norwegian Ministry for Foreign affairs2, the Norwegian Ministry of Climate and Environment3 and the Norwegian Environmental Agency4. The pilot pro-ject is highly welcomed and explicitly supported by the Government of India. India was early identified as an ideal partner country for the realization of a capacity building pilot project because of the rich biodiversity in the country and the current national initiations towards the Indian Biodiversity Information Facility (InBIF). InBIF is currently a proposal concept, which has not yet been materialized. The Indian node of the Global Biodiversity Information Facility (GBIF)5 led by the Wildlife Institute of India (WII)6 is responsible for national coordination and linkage with the international GBIF community. In the context of GBIF India, WII has the national mandate from the Indian Ministry of Environment, Forests and Climate Change (MoEFCC)7 to build capacity for effective biodiversity information management, including collection, collation, analysis and dissemination of biodiversity-related data. The project partners started to develop an application for funding in 2011. The application was finally approved by the Indian and Norwegian Government`s in June 2011. The project was kicked off in October 2011 and has been coordinated and executed by the Norwegian Institute for Nature Research (NINA)8 and WII, who also has been responsible for the implementation and progress of the project nationally within India. NINA has provided its expertise in managing camera trap projects, and together with the Norwe-gian Biodiversity Information Centre (NBIC)9 and the Natural History Museum at the University of Oslo (NHM)10, provided the expertise acquired from building the Norwegian biodiversity infra-structure in terms of the NBIC- infrastructure and the Norwegian node in the Global Biodiversity Information Facility (GBIF)11 at NHM in Oslo. In addition, the Wildlife Conservation Society- India Program (WCS)12 and Centre for Wildlife Studies (CWF)13 14 has contributed a lot to the project within the fields of capacity building and citizen science. This project had a specific focus on the use of camera trap data in decision making and display-ing the benefits of data sharing adapted to various users including decision makers, researchers and civil society. The general idea is to build capacity to enable free sharing, access and dis-semination of the biodiversity data in India to be more used in policymaking and evidence-based decision-making.
1 http://www.ipbes.net/ 2 http://www.regjeringen.no/en/dep/ud.html?id=833 3 http://www.regjeringen.no/en/dep/kld.html?id=668 4 http://www.miljodirektoratet.no/english/ 5 http://www.gbif.org 6 http://www.wii.gov.in/ 7 http://envfor.nic.in/ 8 http://www.nina.no/ninaenglish/Start.aspx 9 http://www.biodiversity.no/frontpage.aspx?m=23 10 http://www.nhm.uio.no/english/ 11 http://www.gbif.no/ 12 http://wcsindia.org/home/ 13 http://cwsindia.org/ 14 www.mumbaikarsforsgnp.com

NINA Report 1079
10
2 Project background, objectives and national/international context
The main objective of this pilot project was to enhance the capacity of India to take evidence-based policy decisions about its own biodiversity management and conservation issues. To achieve this objective, the following necessary actions were proposed, enabled through the global standards and existing infrastructure offered by GBIF:
A data repatriation exercise of Indian data held in the legacy collections of Norwegian Natural History Museums. In addition to the data itself, it is expected that the experiences from this repatriation exercise will have great synergies for similar exercises in other legacy collections.
Capacity building exercises where Indian scientists and technicians learn routines for better data digitation and publishing of biodiversity data captured by the Indian network of camera traps deployed over the country, and how to use them for evidence-based decision making.
Data mobilization from camera trapping projects recorded, based on relevant interna-tional data exchange standards.
Case studies that will operationalize the mobilized biodiversity data for use in environ-mental conservation and management policy.
A web- portal interface that provides access to mobilized camera trap images and stand-ardized metadata.
Camera trapping refers to the use of remotely triggered cameras that automatically take images of whatever moves in front of them. It utilizes fixed digital cameras to capture images or videos of animals in wild, with as little human interference as possible, travelling in front of the camera’s infrared sensors (Rovero et al., 2010). It provides photographs that serve as objective records of an animal’s presence at a location, and information on activity patterns (from the date and time contained in the image), behavior, and pelage characteristics that enable individual identi-fication of some species (Rovero et al., 2007). WII, WCS and CWS have over many years evolved advanced techniques and great experience in camera trapping from India and neighboring countries both in protected nature reserves and in rural settlements. On a minor scale, NINA has also established experience on camera trapping from different projects in India, Myanmar and Norway. The main focus and core responsibilities of the project partners were data sharing and exchange of camera trap data, technology and knowledge. The unique feature of this mutual capacity build-ing collaboration is to device workflows, standards and infrastructure for mobilizing camera trap data into GBIF. In October 2012 India established a National Biodiversity Information Outlook (NBIO)15 in order to establish a consensus roadmap for the establishment of a national biodiversity information infrastructure (Chavan et. al, 2012). The goal of the NBIO roadmap is to:
Assess the state-of-the-art of Indian biodiversity information
Identify barriers to facilitate and encourage processes in biodiversity informatics
Assist prioritizing acquisition, discovery, and publishing of biodiversity information by rel-evant stakeholders
Communicate progress and advocate needs to decision makers in the form of a National Biodiversity Informatics Roadmap
15 http://www.gbif.org/resources/2307

NINA Report 1079
11
Users of the NBIO are stakeholders that produce and/or use biodiversity information. This in-cludes researchers, conservationists, natural resources managers, land use planners, policy makers and the society in general. In addition to assess the progress of national biodiversity informatics, the NBIO will also provide an opportunity to make prioritized and demand-driven investment in biodiversity science itself. Further, as illustrated in Figure 1 below, NBIO will aim to establish a link between the biodiversity and ecosystem researchers, stakeholders, policy makers and information managers. NBIO will emphasize the need for efficient and cost-effective management of biodiversity data through the National Biodiversity GRID (NBG) and its imple-menting body, the InBIF.
When NBIO becomes operational and initiates discovery and open access to biodiversity and ecosystems data, it will play an important role in the establishment of a National Biodiversity Strategy and Action Plan (NBSAP)16. The NBIO Roadmap will assist in making comprehensive progress in biodiversity informatics ensuring that new investments will be scientifically, ecologi-cally, socially and financially relevant (National Biodiversity Information Outlook, 201217). The development of the InBIF is an extremely important step to bridge the science-policy inter-face at the national level in India. The national InBIF- initiative aims to increase the value of nationally collected primary data by making them available through a web- portal for search, access and use. The data portal is not yet realized because of inadequate funding. One of the major challenges identified so far is how to motivate the national data stakeholders to contribute with data into InBIF. Issues such as how to credit contributing data owners and how to secure their intellectual property rights to their data must be addressed in a proper manner.
16 http://envfor.nic.in/division/national-biodiversity-action-plan-nbap 17 http://nbaindia.org/blog/532/1/NationalBiodiversity.html
Figure 1: NBIO will influence free and open access to biodiversity data through institutionalization of NBG and InBIF, which will enrich the National Biodiversity Strategy and Action Plan (NBSAP)

NINA Report 1079
12
The IPBES- stakeholders have emphasized that IPBES preferably should collaborate with a global existing initiative to avoid duplication of work. GBIF is a key global science organization, which enables free and open access to biodiversity data online to support scientific research and decision-making processes, and includes strong elements of capacity building including access to tools, guidance, data and support. GBIF has over recent years developed consistent institu-tional networks, tools for data sharing, training programs and methods of capacity building. The GBIF Secretariat in Copenhagen (Denmark) has supported this pilot project with guidance about international data standards, training and capacity building on Biodiversity Informatics. In addi-tion, all the project partners are involved in several national and international eInfrastructure pro-jects focusing on capacity building in biodiversity informatics. The total experiences acquired through the collaboration with GBIF and these initiatives represent important synergies for cur-rent and future collaborative initiatives. This approach is highly recommended in the Global Biodiversity Informatics Outlook (GBIO)18. Coordinated funding and improved interaction of initiatives and projects are really needed in order to avoid duplicated efforts and investments. Several important focal areas and action com-ponents were identified by GBIO in order to coordinate future efforts and funding and to enable improved interaction of initiatives and projects. Figure 2 below illustrates the focal areas, action components and their current progress.
Figure 2: The GBIO Framework
18 http://www.biodiversityinformatics.org/

NINA Report 1079
13
The national GBIF nodes at WII and NHM promote, coordinate and facilitate the mobilization and use of biodiversity data among the relevant stakeholders within their domains, primarily to ad-dress the stakeholder’s information needs with relevant actions. At the national level, this should be within the context of implementing relevant national legislation and institutional mandates. The nodes also serves as communication gateways among the participating institutions and the GBIF secretariat, contributing to and benefitting from the services, infrastructure and capacity brokered and provided by the GBIF secretariat. This approach enables the effective consoled action of GBIF as a truly global, decentralized network of networks. NINA, NBIC and NHM participates in the development of the European LifeWatch Infrastruc-ture19, and coordinate the initial establishment of a LifeWatch Infrastructure both at Norwegian and Nordic level. NBIC, NINA and the Natural History Museum in Oslo also participates in the EUBON- project (European Biodiversity Observation Network)20 in an innovative approach to-wards integration of biodiversity information systems from on-ground to remote sensing data, for addressing policy and information needs in a timely and customized manner. NBIC also cooper-ates with the International Union for Conservation of Nature (IUCN)21 and works with implemen-tation of the Infrastructure for Spatial Information in the European community (INSPIRE)22 in Norway. As shown above both WII, NINA, NBIC and NHM have active roles in several national and inter-national initiatives on eInfrastructure development and capacity building. The outcomes of these activities highly support the capacity building intention of this IPBES pilot project. 19 http://www.lifewatch.eu 20 http://www.eubon.eu/ 21 http://www.iucn.org/ 22 http://inspire.ec.europa.eu/

NINA Report 1079
14
3 A short introduction to camera trapping Camera trapping refers to the use of remotely triggered cameras that automatically take images of whatever moves in front of them (Rovero et al., 2010). This method is most often used to capture images of medium to large sized terrestrial mammals and birds, but has also been used for arboreal mammals (e.g., Oliveira-Santos et al., 2008) and other non-mammalian groups. The use of camera traps in wildlife monitoring, research and management has escalated rapidly in the last ten years and camera trapping methodology has undergone significant and rapid ad-vances over this time (O'Connell et al., 2011; Meek et al., 2012). Biologists have used camera traps for over 100 years. They have proven to be a useful tool, complementing other methods for determining species richness and diversity. They provide a non-invasive method for detecting rare, shy and cryptic species, as well as for identifying species that cannot easily be distinguished from tracks or other sign. Camera traps can also be used to monitor wildlife use of key resources such as salt licks, ponds, and fruiting trees. When instru-mented to operate 24 hours a day, they provide important information on habitat use, behavior and activity patterns. Nevertheless, perhaps the most novel application of camera traps has been to generate information on abundance and population density, in particular applying capture-recapture analytical methods (O’Connell et al. 2011).
3.1 Methodology Before beginning any research project, investigators should have a clear idea of what information they need to help them address their primary conservation issue or question. Before investing in a photographic recapture survey, researchers should be certain that abundance or density is a quantity that will really be of use to them. To carry out an abundance estimate based upon pho-tograph/re-photograph ratios (hereafter referred to as ‘camera trap estimates’) the research team must have certain information and equipment. Minimal requirements: 1. Maps or geographic knowledge of the study area. 2. Access to the study area and a means of traveling throughout the study area. 3. A rudimentary idea as to the topographic features of areas inhabited or sites visited by the
study animal and their travel routes. 4. Enough people familiar with the function and maintenance of camera traps to deploy and
monitor the traps in a timely fashion. 5. A sufficient number of camera traps to photograph (i.e., “capture”) enough individuals of the
target species to generate a statistical estimate of abundance. If a rigorous population esti-mate is the objective, this is a serious requirement for reasons elaborated in following sec-tions.
Additionally, it helps to have: 1. Someone with a high degree of familiarity with the study area. 2. Existing trails or roads to facilitate access to the study area. 3. Extra camera traps to act as replacements in the event of equipment failure. 4. A thumbnail estimate of expected capture rates for the target species. 5. Rough estimates of home range size and life history information. 6. Hand-held GPS units. 7. In a human dominated landscape, to have a dialogue with the local people before camera
traps are set in their areas. Field experience show that theft is reduced and that the locals
are less suspicious to what an outsider is doing.

NINA Report 1079
15
3.2 Choosing the right camera trap model It is essential that the right camera trap type is chosen to ensure that the resulting data is fit for the intended use. With the rapidly growing number of camera trap models available, and rapidly changing technology, choosing the right model can often be difficult.
The criteria that should be included are the trigger mechanism (active or passive), the trigger speed, the type of flash (infrared or incandescent), the camera technology (film or digital, and the mode – still, video, time-lapse), as well as battery life and cost
The trigger mechanism (active and passive sensors) Most camera traps are triggered by an infrared sensor detecting a moving object that is warmer than the ambient temperature, such as animals, people, or even vehicles passing in front of them.
Passive infrared sensors detect heat-in-motion; the sensor triggers the image-recording de-vice (henceforth called the ‘camera’) when something warmer than the ambient tempera-ture passes in front of the sensor. Most commercially available cameras use passive sen-sors. Whilst well suited to studies of birds and mammals, these camera traps would be less effective at detecting reptiles, because their body temperature is close to the ambient tem-perature. Because passive sensors respond to heat, these camera traps should not be po-sitioned where there is direct sunlight, as this creates convection waves that could trigger the sensor resulting in empty or ‘ghost’ images.
Active infrared sensors are similar to garage door sensors and consist of two components: A transmitter and a receiver. The transmitter emits a beam of light, typically red, that is de-tected some distance away by a second component referred to as the receiver. When a passing animal breaks the beam of light, the detector unit triggers the camera to take a pic-ture. Active sensors detect objects within a detection zone (or ‘opportunity cone’). The apex of the zone starts at the small sensor within the camera trap and expands outward from the camera trap in a circle. The detection zone increases with the distance from the sensor but is still much smaller in area or cross-section than the field of view of the camera. As a con-sequence, the position of the animal in the photo depends on factors such as: (a) the size of the detection zone (which is influenced by how close the camera is to the animal), (b) the trigger speed (the length of time between the sensor detecting the object and the camera recording a picture), and (c) the speed at which the passing animal is moving (Rovero et al., 2010).
The main advantage of the passive sensor system is that camera traps are designed as a single unit that can be very small and easy to set. Active sensor camera trap systems consist of two or more units and so might be more difficult to position (figure 3 below).
Although active camera traps are employed less frequently than passive camera traps, there are some clear advantages: (1) the beam is typically very narrow so that the subject’s position along the beam can be more precisely anticipated; (2) the camera can be placed independently of the sensor and detector allowing for creative photographs (3) Ambient heating is not a problem for active sensor systems because the light beam remains unbroken by convection waves - how-ever, something like a falling leaf can break the beam and cause the camera to record a picture.

NINA Report 1079
16
Figure 3: Schematic illustration of Passive sensors (left) and Active sensors (right) camera trap systems (from Rovero, et al., 2010)
Trigger speed The trigger speed (the time between detection of the animal and shutter-release) must be care-fully selected to suit the target animals, the type of study and physical aspects of the camera trap location. Fast trigger speed is usually preferred for faunal inventories because there may be very few chances to record rare or elusive species. Camera traps set along trails require a faster trigger speed, because animals may pass through the frame quickly, whereas camera traps set at locations such as mineral licks, baited stations, by waterholes or under fruit trees can be slower since the animal is likely to stay in the area longer and pause in front of the camera trap. Trigger speed is often slow in less expensive digital cameras, where it can exceed 2 seconds, resulting in many empty photographs.
Sensor system
Advantages Disadvantages
Passive sensor Comprises a single unit,
so easier to set up
Detects animals of a
wide range of sizes
Placing the animal in the
centre of the frame may
be difficult
Can be triggered falsely
by heat from the sun,
which makes locating the
traps difficult
Active sensor Positioning the subject is
more precise
Not activated by heat
from the sun
Made of 2 or 3 units, so
is more complex to posi-
tion and programme
More expensive
Table 1: Main advantages and disadvantages of different sensor systems in camera traps
Types of flash Cameras with an infrared flash use arrays of LED lights that emit infrared light. Images taken with an infrared flash are often in the grey-scale or may be tinged reddish pink. Infrared flash is less noticeable by passing animals, uses less energy and is usually associated with quicker shutter speeds, but it may be difficult to identify the animal or to detect details of markings in the images, due to the lack of color and lack of sharpness in the images.
Incandescent (or white) flash uses xenon gas technology, which enables taking clear, color im-ages by day or by night. White flash tends to be very bright but brief, uses more energy and is associated with slower shutter speeds. It is well suited to studies where detailed coloration or marking needs to be visible, but has the disadvantage that it might frighten or disturb passing animals, thus influencing their behavior. There are various ‘tricks’ one can use to minimize the disturbance caused by the flash, without compromising the images taken (see Meek et al., 2012).

NINA Report 1079
17
Camera trap technology Film and digital cameras Cameras that use 35 mm film were the standard tool used by researchers working with camera traps in the previous decade. Over the last few years however, digital cameras have become readily available and widely used, and only a few manufacturers still make film camera traps. Despite this trend, film camera traps might not be replaced altogether and for this reason, they are still referred to in this guide. Earlier digital camera trap models copied the design of film camera traps with a standard digital camera connected to the motion sensor. Modern digital camera traps usually consist of a camera and sensor integrated on a single board.
The biggest advantage of digital over film camera traps is that they can store thousands of im-ages on a memory card. This means that cameras can be left in the field for a much longer period without the need for checking them. In addition, images can be viewed immediately in the field whereas film must first be developed. Data management is more easily achieved with digital photographs that avoid the necessity of scanning film.
Camera trap tech-
nology
Advantages Disadvantages
Film camera Fast trigger speed
(mostly)
Low power requirements
Very few models still available
Must be checked often as film
fills up quickly
All photos must be developed be-
fore selection can be made, and
have to be converted to digital
formats for capturing on data-
bases
Digital camera Can store many images
Easy to delete unwanted
or unusable images
Digital images easier to
manage
Slower trigger speeds (generally)
High per-day power requirements
Digital camera with
infrared flesh
Animals less frightened
by flash
Much lower power con-
sumption
Night photos are in black and
white only, making identification
difficult
Difficult to recognize coat pat-
terns
Digital camera with
white flash
Clear, color images by
day or night
Uses more power
Animals may be frightened or
their behavior affected by bright
flash
Table 2: Comparison of camera trap technologies
Still, video and time-lapse capabilities Other features of the camera trap that might be important are whether it takes still images only, or whether it has video or time-lapse capabilities. A video function can be useful for behavioral studies, although camera traps with a video function usually use more batteries; it may be worth considering if a sequence of still shots would suffice. Some camera traps may also have time-lapse functionality. This allows the operator to determine times at which the camera will be inac-tive, regardless of animal activity within the detection zone. Some cameras with infrared sensors have a dual functionality and can be set to lime-lapse, but others have no sensors and can be used only as time-lapse devices.

NINA Report 1079
18
Battery life Battery life varies greatly among camera trap models - some last a few weeks, but others run for two months or more and can take thousands of photographs. Battery life decreases with the number of photographs taken and cameras with an infrared flash usually have longer battery life than models with a regular flash. Weather conditions (e.g. low temperatures) can also affect the performance of batteries. To conserve power, some digital cameras go into a sleep mode after a certain amount of time, which can greatly increase the time it takes them to take the first picture. It is advisable to test the performance of the camera trap using different batteries in the setting it will be used, before investing in a large number of them. It is wisest to use the battery type that is recommended by the manufacturer of the camera trap model in use. Most models use either lithium, NiMH (nickel metal anhydride - rechargeable) or alkaline batteries. These have different properties (cost, life and how they are affected by heat or cold) that are compared in detail in Meek et al., 2012. Some camera trap models have an option for connection to an external battery or solar panel. Cost of camera traps The cost of camera traps ranges widely from about US$ 120 for a bottom-end model (e.g. a Primos Truth Cam 35), through to about US$ 550 for a mid-range model (e.g. a Reconyx HC500 or Scoutguard SG560) and US$ 1050 for a top-end model (e.g. a PixController Digital Eye) - see Meek et al., 2012, for a detailed comparison of costs. Choice of camera trap models depends on the number of units needed and the total budget. Because performance and characteristics vary between models, cost should not be the only criterion by which to choose camera traps (Meek et al., 2012) – the cash savings you make by buying a cheaper model, may carry high costs in terms of poor quality images, or data that is unsuited for the particular study. It is recommended that five variables are considered to assess cost-effectiveness of camera trap models: (1) the cost of the camera traps (including batteries), (2) the costs of field visits to the camera traps for battery/film replacement, (3) duration of the survey, (4) the number of images taken per unit time, and (5) the resolution and quality of the images captured (Rovero et al., 2010). The use of high quality, rechargeable batteries is a cost-saving strategy if the camera trapping survey is intended to run more than a few months, as the higher cost of rechargeable batteries is recovered. Similarly, if visiting the camera traps is expensive, then more expensive camera traps that have longer battery life will minimize the total costs. Less expensive camera trap models almost invariably are ruined sooner by moisture; their slow trigger speed will result in fewer photographs and a greater number of animals missed, and poor resolution results in poor images. Summary of points to consider in choosing camera traps that best suit the study Camera traps should be purpose-bought – do not buy any equipment before you have defined a purpose and a rigorous method that can be followed to achieve an empirical outcome. Table 3, below, summarizes the key aspects of a study that should be considered and the camera features that are best suited to them.
Issue or question Camera trap features to consider
Is the study species easy or
difficult to differentiate from
others in the survey area?
Color images will help with identification, but infrared
flash that results in black and white images will im-
pede identification
Video records of behavior may help with identifica-
tion

NINA Report 1079
19
Do you need to identify spe-
cific (individual) animals?
Color images will assist with identification of mark-
ings, so use incandescent flash (takes color day and
night)
How big or small is the ani-
mal?
Images of small animals may be over-exposed if the
camera is set too close
A wide detection zone is best for larger animals (e.g.
deer size and up)
Is the animal fast moving or
hard to detect (e.g. flying ani-
mals)?
for fast moving (e.g. flying) animals, use camera
traps with fast trigger speed, fast recovery time and
wide detection zone; this will ensure rapid firing and
multiple photos
Is the animal nocturnal or di-
urnal?
Flash-type is important
Color images are preferable (especially for nocturnal
animals)
High-trigger speed is needed at night
Passive or active infrared needs consideration
Is the animal easily fright-
ened/disturbed?
Incandescent flash will spook some animals (though
infrared is still detectable)
Do you want to study behav-
ior?
Infrared flash with additional video options are best
Do you want to identify spe-
cies or make inventories?
Video facilities are unnecessary
Is the study short or long-term Battery life and power-demand of the camera trap
are critically important; for longer-term studies use
batteries with greater power output and longer life,
and check them more often
Table 3: Camera trap features best suited to different types of study (adapted from Meek et al., 2012)
3.3 Setting up camera traps Inspect the area for optimal camera trap placement To maximize trapping success, cameras should ideally be placed in areas that maximize the visitation by species of interest. Different species use trails differently (Harmsen et al. 201023). Camera traps are often best set along trails. Knowledge of signs of wildlife presence and spots where the species of interest frequently pass can be of great help when choosing camera trap locations. Prior to placing camera traps, inspect the area selected for monitoring for at least 30 days to identify all locations that show preferential usage by the target animals. Using a GPS unit, record and map the identified locations.
23https://www.panthera.org/sites/default/files/differentialuseoftrails_Harmsen_foster_sil-ver_ostro_doncaster_2010.pdf

NINA Report 1079
20
Choose locations for camera traps Drawing on information gathered in 3.3.1, select camera trap locations that provide optimal op-portunities for recording focal species and that adequately cover the home range of the target animals. It is difficult to provide any general rules of thumb regarding the optimal location of cameras as this will be influenced by the purpose of the study and the type of animal. It is also important to consider the safety of the camera traps – if possible, camera traps should be located where the likelihood of tampering, vandalism or theft is very low and where the behavior of the animals themselves is unlikely to dislodge or damage the instruments. In places of high risk, we suggest locking camera traps to a tree or post. Most models provide cables that can be locked and custom-built metal boxes in which the camera can be secured. Place camera traps. Camera traps are usually placed in pairs at each of the locations identified in 3.3.2 - in some studies, depending on the target animals and the nature of the investigation, single cameras at each camera trapping station may suffice. The height at which the camera is set, will depend on what is available, and on the size of the animal being photographed. For general purposes, place camera traps approximately 50 – 100 cm above and parallel to the ground on a tree, rock, or wooden stake — this height can be adjusted depending on the size of the target species (e.g. for small animals like rodents, a height of 20 cm is best, but for larger animals, 100 cm or greater would be appropriate). Set pairs of camera traps to face each other, at a distance of between 4 and 5 m, so that both sides of an individual will be photographed when the trap is triggered — this facilitates identification of individuals (Karanth & Nichols 2002; Trolle & Kéry, 2003). It is common practice to offset the cameras slightly to avoid the flash from one interfering with the other. Do not set the cameras too close to the point of detection (the “aim”) - if it is too close to the animal, the images may be blurry or washed out (Meek et al., 2012). Camera traps are usually set perpendicular to the trail to obtain a good side image of the passing animal; however, they can also be placed slightly off perpendicular (i.e. about 60° between cam-era trap and trail) to increase the path length the subject will take through the frame (Rovero et al., 2010). This can be useful on very narrow trails or with camera models that have slower trigger times. Some practitioners (Meek et al., 2012) favor setting the cameras at a 45-degree angle to the trail as this increases the chance of detecting the animals and decreases the blind spot that some cameras have in the middle of the lens when the animal approaches directly from the front. We recommend some testing with the camera trap to determine the detection zone. This is es-pecially easy with digital models, but even film models often have a sensor test mode (e.g. a flashing red) that allows testing of the detection zone. Some of the issues relating to placement of camera traps are illustrated in Figure 4 below. It is important that the location of the camera traps provide optimal opportunities for photo-graphing, without causing undue disturbance to the animal. Some practitioners recommend that the ground in front of the camera trap should be kept clear of debris and tall vegetation, as failure to do so may result in the animal being obscured or the flash might be reflected — this results in over-exposed images or, for some cameras, false triggering of the sensor. In areas that have rapidly growing vegetation or accumulating snow it is necessary to check the site frequently to ensure the camera is not obscured. It should be noted that clearing may result in avoidance of the area by some animals (Pandav, personal comment 2012), and some compromise may have to be sought. As shown in Figure 3 below, obstacles such as branches can be used to guide the animal’s path. A scent or bait lure can be used to attract passing wildlife to the camera trap and to position the subject in the ideal place for a photograph. This allows extra times for the camera trap to obtain a good photograph and many lures have been developed that are especially useful for carnivores (Trolle & Kery, 2005; Long et al., 2007).

NINA Report 1079
21
Figure 4: Factors that need to be considered when placing camera traps in the field. In this figure, beside a suspected animal trail are four trees A-D. Trees A and D are too close to the trail for the camera
3.4 Configure camera traps Configuring the camera traps involves preparing, testing and coding the cameras before deploy-ment; setting the sensors, date, time and time interval; and recording the camera trap data. Prepare and test cameras All cameras should be prepared and tested before going to the field so that they simply need to be activated once set up in the field. Make sure you have read the user manual for your camera trap and follow the instructions carefully. Check the proper functioning of the sensor and camera by taking test pictures. Carefully inspect all seals to ensure there are no leaks. Dirt on the seal allows water to enter so camera traps should also be as dust-proof as possible. Coding Each camera trap must be uniquely numbered, or coded, for identification purposes. Write the code with a permanent marker on the housing of each camera trap. Some digital camera traps allow printing the code automatically at the bottom of each photograph. If this is not an option then taking a picture of a whiteboard showing the camera trap code with the date and time is a useful technique. For film cameras, this allows identification of rolls of film from the first picture. Write the camera trap code, and start and end date on the outside of the film roll to easily track film from the field to development. Setting the date and time Make sure that the date and time are carefully set on each camera, using the 24- hour clock, and re- check the date in the field when installing the camera trap. Setting the sensor(s) Sensor sensitivity is a critical setting, especially in some passive-sensor camera traps, in which it is easy to set it too low or too high. We recommend higher sensitivity when working in hot climates and when small species are the targets.

NINA Report 1079
22
Setting the time interval For most camera trap models, the time interval between consecutive photos must be chosen. For normal use, set camera traps to run continuously with a 1 - 2 minute delay between photos. Please note that the time interval must be adapted for the type of animal being studied. For each pair of camera traps, be careful to ensure that the two cameras do not fire simultaneously (this will cause over-exposure). For some applications, it may be desirable to record sequences of images with shorter delays. For example, if the goal is to detect reproductive events among carnivores, it is likely that the mother will pass by first, followed immediately by the young, thus requiring a minimal time delay between images. Many of the modern digital camera traps allow for this type of setting, and with large SD cards, there is little danger of the memory being over-filled. Testing camera traps Once the camera traps are configured, test each pair of camera traps by sitting between them and displaying the location number as the cameras take a picture. This dual purpose test demon-strates that cameras are properly set, and causes the trap location to be recorded, so that there is no question as to the origin of the images. Recording the camera trap data The images captured by the camera trap will be useless without supporting site data. For each camera trap (or pair of traps), it is recommended that data are recorded to reflect: Deployment information (camera code, position, time and day of camera trap activation and by whom, any other useful information such as weather conditions); monitoring information (battery type and dates they were changed; film/card type, dates changed and by whom; any notes relating to signs of animal activity, human interference and so on); and site information (the site name, GPS location, camera code, a description of the habitat, distance to the next nearest camera trapping site or proximity to human habitation, signs of animal activity, and so on). To assign a site code, assign each camera trap location its own number and assign letters A and B to the cameras in each pair. Ideally, this information should be recorded on pre-configured datasheets, of the type shown in Table 4 below. You may choose to have different data sheets for the different categories of information (deployment, monitoring and site), or you could combine it all on one sheet, as in the example shown.
Site code: Date set: Date retrieved:
Name(s) of recorder (s): Location:
Location description
GPS coordinates E N
Other location information Proximity to next nearest camera trap:
Proximity to human set-tlement:
General habitat description:
Habitat types:[customize for location]
Type a: Type b:
Type c: Type e: Type f:
Camera details
Camera type: Camera code(s) Camera direction:
Camera height: Battery types: Battery replacement date(s):
Card/film replacement date: Card/film type: Number of images:
Lure/Bait
Yes/no: Type: Distance to lure/bait:
Other notes: Table 4: Example of a camera trapping data sheet showing the categories of information that should ideally be recorded. This example is adapted from those in other published sources, and is intended to serve as an example that could be customized for a specific project.
NINA Report 1079
23
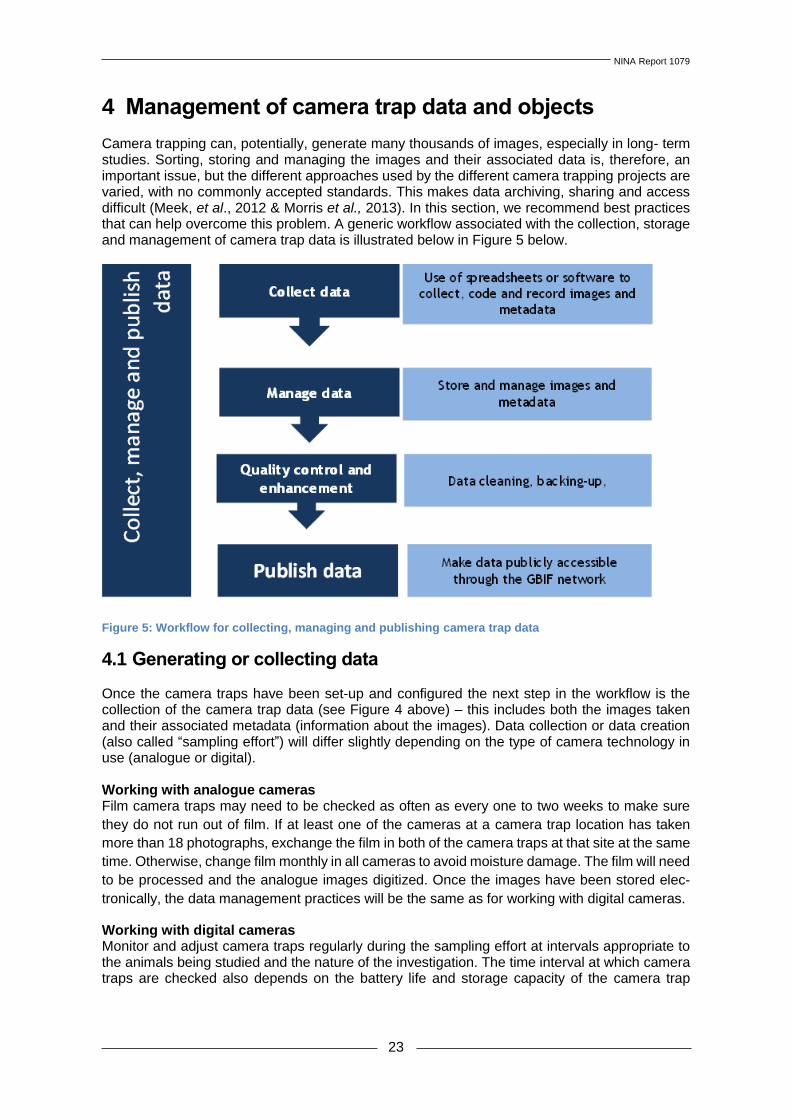
4 Management of camera trap data and objects Camera trapping can, potentially, generate many thousands of images, especially in long- term studies. Sorting, storing and managing the images and their associated data is, therefore, an important issue, but the different approaches used by the different camera trapping projects are varied, with no commonly accepted standards. This makes data archiving, sharing and access difficult (Meek, et al., 2012 & Morris et al., 2013). In this section, we recommend best practices that can help overcome this problem. A generic workflow associated with the collection, storage and management of camera trap data is illustrated below in Figure 5 below.
Figure 5: Workflow for collecting, managing and publishing camera trap data
4.1 Generating or collecting data Once the camera traps have been set-up and configured the next step in the workflow is the collection of the camera trap data (see Figure 4 above) – this includes both the images taken and their associated metadata (information about the images). Data collection or data creation (also called “sampling effort”) will differ slightly depending on the type of camera technology in use (analogue or digital). Working with analogue cameras Film camera traps may need to be checked as often as every one to two weeks to make sure
they do not run out of film. If at least one of the cameras at a camera trap location has taken
more than 18 photographs, exchange the film in both of the camera traps at that site at the same
time. Otherwise, change film monthly in all cameras to avoid moisture damage. The film will need
to be processed and the analogue images digitized. Once the images have been stored elec-
tronically, the data management practices will be the same as for working with digital cameras.
Working with digital cameras Monitor and adjust camera traps regularly during the sampling effort at intervals appropriate to the animals being studied and the nature of the investigation. The time interval at which camera traps are checked also depends on the battery life and storage capacity of the camera trap

NINA Report 1079
24
model, the expected number of photographs as well as accessibility. If cameras are taking ex-cessive numbers of photographs of the same individuals (as often happens with animals like peccaries or large terrestrial birds), the delay between trigger intervals can be increased. Digital camera traps can store many more images than film models, but their autonomy depends on the battery life: Most models can run for up to one month and those using an infrared flash can run for up to 2 months and store thousands of images. Camera traps will still need to be checked regularly (at least once every three to four weeks and in some cases even more often) to detect camera traps that have been moved by animals or that have developed problems of some kind. When checking camera traps, the following data should be recorded: Number of photographs, whether film or batteries have to be changed, battery level as well as any obser-vations about the camera (See table 4). This can help estimating average battery life and, in cases in which cameras have stopped working, can be used to work out when the camera failed. If possible, one or two spare camera traps should be taken to replace camera traps that have stopped working. We also recommend checking the date and time setting of each camera trap each time the camera trap is visited. Collect and replace memory cards from digital cameras and download the images onto a suitable image-viewing device (laptop or Cuddeviewer). Be sure to record the day and time each card was retrieved.
4.2 Image coding Each camera trap can, potentially, capture many hundreds of images. To facilitate quick identi-fication and sorting of images, a file name (or unique identifier) should be assigned using a con-sistent format. The file name, or unique identifier should contain the symbols, numbers or letters to denote the following: Geographic location, Camera trap code, Date and time of collection, Sequential photo number and The object in the image.
Example from Sanderson, 2004: Assign file names to images using the following format: XXXXXIDxNNddmmyyyyhhmm.jpg where “XXXXX” is the field station acronym, “IDx” identifies the camera (ID is the camera trap number; x is A or B, referring to each camera in the pair), NN is the species number on the Excel spreadsheet, “dd” is the day, “mm” is the month, “yyyy” is the year, “hh” is the hour, and “mm” is the minute (see Table 5 below).
Component in file name Meaning
XXXXX Station acronym
IDx Identifies the camera, ID is the camera trap camera number, x is A or B referring to each camera in the pair
NN Species number on the Excel spreadsheet
DD Day
MM Month
YYYY Year
Hh Hour
Mm Minute
Table 5: Scheme for naming multimedia objects using the method developed by the TEAM group (from Sanderson, 2004).

NINA Report 1079
25
Researchers working in India have assigned filenames using a string that serves as a unique identifier. All file name components (e.g. for the file name CTP050612011001A00049a) is pro-vided in Table 6 below.
Component in file
name
Meaning
CTP Refers to the definition of the dataset, i.e. camera trap photographs
05 State code, in this case for Uttarakhand from Census of India
061 District code, for Pauri from Census of India
2011 Year in which photograph was captured
001A Alpha-numeric code for the camera trap ID; the first three digits refer
to the trap number, and A/B is added as a suffix since camera traps
are often deployed in pairs facing each other at each location
00049 Refers to the sequential photo-capture number (nth capture) ob-
tained at a particular camera
a The lower case “a” helps distinguish between multiple objects in the
same photograph; if there was a second animal in the same photo-
graph, the same photograph needs to be entered again in the data
sheet template with the unique identifier
CTP050612011001A00049b, and so on.
Table 6: Components in file name
4.3 Record the data on the datasheets and enter the data Two data forms (set up as Excel spreadsheets) should be used - the first is the summary data form for all camera trap locations (table 4 above), and the second is a record of each photograph taken by each camera (table 5 above). Data forms can be generated using readily available and easy-to-use software such as e.g. Microsoft Excel. The data sheets should essentially include all information that could be extracted from the cam-era trap image, such as date, time, species, GPS location of the site and other biological infor-mation (age-sex classification, number of individuals, reproductive status etc.) depending on the objectives of the study. For instance, in most studies estimating density of species using photo-graphic capture-recapture frameworks, each photograph is assigned an individual identification based on pelage patterns and this could be entered here.
4.4 Image and image data management It is important that the camera trap data are well organized during all parts of the study to avoid confusion and possible data loss. Data sorting requires that each photograph have at least the following information: (1) date, (2) time, and (3) camera trap site code. While the date and time is usually captured on each image, only some digital camera traps allow imprinting the camera trap code on each photograph. For other camera traps, the camera trap code must be tracked throughout the study. Hence we recommend taking a picture of a whiteboard with the camera code, date, and time when setting up the camera trap, and when changing film or the memory card so that the first and last picture on each roll or memory card contains the proper information. We also recommend writing the code as well as the start and end date on each roll of film.

NINA Report 1079
26
To manage photographs from film camera traps, several options are available. One option is to print contact sheets with all photographs shown as thumbnails, and then only the photos of in-terest are printed, digitized and archived. The camera trap code should be entered either as part of the folder name or in a text file in each folder. Digital images are usually stored in common file formats such as TIFF, JPEG, PSD or, some-times, RAW files. While the photographs constitute the raw data, the information about them must be organized in a spreadsheet or database for analysis. The minimum data that must be recorded for each photograph is the code of camera trap that took it, the date and time, and the species that appears in the photograph. Additional information that can be useful is the sex and age of the animal, the number of individuals and comments on the behavior shown. Spreadsheet applications (e.g. Microsoft Excel) are still the most commonly used software for managing camera trap data. While they are simple to use, their main disadvantage is that re-organizing data for different analyses can be time consuming. A more flexible alternative is the use of either relational databases in the form of desktop applications (e.g. Microsoft Access, Filemaker) or database servers (e.g. MySQL, SQL Server). In most cases, the former will be easier to use since they include tools for building forms and queries, but the latter might be useful when data is being used and managed by a group of people and must be stored on a central server. Database systems allow images to be linked to the data and all data to be managed in a single system. Dual-screen computer systems make data entry and management easier and there are many specialist programmes available for working with camera trap images (for exam-ple MapView24, DeskTeam25; CameraBase 1.5.126 – see Meek et al., 2012 for a comprehensive summary). CameraBase is a free software for managing camera trap data. CameraBase is based on Microsoft Access and can manage camera trap data together with the digital images. The software has a wide range of analysis and data-export options built-in, including activity patterns, capture-recapture analysis, occupancy analysis, and species accumulation and rich-ness estimation. It is very important that the image collection is backed-up. Special digital asset management systems (DAM)27 can also be used for managing images. The cheapest and easi-est way to manage images, however, is to use a Microsoft Excel or Access-based database, and for the bulk of users, this will be the most cost-effective method.
4.5 Quality control and quality enhancement Care should be taken to record all data carefully. The genus, species, date, and time of each photograph must be verifiable if the data are to be analyzed properly - this means that the col-lection and management of metadata is a critically important part of the survey. It is important to record the total number of photographs taken, but before data analysis begins, the data can be cleansed by removing those images that are superfluous or of poor quality – this includes those that are taken during camera set-up and retrieval and any images that are of poor resolution, or empty images. Original camera trap images may also be edited or modified in various ways to enhance the quality. These edits may include altering the resolution, brightness, contrast, zooming in, cropping the image to focus on the biodiversity object.
4.6 Management of camera trap objects Preserving original camera trap objects The original camera trap image should be renamed using a persistent identifier and stored in a folder containing all images captured in a sampling session. These images can be provided in the desired resolution (high, medium, low) and linked to the thumbnails provided on the data
24 http://www.reconyx.com/page.php?id=121 25 http://www.findbestopensource.com/product/deskteam 26 http://www.atrium-biodiversity.org/tools/camerabase/ 27 http://www.capterra.com/digital-asset-management-software

NINA Report 1079
27
portal. Management of multiple access points and the capacity to return the image in different forms and resolutions is essential. Enhancing quality of camera trap objects If any images have been enhanced or modified by cropping or “retouching”, or have been edited in any way, this needs to be described in detail and captured in the Metadata datasheet. It is important that the methodology used as well as how and when it might have been changed or edited is reflected.
Generating “child” objects from “parent” objects The original camera trap image may be cropped if required to describe sub-parts of the image and “child” objects can be generated in the process. For instance, a camera trap image may include two tigers. So, the image may be cropped so that each tiger can be treated as an indi-vidual object with a unique record in the database. This is illustrated in Figure 6 below.
Figure 6: Creating child objects form a parent image
Persistent identifiers and naming conventions for parent, child and derived objects In cases when a child or derived object is generated to describe sub-parts of the camera- trap
image, the object should have a suffix “b”/”c” at the end of the unique identifier against “a” for the
parent object.
Establishing links between parent, child and/or derived objects In cases when a child object is generated to describe sub-parts of the camera trap image, it may be linked to the parent image by following the guidelines given below:
The parent object should have a suffix “a” at the end of unique “identifier” and the “identi-fier” of the child/derived object should have a suffix “b”/”c” onwards. Other digits in the unique identifier remain unchanged.
The parent object must mention the child object under the field “Associated Specimen Ref-erence” in the datasheet and vice versa.
Conventions and best practices for data management In choosing a data management system, it is important to bear the following in mind:
It is essential to have a well-defined procedure in place from the start so that users end up with data that can be effectively analyzed and managed using the preferred management tools

NINA Report 1079
28
The data management system selected should, so far as possible, make use of freeware or cheap, well-established and readily available software, to reduce investment costs and to avoid possible disruptions caused by problems with very specialized software (especially if the IT capacity available to you is relatively low)
The learning curve for data management and processing should not be too demanding; the ease with which researchers can integrate the requirements of the data management sys-tem into their existing ways of working will influence how effectively it is taken up.
The data should be stored and managed in a way that makes it easily exchangeable with other systems.
Many valuable multimedia resources exist that have no information stored in databases. Some may have a web presence and others not. Even those available online may not be adequately discovered by search engines, or may be lost in the noise of images from unreliable sources. Image repositories are very diverse systems and what is needed is an infrastructure that can: (i) leverage such collections for scientific analysis, (ii) facilitate free and open access to the data, and (iii) assist in better management of these resources (Morris et al., 2013).

NINA Report 1079
29
5 Open access: Barriers and needed actions Data sharing and open access to publicly funded data is on the political agenda worldwide. The following sections are entirely based on an unpublished international literature review (Hanssen and Heggberget et.al, 2014) made by the Nordic LifeWatch pilot project coordinated by the Nor-wegian Institute for Nature Research (with support from GBIF) on request from the Nordic Re-search Council NORDFORSK28.
5.1 Technology, standards and financial framework Infrastructure shortcomings, capacity limitations, inadequate competence and lack of funding
often represent barriers for making publicly funded data openly accessible. Harmonizing tech-
nology and databases towards interoperable data protocols is a practical issue, though highly
influenced by the institutional priorities, in-house ICT-competence and financial capacity. Many
institutions would like to share data, but lack the ability to prioritize it, and in the longer run, to
realize it. Making data available is a very important effort, but to ensure that this work does not
depress institutional research activities, national authorities should target specific capacity build-
ing programmes towards the institutions.
5.2 Institutional culture and individual researcher attitudes Conflicting informal agendas both within and between research institutions will always influence
the actual data sharing ability. Such agendas represent potential barriers for sharing of publicly
funded data. Institutions should therefore be obligated to develop strict data policy strategies in
order to prevent such barriers from evolving.
Metadata is crucial for data documentation and data reuse. There are several standards for
metadata reporting but these are often too comprehensive and complicated to use, resulting in
a very time-consuming metadata mapping. This problem has been reported from several inter-
national research projects (Schmidt- Kloiber et al. 2013). The reluctance to report metadata could
have several explanations. Metadata reporting can be both time- and work consuming, and when
such resources are limited, the individual scientist may fear that this work has to be done at the
expense of doing real science. One solution to avoid this researcher’s dilemma could be to allo-
cate sufficient resources for mandatory metadata reporting in project contracts. In Europe Benis-
ton et al. (2012) suggest developing an EU-directive in the form of a best practice guideline for
data management, data sharing and open access. Another, non-financial means of compensat-
ing for metadata reporting burden could be to urge scientists to use social scientific networks
such as Mendeley29 or ResearchGate30 to showcase their reported metadata. Some researchers
fear that sharing metadata with the public implies losing the intellectual properties to the data
itself. It is therefore very important to underline that publishing metadata does not automatically
imply making data freely available. Information about intellectual property, criteria for use and
contractual arrangements need to be specified in the metadata.
When it comes to licensing and accreditation of data, lack of knowledge can be an obstacle for
researchers to share under an open license. While the function of an open license is to make
data more widely reusable while maintaining ownership and ensuring due accreditation, it is often
28 http://www.nordforsk.org/en?set_language=en 29 http://www.mendeley.com/ 30 http://www.researchgate.net/

NINA Report 1079
30
felt as “giving something away” rather than sharing. This holds especially true for a license al-
lowing for commercial use, where many may feel that it allows others to profit financially from
work that one has shared freely. In reality, it is all but impossible to earn money directly from
work under an open license, as the license and owner have to be clearly stated. It does however
allow third parties to invest in the usage of the data (e.g. for impact assessments, customised
web portals, web services, etc.), adding to its value to such an extent that it is economically
viable as a new product. It is important to communicate these aspects well, to safeguard both
the influx of data as its usability under the appropriate terms. Bottom line is that the license and
the owner of the original data have to be clearly stated.
Some data owners fear that open access could lead to misuse and/or misinterpretation by other
scientists. These data owners also fear that they will not be credited if other scientists use their
data. Again, these worries could be met by a thorough metadata provenance scheme. Uncer-
tainty and lack of knowledge on the consequences of open access often lead to scepticism
among scientists and data owners. As a response to this, in Norway, the Norwegian Agency for
Public Management and eGovernment31 has developed an Open data handbook32 addressing
legal, social and scientific aspects of open data sharing. However, this handbook only addresses
open data issues at a general level, and extended documentation for scientific issues are there-
fore desirable.
5.3 The need for academic accreditation of open data access
Academic accreditation is important for any researcher’s scientific career. Currently, open data
sharing does not directly honour researchers the same way as published scientific articles in
high-ranking journals. Electronic publishing of scientific literature calls for mechanisms of online
reference citations that ensure future recognition and retrieval. Electronic publishing of data rep-
resents similar but more complex challenges. Validated data citation standards and best prac-
tices have to be implemented to meet these challenges. Several institutions, countries and dis-
ciplines have been working on this task for some time. Political and technical approaches have
been introduced by the American National Information Standards Organisation (NISO)33.
Others have been working on the development of Persistent Identifiers (PID) which are live and
easily maintainable identifiers referring to digital objects, data files (such as documents, pictures
or software installation files) or to physical entities (such as collection specimens). PIDs are not
like hyperlinks, as they will remain valid after being moved between clients and organizations.
Hyperlinks (HTTP URLs) provide a location service, while PIDs provide a naming service for the
entity. Several standards have reached a mature level of development:
● Uniform Resource Name (URN)
● Persistent URL (PURL)
● Digital Object Identifier (DOI)
● National Bibliography Numbers (NBNS)
● Archival Resource Key (ARK)
● Open URL
● Universally Unique Identifier (UUID)
31 http://www.difi.no/artikkel/2009/11/about-difi 32 http://data.norge.no/sites/data/files/Veileder-i-tilgjengeliggjoring-av-offentlige-data-V2.pdf 33 http://www.niso.org/home/

NINA Report 1079
31
The Digital Object Identifier (DOI)34 became an ISO-standard (26324)35 in May 2012, driven by
the international non-profit DOI foundation (established in 1998). Delegates from several
CODATA-committees (Committee for Data for Science and Technology)36, the ICSTI (Interna-
tional Council for Scientific and Technical Information)37 and others have established an interna-
tional task group on data citation standards and practices38 to investigate relevant issues, coor-
dinate activities and to suggest common practices and standards for the scientific community.
Other important groups are the DataCite initiative39 and the group composed of SCOR (Scientific
Committee on Oceanic Research)40, IODE (International Oceanographic Data and Information
Exchange)41, and MBLWHOI (Marine Biological Laboratory/Woods Hole Oceanographic Institu-
tion Library)42, meeting annually to discuss data storage, interdisciplinary data publication, and
interaction with scientific publishers. In 2012 the group made an online bibliography43 of institu-
tions focusing on data citation and referencing practices.
In 2012 GBIF and PenSoft Publishers44 pioneered a workflow between the GBIF Integrated Pub-
lishing Toolkit (IPT)45 and Pensoft journals such as PhytoKeys46, ZooKeys47, BioRisk48, NeoBi-
ota49 and Nature Conservation50 to automatically export metadata into the form of a data paper
manuscript, based on the Ecological Metadata Language (EML)51. Data papers are scholarly
journal publications whose primary purpose is to describe a dataset or a group of datasets, rather
than to report a research investigation as such, it contains facts about data, not hypotheses and
arguments in support of the data, as found in a conventional research article (Chavan and Pe-
new, 2011). Pensoft has recently established a new journal Biodiversity Data Journal52 dedicated
to publishing data papers (Smith et al., 2013).
The Nature Publishing Group launched in 2014 a new platform named Scientific Data53, for open-
access, online-only publication of the descriptions of scientific valuable data sets. Scientific data
provides formal peer-review for scientific data sets and a solution for citation of data sets in a
similar manner as for citation of other scientific works. Scientific Data will build further on more
general data repositories such as Dryad54 and Figshare55 where the actual data sets to be de-
scribed in Scientific Data will be uploaded and can thus be accessed. The Dryad data repository
34 http://www.doi.org/ 35 http://www.iso.org/iso/catalogue_detail?csnumber=43506 36 http://www.codata.org/ 37 http://www.icsti.org/ 38 http://www.codata.org/taskgroups/TGdatacitation/index.html 39 http://www.datacite.org/ 40 http://www.scor-int.org/ 41 http://www.iode.org/ 42 http://www.mblwhoilibrary.org/ 43 http://www.codata.org/taskgroups/TGdatacitation/Bilbliography_Links.html 44 http://www.pensoft.net/ 45 http://code.google.com/p/gbif-providertoolkit/ 46 http://www.pensoft.net/journals/phytokeys 47 http://www.pensoft.net/journals/zookeys/ 48 http://www.pensoft.net/journals/biorisk/ 49 http://www.pensoft.net/journals/neobiota 50 http://www.pensoft.net/journals/natureconservation 51 http://knb.ecoinformatics.org/software/eml/ 52 http://biodiversitydatajournal.com/ 53 http://www.nature.com/scientificdata/ 54 http://datadryad.org/ 55 http://figshare.com/

NINA Report 1079
32
is also open for researchers to share scientific data sets underlying scientific publications ac-
cepted by peer-review journals. Figshare provides an even more flexible platform for researchers
to share their scientific results in any file format and in a scholarly citable, sharable and discov-
erable manner. In addition, GBIF (Global Biodiversity Information Facility) will start collaborating
with Scientific Data, the collaboration will develop methods for authoring submissions to the new
journal using the standard formats for metadata recommended for sharing data through the GBIF
network.
5.4 Data management, strategies and contractual arrangements
Making publicly funded data accessible from structured databases is an institutional responsibil-
ity that has to be implemented in long-term strategies. Internationally, several scientific funding
sources have started to demand data management plans for project funding. Such data man-
agement plans should act as a guideline checklist to ensure that data are managed according to
all relevant aspects of data management.
The international Data Curation Centre (DCC) in the UK has developed a data management plan
template56. DCC has also developed an online solution for developing and maintaining such a
data management plan. Examples on data management plans are also available from the Aus-
tralian National Data Service (ANDS)57.
When it comes to actual strategies regarding development and implementation of data manage-
ment plans there is substantial variation among international research institutions. GBIF has de-
veloped the “Best practice guide for Data Discovery and Publishing Strategy and Action Plans”58.
Strategies and plans have to outline all aspects related to responsibilities, intellectual property
rights, utility value and synergies associated with data sharing.
It is very important that these issues are formalized in contractual arrangements at the start of
an inventory project or a research project. The source of funding is responsible for consistently
embedding such practices in contracts, and to see to their implementation by the contractor. The
contractor is then legally responsible for the collection, maintenance, documentation and sharing
of data.
Factual data, also in the form of prosaic text, is not copyrightable (ref https://wiki.creativecom-
mons.org/Data), and thus does not require a license to allow its reuse. There are a number of
reasons to apply a license nevertheless. First and foremost, a sufficiently open license ensures
the usability of a dataset by covering the anomalous copyrightable data within it, without requiring
a check for such data. In addition, a license setting requirement to attribution is psychologically
important as it seemingly guarantees data sharers proper scientific accreditation, even though
scientific accreditation of data sources is not governed by copyright.
The most common options for scientific data are either licensing under a license requiring attrib-
ution, such as Creative Commons Attribution (CC BY)59, or a waiver such as Creative Commons
Zero (CC0)60 where the dataset is released into the public domain, thus freeing it from possible
56 http://www.dcc.ac.uk/resources/data-management-plans 57 http://ands.org.au/datamanagement/index.html 58 http://www.gbif.org/orc/?doc_id=2755 59 http://opendefinition.org/licenses/cc-by/ 60 https://creativecommons.org/publicdomain/zero/1.0/

NINA Report 1079
33
copyright restrictions. In the latest version of CC BY (4.0)61 accreditation is flexible enough to
remove the need for anyone reusing such data to determine how to properly attribute these.
Scientific practice requires scientific attribution, regardless of enforcement by a license, so the
more open CC0 guarantees the usability of the data without annulling proper scientific accredi-
tation of the source.
In practice, however, data owners are more reluctant to share even non- copyrightable data
without a license demanding attribution. This may lead to data not becoming available, whereas
it would have under a license that, where legally applicable at all, does not extend beyond com-
mon scientific practice. It can thus be more pragmatic to allow a CC BY license with an added
predefined agreement in which attribution is specified in a way that does not hinder use within or
outside the scope of a national camera trap WEB-portal. It is essential for reuse of large, com-
pound datasets that both content and licensing are machine-readable: Directly readable and
processable by a computer so that it can readily be shared between IT systems.
61 http://creativecommons.org/licenses/by/4.0/

NINA Report 1079
34
6 Proposed actions for open access to Indian biodiversity data
Data and Information have gained high significance for developmental planning in knowledge societies. Civil societies seek open access to such data and information generated with public funds for planning developmental processes. On the other hand, sensitivity requirements de-mand the restriction of access and availability of sensitive data. With growing levels of misuse of technologies by non-state actors, providing free access to data and information is a challenge faced by countries all around the globe. National Data Sharing and Accessibility Policy (DSAP) published in the Gazette of India on March 17th 2012 by the Ministry of Science and Technology envisages a new data sharing policy (Anonymous, 2012). The current classification of data of sharing is based on the Open Series Data model62. In this process, any data not specifically included in the “Open Series Dataset” remains inaccessible for public use. The Government of India has accorded approval to the changed paradigm of migrating towards a “Negative List” of data rather than definition of an “Open Data Series Model”. Such Negative Lists could be based on features rather than nature and type. Data owners and sources will therefore need to define and classify their data based on “features” and “exclusion principle” for preparing a negative list within a defined period. Department of Science and Technology (DST)63 will serve as a Nodal Point and repository for all kinds of data. Introduction Data are recognized at all levels as a valuable resource that should be made publicly available and maintained over time to ensure that their potential value is realized. There has been an increasing demand by the community, that data should be made more readily available to all, to enable a rational debate and better decision making. Principal 10 of the United Nations Declaration on Environment and Development (Rio de Janeiro, June 1992), stated that: “………..each individual shall have appropriate access to information concerning the environment that is held by public authorities ……. and the oppor-tunity to participate in the decision making process. States shall facilitate and encourage public awareness and participation by making information widely available (United Nations, 1992)” Section 4(2) of the Right to Information Act, 2005 reads “It shall be a constant endeavor of every public authority to take steps in accordance with the requirements of clause (b) of sub-section (1) to provide as much information suo motu to the public at regular intervals through various means of communication, including internet, so that the public have minimum resort to the use of this Act to obtain information” The principles on which data sharing and accessibility are needed include: Openness, Flexi-bility, Transparency, Legal conformity, Protection of intellectual property, Formal responsibility, Professionalism, Interoperability, Quality, Security, Efficiency, Accountability, Sustainability. There is large quantum of data generated at the cost of public funds by various organizations and institutions in the country. Most of this data is non-sensitive in nature and can be used by public for scientific, economic and developmental purposes. The Data Sharing and Accessibility Policy (DSAP) is designed to apply to all non-classified data collected using public funds. The policy would help data users and data solicitors get access to data through established proce-dures and defined norms. NDSAP published in the Gazette of India on March 17.th 2012 by
62 http://www.opendatamodel.com/ 63 www.data.gov.in

NINA Report 1079
35
Ministry of Science and Technology envisages a new data sharing policy (Anonymous, 2012). The current classification of data of sharing is based on Open Series Data model64. In this pro-cess, any data not specifically included in the “Open Series Dataset” remains inaccessible for public use. The Government of India has accorded approval to the changed paradigm of migrating towards a “Negative List” of data rather than definition of an “Open Data Series Model”. Such Negative Lists could be based on features rather than nature and type. Data owners and sources will therefore need to define and classify their data based on “features” and “exclusion principle” for preparing a negative list within a defined period. Department of Science and Technology (DST)65 will serve as a Nodal Point and repository for all kinds of data. Objectives The objectives of the National Data Sharing and Accessibility Policy (DSAP) are to address all issues related to data in terms of the available scope of sharing and accessing spatial and non-spatial data under broad frameworks of standards and interoperability:
Data Classification
Technology for sharing and access
Current legal framework (RTI Act and Privacy Act)
Benefits of the data sharing policy
Maximizing use: Ready access to governmental data will encourage more extensive use of
a valuable public resource for the benefit of the community.
Avoiding duplication: By sharing data, the need for separate bodies to collect the same
data will be avoided resulting in significant cost savings in data collection.
Maximized integration: By adopting common standards for the collection and transfer of
data, more integration of individual databases will be possible.
Ownership: The identification of owners for the principal data sets enable users to identify
those responsible for implementing prioritized data collection programs and for developing
data standards.
Better decision-making: Quality information allows making competent decisions. Avoiding
large potential costs. Ready access to existing spatial data is essential for many decision-
making tasks such as protecting the environment, development planning, managing as-
sets, improving living conditions, national security and controlling disasters.
Equity of access: A more open data transfer policy ensures better access by all genuine or
authenticated users.
Definitions Data means a representation of information, knowledge, facts, concepts or instructions which are being prepared or have been prepared in a formalized manner, and is intended to be pro-cessed, is being processed or has been processed in a computer system or computer network, and may be in any form (including computer printouts magnetic or optical storage media, punched cards, punched tapes) or stored internally in the memory of the computer. It also in-cludes data in conventional form on paper and other media. Sensitive personal data - Sensitive Personal data or information of a person shall include infor-mation collected, received, stored, transmitted or processed by body corporate or in-termediary or any person, consisting of:
64 http://www.opendatamodel.com/ 65 www.data.gov.in

NINA Report 1079
36
Any proceedings for any offence committed or alleged to have been committed by him, the disposal of such proceedings or the sentence of any court in such proceedings.
Information related to financial information such as Bank account/credit card/debit card/other payment instrument details of the users
Physiological and mental health condition
Medical records and history
Biometric information
Information received by body corporate for processing, stored or processed under lawful contract or otherwise
Data set means a named collection of logically related features including processed data or in-formation. Data Archive means a place where machine-readable data are acquired, manipulated, docu-mented, and distributed to others for further analysis and consumption. Data Acquisition means an Initial acquisition (collection) of data or subsequent addition of data to the same specification, including data quality assurance processes. Data Enclave means a controlled, secure environment in which, eligible users can perform anal-yses using restricted data resources. Metadata is the information that describes the data source and the time, place, and conditions under which the data were created. Metadata informs the user of who, when, what, where, why, and how data were generated. Metadata allows the data to be traced to a known origin and known quality. Negative list is a list of non-sharable data as identified by the ministries / departments Raw Data are field observations, contents of project-related data study repositories, survey re-sults, results of laboratory studies and preliminary analysis. Restricted Data are datasets that cannot be distributed to the public due to confidentiality con-cerns, security considerations, or other issues. Standards / Compliant Applications embeds data handling functions (e.g., data collection, management, transfer, integration, publication, etc.) and operates on data in a manner that complies with data format and data syntax specifications produced and maintained by open, standards bodies. Spatial Data are data representing geographically referenced features that are described by ge-ographic position and attributes. Typically it includes data about natural resources, the environ-ment, land use, demography and socio-economic. Unique Data are data that cannot be readily replicated. Non-shareable data (Negative List) National security and privacy are paramount to the country and individual respectively. In view of this, it is mandated that each government ministries / departments need to prepare a negative list. The negative list is that which includes the data that is not sharable and the same would not be available on the public domain. Sections 8 and 9 of the Right to Information Act (2005), The Information Technology Act (2000)66 and the right to privacy upheld by the Honorable Supreme Court of India in its various judgments, need to be consulted and taken into consid-eration while preparing the negative list.
66 http://rti.gov.in/

NINA Report 1079
37
Shareable Data
The other datasets, which have not been included in the negative list, shall be verified and
validated by the individual scientists and then shared.
Appropriate support and incentives for data clean up, documentation, dissemination and
storage shall be given by funding agencies (about 15% of the project cost).
The metadata indicating what data is accessible shall also be ported on the website. The
metadata should contain information related to the data sets available, their quality and the
data formats.
Data Classification Departments generate different types of datasets. The types of data produced by a statistical system consist of derived statistics like food habits and databases from census and surveys. The geospatial data however, consists primarily of satellite data, maps, etc. In such a system, it becomes important to maintain standards in respect of metadata, data layout and data access policy. Datasets are to be classified in various types:
Open Access data. Open access to research data from public funding should be easy,
timely, user- friendly and Internet-based. Data should be made openly available as soon as
possible but no later than 1 year after the data was collected.
Registered Access. The users are required to register their names through the web and
then download the information needed using the user name and password provided to them
at the time of registration.
Restricted Access. Access to the following categories of information, in case these are
not already in public domain – are restricted:
o Exact coordinates of strategic locations
o Information about persons in terms of protection of data privacy
o Protection of intellectual property rights
The data users who are accessing / using this data for research should clearly acknowledge the source
Technology for data sharing and open access A state-of-the-art data warehouse with online analytical processing (OLAP) capabilities, which includes providing, a multi-dimensional and subject oriented view of the database needs to be created. This integrated repository will hold data of current and historical nature and this reposi-tory will over a period encompass data generated by WII. The main features of the data ware-house need to include:
User friendly interface
Dynamic / pull down menus
Search based Report
Secured web access
Bulletin board
Complete Metadata
Parametric and Dynamic report in exportable format
Current legal framework Data access arrangements needs to respect the legal rights and legitimate interests of all con-cerned stakeholders. Access to, and use of, certain data will necessarily be limited by various types of legal requirements, which may include restrictions for reasons of:

NINA Report 1079
38
National Security: Data pertaining to intelligence, military activities, or political decision-
making may be classified non-shareable data.
Privacy and confidentiality: Data on human subjects and other personal data are subject to
restricted access under national laws and policies to protect confidentiality and privacy.
Trade secrets and intellectual property rights: Data access arrangements should consider
the applicability of copyright or of other intellectual property laws that may be relevant to
publicly funded databases.
Protection of rare, threatened or endangered species: In certain instances, there may be
legitimate reasons to restrict access to data on the location of biological resources for the
sake of conservation sites etc.
Legal process: Data under consideration in legal actions (sub judice) may not be accessi-
ble. Subscribing to professional codes of conduct may facilitate meeting legal require-
ments.
Metadata Metadata documenting archived/online data sets of all types needs to be made available when or before, the dataset itself are released according to the terms above. All metadata will follow standards and will minimally contain adequate information on proper citation, access, contact information, and discovery. Complete information including methods, structure, semantics, and quality control/assurance is expected. Responsibilities of database owners, generators and controllers The data owners /generators/controllers shall:
Extend authorization to database managers for access to information
Authorize access to secondary users in written form
Database managers shall:
Provide the day-to-day controls of the data
Provide secondary users of how to access/visualize the data
The database owner shall validate data before the same is made accessible to the users.
The data owners, managers and all authorized secondary users shall take all reasonable
precautions against unauthorized access, willful or not, to screens and/or reports con-
taining sensitive data.
The IT, Remote Sensing and GIS cell shall install security procedures to reasonably pre-
vent unauthorized access to systems and data by any other unauthorized person.
Infrastructure provisions While policies provide official mandate, facilitation of optimum accessibility and usability of data by the implementers pre-suppose a trajectory of proper organization of data, with access services and analysis tools that provide the researchers with added value. For data to be reused, it needs to be adequately described and linked to services that disseminate the data to other researchers and stakeholders. The current methods of storing data are as diverse as the disciplines that generate it. It is necessary to develop institutional repositories, data centers on domain and national levels that all methods of storing and sharing have to exist within the specific infrastructure to enable all users to access and use it.

NINA Report 1079
39
Data sharing advantages and barriers Advantages:
Re-analysis of data helps authenticate results as well as the data itself, which is a key part
of the scientific process
Different interpretations or approaches to existing data contribute to scientific progress –
especially in an interdisciplinary setting
Well-managed, long-term preservation helps retain data integrity
When data is available, (re-)collection of data is minimized; thus, use of resources is opti-
mized
Data availability provides safeguards against misconduct related to data fabrication and fal-
sification; replication studies serve as training tools for new generations of researchers
Barriers:
Governance– Reluctance to share if the data is not requested by relevant administrative
level
Misinterpretation of Policy so as to create importance for self
Lack of dialogue between data providers and users
Economic Issues - Cost of sharing the data, mistrust regarding Incentivizing / crediting
mechanism
Licenses and legal frameworks – lack of knowledge regarding licenses and IPR
Data characteristics - Poor accuracy / authenticity of the data, Sensitivity of data, formats
(analog / digital, etc.)
Poor documentation or lacking metadata
Poor reporting mechanism as to who is using data
Lack of capacity and time required to share data and not knowing where to deposit the
data
Discussion and conclusion Data and Information have gained high significance for developmental planning in knowledge societies. Civil societies seek open access to such data and information generated with public funds for planning developmental processes. On the other hand, sensitivity requirements de-mand the restriction of access and availability of sensitive data. With growing levels of misuse of technologies by non-state actors, providing free access to data and information is a challenge faced by countries all around the globe. The NDSAP is now available at national level in India (top down approach), however for the policy to be implemented a bottom up approach has to be adopted. Under the RTI Act Government of India, the Government has asked all public funded organization to prepare its own data sharing and access policy as well as processes taking into consideration the advantages and the barriers for its implementation.

NINA Report 1079
40
7 Project implementation and outcomes The pilot project was formally kicked off at a high-level segment meeting organized by WII at the India International Conference Center in New Delhi the 28th of October 2011. In addition to the project participants, delegates from the Indian Ministry of Environment, Forests and Climate Change (MoEFCC)67, the National Tiger Conservation Authority68, the Wildlife Conservation So-ciety - India69, the Norwegian Environment Agency70 and the Royal Norwegian Embassy71 in New Delhi attended the meeting. The meeting confirmed the Indo- Norwegian governmental support of the project, and highlighted its strategic role in the context of the priorities of the Inter-governmental Platform for Biodiversity and Ecosystem Services (IPBES)72. The high-level seg-ment meeting was followed by a project workshop in Dehradun October 29-30.th 2011 in order to design the content and plan the progress of the project. The 2011- meetings was followed up with a new high-level segment meeting in New Delhi (August 21, 2012) and a second project workshop in Dehradun (August 22-24, 2012) in order to consolidate the project status and to plan and secure further progress. Outside all meetings and workshops, frequent Skype and tel-econferences have been the main communication channels. The project partners met again in Trondheim (May 20-26, 2014) in order to plan the finalization of the project and to identify poten-tial interfaces of future collaboration both within the IPBES context and the general scientific context. The final report and the project outcomes will be show- cased at a High Level Segment meeting at the Norwegian Embassy in New Delhi September 19th 2014.
7.1 Field excursion in the Rajaji National Park In connection with the Dehradun meetings, WII invited the project core team to a one-day field excursion in the Rajaji National Park the 30th of October 2011 (see map in figure 7 below).
Figure 7: Location of the Rajaji National Park in India showing study area.
67 http://envfor.nic.in/ 68 http://projecttiger.nic.in/ 69 http://cwsindia.org/ 70 http://www.xn--miljdirektoratet-oxb.no/english/ 71 http://www.norwayemb.org.in/ 72 http://www.ipbes.net/

NINA Report 1079
41
The purpose of this field excursion was for WII to demonstrate the use of camera traps in Rajaji, and for the Norwegian partners to learn about the ongoing research activities conducted by WII inside the park. Dr. Karthikeyan Vasuedevan from WII led the excursion. Dr. Vasuedevan gave a very thoroughly and interesting insight into the ecology and wildlife of the park.
Figure 8: Dr. Karthikean Vasuedevan (to the left) and the local Park Officers demonstrating the use and implementation of wild camera traps in the WII research activities in the park.
The Rajaji National Park (RNP) is approximately 820 km2 and forms the northwestern population limit of tigers in India. RNP is bisected into a western part (600 km2) and an eastern part (220 km2) by the river Ganges. The park was created in 1983 by amalgamation of three sanctuaries: The Rajaji sanctuary (established in 1948), the Motichur sanctuary (established in 1964) and the Chilla sanctuary (established in 1977) after the name of the renowned statesman and freedom fighter Sri C. Rajgopalachariya - the first and last Governor General of independent India popu-larly known as "Rajaji". RNP has the largest area representing Shiwalik Ecosystem. The Shivalik trail is 10 million year old and very rich in fossils. Its fossils faunal remains include about 50 species of elephant; one of them is present today Rajaji National Park has a small population of tigers (large carnivores) which needs large areas for ranging and adequate prey base of ungulate species. Given that vast tracts of forests that had tigers, have now been lost to human habitations, obtaining reliable quantitative information on existing populations, opportunities for dispersal and connectivity between populations could aid metapopulation management thus lowering the risk of local extinction.
7.2 Mapping of national user needs A considerably amount of Indian camera trap data on threatened fauna have been captured across India, but very few data are at the moment freely available. There are many challenges and constraints due to data management and logistics that have to be solved in order to make the data stakeholders willing to share their camera trap data in a national data management system. To increase the relevance of camera trap data there is a great need of data quality enhancement. This could be achieved through a central database for systematic storage and easy retrieval of data. This demands an improved logistic which could be solved by improved funding, an im-proved access and permission regime and improved low-cost camera trap technology. The pro-ject has addressed several added values of such a data regime towards the needs of scientists and decision makers. These added values will be described in Chapter 9. Important here is to

NINA Report 1079
42
illuminate how new scientific questions can be raised and answered with the help of a standard-ized data management system. The National Biodiversity Information Outlook (NBIO) underline the fact that a national strategy for capacity building in biodiversity informatics has to be based on specific national needs and adapted to the existing international standards for biodiversity data publishing. In order to map the user needs of camera trap data in India and Nepal, WII organized a questionnaire-based survey in the period from April 27 to May 31, 2012 (see figures 9, 10 and 11 below). The ques-tionnaire sought to identify:
The types of multimedia data used
Details of creation of the camera trap data
The major species studied
The size of data-holdings
The main applications to which the data is put
Data sharing practices
Whether data is being used adequately for decision-making
The need for a national infrastructure for managing camera trap data.
Based on 38 responses, it was observed that:
A large volume of high-quality, camera trap images of threatened fauna exists, with 96.4 % of the respondents possessing digital images (stills) from 41 sites (protected and non-pro-tected areas) spread over 20 Indian States and Nepal
The majority of the users (71%) own their data
Common Leopard, Tiger and Black Bear were the three major species studied. Despite the existence of a large body of camera trap data, the survey also established that:
Very few (13%) of the respondents make image data freely available to others and data sharing policies and guidelines are required
Incentives are needed to encourage data owners to contribute and exchange data
Easy-to-follow data management and publishing protocols are currently lacking
There is general endorsement of the need for a national infrastructure for storing and man-aging camera trap data, particularly to make data gathered using public funds available
Figure 9: Image repositories and data attributes

NINA Report 1079
43
Figure 10: Methods of dissemination of camera trap data
Figure 11: Respondents interest in having a national infrastructure for management of camera trap data
The findings from this mapping exercise highly illuminate the need for a national infrastructure for camera trap data in India. The establishment of such an Infrastructure has to be implemented in the context of the NBIO Roadmap in order to ensure that the identified needs will be addressed in a proper way.

NINA Report 1079
44
7.3 Case studies
Figure 12: In order to demonstrate the relevance of camera trapping data in a science-policy interface case studies has been performed in Rajaji National Park (1), Sanjay Gandhi National Park (2), the Pune District in Maharashtra (3), the Sindhudurg district in Maharashtra (4), along the Khanduli River (5) and outside protected areas across India.
Population density estimate of Tigers in the Rajaji National park Dr. Bivash Pandav (WII), Abhishek Harihar (WII) and the Field Director from the National Tiger Conservation Association (NTCA) have carried out and reported this case study on population density estimate of Tigers in the Rajaji National park. Introduction WII has been conducting camera trapping in Rajaji National Park since 2004, hence it was se-lected as a case study in the current pilot project to demonstrate camera trap data mobilization, data access, policy and decision-making. Conserving large mammals in a human dominated landscape requires reliable quantitative in-formation on existing populations, opportunities for dispersal and connectivity between popula-tions. Using which, the effectiveness of management practices can be assessed and goals set for the future. In India conservation efforts such as Project Tiger 200573 have, since 1973, been attempting to save the nations declining populations of tiger, their prey and habitats, yet about 26% of their range has been lost in the recent past (Qureshi et al. 2006). With about 69% of India’s protected areas being inhabited by people (Saloni, 1996) and the recent crisis of vanish-ing tiger populations (Project Tiger 2005), the fact that most reserves are faced with severe an-thropogenic pressures is increasingly becoming a cause of concern. While the ultimate threats to species survival are anthropogenic, intrinsic ecological and life history traits determine how well populations are able to recover (Cardillo et al. 2004). Tigers (Panthera Tigris) are highly endangered large carnivores, whose extinction risk is com-pounded by their need for large ranging areas and their dependence on prey species (Carbone and Gittleman 2002, Karanth et al. 2004) that may themselves be threatened. Despite thirty
73 http://en.wikipedia.org/wiki/Project_Tiger#Goals_and_objectives

NINA Report 1079
45
years of continued conservation efforts, an expanding human population has caused consider-able decline in the tiger’s habitat, prey and the tiger itself in India (Seidensticker et al. 1999). Though illegal killing of tigers for body parts has contributed greatly to the extinction of local populations (Project Tiger 2005), vast tracts of forested landscape that once housed the tiger have now been lost to human habitation. This has caused a sharp decline in the ungulate popu-lations and confined many of the remaining tiger populations to small, isolated patches of forests (Smith et al. 1998). One such landscape, the Terai arc landscape, encompassing the Shivalik hills and the Terai flood plains running parallel to the outer Himalayas from Jammu through Nepal to Assam are considered one of the most threatened and fragile ecosystems in the Indian subcontinent (Hari-har et al. 2007). Rajaji National Park along with Corbett Tiger Reserve and its adjoining forests are one of the largest contiguous patches of forest (ca. 4,000 km2) and forms the north western limit of the tiger and elephant distribution in India (Johnsingh and Negi 2003). Known as the Rajaji- Corbett Tiger Conservation Unit, it is a level I Tiger Conservation Unit (TCU I, Wikramanayake et al. 1998) identified for the long-term persistence of the species. River Ganga bisects the 820.42 km2 Rajaji National Park in to eastern part comprising of Chilla and Gorhri ranges (ca. 250 km2) and the western part comprising of Motichur, Kansrau, Ramgarh, Chilawali, Dholkhand, Beribada and Haridwar ranges (ca. 570 km2.). Both these parts of Rajaji National Park are connected by Chilla-Motichur corridor (Johnsingh et al. 1990). However, eastern part of Rajaji National Park contin-ues to maintain a strong connectivity with the Corbett Tiger Reserve through Laldhang and Kotdwar ranges of Lansdowne Forest Division. Rajaji National Park is a true representative of Shivalik formation, is characterized by rugged hills ranging from 400m to 800m in altitude with steep southern slopes, and is drained by rivers and streams running north to south, most of which remain dry in late winter and summer. Broadly, the forests of this region are categorized as Northern Indian moist deciduous forest and Northern tropical dry deciduous forest (Champion and Seth 1968). The park supports a healthy assem-blage of wild ungulates such as spotted deer, sambar, barking deer, nilgai, wild pig and goral. Besides tiger, the park supports a healthy population of leopard. Other carnivores present in the park are sloth bear, Asiatic black bear, hyena, jackal, jungle cat, leopard cat and rusty spotted cat. Until recently, the Park was reeling under severe anthropogenic pressure, owing to the presence of large number of nomadic pastoralists (Gujjar’s) within its limit. A voluntary relocation of Gujjar settlements was initiated by the then Government of Uttar Pradesh, and after the creation of the state, the process was actively pursued in 2003. As a result, more than 1200 families of Gujjar’s have so far been relocated from RNP and six ranges out of 9 ranges are completely free from Gujjar habitation. This has resulted in creation of an inviolate space of approximately 520 km2 (Figure 12 below).

NINA Report 1079
46
Figure 13: Map of Rajaji National Park (RNP) indicating the western and eastern sectors. Six out of nine ranges in the park are currently free of human settlements. With adequate prey base these six ranges provide inviolate space for tiger conservation.
Following the resettlement of 193 Gujjar (pastoralists with large buffalo holdings) families from Chilla Range of Rajaji National Park, WII monitored a recovering population of tiger across nine consecutive years from 2004-05 to 2012-13. Distance sampling method is used to estimate den-sity of wild ungulate prey and camera traps to estimate tiger density. Camera trapping methodology In order to estimate the population density of adult tigers in the study WII used photographic capture-recapture analysis (Karanth 1995, Karanth and Nichols 1998). At least thirty camera trapping stations were maintained through the study period in the Chilla range of RNP (Harihar 2009). These trapping stations were selected to maximize the capture probabilities of tigers (Karanth 1995). In order to systematically sample the area, sampling blocks (spatially separated) were identified within the intensive study area and the cameras were deployed in a phased man-ner. Sampling along the east of Ganges (Chilla and parts of Gorhri ranges) was carried out during winter of each survey year in 4 blocks and on the west of the Ganges (Dholkhand West and Dholkhand East ranges) in 2 blocks during summer of each year. Each block consisted of 10 trap sites run for 15 consecutive days/occasions. Thus, each sampling occasion combined cap-tures from 1 day drawn from each block. One trap-night was a 14-hour period (1700-0700 hours) during which a camera was functional. Owing to a good network of roads all the 10 trapping sites

NINA Report 1079
47
in a block was checked on a daily basis. Figure 13 below depicts the location of camera traps in Eastern Part of Rajaji National Park.
Figure 14: Location of the camera traps, camera trap polygon and the effective sampled area in east Rajaji National Park
All photographs were downloaded at the trap site using a laptop. Every tiger captured was given a unique identification number (e.g., RT-002) after examining the stripe pattern on the flanks, limbs and forequarters (Schaller 1967, McDougal 1977, Karanth 1995). Following the identifica-tion of tigers, capture histories (X matrix) were developed and analyzed using program CAPTURE (Otis et al. 1978, White et al. 1982, Rexstad and Burnham 1991). Based on photographic capture-recapture estimates, WII documented an increase in the density (D) of tigers from 3.1 in 2004-05 to 7.1 tigers/100km2 in 2011-12 (Harihar et al. 2011; Harihar & Pandav 2012). It was concluded that this increase in tiger density is most probably due to immi-grating tigers from nearby Corbett Tiger Reserve. A high turnover of individual tigers were ob-served during the study. 40 individual tigers were photographed, including five cubs, during the nine-year period. With photographic evidence of breeding tigers in Chilla range, it is believed that this area could serve as a potential source site from where tigers can colonize adjoining forests across River Ganga. Recovery of habitat, wild prey and tiger following relocation of human settlements While creation of inviolate space has been widely recognized as a conservation tool to recover wild tiger population across its range, studies carried out by WII in RNP provides empirical evi-dence for this important conservation intervention. A systematic monitoring program over nine years has clearly documented a successful recovery of habitat, wild ungulate and tiger in parts of RNP, the area that was once subjected to intensive human interference. The immediate response to this voluntary relocation was noticed in terms of revival of the grass-lands in the valley habitats of Rajaji. The valleys that were left degraded for years due to livestock grazing gave rise to luxuriant growth of grass species viz. Saccharum spontaneum, Imperata cylindrica and Vetiveria zizaniodes (see figures 14 and 15 below) within six months of relocation. This was followed by a recovery of wild ungulate and tiger population of the area.
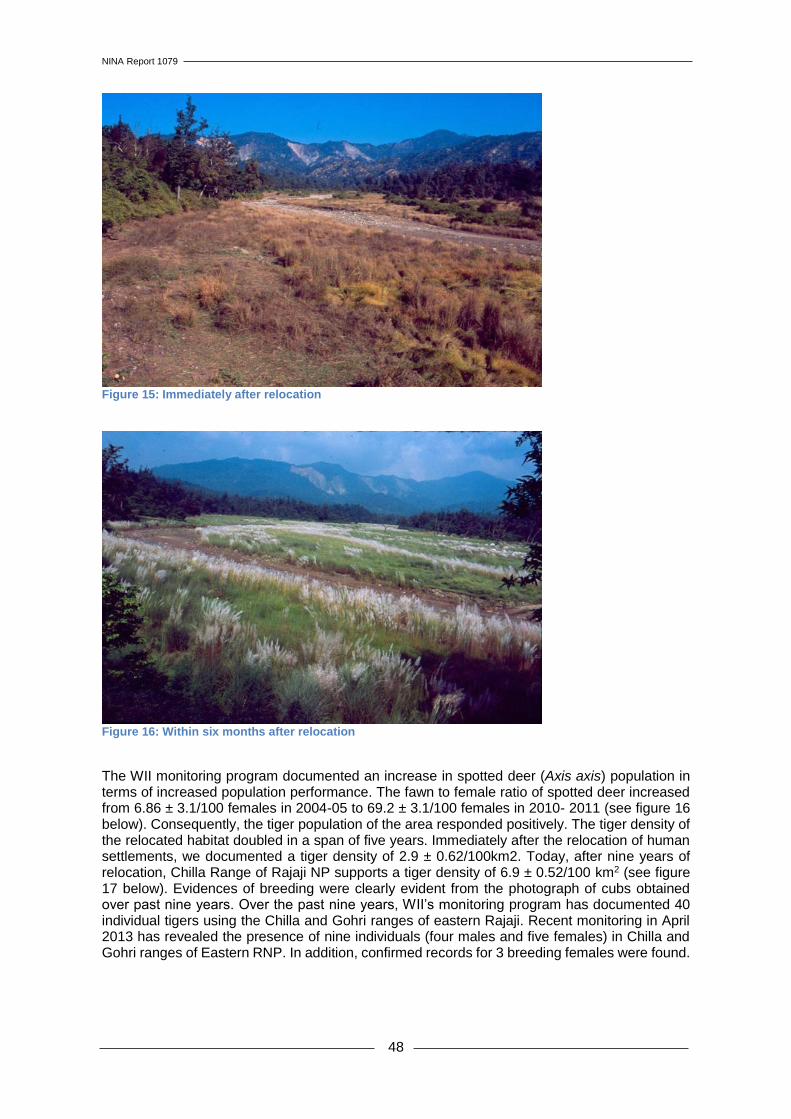
NINA Report 1079
48
Figure 15: Immediately after relocation
Figure 16: Within six months after relocation
The WII monitoring program documented an increase in spotted deer (Axis axis) population in terms of increased population performance. The fawn to female ratio of spotted deer increased from 6.86 ± 3.1/100 females in 2004-05 to 69.2 ± 3.1/100 females in 2010- 2011 (see figure 16 below). Consequently, the tiger population of the area responded positively. The tiger density of the relocated habitat doubled in a span of five years. Immediately after the relocation of human settlements, we documented a tiger density of 2.9 ± 0.62/100km2. Today, after nine years of relocation, Chilla Range of Rajaji NP supports a tiger density of 6.9 ± 0.52/100 km2 (see figure 17 below). Evidences of breeding were clearly evident from the photograph of cubs obtained over past nine years. Over the past nine years, WII’s monitoring program has documented 40 individual tigers using the Chilla and Gohri ranges of eastern Rajaji. Recent monitoring in April 2013 has revealed the presence of nine individuals (four males and five females) in Chilla and Gohri ranges of Eastern RNP. In addition, confirmed records for 3 breeding females were found.

NINA Report 1079
49
Figure 17: Population performance (number of fawns per 100 adult females) and associated 95% boot-strap confidence interval of spotted deer (Axis axis) across seven survey years (2004-2011).
Figure 18: Density of tiger (number of individuals per 100 sq. km) and associated confidence interval across seven survey years (2004-2012).
Potential for recovery While the recovery in eastern part of RNP has been largely possible due to strong connectivity of eastern RNP with Corbett Tiger Reserve (CTR) through the Lansdowne Forest Division (FD), the scenario in the western part of RNP has not shown similar recovery of its tiger population. Five out of the seven ranges of western RNP (570 km2) are presently devoid of human settle-ments since 2005 (figure 18 below). WII’s monitoring program indicates a high density of wild ungulate prey (110.01 individuals per km2) within this inviolate space in western RNP, which is capable of supporting up to 40 tigers. Despite the presence of such high prey densities, system-atic camera trapping carried out in January and February 2013 over an area of 400 km2 in west-ern RNP has revealed the presence of only two tigresses. Besides the results of the camera trapping studies, sign surveys in western RNP by WII have not revealed the presence of any male in the area. Lack of evidences of breeding among tigers is of serious concern to the long-term persistence of tigers not only in western RNP but also in the entire forested tract (approxi-mately 2000 km2) between the rivers Ganga and Yamuna. While the tiger population in eastern RNP is still recovering, colonization of western RNP by tigers has so far not been possible due to lack of functional connectivity (Chilla-Motichur corridor) across the river Ganga.

NINA Report 1079
50
Figure 19: Rajaji- Corbett Tiger Conservation Unit
With the help of scientists from WII involved in monitoring in RNP, an attempt has been made to evaluate possible management interventions that will enable tigers to recover in western RNP. Using Population Viability Analysis the relative performance of three possible management sce-narios against isolation, which is presently the situation prevailing in western RNP, has been assessed. These are:
Population supplemented by introducing individuals
Natural connectivity restored to adjoining source population
Supplementation carried out for 10 years with habitat restoration to connect the population
to the source.
The results support the scenarios with initial supplementation for the first ten years during which connectivity is also being restored emerged to ensure long-term persistence of tigers (figure 19 below). This is considered as the most pragmatic option to ensure long-term persistence of tigers in the forested tract west of River Ganga. Thereby, restoring Chilla-Motichur connectivity should remain the foremost priority for securing the future of tigers in this landscape; while supplemen-tation should be initiated immediately to avoid local extinction, which is otherwise imminent.
Figure 20: Population sizes over 50 years, under the seven different scenarios modelled on the tiger population from western Rajaji National Park.

NINA Report 1079
51
Need for a Rajaji Tiger Reserve A multitude of factors such as availability of inviolate space, a healthy prey biomass, a small breeding population provides excellent opportunity for tiger conservation in RNP. However, as stated above, recovery of tiger population across the park requires active management interven-tion, focused attention and sustained funding. The decade long monitoring has highlighted the critical importance of RNP as a potential source site and recovery site for tigers at its northwestern range limit, which has prompted the National Tiger Conservation Authority to endorse it as a Tiger Reserve in 2013. This move would strengthen the existing park management infrastructure with inflow of additional funds and should help ensure the persistence and recovery of the tiger population in this reserve.
Distribution and abundance of herbivores in Sanjay Gandhi National Park This occupancy survey case study has been performed and reported by research student Mr. Girish Arjun Punjabi with great support from of Principal Investigator Dr. Vidya Athreya (Wildlife Conservation Society – India Centre for Wildlife Studies, Bangalore). Others contributors have been the Mumbaikars SGNP project; The Maharashtra State Forest Department; Chief Conser-vator of Forests/Field Director of Sanjay Gandhi National Park Mr. Sunil Limaye; Range Officer Mr. Prashant Masurkar; Range Officer Mr. Kiran Dabholkar and a number of private individuals. Introduction Occupancy is a state variable examining the proportion of sites occupied by an animal (MacKen-zie et al., 2002). Generally, when examining occupancy the focus shifts from actually counting animals to examining proportion of sampling units (for example, grid cells) occupied by the ani-mal. The occupancy technique has become increasingly popular in species distribution and oc-currence modeling, due to its ability to tease apart true absence from non-detection. Moreover, recent advances in the occupancy technique have also introduced models to estimate abundance using repeated counts (Royle and Nichols, 2003). There have also been recent de-velopments to accommodate spatial dependence in survey replicates used for sampling (Hines et al., 2010). Using a combination of these developments and based on one earlier study (Rayar, 2010), we designed an occupancy survey to understand distribution and abundance of herbi-vores in Sanjay Gandhi National Park. The herbivore species known to occur in the park were spotted deer (Axis axis), sambar (Rusa unicolour), muntjac (Muntiacus muntjac), wild boar (Sus scrofa), four-horned antelope (Tetracerus quadricornis), and chevrotain (Mosciola indica). Grid cells, each measuring 3.25 km2 were overlaid on a map of the study area. The grid size was based on examining literature on known home range sizes of herbivore species (Rayar, 2010). 40 grid cells covered the park entirely, however on further examining the areas we ascertained 32 grid cells could be sampled given low percentage forest cover or steep terrain and two logis-tical constraints in the remaining eight grids. However, at the end of the study we managed to survey 27 grid cells given problems of accessibility and steep terrain. Of the 27 sampled grid cells, we detected enough signs of only spotted deer and sambar to perform the occupancy and abundance modelling. Overall detections for other species were too low (< 10 detections) to perform any modelling using the data. The study perhaps is the first of its kind to give baseline estimates of spotted deer and sambar cluster abundances (herd/ group abundances) in the San-jay Gandhi National Park. Study area Sanjay Gandhi National Park is situated in suburban Mumbai, and measures 103 km2 in area. The topography of the park is hilly and vegetation is mainly characterized by Southern Moist deciduous forest (Champion & Seth, 1968). More details on the study area can be found in an unpublished report by Edgaonkar and Chellam (1998).

NINA Report 1079
52
The intensive study area covered a large portion of the Sanjay Gandhi National Park (about 80% by area of SGNP). We covered most portions of the park except for the central portion (encom-passed by three grid cells) and a portion towards the East, near Mulund (2 grid cells). These areas were not sampled due to access issues, steep terrain and logistical constraints. The entire area of Nagla block was not a part of the proposed study area, however we did sample the southern end of Nagla block, just above the creek. Please refer to figure 20 below for map of total and sampled grids.
Figure 21 (left): Map showing sampled versus total grids overlaid on Sanjay Gandhi National. Figure 22 (right): Field sampling GRID Cell.
Field sampling Each grid cell had 9 points and the design used for the survey has been shown in figure 21 above. Distance between each set of points (A to B to C to F to I to H to G to D to E) was 600 meters and the total walk effort in each cell was a maximum of 4.83 km. Each set of points was further divided into 100-meter replicate segments and data on presence/absence of herbivores (spotted deer, sambar, muntjac, wild boar and four-horned antelope) was collected on these replicates. We also collected data on human disturbance on the same replicate segments to be used as a covariate in the analysis. Data compilation Data was entered into spreadsheets as capture histories. Capture histories are dummy codes in the form of 1’s and 0’s indicating presence and absence respectively of the species sign or dis-turbance. Since we only detected spotted deer and sambar signs in the study area adequately (more than 50 detections), we used them in the distribution and abundance modeling further. Detection of other herbivores or their signs were very low (less than 10), therefore we could not model them to understand their distribution and abundance. However, we plotted them on maps of the study area, to understand where these detections occurred spatially. Covariates Primarily habitat and disturbance factors were considered to be important determinants of large herbivore distribution. For measuring human disturbance, we calculated a cumulative disturb-ance index, which was used as a covariate during modeling, by adding all detections of human disturbance in a grid cell divided by the walk effort in the respective grid cell. Habitat factors were ascertained by creating two indices- terrain/slope index and percentage forest cover. We calcu-lated terrain/slope index by counting the number of contour lines in each grid cell, since the number of contour lines in each cell would appropriately index the terrain/slope in each sampling unit. The denser or more number of contour lines in a grid cell, the steeper the slope and vice

NINA Report 1079
53
versa. Percentage forest cover though calculated, was not used as a covariate since it was neg-atively correlated with cumulative disturbance index (Pearson’s r > -0.6). We expected human disturbance to negatively influence spotted deer and sambar abundance (Ceballos and Lascurain, 1996), while terrain/slope index was hypothesized to negatively affect spotted deer abundance (Schaller, 1967; Duckworth et al. 2008) and positively affect sambar abundance (Timmins et al. 2008). We used covariates to examine their effect on occupancy as well, but they were not used to examine their effect on detection probability for any of the models. Analysis The analysis for spotted deer and sambar was done using data structured as per three replicate lengths each – 100 meters, 300 meters and 600 meters. Three kinds of models were used at each replicate length for each species- the Mackenzie et al. model (2002); the Royle and Nichols model (2003) and the Hines et al. model (2010). The Royle and Nichols model (2003) was the model that furnished values of r (where r = animal specific detection probability) and λ (lambda = grid cell specific cluster abundance). The selection of the appropriate replicate length to explain cluster abundance for spotted deer and sambar was chosen based on values of θ and θ’ from the Hines et al. (2010) model at each of these lengths, where θ = probability of species presence on replicate, given absence on previous replicate and θ’ = probability of species presence on a replicate given presence on previous replicate. As replicate lengths become independent, the difference between θ and θ’ becomes lower. For more details on the technicalities of analysis, please refer to Rayar, 2010. All analysis was performed using the software PRESENCE2 (Hines, 2006). Results For spotted deer, the 100 meters replicate scale seemed the best choice, given the low difference in values of θ and θ’, as well as overall values of r (animal specific detection probability) and λ (grid cell specific cluster abundance). Both cumulative disturbance index and Terrain/slope index were important variables in explaining λ (see table 7 below). The negative sign of the estimate indicates a negative effect. The value for r (overall animal specific detection probability) at the 100 meters replicate length for spotted deer was as low as 0.03. The values for lambda across the sampled grid cells have been shown in figure 21 below.
Covariate Parameter estimate (SE)
Cumulative disturbance index -0.449 (0.150)
Terrain/slope index -0.119 (0.0363) Table 7: Parameter estimates for the model examining the effect of covariates (cumulative disturbance index and terrain/slope index) on lambda of spotted deer.
Figure 23 (left): Map showing spotted deer cluster abundance in Sanjay Gandhi National. Figure 24 (right): Map showing sambar cluster abundance in Sanjay Gandhi.

NINA Report 1079
54
For sambar, the 600 meters replicate scale seemed the best choice, given the values of r (animal specific detection probability) and λ (grid cell specific cluster abundance). Cumulative disturb-ance index was an important effect, but terrain index did not have any effect due to weak Pa-rameter estimates (see table 8 below). The value of the standard error for terrain index was high; therefore, the variable was not influential. The value for r (overall animal specific detection prob-ability) at the 100 meters replicate length for sambar was as low as 0.07. The values for lambda across the sampled grid cells have been shown in figure 22 above.
Covariate Parameter estimate (SE)
Cumulative disturbance index -0.154 (0.073)
Terrain/slope index 0.0313 (0.030) Table 8: Parameter estimates for the model examining the effect of covariates (cumulative
For all other species, namely nuntjac, four-horned antelope and wild boar, the number of detec-tions overall were too low to perform the analysis meaningfully, therefore we have only plotted their occurrence on maps. These have been shown in figure 24 below. Lastly, we have also plotted on a map (figure 25 below) the prominent kinds of human disturbance we noticed.
Figure 25 (left): Locations of herbivore signs recorded in Sanjay Gandhi National Park for examining herbivore occupancy and abundance from February to March 2012. Figure 26 (right): Map showing locations of disturbance signs recorded in Sanjay Gandhi National Park for ex-amining herbivore occupancy and abundance from February to March, 2012.
Discussion 1. This study suggests that both spotted deer and sambar cluster (herd) abundance in the
park are negatively influenced by human disturbance (cumulative disturbance index), indi-cated by the -ve sign of the parameter estimates of the Royle and Nichols (2003) model, shown in the tables 7 & 8.
2. Spotted deer cluster abundance is also influenced negatively by steep terrain (terrain/slope index), therefore areas with steeper terrain do not seem to support higher cluster abun-dances of spotted deer.
3. Overall, both spotted deer and sambar seem to be most abundant in the Central, Southern and Western parts of the park. For spotted deer, the best areas seem to be near the tourist zone, Malad trench line, Shilonda trail and areas around Tulsi and Vihar Lake. For sambar, the best areas seem to be areas around Tulsi and Vihar Lake, Chenna, areas around lion and tiger safari, highest point, Gaimukh and Air force station, Yeur (see figure 25 below).
4. The Northern and Eastern parts of the park both seem to have very low cluster abundance of spotted deer and sambar. These areas include Manpada, Ovala, Nagla (south side) and Yeur East (see figure 27 below).

NINA Report 1079
55
5. Wild pig, four-horned antelope and muntjac sign detections were very low overall (7, 5 and 1 detection respectively) indicating that they likely occur in very low densities throughout the park (figure 23 above).
6. Occurrence of fire, followed by local biomass extraction seemed to be the most common forms of human disturbance and therefore management may need to address these threats first, since cumulative disturbance index was seen to negatively influence spotted deer and sambar cluster occurrence/ abundance in the park.
7. Areas around Yeur seem to be heavily disturbed given the low detection of herbivore signs and high detection of signs of human disturbance (figure 26 above).
Figure 27: Map showing important locations in Sanjay Gandhi National Park for examining Herbivore occupancy and abundance from February to March 2012
Wild mammal biodiversity in the Pune District (Maharashtra) This assessment case study has been performed and reported by Nikit Surve (Athreya and Surve, 2012) under the supervision of Dr. Vidya Athreya (Wildlife Conservation Society - India, Centre for Wildlife Studies, Bangalore). Other contributors have been the Forest Department of Junnar Division; CCF Pune district Mr. Nitin Kakodkar; DCF Junnar Mr. A.D. Bhosle; Range forest officers of Shirur and Narayangaon ranges (Mr. Sanjay Kadu, Mr. Jadhav, Mr. Bulbule); Forest Guard-Shirur Mr. Datta Phaphale and a number of local farmers.. Introduction Camera traps are a valuable tool to understand the presence and status of wildlife. A camera trapping survey was conducted in the Ambegaon and Junnar talukas of Pune district to examine the presence of wildlife in an agricultural landscape. Different species of wildlife also use human-use areas and this recent branch of ecology is termed as urban ecology (Gehrt et al. 2010). Rural India has characteristics that fit into the definition of urban ecology in terms of a high degree of modification of the natural habitat as well as a very high density of humans. Although not well

NINA Report 1079
56
studied, many species of wildlife occur outside Protected Areas in India, in rural landscapes. This survey was carried out to document the wildlife present in a human-dominated landscape of Pune district, Maharashtra, India.
Figure 28: The map indicates the study area located in the Junnar Forest Division in the Pune district. The two blocks with camera trap points located in the agricultural landscape in Block I and II are high-lighted in blue and green respectively.
The study area The Junnar Forest Division (FD, 18°36’46.77” - 19°25’17.18”N and 73°29’08.78” - 74°20’34.02”E) is situated in the northwestern corner of Pune district. The area is administered by the territorial wing of the Maharashtra State Forest Department. The density of people is around 200 per km2. The study area was divided into two blocks (henceforth, Block I and II) based on potential camera trap points, ease of logistics and known village boundaries in the Ambegaon and Junnar talukas (see figure 27 above). Only a small portion of Ambegaon taluka was covered, while the Junnar taluka formed a major portion of the study area. Block I consisted of the Shirur range falling under the Maharashtra Forest department and consisted of the follow-ing villages - Pimparkhed, Kathapur khurd, Jambut, Chombhut, Shirapur and Pargaon. The vil-lage Paragon was at the northern portion of Block I and served as a border between the two blocks. Block II was under Narayangaon range and was situated south of Narayangaon town and north of Pargaon village. It consisted of the following villages - Pargaon, Mangrul, Belhe, Nimgaon sawa and Sakori. The topography in both the blocks was flat, dissected by rivers and interspersed by few rocky hillocks. Methodology Camera traps were deployed in the study area from 3rd June to 22nd June 2012. Eight locations were sampled in Block I and seven in Block II where a pair of camera traps was placed on both sides of potential paths. These points were selected a priori by observing paths trails, intersec-tions, dry streams, and rivulets on a satellite image of the study area (Google Earth Version 6.1.0.5001, Copyright 2011 Google Inc.). The camera traps used in this project work on the principle of heat sensing. Each camera being a film roll camera trap had an attached heat sensor connected with the circuit. The sensor detects any object with a temperature higher than the surrounding temperature and triggers the circuit that then sends a signal to the camera to click with a flash.

NINA Report 1079
57
While setting the camera traps a few guidelines were followed, such that a pair of cameras was set at approximately 50 to 60 cm above ground level, facing each other at a distance of eight to ten feet on opposite sides. Cameras were set on both sides of a selected point, such a trail or a dry streambed to get images of both flanks of the animals. The cameras were active only from the early evening to early morning because this is the period when wild animals are usually active in a human-use landscape. A total effort of 230 trapping nights (120 and 110 in Block I and II, respectively) was invested in Block I and Block II. Results: The wild animals captured on camera traps were as follows:
Indian hare (Lepus nigricollis)
Common palm civet (Paradoxurus hermaphroditus)
Small Indian civet (Viverricula indica)
Golden jackal (Canis aureus)
Jungle cat (Felis chaus)
Striped hyena (Hyaena hyaena)
Leopard (Panthera pardus)
Wolf (Canis lupus) Leopards were captured at two different points at F2 and C17 in Block I and II respectively. We also captured images of golden jackal and Indian hare in Block I. A jungle cat was captured by the cameras at two places (C16 and C19) in Block II. A striped hyena was captured in one of the cameras in Block II. See figure 26 for location of camera trap points within the study area. Discussion The surveys obtain evidence of eight wild mammal species in the agrarian landscape of the study area of which seven were carnivores (including the probable image of a wolf). It is often thought that wild animals are restricted to forests and protected areas but the local people were aware of the presence of these species in their environments.
Occupancy of large-felids in the Sindhudurg district (Maharashtra) This occupancy case study has been performed and reported by research student Girish Punjabi and Principal Investigator Dr. Vidya Athreya (Wildlife Conservation Society - India, Centre for Wildlife Studies, Bangalore). Other contributors have been the Maharashtra State Forest Depart-ment and a number of private individuals. Introduction Large carnivores have suffered massive range contractions in the last century (Cardillo et al. 2004; Schipper et al. 2008). The tiger (Panthera tigris) and leopard (Panthera pardus) are listed as endangered and threatened large carnivores respectively, and their distribution in India is restricted and patchy (IUCN 2010; Karanth et al. 2009). The Western Ghats has been recognized as a priority site for large carnivore conservation in India (Das et al. 2006), and very recently, it was inscribed on the World Heritage list (UNESCO 2012). The northwestern Ghats and adjoining forests in the Konkan region of the state of Maharashtra are heavily human-modified and there is a constant threat of large-scale land-use modification from infrastructural, industrial and irriga-tion projects. The Sindhudurg district in Maharashtra is the southernmost district in the state and has forest connectivity to Protected Areas (PAs) further south in Karnataka and Goa states. An earlier study found a high probability of occupancy for tigers (more than 0.7) and leopards (more than 0.9) in a portion of the proposed study area (Punjabi and Edgaonkar, 2012 report submitted to Maharashtra Forest Department). The current study aimed to assess a) Large felid habitat use and occupancy (MacKenzie et al. 2002) in a larger landscape (approximately 1500 km2) and b) Density of large felids in the forest and human-use areas (approximately 300 km2) of the district using camera trapping and DNA sampling.

NINA Report 1079
58
Study area The study area comprised of reserve forest areas in the Sindhudurg district (in Kudal, Sawant-wadi and Dodamarg tehsils) under the jurisdiction of the Maharashtra State Forest Department. The study area also comprised of a number of community and private forests, private plantations of cashew (Anacardium occidentale), areca nut (Areca catechu), mango (Mangifera indica), and many rubber estates. The total area covered was approximately 1410 km2, spread across three tehsils covering areas with natural and modified vegetation (see figure 28 below). Permissions for the study were obtained from the Chief Wildlife Warden`s office vide letter no. Desk-22(8)/Re-search/3660/2012-13 dated 19-12-2012.
Figure 29: Map of the study area in the Sindhudurg district showing the grids sampled and underlying vegetation as seen in a satellite map of the region
The vegetation type is broadly composed of Tropical evergreen, semi-evergreen and moist de-ciduous forests (Champion & Seth 1968), interspersed by open forest and scrub areas in the landscape. Characteristic species of semi-evergreen forests include Olea dioica, Mallotus philippensis, Macaranga peltata and Terminalia paniculata (Ghate et al. 1998; Pascal 1988). Some characteristic species of stunted evergreen forests are Actinodaphne angustifolia, Me-mecylon umbellatum and Syzygium cumini while Terminalia crenulata, Lagerstroemia lanceo-lata, Grewia tiliaefolia, Dillenia pentagyna, Careya arborea and Xylia xylocarpa are typical of moist deciduous forests of the northern Western Ghats (Ghate et al. 1998). The study area wit-nesses distinct seasonal shifts from the hot season (March to May), to the monsoon season (June to October) and the cold season (November to February). Temperatures vary from about 10 °C in the cold season to about 38 °C in the hot season. Elevation ranges from near sea level to 700 m above sea level. Average rainfall during the monsoon season in the study area is about 3200 mm. Methodology We also surveyed grid cells to examine habitat use of tigers and occupancy of leopards in the mixed-use landscape. Each grid measured 47 km2 in size and a survey effort on trails of 2 to 10 km was invested in each grid, based on the amount of cover available to large carnivores. Po-tential covariates that could influence occupancy/ use of large felids were also collected. These included noting signs of wild prey species of ungulates, gaur (Bos frontalis gaurus), sambar (Rusa unicolor), barking deer (Munticus muntjac), wild boar (Sus scrofa), and four-horned ante-lope (Tetracerus quadricornis) at every 100 meters replicate length. Signs of livestock (cattle, buffalo, and goat) were also noted at every 100 meters replicate length. We also noted signs of

NINA Report 1079
59
anthropogenic activities, such as local biomass extraction, occurrence of fire, clear felling of for-est or organized commercial extraction of biomass, mining, and signs of poaching along every 1 km replicate. Such anthropogenic activities may cumulatively have a negative impact on the occurrence of large felids. Percentage forest cover of each grid cell was extracted using Google, Earth imagery of the study-site. Detection histories were formed by combining detections and non-detections of species for rep-licates of each cell. Covariates such as percentage forest cover (F.cov), index of human disturb-ance (disturb.index), index of wild prey availability (prey.index), and index of livestock abundance (lvs.index) and walk effort (walk.effort) were z-transformed and used as site-specific covariates for species occupancy. Signs of ungulates and livestock were summed over ten 100-meter rep-licates for each 1 km replicate. These were then further added and divided by the walk effort invested in each cell to create an index of prey or livestock abundance. This made it a compara-ble metric across sampling grids as the number of encounters of ungulates or livestock for every km surveyed. Wild prey for tigers included detections of all wild ungulate species. For leopards, a separate prey index was created, where detections of gaur were removed, but livestock were included since leopards are known to prey on livestock. Similarly, all detections of anthropogenic activities were indexed over every 1 km replicate. We used the Markovian model, as described in Hines et al. (2010), that enables estimation of five parameters of interest, probability of site-level occupancy (ψ), probability of presence on first replicate (θ0π), probability of presence on replicate, given absence on previous replicate (θ0), probability of presence on replicate, given presence on previous replicate (θ`), and replicate-level detection probability, given presence (pt). Hines et al. (2010) and Karanth et al. (2009) can be referred to, for more details on model parameters and their estimation. We first tested for possible biases and lack of precision in estimation of parameters by doing a simulation study in the software GENPRES. We used the “single-season spatial correlation” model type using the p (.) model variant as described in Harihar and Pandav (2012). We fixed the number of sites to 30, and number of surveys to 10 and then ran simulations under different scenarios of occupancy and detection probability set as truth, and noted the predicted values of occupancy and detection probability and standard deviations associated with each case. The results of our simulations and potential implications of our sampling strategy are discussed in the results section. Next for our actual occupancy analysis, similar to Karanth et al. 2009, we first fixed a model structure for detection probability by using the Hines et al. (2010) model. We used a global occupancy model and used alternative structures with walk effort and index of livestock abundance and null (no covariate) for detection probability, to fix the covariate structure for rep-licate-level detection probability pt for each carnivore species. Based on Akaike‟s information criterion (AIC) model rankings and Akaike weights (wi), we first chose the structure of the model for detection probability. We then kept the covariate structure for detection probability un-changed, and tested a set of candidate models to examine factors and test predictions underlying occupancy/ use of the two large carnivores. Since surveys did not start at the boundary of the grid cell, we expected θ0π would not be equal to rest of thetas. θ0π (theta0pi) was fixed to „eq.‟ in the fixed parameters option, which meant that it was computed using values of θ0 and θ` in the likelihood function. We performed all analyses in Program PRESENCE (version 5.9, Hines 2006) using the custom „w/spatial correlation‟ option and evaluated candidate models using the Akaike‟s information criterion (AIC) and model weights. Density was estimated using camera trapping and DNA sampling. We initially deployed camera traps (Deercam) on forest-trails in the study area to assess the possibility of density estimation of large felids using camera trapping. Sites were selected based on a survey of trails and wildlife sign encounters in an area. Cameras were placed either singly or in pairs depending on the width of the trail (see figure 29 below). Most cameras were checked daily, but cameras in some remote areas could only be checked once in a week or sometimes even lesser. An effort was made to deploy each camera for a minimum of one-week at a site; however, this was not possible in some cases due to excessive livestock movement, which exhausted camera rolls. Density estimation

NINA Report 1079
60
using camera trapping was not attempted due to large wastage of film and the high possibility of theft in the areas. Since the area was large it was not possible to remove all the cameras and redeploy them every day.
Figure 30: The map depicts the number of grids sampled and the location of the camera points (21 loca-tions) placed in the study area from 20th December 2012 to 20th March 2013.
Lastly, to estimate population sizes using DNA sampling, we collected fresh scat samples of tigers and leopards if we encountered them on survey trails. Since scats were not very common (based on encounter rates during our occupancy surveys) and would not have provided us the sample sizes to allow for good estimation of density of large felids we did not attempt density estimation using DNA sampling either. Results from the occupancy simulations We surveyed 30 grids in the study area from 20th December 2012 to 20th March 2013. Since the sample size for our study was small, we initially ran a simulation study to examine its effect on bias and precision, the results of which are summarized in table 9 below.

NINA Report 1079
61
Table 9: Table indicates the different scenarios (cases) of occupancy and detection probabilities (set as truth) that were simulated with sample size = 30 and surveys = 10 to examine bias and precision in the occupancy analysis.
Figure 31: The graphs above indicate the values of predicted occupancy Psi (to the left) and detection probability p (to the right). Their associated standard errors in the different scenarios (cases) are pre-sented in Table 9 above.
The simulations in figure 30 above suggest that with few samples (n = 30), cases with low occu-pancy and low detection probability will be biased (further away from truth) and less precise (high standard deviation). Since tiger sign encounters were low, we expected results of tiger habitat use to be more biased and less precise, while leopard occupancy to be relatively unbiased and precise. Results from tiger use and leopard occupancy For both tigers and leopards, models for detection probability suggested index of livestock abun-dance (lvs.index) and walk effort (walk.effort) to be important covariates (Table 10 below). For leopards, the model that included both covariates for detection probability stood second, how-ever the difference in AIC scores was less than 2, indicating index of livestock abundance (lvs.in-dex) and walk effort (walk.effort) to be important. We therefore included both covariates for ex-plaining detection probability in further analysis of occupancy models.
Species Model AIC ΔAIC wi
No. Par.
Tiger
ψ (F.cov + disturb.index + prey.index + lvs.index), θ0 (.), θ’ (.), pt (lvs.index + walk.effort), θ0π (eq.)
79.58
0 0.42
11
ψ (F.cov + disturb.index + prey.index + lvs.index), θ0 (.), θ’ (.), pt (lvs.index), θ0π (eq.)
80.19 0.61 0.31 10
ψ (F.cov + disturb.index + prey.index + lvs.index), θ0
80.7
1.12
0.24
10

NINA Report 1079
62
(.), θ’ (.), pt (walk.effort), θ0π (eq.)
ψ (F.cov + disturb.index + prey.index + lvs.index), θ0 (.), θ’ (.), pt (.), θ0π (eq.)
84.81
5.23
0.03
7
Leopard
ψ (F.cov + disturb.index + prey.index), θ0 (.), θ’ (.), pt (.), θ0π (eq.)
259.59 0 0.48 8
ψ (F.cov + disturb.index + prey.index), θ0 (.), θ’ (.), pt (lvs.index + walk.effort), θ0π (eq.)
261.26
1.67
0.21
10
ψ (F.cov + disturb.index + prey.index), θ0 (.), θ’ (.), pt (lvs.index), θ0π (eq.)
261.86
2.27
0.16
9
ψ (F.cov + disturb.index + prey.index), θ0 (.), θ’ (.), pt (walk.effort), θ0π (eq.)
261.92
2.33
0.15
9
Statement functions: ψ = probability of site-level occupancy; θ0π = probability of presence on first replicate; θ0 = probability of presence on replicate, given absence on previous replicate; θ’ = probability of presence on replicate, given presence on previous replicate; pt = replicate-level detection probability, given presence; F.cov = percentage forest cover; prey.index = index of prey availability (for tigers only wild ungulates, for leopards gaur were removed but livestock added); lvs.index = index of livestock abundance; walk.effort = effort walked in each grid; eq. = θ0π computed using values of θ0 and θ’
Table 10: Table shows models in explaining detection probability for the tigers and leopards ranked using Akaike‟s information criteria (AIC), along with difference in Akaike scores (Δ AIC), Akaike weights (wi) and number of parameters.
In terms of occupancy models, four models received most support (ΔAIC less than 4) in explain-ing tiger use (table 11), while five models received most support in explaining leopard occupancy. For tigers, percentage forest cover and wild prey index showed a positive effect on tiger use, while anthropogenic disturbance showed a negative effect as expected (table 12). The variation associated with these parameters was high; yet the results suggest the positive effect of in-creased forest cover and wild prey and the negative effect of anthropogenic disturbances for tiger use. Walk effort and livestock index had a negative effect on tiger detection probability. For leopard occupancy, anthropogenic disturbance and percentage forest cover had a positive effect on occupancy, while contrary to our expectation prey index (which included signs of sam-bar, muntjac, wild pigs and the presence of livestock) showed a negative effect. The variation associated with these parameters was high, thus these patterns are only suggestive. Walk effort had a negative effect, while livestock index had a positive effect on detection probability of leop-ards.
Species Model AIC ΔAIC wi
No. Par
Tiger
ψ (F.cov), θ0 (.), θ’ (.), pt (walk.effort +lvs.index), θ0π (eq.)
79.05 0 0.27 8
ψ (F.cov + prey.index), θ0 (.), θ’ (.), pt (walk.effort +lvs.index), θ0π (eq.)
79.26 0.21 0.24 9
ψ (disturb.index), θ0 (.), θ’ (.), pt (walk.effort +lvs.index), θ0π (eq.)
79.4 0.35 0.23 8
ψ (F.cov + disturb.index), θ0 (.), θ’ (.), pt (walk.effort +lvs.index), θ0π (eq.)
79.62 0.57 0.20 9
Leopard
ψ (disturb.index), θ0 (.), θ’ (.), pt (walk.effort +lvs.index),θ0π (eq.)
260.47 0 0.28 8
ψ (disturb.index+ prey.index),θ0 (.), θ’ (.), pt (walk.effort +lvs.index),θ0π (eq.)
260.55 0.08 0.27 9
ψ (F.cov + disturb.index+ prey.index),θ0 (.), θ’ (.), pt (walk.effort +lvs.index),θ0π (eq.)
261.26 0.79 0.19 10
ψ (.),θ0 (.), θ’ (.), pt (walk.effort +lvs.index),θ0π (eq.) 261.26 0.79 0.19 7
ψ (F.cov),θ0 (.), θ’ (.), pt (walk.effort +lvs.index),θ0π (eq.) 263.18 2.71 0.07 8
ψ = probability of site-level occupancy; θ0π = probability of presence on first replicate; θ0 = probability of presence on replicate, given absence on previous replicate, θ’ = probability of presence on replicate, given presence on previous replicate; pt = replicate-level detection probability, given presence; F.cov = percentage forest cover; prey.index = index of prey availability (for tigers only wild ungulates, for leopards gaur were removed but livestock added); lvs.index = index of livestock abundance; walk.effort = effort walked in each grid; eq. = θ0π computed using values of θ0 and θ’
Table 11: Table shows top models in explaining occupancy and detection probability for tigers and leop-ards ranked using Akaike‟s information criteria (AIC), along with difference in Akaike scores (Δ AIC), Akaike weights (wi) and number of parameters.

NINA Report 1079
63
Parameter β-coefficients (SE)
Tiger ψ F.cov 2.20 (1.22)
prey.index 0.34 (0.40)
disturb.index -1.75 (3.58)
Tiger pt walk.effort -1.65 (0.87)
lvs.index -2.28 (0.74)
Leopard ψ F.cov 0.56 (0.77)
prey.index -1.38 (1.18)
disturb.index 0.36 (2.22)
Leopard pt walk.effort -2.40 (2.12)
lvs.index 2.23 (2.68)
ψ = probability of site-level occupancy; pt = replicate-level detection probability, given presence; F.cov = percentage forest cover; prey.index = index of prey availability (for tigers only wild ungulates, for leopards gaur were removed but livestock added); lvs.index = index of livestock abundance; walk.effort = effort walked in each grid
Table 12: Table showing model-averaged β-coefficients with associated standard errors (SE) of covari-ates explaining tiger use and leopard occupancy in the northern Western Ghats.
The final estimates of use for tiger and occupancy for leopards are summarized in table 13. Tiger use in the region was predicted to be 0.43 (0.16), as opposed to a naïve estimate of 0.23, while leopard occupancy was 0.92 (0.06), while the naïve leopard occupancy estimate was 0.87. Spa-tial maps of tiger use and leopard occupancy are shown in figure 31 and 32. Detection probability for tigers was very low (0.21 ± 0.09), while for leopards it was high (0.91 ± 0.1).
Species θ0 (SE(θ0)) θ' (SE(θ')) θπ (SE(θπ)) pt (SE(pt)) Ψ (SE (Ψ)) näive Ψ
Tiger 0.78 (>10)* 1* 1* 0.21 (0.09) 0.43 (0.16) 0.23
Leopard 0.45 (0.08) 0.56 (0.08) 0.51 (0.07) 0.91 (0.1) 0.92 (0.06) 0.87
*Indicates biased estimates due to non-convergence θ0 (SE(θ0)) = probability of species presence on replicate, given absence on previous replicate. θ' (SE(θ')) = probability of species presence on a replicate given presence on previous replicate. θπ (SE(θπ)) = probability of species presence on first replicate. pt (SE (pt)) = probability of detecting a species‟ sign on a replicate, given presence on the replicate. Ψ (SE (Ψ)) = overall occupancy of a species in the available habitat. näive Ψ = naive estimate of occupancy of a species in the available habitat.
Table 13: Table showing final parameter estimates for tiger use and leopard occupancy and sign detec-tion probability from model averaging
Figure 32: Predicted values of tiger use in the mixed-use landscape in Maharashtra, northern Western Ghats
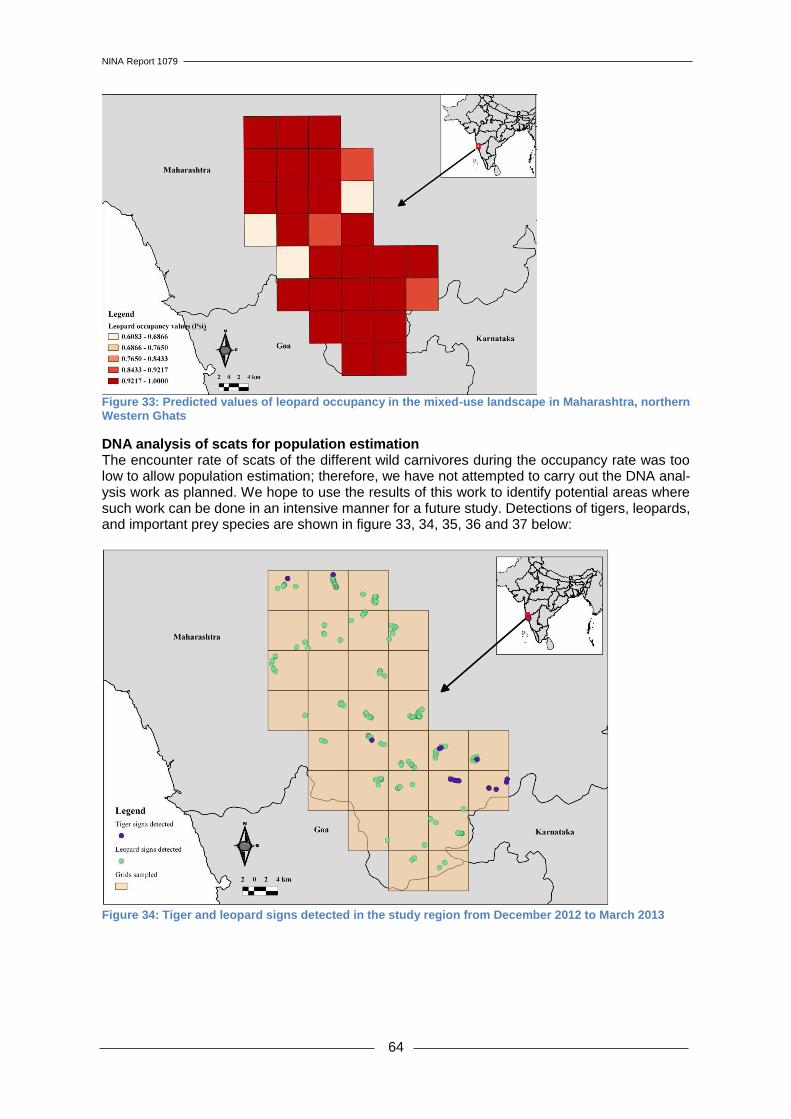
NINA Report 1079
64
Figure 33: Predicted values of leopard occupancy in the mixed-use landscape in Maharashtra, northern Western Ghats
DNA analysis of scats for population estimation The encounter rate of scats of the different wild carnivores during the occupancy rate was too low to allow population estimation; therefore, we have not attempted to carry out the DNA anal-ysis work as planned. We hope to use the results of this work to identify potential areas where such work can be done in an intensive manner for a future study. Detections of tigers, leopards, and important prey species are shown in figure 33, 34, 35, 36 and 37 below:
Figure 34: Tiger and leopard signs detected in the study region from December 2012 to March 2013

NINA Report 1079
65
Figure 35: Gaur signs detected in the study region from December 2012 to March 2013
Figure 36: Sambar signs detected in the study region from December 2012 to March 2013

NINA Report 1079
66
Figure 37: Muntjac and wild boar signs detected in the study region from December 2012 to March 2013
Figure 38: Human disturbance signs detected in the study region from December 2012 to March 2013
Conclusion The results of our study highlight important areas for tigers and leopards in this region. Tigers seem to occur in low density in the region, evidenced from the overall low estimated use of 0.43 (0.16) and no captures during preliminary camera trapping activities. Leopards, on the other hand, showed a high occupancy of 0.92 (0.06) and were captured on seven camera trap loca-tions out of 21 (30% of camera trap locations). Overall tiger signs were detected in seven out of 30 grid cells sampled, while leopard signs were detected in 26 grid cells.

NINA Report 1079
67
Key recommendations from our study are as follows: 1. This region is part of a tiger corridor connecting Dandeli- Anshi tiger reserve in Karnataka to
Radhanagri wildlife sanctuary in Maharashtra, thus there should be immediate policy deci-sions to increase the protection level in these areas to ensure tiger persistence in the future.
2. Status of tigers, leopards and other large carnivores and herbivores needs to be monitored on a regular basis and large-scale disturbances due to mining or infrastructural development should be strictly prohibited.
3. Since the region is human-dominated, with a large amount of forest under private ownership, incentive mechanisms that encourage landowners to keep areas under forest cover should be developed. There is a worrying trend of large-scale rubber estates taking over private forest areas in the region. These estates are rubber monocultures that seem to support little biodiversity and are often electric-fenced which creates a barrier to movement of wildlife. Tourism through „eco-lodges‟ may encourage landowners to retain forests and derive ben-efits out of it.
4. Wild herbivore densities appeared quite low in the region, possibly because of hunting. Few cases of poaching activities were observed during the study, therefore protection efforts should be enhanced in areas with higher occupancy of tigers. Some areas in Dodamarg tehsil could be potentially declared as a wildlife sanctuary to ensure connectivity for tigers in the long-term.
A survey for wildlife along the Khanduli River The survey case study has been performed and reported by Girish Punjabi, with support from Dr. Vidya Athreya (Wildlife Conservation Society and India Program & Centre for Wildlife Studies, Bangalore), the Tiger Monitoring Cell (Ranthambore Tiger Reserve, Rajasthan State Forest De-partment) and Dr. Dharamendra Khandal (Tiger Watch, Sawai Madhopur). Study area The river Khanduli emanates from the Mansarovar dam, situated south of Ranthambore National Park and heads along the Eastern boundary of Sawai Mansingh Sanctuary. It gradually drifts southeast and merges with the mighty Chambal, in the National Chambal Sanctuary. The Khan-duli flows through a mixed-use landscape comprising of forest, agricultural fields and plantations. However, like the Chambal, the river floods heavily during the monsoon and therefore the most dominant feature along its course is its ravines. These ravines are a myriad network of gullies and channels and form an important refuge for wildlife. In the dry season, segments of riverbed become attractive pastures for hundreds of heads of cattle, while there is also some marginal dependence on the water for agriculture. A portion of these ravines is part of the tiger reserve buffer flanked by agricultural fields on one side and Sawai Mansingh sanctuary on the other. It was this interface along the Khanduli that was surveyed to understand what species occur in such human-dominated environments in the buffer area as well as outside Ranthambore Tiger reserve. 14 camera trap locations (figure 38) covered the entire landscape of about 40 km2 along the Khanduli and an adjoining rivulet outside Ranthambore Tiger reserve. The survey was conducted in the months of April and May 2012. A total effort of 130 trap nights was invested over the entire survey period.

NINA Report 1079
68
Figure 39: Google Map showing the study area (white polygons) around the Khanduli River (blue line), the location of camera traps (yellow pointers), villages (blue pointers) and roads/paths (white lines)
Results The survey detected 12 species of mammals, including seven species of carnivores occurring in the area. Carnivores captured on camera included the tiger, leopard, hyena, sloth bear, jackal, jungle cat and the rare caracal. Other species found were sambar, nilgai, wild pig, Indian hare and porcupine.
Carnivores outside protected areas in India This citizen science project www.carnivore.in has developed a web- application (figure 39 below) for uploading images of wild carnivores (sloth bear, brown bear, black bear, wild dog, foxes, hackals, wolves, jungle cat and other lesser cats, mongoose, civets, tiger, leopard, snow leopard, asiatic lion and hyena) that has been photographed outside (even far away from) any protected area in India. 408 images have so far been uploaded and registered into the portal. Dr. Vidya Athreya has coordinated this project. The project has been supported by Conservation India, Center for Wildlife studies, Nature Conservation Foundation, Tiger Watch, the Wildlife In-stitute of India and the Norwegian Institute for Nature Research.

NINA Report 1079
69
Figure 40: Screenshot of the Web- application interface of Carnivores Outside Parks
7.4 Mobilizing camera trap data (example from the Rajaji NP) The camera trap data acquired by WII in Rajaji National Park had first to be organized using Geo- Tagging and metadata standards so that it could be mobilized and accessed by individuals, researchers, decision makers and the civil society. Standardizing camera trap data All the images from individual camera trap location were downloaded from the SD cards of cam-eras using a laptop and stored in different folders respectively. Individual tigers were identified based on their stripe pattern on the flanks, limbs and forequarters and given a unique identifica-tion number. Within the same folder bearing the name of the camera trap ID/code, two subfolders were created to store images from each of the paired camera traps that enabled easy Geo-tagging. Geo-tagging images Geotagging images is the process of embedding geographical information i.e. latitude and lon-gitude coordinates into the Exchangeable Image File Format (EXIF)74. The EXIF format stores technical metadata about capture, image characteristics and more of an image. Geotagging can be done with the help of the Geosetter software75. This software is a freeware tool for Windows (XP or higher) for showing and changing geodata and metadata (such as EXIF) of digital image files. Once geo- tagged, an image can be visualized in a GIS platform.
74 http://www.photometadata.org/meta-resources-metadata-types-standards-exif 75 http://www.geosetter.de/en/

NINA Report 1079
70
Extracting image metadata For images captured using digital camera traps, date, time, ISO setting, exposure mode, flash usage, focal length and geographic coordinates (geo-tagged images) extracted using freeware program such as the BR's EXIFextractor76. This simple freeware program will extract the EXIF metadata from digital photos of JPEG- format in a folder and saves the data in a CSV-file (Comma Separated Values). Any program that is capable of reading CSV-files, for instance Mi-crosoft Excel, Microsoft Access, PixFiler, and most database platforms can read this format. Assigning unique Identifiers to images After the identification of individual tigers, the data is organized in the Modified Audubon core template where a unique identifier number is assigned to the images. A 22-letter alphanumeric string proposed as unique identifiers for camera trap images (as described in section 4.2).
The unique identifier of an image from Rajaji NP was assigned as: CTP050612012001A00049a CTP: Camera trap photograph 05: State code for Uttarakhand (Census of India) 061: District code for Pauri (Census of India) 2012: Year in which photograph was captured 001A: Camera trap ID with A/B denoting one of paired camera traps 00049: sequential photo-capture number a: a/b/c distinguishes between multiple objects in the same photograph Registering metadata using the Audubon Core Template In order to make large numbers of biodiversity-related multimedia data efficiently available for a research infrastructure, there is a great need for a standardized metadata regime. The GBIF- and TDWG (Taxonomic Databases Working Group) joint task group77 has developed a multime-dia resources metadata schema called the Audubon Core78. The Audubon Core is a set of vocabularies designed to represent metadata for biodiversity mul-timedia resources and collections. These vocabularies aim to represent information that will help to determine whether a particular resource or collection will be fit for some particular biodiversity science application before acquiring the media. Among others, the vocabularies address such concerns as the management of the media and collections, descriptions of their content, their taxonomic, geographic, and temporal coverage, and the appropriate ways to retrieve, attribute and reproduce them. The Audubon Core describes the media resources with consistent metadata. One Audubon Core metadata record is a set of terms and term values describing an underlying multimedia object and its attributes. The Audubon Core schema consists of 80 terms of which six are mandatory (Identifier, Type, Title, Metadata Language, Copyright Owner, and Copyright Statement). WII have Geo-tagged and completed metadata for the captured tiger images from Rajaji National Park. The modified Audubon template is provided in Annex 1.
7.5 The national camera trap database The general ambition of this project is that the national WII database will share image data and metadata from all the described case studies: The Rajaji National park, the Sanjay Gandhi Na-tional Park, the Pune District in Maharashtra, the Sindhudurg district in Maharashtra, the Khan-duli River and the citizen scientist project “Carnivores Outside Parks”.
76 http://www.br-software.com/extracter.html 77 http://www.tdwg.org/activities/img/multimedia/charter/ 78 http://www.tdwg.org/homepage-news-item/article/audubon-core-public-review/

NINA Report 1079
71
7.6 The WII camera trap data Web Portal The Wildlife Institute of India (WII) has developed a Web Portal application designed for making the standardized camera trap data (images and metadata) accessible to the stakeholders. The technical environment for this customized application is summarized in table 14 below.
Fields Details
Location WII
Operating System MS Windows Server 2012 - 64 bit
Server Specifications
Processor : One Intel Xeon, E5-2640, 20MB Cache,
8 Core
Chipset : Intel C600
Memory: 64 GB DDR3 1600 RDIMM Maximum 768 GB
DIMM Slots - Minimum 24 DIMM slots supported by memory protection
Storage: HDD - 3 x 1.2 TB 6G SAS 10K rpm SFF with maximum scalability up to 72 TB with 24 drive bays. Smart Array P420i/1Gb FBWC Controller (RAID 0/1/1+0/5/5+0/6/6+0)
Optical Drive - SATA DVD ROM
NIC : 1Gb Ethernet four RJ45 port
Expansion Slots: Nine total expansion slots. Three PCIe 3.0 x16 (x16 speed); One PCIe 3.0 x16 (x8 speed); Four PCIe 3.0 x8 (x4 speed); One PCIe 2.0 x8 (x4 speed). 64 GB RAM, x-64 based processor
Software ERDAS APOLLO 2014
Database PostgreSQL 9.2
Table 14: Web portal web application technical environment
Application Access and Environment Details The application can be accessed from any system that has network access to the system. The user would access the application using a defined URL. The application can be accessed from any of the commonly used modern browsers. The supported browsers are Microsoft ® Internet Explorer 9+, Mozilla Firefox 14+, and Google Chrome 21+. The minimum supported screen res-olution is 1024 x 768. Login Page or Home Page Login Page is the default start page for all users trying to access the application. An extra link is provided for the guest users. These users do not require any authentication to view this portal. Guest users can click on the link and will be redirected to the portal. The login page contains:
Username text-box
Password text-box
Registration link
Link to login as guest user
Forgot password link
Information on the application (Optional)
Relevant header and footer information

NINA Report 1079
72
Login Mechanism There are primarily three kinds of users: Administrator Users, Registered Users and Non-regis-tered/Guest Users. Administrator Users These administrators have access to all features of the customised application. One of their main functionality will be user management. The administrators need to login to access the custom-ised application by providing valid username and password. The customised application have one preconfigured administrative account, which is used to login to the application and create required users. Success: The end-user is able to login to the application. Failure: The end-user stay on the login page with an alert statement mentioning that the user cant login. Registered Users The registered users are the users who have active login information, which is either managed by the administrator or approved by administrator. The registered users need to login to access the customised application. Success: The end-user is able to login to the application. Failure: The end-user stay on the login page with an alert statement mentioning that the user could not login. Non-registered/Guest Users The non-registered users are the users that can access the application without approved login authentication details. There are only one kind of user managed by the administrator, which are the “Guest User”. The details of the guest user are configurable. Login Registration Login should be through email-ID. The login page provides a facility for the new users to be registered. Clicking on the link opens up an interface asking user for the relevant information. Once the user provides the required information, a mail is sent to the administrator. The admin-istrator approves the required users. Once it is approved, a mail is sent to the user on the regis-tered email address. The mail contain the information to access the application. The users can then login to the application with the provided credentials and then change the password. Forgot Password The users can retrieve forgotten password by using a link on the login page. Clicking on the link opens up an interface asking the user for relevant information (required to identify the user). Once the user provides the required information, it is validated and a mail is sent to the user with new temporary password. The users can login to the application with the new credentials and then change the password. Access Rights The Table 15 is a mapping of what can be seen and accessed by the end-user depending on their credentials and the group that they belong to.
Functionality Administrator Users Registered Users Non-registered Us-ers (Guest Users)
Access the applica-tion
Allowed Allowed Allowed
View the map details (scale, projection, extents)
Allowed Allowed Allowed
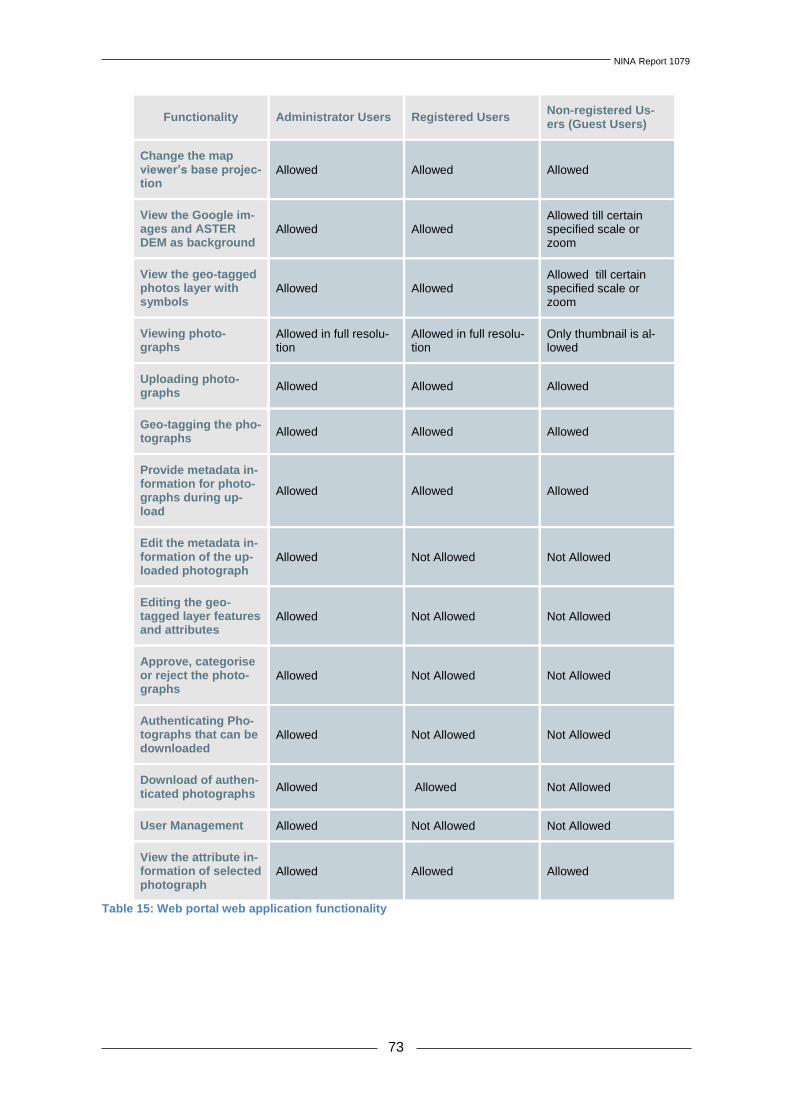
NINA Report 1079
73
Functionality Administrator Users Registered Users Non-registered Us-ers (Guest Users)
Change the map viewer’s base projec-tion
Allowed Allowed Allowed
View the Google im-ages and ASTER DEM as background
Allowed Allowed Allowed till certain specified scale or zoom
View the geo-tagged photos layer with symbols
Allowed Allowed Allowed till certain specified scale or zoom
Viewing photo-graphs
Allowed in full resolu-tion
Allowed in full resolu-tion
Only thumbnail is al-lowed
Uploading photo-graphs
Allowed Allowed Allowed
Geo-tagging the pho-tographs
Allowed Allowed Allowed
Provide metadata in-formation for photo-graphs during up-load
Allowed Allowed Allowed
Edit the metadata in-formation of the up-loaded photograph
Allowed Not Allowed Not Allowed
Editing the geo-tagged layer features and attributes
Allowed Not Allowed Not Allowed
Approve, categorise or reject the photo-graphs
Allowed Not Allowed Not Allowed
Authenticating Pho-tographs that can be downloaded
Allowed Not Allowed Not Allowed
Download of authen-ticated photographs
Allowed Allowed Not Allowed
User Management Allowed Not Allowed Not Allowed
View the attribute in-formation of selected photograph
Allowed Allowed Allowed
Table 15: Web portal web application functionality

NINA Report 1079
74
Data Sources Vector Data Vector data used in the customised application is in the format of shape files. The main applica-tion do access this data using the OGC web services created by ERDAS APOLLO. All the data is in standard and defined projection system and there are not any data in custom projection. If there is any, then the custom projection parameters are shared by WII. In addition, a new layer stores relevant information for the geo-tagged photographs. Raster Data Google Map (with Satellite, Map and Hybrid options) and ASTER DEM is used as background imagery. ASTER DEM is a single mosaicked raster data. All the data is crawled, managed, and configured using ERDAS APOLLO Data Manager. The display of data in the map viewer is based on the configurations defined for the layer in the ERDAS APOLLO Data Manager. Performance Improvement To improve the performance, Intergraph focussed on delivering the data in optimum way. One of the ways was to serve the raster datasets as OGC WMTS (over ECW data). This allowed users to view the datasets without installing any plug-in. To extract the best performance, Inter-graph worked with WII to use ECWs or OTDFs as the raster data formats. If creating ECW is not an option, then Intergraph shall use the data in its original format. WII will need to confirm whether creation and using of ECW is an option. User Management This allows the administrators to create and approve new users, update users, and delete users. User management includes the following options Add/Approve User, Update User and Delete User. Assumption: All the user related information like username, password, and other user de-tails are stored in the database. Basic Map Controls and Toolbar Controls The application contains map control toolbar buttons for different map operations. All users have access to the following tools: Zoom in, Zoom out, Interactive Zoom, Zoom to initial extent and Pan. Some of these tools are available as quick-navigation tools allowing the users to click and perform the operation (like zoom by one level, or pan by one screen, etc.) Distance and Area measurements The distance (segment and total) and surface area tools are available to all users. Layer Manager and Functionalities All users have access to the layer manager and its functionalities. The users can:
Style the feature layer
Reorder the layer
Set to view the data in specific scale ranges
Render the data as tiles or as map
Choose output format (if want to change the default)
Show or hide datasets by setting the visibility
Overview Window All users are able to view the overview of the map viewer in a simple and separate small window. The data used in the overview window can be configured.

NINA Report 1079
75
Uploading the Photographs The application allows the users to upload static images or photographs. The users are provided with an option to choose the photographs, stored locally, to be uploaded to the server. The up-loaded photographs are to be of either JPG or PNG file format. The photographs are copied and stored in a specific directory structure on the server. The path of these photographs are refer-enced as one of the attributes. The user have an option to geo-tag these photographs. The user are provided with additional option to attach metadata related to these photographs. All photo-graphs, approved by administrator, are shown as a fixed symbology in the map viewer. When the user clicks on the location where the photographs are geo-tagged, the user has an option to view the photograph and its metadata. These are uploaded based on the rights defined by the administrator. Only the photographs that have been approved by the administrator are shown in the portal to the users. Metadata for the Uploaded Image The user fills in Metadata for the uploaded image during the upload process. The user have to enter the mandatory fields and additionally optional fields. The default is populated where needed. The administrator is intimated on each upload of photograph via email notification. Once the administrator approves these photographs, all users are able to download these geo-tagged photographs. Geo-tag the Photographs The user uploads the static images or photographs. The user can define a location and then upload the photo to that location. Geo-tagging the photographs are mandatory. The photographs and its metadata are not uploaded to the server until the photos have some location defined. Assumption: Geo-tagging of the image is based on user click while uploading of the image. The administrator have the option of editing it and setting it again, if desired. Symbology of Uploaded Photographs The portal application shows these uploaded photographs as a separate layer. This layer is a fixed pre-defined theme. The photographs are classified in either “Scientific” or “People’s Initia-tive” type. The symbology of the photographs is depicted on the map viewer. The depiction is based on either of these two classifications. The user has an option to know the details of each classification with some fixed text defined by the administrator in the form of legends. Admin Rights for Photographs This application portal has an option for the administrator to view uploaded images. The admin-istrator has following rights with these photographs:
Categorize the uploaded image as per classification.
Edit metadata for the uploaded image.
Reject the uploaded image.
Approve the uploaded image before it is shown as a symbol to the general users.
Assign downloadable rights for this photograph.
Resolution of Uploaded Photographs The approved photographs are displayed on the map viewer as a thumbnail or in good resolution based on the group to which the user belongs. The registered users and the administrators are able to view the photographs in good resolution. The guest users are able to view the photo-graphs just as a thumbnail. The user needs to click on the symbol to display the photo in an embedded interface or a new window.

NINA Report 1079
76
Downloadable Rights for the Users The administrators has an option to assign rights to each photograph. General users do not have any option to download the geo-tagged photograph. Registered users have an option to down-load a photograph based on user rights. Administrators are able to do update, edit, or delete any photograph.
Figure 41: The web portal application login interface
Figure 42: Image metadata interface

NINA Report 1079
77
7.7 Guidelines for Best Practices The project has produced a Best Practice Guide (BPG)79 for publishing of biodiversity data as-sociated with multi-media objects, with a focus on camera traps. The context of this BPG is the recognition of capacity building as an essential component of the Intergovernmental Platform for Biodiversity and Ecosystem Services (IPBES). The guide has implemented the global standards, best practices and technical framework for data publishing developed by GBIF. The current version of the BPG is based on synergies ex-tracted through literature reviews and experiences from several camera trapping projects in In-dia, Norway and South Africa. Based on identified user needs, user experiences, existing stand-ards and technological framework developed by GBIF, the project team hopes that the guide could catalyze the usage of camera trapped biodiversity data in decision making for an environ-mental friendly future. Knowledge about the identity, occurrence, abundance and behavior of organisms forms the backbone of our understanding of the biological world, and is essential for monitoring the state of natural ecosystems, for developing sound environmental management policies and making ecologically sustainable development decisions. Multimedia resources (see figure 42 below) can provide reliable evidence for the occurrence of a species at a particular place and time, and there is growing recognition that a biodiversity-related multimedia object could be used as a primary biodiversity record (as long as the support-ing information is reliable and verifiable). Multimedia-related biodiversity data can be used in a wide range of studies that are of relevance to wildlife managers and scientists, and can be used in many biodiversity informatics applications, such as species and specimen descriptions, glos-saries and image processing.
Figure 43: Multimedia resources
79 http://www.gbif.org/orc/?doc_id=6045

NINA Report 1079
78
Open access to well-managed biodiversity data that is in exchangeable formats is essential to enable effective environmental planning, management and decision-making (Chavan and Ingwersen, 2009). However, open access to data, by itself, does not necessarily make the data useful, nor enhance our knowledge. It is only when data is effectively managed, preserved and shared, that science and society can benefit from access to it. Over the past decade, GBIF has been striving to make digital biodiversity data freely and openly available via the Internet for scientists, researchers, decision-makers and the public. With the advent of technologies such as digital photography and camera trapping, large volumes of bio-diversity, data are being generated through multimedia objects. With the increasing need for a high volume of credible, high-quality data for research, instruction and decision-support, biodi-versity information systems and networks must now mobilize primary data associated with both traditional and non-traditional sources, including multimedia resource such as camera trap im-ages.
Figure 44: The Best Practice Guide on publishing biodiversity data associated with multi- media objects, with a focus on camera traps

NINA Report 1079
79
Multimedia objects are created and managed by a wide cross-section of communities and indi-viduals, including research scientists, wildlife managers and interested members of civil society. These multimedia objects are potentially a rich source of biodiversity information, but, currently, much of this is not captured, stored or disseminated in any kind of systematic way, which means that it is not available for assessing the state of biodiversity, or for informing wildlife management policies and actions. One of the reasons for this has been the lack of guidelines that describe the equipment, methods, standards and workflows for capturing and managing the biodiversity data associated with multimedia objects, or for publishing it and making it openly accessible in exchangeable formats. Hence, the need for this best practice guideline (see frontpage in figure 43 abow). A best practice guide will, according to the prevailing technological and scientific development, always be a working document. To ensure the future relevance of the BPG beyond this project, GBIF will take care of its future updates and maintenance. In addition, GBIF also provide a ded-icated community site80 where people can discuss and contribute to the maintenance of the BPG.
7.8 Planned training workshop at the Wildlife Institute of India
Time Agenda item
9:00 - 9:30 AM Registration
9:30 - 11:00 AM Camera trap Data Col-lection
Welcome address Use of spreadsheets or software to collect, code and record images and metadata
11:00 - 11:15 AM Tea break
11:15AM - 1:00 PM Data Management Store and manage images and metadata
1:00 PM - 2:30 PM Lunch break
2:30 PM – 4:00 PM Quality Control and En-hancement
Data Cleaning, Backing up etc.
4:00 PM - 6:00 PM Publish camera Trap Data
Making data publicly accessible through the GBIF network
Table 16: Drafted agenda for a planned training workshop at WII
7.9 Legacy data repatriation
Introduction This report is a first investigation of the plants, fungi and animal specimens originating from India that are currently housed in the Norwegian natural history museums. GBIF Norway, located at NHM in Oslo, prepared the report. The present report is based on a survey among the curators of the different natural history col-lections of the Tromsø University Museum81, the Museum of Natural History and Archaeology, NTNU in Trondheim82, University Museum of Bergen83, and the Natural History Museum of the University of Oslo84 (hereafter referred to as Tromsø, Trondheim, Bergen and Oslo). A descrip-tion of relevant material and the state of data management is given below. Currently available metadata on collection specimens are organized in an Excel data sheet and will be available at www.gbif.no by autumn 2014.
80 http://community.gbif.org/pg/groups/17760/ 81 http://uit.no/tmu?p_lang=1 82 http://www.ntnu.edu/museum 83 http://www.uib.no/en/universitymuseum 84 http://www.nhm.uio.no/english/

NINA Report 1079
80
Relevant material from Tromsø The collection in Tromsø includes very little from India: One bumblebee, 3 springtails, 25 butter-flies (all without collection date), 4 crustaceans and 13 mollusks without collection data (pc Arne C. Nilssen, 29-02-2012).
Relevant material from Trondheim Animals The zoological collection includes 1 cnidarian, 122 mollusks (mostly marine), 24 birds, 4 mam-mals and 3 reptiles. These are all old specimens, presumably from the end of the 19th century or the first half of the 20th century, without collection date. In addition, the collection site is poorly documented, often restricted to “India” or “Indian Ocean”. There is no easy way to obtain data that are more precise. Data from Indian specimens in Trondheim are not yet available in the GBIF- portal. Plants The vascular plant collection has not been digitized, but random sampling suggests it contains virtually no specimens from India (p.c. Torkild Bakken). The most interesting Indian material in Trondheim is found in the bryophyte collection, which houses the legacy of the botanist Ingebrigt Hagen (1852-1917). In the course of 2014 the bryophyte herbarium with its circa 30.000 speci-mens will be digitized. In the Trondheim bryophyte collection a total of 252 records of mosses are registered (p.c. Kris-tian Hassel). These include 38 specimens with type status. Additionally, 28 objects are lacking taxon names. (5 liverworts and 23 bryophytes).These are mostly from the Himalaya, and include relatively many type specimens (not labeled as such) which the Finnish botanist V.F. Brotherus (1849-1929) has worked on. These specimens have relatively complete collecting data. Moreo-ver, the digitization project in Trondheim includes the addition of the currently valid nomenclature (p.c. Tommy Prestø).
Relevant material from Bergen Animals The vertebrate collection contains 18 reptile specimens as well as a few bird eggs and fishes from India. There are no bird skins or mammals in this part of the collection (p.c. Ingvar Byrkjedal). However, the osteology collection contains eight craniums and skeletons (Tore Fred-riksen). The museum in Bergen contains neither insects nor marine invertebrates from India (p.c. Trond Andersen and Jon Kongsrud). No animal collections from Bergen are currently available from the GBIF portal. Plants and fungi The vascular plant collection is likely to hold some specimens from India but these are difficult to find as the material is sorted taxonomically and not yet digitized. While the Fennoscandian herbarium had been digitized, there are yet no plans for the digitization of the general herbarium (p.c. Solfrid Hjemtveit). Some 30% of the bryophyte herbarium has been digitized, including 41 specimens from India (10 of these are already visible in the GBIF portal). Once the complete bryophyte herbarium is digitized (80 000 specimens) there may be an estimated number of 150 mosses from India. Lichens and fungi have all been digitized and include 39 lichen specimens from India and no fungi (p.c. Astri Botnen). 34 lichen specimens are currently visible in the GBIF portal (p.c. Astri Botnen).
NINA Report 1079
81
Relevant material from Oslo Animals The mammal collection includes 108 specimens (mounted animals, skulls or skins, sometimes from the same individuals) from ‘India’. Insofar these are dated at all, they originate from the 19th century. No further collecting information is preserved. These data are already available in the GBIF portal. Oslo has 1027 bird specimens from India, both skins and mounted and demounted specimens. These are either not dated or originate from the 19th century or the first half of the 20th century. Locality is sometimes recorded at the region or district level, with relatively many specimens from Darjeeling. More detailed collecting data are missing. Englishmen, some of whom have had an important role in Indian ornithology, have collected most of this material. These skins may there-fore be of particular historical value. Notable are 295 skins labeled as being collected by ‘Blyth’. This name most likely refers to the English zoologist Edward Blyth (1810 –1873), who was one of the founders of zoology in India (cf. Wikipedia lemma Edward Blyth). Another known name is Henry Seebohm (1832-1895), to whom twelve skins are attributed (misspelled in one case as Subohm). The bird data are not yet published in GBIF. The fish collection database contains 34 specimens (p.c. Ann-Helen Rønning). Vladimir Gusarov is working on Staphylinidae beetles. He reports 508 specimens from India, which are not yet identified to species level. The Hymenoptera collection includes 130 pinned specimens originating from the collection of Charles Thomas Bingham (1848-1908). These have been collected in Sikkim. In addition, there are seven Hymenoptera and one Orthoptera originat-ing from the Deinboll collection, all labelled Trankebar. Some of these may represent types of taxa described by J.C. Fabricius (1745-1808) (p.c. Lars-Ove Hansen). These collections are not digitized. There are virtually no Lepidoptera or Diptera from India in Oslo (p.c. L. Aarvik and G. Søli). Finally, the museum holds circa 10 crustacean specimens (p.c. Lutz Bachmann) and 3 molluscs (p.c. Ann-Helen Rønning). Plants There is a small digitized collection of 89 vascular plants from Himachal Pradesh and Maharash-tra provinces. These were deposited by the Indian student B. Natarajan who studied in Oslo in the 1990s. In addition, the older vascular plant type collection in Oslo has been digitized. This includes 12 older type specimens from India. However, most of this herbarium has not been digitized. It may contain some thousands of specimens from India. These are currently difficult to locate as the herbarium is organized in taxonomic rather than geographic units (p.c. Charlotte Sletten Bjorå). The museum intends to digitize the herbarium at a level that would enable the retrieval of taxa per continent or even per country. This enterprise is however still in the planning phase (p.c. Bjørn Petter Løfall). Likewise, the bryophyte and algae collections might contain material from India, but this can only be retrieved after digitization. Oslo probably holds no Indian fungi (p.c. Karl-Henrik Karlsson). The digitization of the Oslo lichen herbarium is ongoing (2014). Currently 34 specimens from India are visible in the GBIF portal. This number may increase to circa 100 once the entire lichen herbarium is digitized. Most of these have been collected after 1950 and have rather complete collecting data (p.c. Einar Timdal). The Botanical garden at the Natural History Museum in Oslo has six living plants originating from India. As the country of India has banned the export of plant specimens, specimens collected in India prior to the ban are of high value for the research community. Due to ongoing mass digitization

NINA Report 1079
82
of the vascular plant herbarium in Oslo, the angiosperms were only surveyed up to and including the family of Cyperaceae. A total of 687 specimens were identified. The specimens were pri-marily collected in the mid or late 19th century. Whereas most are personal collections and some are from “flora exsiccata”, which were herbarium sheets sold by sellers that did not necessarily collect the specimens themselves. One of the earliest collectors, which have donated material to Oslo, was Nathaniel Wallich (1786-1854). Unfortunately, he did not specify where in India or when the collection was made. Never-theless, it is known that he arrived in India in 1807, and that he retired around 1846. It is also known that he spent most of the time in or around Calcutta, but he also made several expeditions to what is now known as neighboring countries of India. Wallich described many new species on his journey, and some of the specimens might therefor be type specimens. The most famous and important of the collectors may be Joseph Dalton Hooker (1817-1911), who collected along with Thomas Thomson (1817-1878), mainly in the Khasia area. They also split up and went for individual surveys where J.D. Hooker went to Sikkim, and T. Thomson went to the western Himalaya and Punjab. J.D. Hooker is known to have collected and described many new species from India, which means that there might be some hidden syntypes in the material present at the herbarium in Oslo. The collections are not numbered which might further complicate the decision of the status of the specimens. J.D. Hooker's main affiliation was to the botanical garden in Kew, where more of their material can be found. However, the value of the collections in Oslo is high as it might add to what is found in Kew. Their journeys are well de-scribed, so an approximate date to their collections can be found by tracing their journey. Major/Captain Francis Jenkins (1763-1866) and John William Masters (1792-1873) collected plant specimens in the area of Assam. F. Jenkins is credited for being the one that discovered the tea plant in Assam. J.W. Masters made most of the collections present in Oslo, with little or no additional information other than the label shared with F. Jenkins "Coll. Jenkins Plants of Assam". They apparently did more collecting than describing. Thomas Anderson (1832-1870) is represented with a few collections in the herbarium. It seems like some former worker in the herbaria of Oslo confused him with the Swedish botanist Nils Johan Andersson (1821-1880), which was on a circumference within approximately the same period. Some of their collections are quite precise and includes the site and even the date of collecting; however, others are of less precision. John Firminger Duthie (1845-1922), is strongly represented in the collection of material from India. Most of his collections are from the period of 1880-1900. Therefore, the number of new species described by him is lower than the previous collectors for obvious reasons. His collec-tions are very precise and include both area and date of collection. One of the collectors from the early 1800's was Dr. Bernhard Schmid (1787-1857). Working as a missionary he mainly collected, but Jonathan Carl Zenker has used his material. The material is almost exclusively collected in the Nilagiri area. More recently, Robert L. Fleming collected many specimens in the Dehradun area about 1950, mainly pteridophytes. Professor Ove Arbo Høeg from the University of Oslo did some collections in 1951-1952. As these collectors are more recent, the labels are more detailed than the prede-cessors are. In addition to these collectors that count for most of the material, several others have contributed. These are mainly persons from the University of New Delhi, which mainly collected around New Delhi, even on the University campus. A special case is that of Rudolph Friedrich Hohenacker (1798-1874). Many collections bear his label, but these are not collected by him personally. R.F Hohenacker sold flora exsiccates, which

NINA Report 1079
83
consist of specimens collected by other persons. The only additional information on these col-lections is the area they were collected. These collections have to be considered of lower scien-tific value than others are, unless the original collectors can be traced, and thereby giving a timespan and an actual collector. Many of the specimens from India in the herbarium of Oslo are from the 1800's and are therefore of a certain value. The possibility that some of them might be syntypes or isotypes adds addi-tional value. Again, for scientific purposes, material from India collected after their export ban is rare outside India. Although it is not very useful for most modern DNA techniques, morphology is still the backbone of modern botany. It is also worth mentioning the "cool" factor of some of these collections. J.D. Hooker was one of Charles Darwin’s closest friends, which gives some perspective to what kind of material we are dealing with and help convey this era of botany.
Conclusion and recommendations for repatriation of legacy data As expected, the zoological and botanical material from India in the Norwegian natural history museums is rather limited and comprises only a few thousands specimens. The museum in Oslo has the largest collection, though Trondheim holds an important bryophyte herbarium. The zoological objects from India consist mostly of vertebrate skins, skull and skeletons from the 19th and early 20th century. The metadata is digitized but provides little detail. In many cases, the locality is only indicated as “India”, so that it is not even certain these objects originate from the territory of the present Republic of India. In the cases where districts or even place names are mentioned, it will require some effort to find the possible coordinate range for the historical geographic designations. This old material may still be valuable for taxonomic or historical re-search, especially if it includes rare species. It is therefore desirable that the metadata become publicly available, even if the locality data is very imprecise and the nomenclature needs check-ing. The herbaria (notably vascular plants and bryophytes in Oslo and Trondheim) are more promis-ing. While these do not include more specimens from India, the older material tends to be more completely documented and labelled. They also include a number of type specimens. At present locating material from India is almost unfeasible as the herbaria are organized taxonomically. However, the museums are planning digitization efforts in the coming years. Digitization of the bryophyte collection in Trondheim will yield high-quality data that will be directly usable. Photo- Digitization of the herbarium in Oslo is ongoing (2014) with a relatively coarse resolution of 300 dpi. However, it will become possible to locate specimens for detailed digitization whenever there is a demand for it. Much of the Norwegian collection data has not been digitized, and digitization projects tend to prioritize Norwegian or Fennoscandian flora and fauna. In addition, not all data residing in local databases has been shared through GBIF. For these reasons, the cooperation of many curators was needed to produce this report. The Norwegian natural history museums are currently work-ing on a joint database system called MUSIT85, which is expected to become operational within a few years. Once this is in place it will be much easier to search at least the digitized collection specimens on, for instance, collecting site. A number of small projects have been identified that can produce useful Indian biodiversity data in the short run if further financial resources become available: 1. Publication of Indian bryophyte material from the herbarium in Trondheim 2. Delivery of data present in local museum databases to GBIF (e.g. the Oslo bird skin collec-
tion)
85 http://www.musit.uio.no/musit/musitweb/html/english.html

NINA Report 1079
84
3. Digitization and identification of possible type specimens from the Charles Thomas and De-inboll collections in the museum in Oslo.
4. In a few years targeted digitization of Indian herbarium specimens in Bergen and Oslo, once coarse-grained digitization of these herbaria is completed.
7.10 Use and reuse of data
Camera trap image helps identify poached tiger skin Direct killing of tigers is the most immediate threat to the remaining wild tiger populations. Despite increased efforts in international tiger conservation, including law enforcement and anti-poaching efforts, a substantial market exists for tiger parts and products. Each time a tiger skin is seized, ascertaining the landscape from where the individual may have been poached involves forensic examination using molecular genetic techniques. However, if a substantial photographic data-base of live tiger pictures obtained from camera trapping studies is available, assigning individual identity to skins of tigers poached from sites is possible. On February 9th 2012, a seizure of tiger skin and bones was made in the town of Najibabad in Northern India while in transit. The poachers admitted that the individual was killed in a non-protected forest area in close proximity to Rajaji National Park. Due to a long term photographic capture-recapture study on tigers in this region a database of individual tigers was available for comparison. Using standard visual comparison procedures, this individual was identified to be a female, captured once along the southeastern boundary of the park in October 2009 (For more details see Hiby et.al. 2009).
Figure 45: Seized tiger skin from the town of Najibabad (Northern India) and accompanying camera trap images from the southeastern boundary of the Rajaji National park.
The proposal for a tiger reserve in Rajaji National Park Studies performed by WII on the recovery of habitat, wild prey and tiger following relocation of Human settlements from the Rajaji National Park (described in section 7.3) clearly demonstrates the need for a Rajaji Tiger Reserve. The studies identified a multitude of factors such as availa-bility of inviolate space, a healthy prey biomass and a small breeding population that provide excellent opportunity for tiger conservation in Rajaji. However, (as stated in section 7.3) recovery of tiger population across the park requires active management intervention, focused attention

NINA Report 1079
85
and sustained funding. This can only be achieved by bringing Rajaji under the umbrella of Na-tional Tiger Conservation Authority.
Standard operational procedures regarding human wildlife conflicts The Ministry for Environment, Forestry and Climate Change (MoEFCC) launched in 2011 spe-cific guidelines for Human- Leopard Conflict Management86 based on the work of among others Wildlife Institute of India and Dr. Vidya Athreya. These guidelines provide a framework not only to address the conflict after its occurrence, but also to minimize such conflicts through adoption of necessary proactive measures.
Discovering primary biodiversity data from social networking sites A large amount of geo-referenced primary biodiversity media data are captured through different social networking sites (SNS). Mobilization of these data is challenging. GBIF has taken steps to address this challenge through the GBIF Multimedia Resources Task Group. One of the task group recommendations is to mobilize massive geo-referenced acquisition of media (Morris et al. 2008). The study of Dr. Vijay Barve et.al presents an interesting alternate resource for primary biodiver-sity occurrence records discovery, and assesses the value of the same (Barve 2014). The study is a part of Dr. Barve`s doctoral dissertation (with partial support from GBIF under the Young Researcher Award). Several Bird and Butterfly experts are involved with Dr. Barve for exploring and verification of the data from the different SNS. Detailed, authoritative Digital Accessible Knowledge (DAK) about biodiversity is crucial to any biodiversity informatics or conservation project. In most developing nations, significant DAK gaps exist both geographically and taxonomically. Dr. Barve`s work will explore and implement a novel source of photo-vouchered biodiversity occurrence data in the form of records associated with photos on SNSs. Flickr, Facebook, and Picasa Web allow naturalists to share images and asso-ciated metadata with other users. These websites are also becoming increasingly geo-aware.
Figure 46: Discovering and developing primary biodiversity data from social networking sites
86http://envfor.nic.in/sites/default/files/moef-guidelines-2011-human-leopard-conflict-manage-ment.pdf

NINA Report 1079
86
Dr. Barve propose to discover, organize, assess, and share massive numbers of biodiversity occurrence records now available on SNSs. He will explore this data source with two case stud-ies on birds and butterflies as a proof-of-concept. However, the tools and methods can easily be extended to any region or species group, particularly for developing, mega diverse countries where the need for biodiversity DAK is particularly acute. Dr. Barve plan to compare data acquired from SNSs with existing GBIF data. This approaches are broadly applicable to animal and plant groups that are photographed and that can be identi-fied from photographs with some degree of confidence, and thus offer a rich new source of bio-diversity data for developing nations. This could be especially useful for countries like India that do not have lot of available data in GBIF, but have a growing population of internet savvy natu-ralists and professionals interested in photography and biodiversity.
7.11 Outreach and promotion Publications
Cadman, M., Chavan, V., Ghosh, Athreya, V., Hanssen, F., Lindgaard, A., Mathur, V.B.,
Mehlum, F., Pandav, B.Talavàn, A.G. & Vang, R. NINA-GBIF-WII Best Practice Guide
2014: Publishing biodiversity data associated with multi-media objects, with a focus on
camera traps.
Harihar, A., Pandav, B. & Goyal S. P. (2011). Responses of leopard Panthera pardus to
the recovery of a tiger Panthera tigris population. Journal of Applied Ecology, 48: 806-814.
Harihar, A., Kurien, A. J., Pandav, B. & Goyal, S. P. (2007). Response of tiger population to
habitat, wild ungulate prey and human disturbance in Rajaji National Park, Uttarakhand, In-
dia. Final Technical Report, Wildlife Institute of India, Dehradun. Pp iii+165.
Conference participation (presentations and posters)
GBIF Governing Board meeting, 17-19 September 2012 at Lillehammer- Norway (annex 2).
The Conference of the Parties (COP), 8-19 October 2012 in Hyderabad- India (annex 3).
The Seventh Conference on Biodiversity - Ecology and Economy for a Sustainable Society, 27-31 May 2013, in Trondheim, Norway
Coverage in public media The pilot project has been presented at the web- pages of NINA, NBIC and GBIF several times during the project period.
Hindustan times paper, 2012. Wildlife exists outside protected areas also.
Sakal Paper, 2012. Marathi article about wildlife outside protected area.
Sakal Times Paper, July 11. 2012. Article about the project (see figure 45 below).
The movie Azoba87. The human-leopard conflict in Maharashtra has become a subject of
concern following the numerous incidents of the feline being spotted in human settlements. Taking this as the crux of its story, “Ajoba”' takes you on an adventure that starts in the town of Junnar in Maharashtra, across the Malshej Ghat area into Vasai and ends near Nashik. The film is based on wildlife conservationist Vidya Athreya's experiences with the spotted animal and starts with Purva Rao (Urmila Matondkar) getting a call about a leopard that has fallen in a well in a village. Accompanied by Shinde (Shrikant Yadav) she rescues the leopard and inserts an electronic chip in its tail to help them track its whereabouts. In reality, this was the first instance of its kind and helped a lot in further research on the animal. Christened Ajoba, the leopard moves from the place of its release in Malshej Ghat to Vasai and then to
87 https://www.youtube.com/watch?v=pZNLbBP6Q0M&feature=kp

NINA Report 1079
87
Sanjay Gandhi National Park in Mumbai over a journey of 29 days. Read more about the movie review at the web- pages of The Times Of India88
Figure 47: Article about the project in the Sakal Times Paper, July 11. 2012.
88 http://timesofindia.indiatimes.com/entertainment/marathi/movie-reviews/Ajoba-Urmila-Matondkar-Sujay-Dahake-Om-Bhutkar-Hrishikesh-Joshi/movie-review/34784429.cms

NINA Report 1079
88
8 Project capacity building towards IPBES In the initial project phase this capacity building pilot- project was targeted on a reviewed list of capacity building needs and recommended approaches and actions identified in the pre- IPBES scoping paper89 launched by the UNEP World Conservation Monitoring Centre90 (UNEP World Conservation Monitoring Centre, 2011) at the request of the Norwegian Government. The later approved Work programme for IPBES 2014- 201891 (IPBES 2014) features a se-quenced and prioritized set of objectives, deliverables, actions and milestones for advancing the four functions of the IPBES (assessment, knowledge generation, policy support and capacity building). This final report highly address the actions and recommendations in the IPBES working program. Our project results have great potential synergies with other countries. IPBES has organized a Task force on Capacity building, and we are very comfortable having Dr. Vinod B. Mathur (Di-rector of WII) as a member of this Task force. This will ensure that our project results are well communicated within the IPBES Task force. In addition, Dr. Mathur has valuable insights in na-tional/international capacity building needs, biodiversity management and conservation issues that is highly relevant for the IPBES Task force. As Director of WII, Dr. Mathur will also represent an important link between the IPBES and the ongoing research activities in India and the neigh-boring countries in the region. One of the IPBES Technical Support Unit`s (TSU) with focus on capacity building is located in Trondheim (Norway). This unit is currently under development (medio September 2014). Both the Indian and the Norwegian project partners will actively support the TSU and share our com-petencies and experiences whenever requested. During the project period (2011- 2014), we have had a very good dialog with the IPBES respon-sible officers at the Norwegian Environmental Agency and in the Indian Ministry of Environment, Forestry and Climate Change (MOEFCC). The mandatory support of these two contact points have been very important for calibrating the project developments with the developments of IPBES.
8.1 Collaboration with GBIF From the beginning of the project, we established a close collaboration with GBIF who offer capacity building, international common standards and an operational open data infrastructure. By encouraging and helping institutions to publish data according to common standards, GBIF enables research not possible before, and informs better decisions to conserve and sustainably use the biological resources of the planet. GBIF operates through a network of national nodes, coordinating the biodiversity information facilities of participant countries and organizations, col-laborating with each other and the Secretariat in Copenhagen to share skills, experiences and technical capacity. The capacity-building component of this project has been prominent, thanks to GBIF, and we would highly recommend similar future capacity building initiatives to collaborate with GBIF.
8.2 International networking across disciplines This capacity building pilot-project has brought together Indian and Norwegian experts in ecol-ogy, biodiversity informatics, IT and GIS. These experts have shared their knowledge, and they are currently networking internationally to establish new partnerships and future collaboration.
89 http://dnweb14.dirnat.no/multimedia/48586/IPBES-Capacity-Building-Scoping-Paper.pdf 90 http://www.unep-wcmc.org/about-us 91 http://www.ipbes.net/images/decisions/Decision%20IPBES_2_5.pdf

NINA Report 1079
89
8.3 The Best Practice Guide The Best Practice Guide (BPG)92 for publishing of biodiversity data associated with multimedia objects, provides great capacity building towards the international context in terms of implement-ing global standards, best practices and technical framework for data publishing developed by GBIF. The guide is based on synergies extracted through international literature reviews and experiences from camera trapping projects in India, South Africa and Norway. The project team hopes that the guide could catalyze the usage and mobilization of camera trapped biodiversity data in research and decision-making. Of course, a guide like this has to be continuously updated to keep its relevance. As a response to this, GBIF will host and maintain the BPG for the future.
8.4 Technological development supporting data mobilization One of the core components of this project has been capacity building in data mobilization and data sharing through online WEB portals, and use of international standards. NINA has shared experiences with the Indian partners about how data, images and video from the national camera trapping monitoring program of the Norwegian lynx population has been organized and dissem-inated through http://viltkamera.nina.no/. GBIF Norway has shared information about their de-velopments of the Norwegian GBIF- portal93. Furthermore, NBIC has shared the Norwegian experiences on data mobilization and coordination of (legal and financial) means related to data mobilization, citizen science and the implementation of the national biodiversity infrastructure94. These experiences have been useful for the Indian project partners in their developments of the WII Database and WEB application, as well as the citizen science project portal Carnivore out-side parks95.
8.5 Validating the Audubon Core metadata standard There is a great need for a metadata standard for biodiversity related multimedia. The GBIF- and TDWG (Taxonomic Databases Working Group) joint task group96 has developed a multimedia resources metadata schema called the Audubon Core97. Through their work on standardization of camera trap data from Rajaji National Park, WII have gained valuable experience with the standard and its metadata template. This template was validated with practical needs, and mod-ified. The modified Audubon template is provided in Annex 1.
8.6 The case studies The Indian project partners have performed six case studies in India in order to demonstrate how biodiversity informatics, camera trapping, data mobilization and access policies can contribute to improved decision making. The outcomes of these case studies have led to a better under-standing of methodologies (camera trapping techniques, occupancy modelling and DNA- analy-sis), species distribution, human- wildlife conflicts, human disturbance effects on wild mammals, habitat recovery, tiger population management needs and investigation of poaching based on forensics, camera trapping and digital image analysis. In the case of India, a national database of tiger photo-captures could greatly complement law enforcement agencies in identifying the sites most vulnerable to poaching. All these case studies have involved networks of research scientists and citizen scientists. The lessons learnt from these case studies are relevant for in-ternational capacity building in Biodiversity informatics.
92 http://community.gbif.org/pg/groups/17760/ 93 http://gbif.no/ 94 http://www.biodiversity.no/frontpage.aspx?m=23 95 www.carnivore.in 96 http://www.tdwg.org/activities/img/multimedia/charter/ 97 http://www.tdwg.org/homepage-news-item/article/audubon-core-public-review/

NINA Report 1079
90
8.7 Training, workshops and involvement of citizen scientists A workshop in compiling Data Papers was organized in Pune (India) by GBIF in June 2013 and an internal training workshop on mobilization and application of camera-trapped biodiversity data is planned to be organized at the Wildlife Institute of India (WII) during 2014/2015. The workshop agenda could easily be adapted to the needs of users in other organizations and countries. Fi-nally, training and involvement of citizen scientists has been very successful as experienced in the case studies outside protected nature areas.
8.8 Repatriation of legacy collection data Making standardized legacy collection data accessible through GBIF addresses crucial infor-mation needs of biodiversity scientists, environmental managers and decision makers both in India and internationally. The minor data repatriation exercise at the Norwegian Natural History Museums does not result in large amounts of data, but more important, it provides capacity building to international legacy collections on how to mobilize collection samples through the GBIF data portal. In an international context, the added value of this exercise therefore lies more in its synergetic effect. Repatriation of data from large-scale legacy collections in other countries could take advantage of the Norwegian experiences. Globally, the biological legacy collections contain an estimated amount of 1.2 to 3 billion speci-mens (Duckworth et al. 1993, Ariño 2010). Only about 10 percent of these specimens have been captured in databases, and much less is captured as digital images. This means that 90 percent of the legacy collections are currently unavailable for use through the Internet. Making this avail-able manually will be very labour intensive. Using mass- digitizing techniques and partly auto-mated workflows through imaging techniques should however make the task feasible. Once dig-itized, the images have to be georeferenced. This can be done by computer-assisted techniques or with the help of gazetteer services (Hardisty et.al. 2013). Mobilizing legacy data can also be crowd-sourced by using volunteers, or outsourced to private companies. Distributed digitization infrastructures may become essential parts of most natural history collections. A major challenge, is that collections grow much faster than they are digitized. As private collections also must be digitized by their owners, this requires easy to use and inex-pensive tools that can be deployed at large scale. To effectively deliver this infrastructure service, digitization requires prioritization and its own funding channels (Hardisty et.al. 2013). It is estimated that around 6500 museums throughout the world house around 3 billion speci-mens (large and small holdings) most of which belong to developing nations such as India. Ac-cess to these specimens by Indian researchers, when needed most, is time consuming and ex-pensive due to the geographic distances, lack of communication infrastructure and financial sup-port. However, with the advent of information and communication technology, it is now feasible to access data on these specimens, if not the specimens themselves. In the last two decades, many museums in developed nations have digitized specimen collections that they are holding. With several ongoing global and regional biodiversity informatics initiatives, sharing data about these specimens with the countries of origin is gaining momentum. However, it is equally important that countries of origin too initiate appropriate steps, and share responsibility that would be complementary to these initiatives. A step in this direction would be to support repatriation of data of Indian origin from the Museums in different parts of the world. This will be achieved through competitive grants that will be applicable for Large Museum Col-lections and Small Museum Collections. This grant will facilitate an Indian researcher to visit the collection and take the help of the Museum to digitize and repatriate the collection data for spec-imens of Indian origin. The grant will partially cover cost of digitization in the Museum. Criteria for the selection of taxonomic groups and collections, priorities and user groups: Herbaria and natural history museums that set as their priority for digitizing data and making it available, recent taxonomic revisions, taxonomic groups that have been recently curated and the presence of

NINA Report 1079
91
research groups to work with the material. Institutions involved in developing information systems that provide their willingness to share data and information. A collection could be selected based on the taxonomic and regional scope of a collection. As for priority areas for repatriation of bio-diversity data, taxonomic data and conservation related data would be of great importance.
8.9 Added values towards the scientists and decision makers Open biodiversity data can be used to address a wide range of key scientific questions. Possible benefitting research fields, among many others, could be invasive alien species, ecosystem ser-vices, climate change, nature conservation and species distributions. Open data sharing may also support unforeseen spin- off effects for the public community in terms of Research- based policy development, Public awareness (citizen science), Educational values, Efficiency improvements in public management and Commercial interest and opportuni-ties. An open data policy improves access to public processes and thereby helps citizens gain better insight into the basis for decisions and prioritization, They will also get improved knowledge about how to assess political administrators, political processes and decisions. This may strengthen the public confidence in the public administration and government.

NINA Report 1079
92
9 Future collaboration and funding possibilities The results and achievements from this capacity-building project is definitely a good platform for further collaboration under the IPBES. This was discussed at a meeting in Trondheim in June 2014 with representatives from the Wildlife Institute of India (WII), the Norwegian Institute for Nature Research (NINA), The Norwegian Biodiversity Information Center (NBIC), the Nature History Museum at the University of Oslo (NMH), the Norwegian University of Science and Tech-nology (NTNU) and the Norwegian Environment Agency. The networking component of this meeting was successful and potential areas of collaboration were identified within the fields of Climate Change, Ecosystem Services, Marine Ecology, Be-havior studies of fish, Biodiversity informatics, Satellite telemetry, GIS, Remote sensing and de-velopment of impact assessment and planning tools for spatial decision support. The discussions held a specific focus on the general need for training in camera trapping, wildlife management and evaluation of management effectiveness of protected areas. NINA runs a pro-ject including these topics in Myanmar on behalf of the Norwegian Environment Agency. Such training activities may represent a potential collaboration platform and should be directly linked to the capacity building and training programs for students and researchers hosted by WII and NTNU. Possibilities for project collaboration within the IPBES- umbrella should be further investigated. There are four IPBES Task Forces on “Capacity Building”, “Knowledge foundation”, “Re-gional/Sub regional assessments”, and “Fast track thematic and Methodological assessments”. As a response to this, the project partners and the Norwegian University of Science and Tech-nology (NTNU) aim to establish a MoU under IPBES. Norway gives research cooperation high priority and India is a main cooperation country. The Norwegian Research Council (NRC) and the Indian Department of Science and Technology (DST) execute the Research and Technology Development (RTD) cooperation agreement be-tween India and Norway (2012-2015). Funding are currently available from the INDNOR Research programme98. INDNOR Calls in 2014 focus on clean energy, antibiotic resistance, polar research and geohazards. The Norwe-gian Embassy in India have some funds available for scientific cooperation, however, most of this funding is already tied to ongoing projects. NRC manages parts of these funds. Indian par-ticipation are eligible in projects funded by other Norwegian RTD programmes. In addition, co-operation with India is also possible in projects funded by the European Union Framework Pro-gramme for Research and Innovation (Horizon 2020)99, The European-Indian RDT collaboration (ERA-net)100, the New INDIGO101 and the following INNO INDIGO and INDIGO POLICY. Another programme, The Norwegian Programme for Capacity Development in Higher Education and Re-search for Development (NORHED)102 aims at strengthening the capacity of higher education institutions in low and middle income countries within Education and training; Health; Natural resource management; Climate change and environment; Democratic and economic govern-ance; Humanities, culture, media and communication; and Capacity development in South Su-dan. NRC are currently developing MoU`s with several Indian RTD funders such as the Ministry of Earth Sciences, the Indian Council of Medical Research and the Indian Council of Social Sci-ence Research.
98 http://www.forskningsradet.no/prognett-indnor/Home_page/1253954776512 99 http://ec.europa.eu/programmes/horizon2020/ 100 https://www.m-era.net/joint-call-2014 101 www.newindigo.eu 102 http://www.norad.no/en/support/norhed

NINA Report 1079
93
10 Conclusion and recommendations This capacity-building pilot project has clearly proved relevance in addressing the capacity build-ing needs identified by IPBES. As the project results show, there are great international syner-gies in capacity building of biodiversity informatics, camera trapping, data mobilization, data re-patriation, data management and data sharing policy improvement. In addition, the case studies have demonstrated how biodiversity informatics, camera trapping, data mobilization and access policies can contribute to improved decision making. This have led to a better understanding of camera trapping techniques, occupancy modelling, DNA- analysis, species distribution, human- wildlife conflicts, human disturbance effects on wild mammals, hab-itat recovery, tiger population management needs and investigation of poaching. Involvement of citizen scientists in the project “Carnivore outside parks” has demonstrated the importance of public awareness and the value of local engagement in surveying wild carnivores outside national parks. The mapping of national needs in India performed by WII, has identified that there are many challenges and constraints due to data management and logistics that has to be solved in order to motivate the data stakeholders to share their data in a national data management system. In addition, the survey of national needs also identified a great demand for a national Infrastruc-ture for systematic storage and easy retrieval of camera trap images and data in India. Such an Infrastructure has to be coordinated with the developments of the InBIF and aligned with the National Biodiversity Information Outlook (NBIO). The development of the camera trap image database and the web- portal for mobilizing camera trap data (both hosted by WII), is one im-portant step towards open biodiversity data sharing in a national data management system. We would like to recommend the strategies outlined in the Indian National Biodiversity Infor-mation Outlook (NBIO). NBIO is expected to influence free and open access to biodiversity data through the institutionalization of the National Biodiversity GRID (NBG) and InBIF, which will enrich the National Biodiversity Strategy and Action plan. The realization of NBG and InBIF will represent a major step in capacity building of Indian biodiversity informatics. The collaboration with GBIF has been of great importance for the project. Implementing their international standards, tools and services, ensures the project synergies of this capacity-build-ing project towards other context`s. Internationally there are large quantities of Indian specimens kept in foreign legacy collections. The project has performed a minor data repatriation exercise at Norwegian nature history muse-ums. This minor exercise did not result in large amounts of data, but more important, it provides capacity building to international legacy collections on how to mobilize collection samples through the GBIF data portal. In an international context, the added value of this exercise there-fore lies in its synergetic effect. Repatriation of data from large-scale legacy collections in other countries could take advantage of the Norwegian experiences. Open data sharing is very important. Academic accreditation of shared data is important for the researcher’s scientific career development. To ensure this, we recommend future projects to implement international data citation standards and best practices. Standards for Persistent Identifiers (PID)103 have reached a mature level of development, and the project recommends implementing the Digital Object Identifier (DOI)104, which became an ISO-standard (26324)105 in May 2012.
103 https://openwiki.uninett.no/norstore:roadmap:pid 104 http://www.iso.org/iso/catalogue_detail?csnumber=43506 105 http://www.iso.org/iso/home/news_index/news_archive/news.htm?refid=Ref1561

NINA Report 1079
94
In 2012, GBIF and PenSoft Publishers106 designed a workflow between the GBIF Integrated Publishing Toolkit (IPT)107 and several Pensoft journals to automatically export metadata into the form of a data paper manuscript, based on the Ecological Metadata Language (EML)108. The primary purpose of a Data Paper is to describe the dataset(s). A new journal called Biodiversity Data Journal109, dedicated to publishing data papers (Smith et al., 2013) is now online. We rec-ommend data publishing based on the Ecological Metadata Language (EML) protocol110 This project has focused on the identified priorities made by IPBES in their working plan for 2014-2018. Our Best Practice Guide (BPG), for publishing of biodiversity data associated with multi-media objects, provides great capacity building towards the IPBES context, in terms of imple-menting global standards, best practices and technical framework for data publishing. The guide will be further updated by GBIF in the future.
106 http://www.pensoft.net/ 107http://www.gbif.org/communications/news-and-events/showsingle/article/new-incentive-for-biodi-versity-data-publishing 108 http://knb.ecoinformatics.org/software/eml/ 109 http://biodiversitydatajournal.com/ 110 https://nis.lternet.edu/nis/schemas/eml/eml-2.1.0/docs/eml-2.1.0/index.html

NINA Report 1079
95
11 References Anonymous (2012) National Data Sharing and Accessibility Policy published in the Gazette of India
on 17th March 2012 by Ministry of Science and Technology Ariño A (2010). Approaches to estimating the universe of natural history collections data. Biodiver-
sity Informatics, 7:81–92. Athreya, V. and Surve, N. (2012). A report on camera trapping in the Junnar taluka, Pune district
submitted to the Maharashtra State Forest Department. Centre for Wildlife Studies. Barve, V. (2014). Discovering and Developing Primary Biodiversity Data from Social Networking
Sites: A Novel Approach. Ecological Informatics, 24, 194–199. doi:10.1016/j.ecoinf.2014.08.008 Beniston, M., Stoffel, M., Harding, R., Kernan, M., Ludwig, R., Moors, E., Samuels, P., Tockner, K.,
2012: Obstacles to data access for research related to climate and water: implications for sci-ence and EU policy-making. Environmental Science and Policy, 17, 41-48.
Carbone, C., and J. L. Gittleman. 2002. A common rule for the scaling of carnivore density. Science
295:2273–2276. Cardillo, M., Purvis, A., Sechrest, W., Gittleman, J.L., Bielby, J. & Mace, G.M. (2004) Human popu-
lation density and extinction risk in the world‟s carnivores. PLoS biology, 2, E197. Ceballos- Lascurain, H. (1996) Tourism, Ecotourism and Protected Areas. IUCN, Gland, Switzerland. Champion, H.G. & Seth, S.K. (1968) A revised survey of the forest types of India. Nueva, Delhi. Chavan, V., Gaikwad, J. and Mathur, V.B. National Biodiversity Information Outlook -NBIO 2012,
National Biodiversity Authority, Chennai. Chavan and Ingwersen. Towards a data publishing framework for primary biodiversity data: chal-
lenges and potentials for the biodiversity informatics community. BMC Bioinformatics 2009, 10 (Suppl 14): S2.
Chavan and Penev. The data paper: a mechanism to incentivize data publishing in biodiversity sci-
ence. BMC Bioinformatics 2011, 12 (Suppl 15): S2. Das, A., Krishnaswamy, J., Bawa, K.S., Kiran, M.C., Srinivas, V., Kumar, N.S. & Karanth, K.U.
(2006) Prioritisation of conservation areas in the Western Ghats, India. Biological Conservation, 133, 16-31.
Duckworth WD, Genoways HH and Rose CL (1993). Preserving Natural Science Collections:
Chronicle of our Environment Heritage. Washington, DC: National Institute for the Conservation of Cultural Property 140 pp.
Duckworth, J.W., Kumar, N.S., Anwarul Islam, Md., Hem Sagar Baral & Timmins, R.J. 2008.Axis axis. In: IUCN 2011. IUCN Red List of Threatened Species. Version 2011.2. <www.iucnredlist.org>. Downloaded on 23 May 2012. Edgaonkar, A. & Chellam, R. (1998) A preliminary study on the ecology of the leopard Pantherapar-
dus fusca in Sanjay Gandhi National Park, Maharashtra. Dehradun, India. GBIF. Best practice guide for ‘Data Discovery and Publishing Strategy and Action Plans’ version
1.0. Authored by Chavan VS, Sood RK, and AH Arino. 2010. Copenhagen.

NINA Report 1079
96
Gehrt, S. D., Riley, S. P. D. and B. L. Cypher. 2010. Urban Carnivores: Ecology, Conflict, and Conservation. The Johns Hopkins University Press. Baltimore, Maryland, USA.
Ghate, U., Joshi, N.V. & Gadgil, M. (1998). On the patterns of tree diversity in the Western Ghats of
India. Current Science, 75, 594–603. Hanssen, F., Heggberget, T., Bladt, J., Endresen, D., Forsius, M., Gudmundsson, G., Gärdenfors,
U., Heiðmarsson, S., Kindvall, O., Koch, W., Koviula, K., Laiho, E.L., Laine, K., Obst, M., Skov, F., Telenius, A., Vallan, N., Wasowicz, P. and Wremp, A. (2014). Nordic LifeWatch Collabora-tion. A joint initiative from Denmark, Iceland, Finland, Norway and Sweden. Unpublished final re-port.
Hardisty, A. and Roberts, D. (2013) A decadal view of biodiversity informatics: challenges and prior-
ities. BMC Ecology 13:16. http://www.biomedcentral.com/1472-6785/13/16 Harihar, A., Kurien, A. J., Pandav, B. & Goyal, S. P. (2007). Response of tiger population to habi-
tat, wild ungulate prey and human disturbance in Rajaji National Park, Uttarakhand, India. Final Technical Report, Wildlife Institute of India, Dehradun. Pp iii+165.
Harihar, A., B. Pandav & S. P. Goyal. 2009. Subsampling photographic capture-recapture data of
tigers (Panthera tigris) to minimize closure violation and improve estimate precision: as case study. Population Ecology 51:471–479.
Harihar, A., Pandav, B. & Goyal S. P. (2011). Responses of leopard Panthera pardus to the recov-
ery of a tiger Panthera tigris population. Journal of Applied Ecology, 48: 806-814. Harihar, A. & Pandav, B. (2012) Influence of connectivity, wild prey and disturbance on occupancy
of tigers in the human-dominated western Terai Arc Landscape. PloS one, 7, e40105. Harmsen, B. J., Foster, R. J., Silver, S., Ostro, L. & Doncaster, P. (2010). Differential Use of Trails
by Forest Mammals and the Implications for Camera-Trap Studies: A Case Study from Belize. BIOTROPICA 42(1): 126–133 2010.
Hiby L. , P. Lovell, N. Patil, NS Kumar, AM Gopalaswamy, KU Karanth. (2009) A tiger cannot
change its stripes: using a three-dimensional model to match images of living tigers and tiger skins. Biology Letters 5:3, 383-386
Hines, J. E. (2006). PRESENCE2- Software to estimate patch occupancy and related parameters.
USGS-PWRC.http://www.mbr-pwrc.usgs.gov/software/presence.html. Hines, J.E., Nichols, J.D., Royle, J.A., MacKenzie, D.I., Gopalaswamy, A.M., Kumar, N.S. & Karanth, K.U. (2010) Tigers on trails: occupancy modeling for cluster sampling. Ecological Applications, 20, 1456-1466. Intergovernmental Science-Policy Platform on Biodiversity and Ecosystem Services (IPBES). Work
programme for the period 2014–2018. 2014. IPBES: Decision -2/5: Work programme for the period 2014–2018. Johnsingh, A. J. T., S. N. Prasad, and S. P. Goyal. 1990. Conservation status of Chilla-Motichur
corridor for elephant movement in Rajaji-Corbett National Parks. Biological Conservation 51: 125-138.
Johnsingh, A. J. T., and A. S. Negi. 2003. Status of Tiger and Leopard in Rajaji – Corbett con-
servtion unit, Northern India. Biological Conservation 111:385-394. Karanth, K. U. 1995. Estimating tiger Panthera tigris populations from camera-trapping data using
capture-recapture models. Biological Conservation 71:333-338

NINA Report 1079
97
Karanth, K. U., and J. D. Nichols. 1998. Estimation of tiger densities using Photographic captures and recaptures. Ecology (Washington D C) 79: 2852-2862.
Karanth, K.U. & Nichols, J.D. (2002). Monitoring tiger densities and their prey: a manual for re-
searchers, managers and conservationists in tropical Asia. Centre for Wildlife Studies, Banga-lore, India: Xv, 193pp
Karanth, K. U., J. D. Nichols, N. S. Kumar, W. A. Link, and J. E. Hines. 2004. Tigers and their prey:
Predicting carnivore densities from prey abundance. Proceedings of the National Academy of Sciences of the United States of America 101:4854-4858.
Karanth, K.K., Nichols, J.D., Hines, J.E., Karanth, K.U. & Christensen, N.L. (2009) Patterns and de-
terminants of mammal species occurrence in India. Journal of Applied Ecology, 46, 1189- 1200. Long, R.A.; Donovan, T.M.; Mackay, P.; Zielinski, W.J. & Buzas, J.S. (2007). Comparing scat detec-
tion dogs, cameras and hair snares for surveying carnivores. Journal of Wildlife Management 71: 2018 – 2025
MacKenzie, D.I., Nichols, J.D., Lachman, G.B., Droege, S., Andrew Royle, J. & Langtimm, C.a.
(2002) Estimating site cccupancy rates when detection probabilities are less than one. Ecology, 83, 2248-2255.
McDougal, C. 1977. The Face of the Tiger. Rivington Books. London. United Kingdom. Meek, P.D.; Ballard, G. & Fleming, P. (2012). Introduction to camera Trapping for Wildlife Surveys
in Australia. PestSmart Toolkit Publications, Invasive Animals Co-operative Research Centre, Canberra, Australia.
Morris, Robert, Annette Olson, Eamonn O Tuama, Greg Riccardi, Greg Whitbread, Gregor Hage-dorn, Ivan Teage, et al. 2008. “Recommendations of the GBIF Multimedia Resources Task Group.” Global Biodiversity. Copenhagen.
Morris, R.J.; Barve, V.; Carausu, M.; Chavan, V.S.; Cuadra, J.; Freeland, G.H.; Hagedorn, G.;
Leary, P.; Mozzherin, D.; Olson, A.; Riccardi, I.T., a& Whitbread, G. 2013. Discovery and Pub-lishing of Primary Biodiversity Data associated with Multimedia Resources: The Audubon Core Strategies and approaches. Biodiversity Informatics Vol. 8 no. 2(2013) pp. 185-197.
National Biodiversity Information Outlook. Prepared by the WII for The Ministry of Environment, For-
ests and Climate Change (MOECC), Government of India and the National Biodiversity Authority (NBA), 2012
O’Connell, A.F. & Bailey, L.L. (2011). Inference for occupancy and occupancy dynamics. In: O-Con-
nell, A.F.; Nichols, J.D. & Karanth, K.U. (eds). camera Traps in Animal Ecology Methods and Analyses. Springer-Verlag, New York. pp 191 – 206
Oliviera-Santos, L.G.R.; Tortato, M.A. & Graipel, M.E. (2008). Activity patterns of Atlantic Forest small arboreal mammals as revealed by camera traps. Journal of Tropical Ecology 24: 563 – 567.
Otis D.L., K.P. Burnham, G.C.White, and D.R. Anderson. 1978. Statistical inference from capture data of closed populations. Wildlife Monographs 2:1-13.
Pascal, J.P. (1988). Wet Evergreen Forests of Western Ghats: Ecology, Structure, Floristic Compo-
sition and Succession. Pondicherry: Insitut Francais Pondicherry. Project Tiger. 2005. Joining the Dots: The Report of the Tiger Task Force. Union Ministry of Envi-
ronment and Forests. New Delhi, India.

NINA Report 1079
98
Punjabi, G. & Edgaonkar, A. (2012) Ecological and Anthropogenic Correlates influencing Large Car-nivore Occupancy and Distribution in the Sahyadri – Konkan Corridor: A report Submitted to Ma-harashtra State Forest Department.
Qureshi, Q., R. Gopal, S. Kyatham, S. Basu, A. Mitra, and Y. V. Jhala. 2006. Evaluating tiger habi-
tat at the tehsil level. TR-06/001, Project tiger directorate, Govt. of India and Wildlife Insti-tute of India, India.
Rayar and Killivalavan (2010) Assessing potential tiger habitats in Cauvery Wildlife Sanctuary, Karnataka using occupancy modelling approaches. , 1-56. Rexstad, E. A., and K. P. Burnham. 1991. User's guide for interactive program CAPTURE. Colo-
rado Cooperative Wildlife Research Unit, Colorado State University, Fort Collins Co. Colora-do.USA.
Royle, J.A. & Nichols, J.D. (2003) Estimating abundance from repeated presence-absence data or
point counts. Ecology, 84, 777-790. Rovero, F. & De Luca, D.W. (2007). Checklist of mammals of the Udzungwa Mountains of Tanza-
nia. Mammalia 70: 47 – 55 Rovero, F.; Tobler, M. & Sanderson, J. (2010). Camera trapping for inventorying terrestrial verte-
brates. In: Eymann, J.; Degreef, J.; Höuser, C; Monje, J.C.; Samyn, Y. & Van den Spiegel, D. (eds). Manual on field recording techniques and protocols for All Taxa Biodiversity Inventories and Monitoring. Abc Taxa Vol.8 (part 1): 100 – 128.
Schaller, G.B. 1967. The deer and the tiger. University of Chicago Press. Chicago, Illinois.USA. Saloni, S. 1996. People’s involvement in protecting areas: experiences from abroad and lessons for
India. Pages 247-260 in A. Kothari, N. Singh and S. Saloni, editors .People and Protected Areas Towards Participatory Conservation in India. SAGE Publications. Delhi. India.
Sanderson, J.G. (2004). Camera Trapping Monitoring Protocol. In: TEAM Network camera Trapping
Monitoring Protocol Implementation Manual Version 2, Tropical Ecology Assessment and Moni-toring Network, Centre for Applied Biological Studies, Virginia, USA.
Schipper, J., Chanson, J.S., Chiozza, F., Cox, N.A., Hoffmann, M. & Katariya, V. (2008) The status
of the world‟s land and marine mammals: Diversity, threat and Knowledge. Science, 322, 225-230.
Schmidt-Kloiber, A., Moe, S.J., Dudley, B.J., Strackbein, J., and Vogl, R. (2013). The WISER
metadatabase: the key to more than 100 ecological datasets from European rivers, lakes and coastal waters. Hydrobiologia. doi:10.1007/s10750- 012-1295-6.
Seidensticker, J., S. Christie, and P. Jackson. 1999. Riding the tiger. Tiger conservation in a hu-
man-dominated landscape. Cambridge University Press. Cambridge. United Kingdom. Smith, J. L. D., S. C. Ahearn, and C. McDougal. 1998. Landscape analysis of tiger distribution and
habitat quality in Nepal. Conservation Biology 12: 1338–1346.
Smith, V., Georgiev, T., Stoev, P., Biserkov, J., Miller, J., Livermore, L., Baker, E., Mietchen, D., Couvreur, T.L.P., Mueller, G., Dikow, T., Helgen, K.M., Frank, J., Agosti, D., Roberts, D., and
Penev, L. (2013). Beyond dead trees: integrating the scientific process in the Biodiversity Data Jour-nal. Biodiversity Data Journal 1: e995. DOI: 10.3897/BDJ.1.e995
The Information Technology Act, 2000 (No. 21 OF 2000), The Gazette of India Extraordinary, Reg-
istered No – DL-33004/2000 (http://rti.gov.in)

NINA Report 1079
99
Timmins, R.J., Steinmetz, R., Sagar Baral, H., Samba Kumar, N., Duckworth, J.W., Anwarul Islam, Md., Giman, B., Hedges, S., Lynam, A.J., Fellowes, J., Chan, B.P.L. & Evans, T. 2008. Rusa unicolor. In: IUCN 2011. IUCN Red List of Threatened Species. Version
2011.2. www.iucnredlist.org. Downloaded on 23 May 2012.
Trolle, M. & Kery, M. (2003). Ocelot density estimation in the Pantanal using capture-recapture
analysis of camera-trapping data. Journal of Mammalogy 84:607-614. Trolle M. & Kery M. 2005. — Camera-trap study of ocelot and other secretive mammals in the northern Pantanal. Mammalia 69 (3-4) : 405-412. UNEP World Conservation Monitoring Center. Scoping paper prepared at the UNEP World Conser-
vation Monitoring Centre for the Norwegian Directorate for Nature Management. 2011. UNESCO 2012, The World Heritage list
The United Nations Declaration on Environment and Development (UN, Rio de Janeiro,
June 1992) White, G. C., D. R. Anderson, K. P. Burnham, and D. L. Otis. 1982. Capture recapture and remov-al
methods for sampling closed populations. LA-8787-NERP, Los Alamos Nat. Lab., Los Ala-mos, New Mexico, USA.
Wikramanayake, E. D., E. Dinerstein, J. G. Robinson, K. U. Karanth, A. R. Rabinowitz, D. Olson, T.
Matthew, P. Hedao, M. Connor, G. Hemley, and D. Bolze. 1998. An ecology based approach to setting priorities for conservation of tigers, Panthera tigris, in the wild. Conservational Biology 12.

NINA Report 1079
100
12 Annexes
12.1 The Audubon Core Template Modified Audubon Core Template: Audubon Core is the extension of Darwin’s core. We have combined few fields of Darwin’s core field. The fields adapted from Darwin’s core are: Decimal Latitude Decimal Longitude Flank Individual ID Individual Identified By Pattern Identification Method Identification Rating Following are the few fields we have added for our convenience: CTP State/district CamID Capture number a/b Rest of the fields are from Audubon Core Template:
Modified Audubon Core Template
Serial
num-
ber
Field name Description Source Value
1 CTP Camera trap photograph Created at
WII
Optional and
Filled
2 State/district State and district code as per Census of India.
Created at
WII
Optional and
Filled
3 Year Year in which photograph was captured
Created at
WII
Optional and
Filled
4 CamID Camera trap ID with A/B de-noting one of paired camera traps
Created at
WII
Optional and
Filled
5 Capture number sequential photo-capture number
Created at
WII
Optional and
Filled
6 a/b a/b/c distinguishes between multiple objects in the same photograph
Created at
WII
Optional and
Filled
7 identifier An arbitrary code that is unique for the resource, with the resource being either a provider, collection, or media item.
Audubon
Core
Mandatory

NINA Report 1079
101
8 type http://dublincore.org/docu-ments/dcmi-type-vocabulary/ may be used. Recommended terms are Collection, StillImage, Sound, Mov-ingImage, Interac-tiveResource, Text. Also rec-ommended are PanAndZoo-mImage , 3DStillImage, and 3DMovingImage.
Audubon
Core
Mandatory
9 subtype Any of Drawing, Painting, Logo, Icon, Illustration, Graphic, Photograph, Anima-tion, Film, SlideShow, Design-Plan, Diagram, Map, Musical-Notation, IdentificationKey, ScannedText, RecordedText, RecordedOrganism, Taxon-Page, MultimediaLearn-ingObject, VirtualRealityEnvi-ronment, GlossaryPage. These values may either be used in their literal form, or with their full namespace, e. g. http://rs.tdwg.org/ac/terms/identificationKey
Audubon
Core
Optional and
Filled
10 title Concise title, name, or brief descriptive label of institution, resource collection, or individ-ual resource. This field should include the complete title with all the subtitles, if any.
Audubon
Core
Mandatory
11 modified Date that the media resource was altered. The date and time must comply with the World Wide Web Consortium (W3C) datetime practice, which requires that date and time representation corre-spond to ISO 8601:1998, but with year fields always com-prising 4 digits. This makes datetime records compliant with 8601:2004. AC datetime values may also follow 8601:2004 for ranges by sep-arating two IS0 8601 datetime fields by a solidus ("forward slash", '/'). See also the wik-ipedia IS0 8601 entry for fur-ther explanation and exam-ples.
Audubon
Core
Optional and
Filled
12 MetadataDate Point in time recording when the last modification to metadata (not necessarily the
Audubon
Core
Optional and
Filled

NINA Report 1079
102
media object itself) occurred. The date and time must com-ply with the World Wide Web Consortium (W3C) datetime practice, which requires that date and time representation correspond to ISO 8601:1998, but with year fields always comprising 4 digits. This makes datetime records compliant with 8601:2004. AC datetime val-ues may also follow 8601:2004 for ranges by sep-arating two IS0 8601 datetime fields by a solidus ("forward slash", '/'). See also the wik-ipedia IS0 8601 entry for fur-ther explanation and exam-ples.
13 metadataLanguage Language of description and other metadata (but not nec-essarily of the image itself) represented in ISO639-1 or -3.
Audubon
Core
Mandatory
14 providerManagedID A free-form identifier (a simple number, an alphanumeric code, a URL, etc.) that is unique and meaningful pri-marily for the data provider.
Audubon
Core
Optional and
Filled
15 Rating A rating of the media re-sources, provided by users or editors, with -1 defining “re-jected”, “0” defining “unrated”, and “1” (worst) to “5” (best).
Audubon
Core
Optional and
Filled
16 comments Any comment provided on the media resource, as free-form text. Best practice would also identify the commenter.
Audubon
Core
Optional and
Filled
17 reviewer If present, then resource is peer-reviewed, even if Re-viewers Comments are lack-ing. The notation of whether an expert in the subject fea-tured in the media has re-viewed the media item or col-lection and approved its metadata description. Must display a name or the literal "anonymous" (= anonymously reviewed).
Audubon
Core
Optional and
Filled
18 reviewerComments Any comment provided by a reviewer with expertise in the subject, as free-form text.
Audubon
Core
Optional and
Filled

NINA Report 1079
103
19 available The date (often a range) that the resource became or will become available. The date and time must comply with the World Wide Web Consortium (W3C) datetime practice, which requires that date and time representation corre-spond to ISO 8601:1998, but with year fields always com-prising 4 digits. This makes datetime records compliant with 8601:2004. AC datetime values may also follow 8601:2004 for ranges by sep-arating two IS0 8601 datetime fields by a solidus ("forward slash", '/'). See also the wik-ipedia IS0 8601 entry for
Audubon
Core
Optional and
Filled
20 rights Information about rights held in and over the resource. A full-text, readable copyright statement, as required by the national legislation of the cop-yright holder. On collections, this applies to all contained objects, unless the object it-self has a different statement. Examples: “Copyright XY 2008, all rights reserved”, “© 2008 XY Museum” , "Public Domain.", "Copyright un-known" Do not place just the name of the copyright holder(s) here! That belongs in a list in the xmpRights: Owner field, which should be supplied if dcterms:rights is not 'Public Domain', appropri-ate only if the resource is known to be not under copy-right.
Audubon
Core
Mandatory
21 Owner A list of the names of the own-ers of the copyright. 'Un-known' is an acceptable value, but 'Public Domain' is not. See the Comments below for this term.
Audubon
Core
Mandatory
22 UsageTerms The license statement defin-ing how resources may be used. Information on a collec-tion applies to all contained objects unless the object has a different statement.
Audubon
Core
Optional and
Filled

NINA Report 1079
104
23 WebStatement A URL defining or further elaborating on the license statement (e. g., a web page explaining the precise terms of use).
Audubon
Core
Optional
24 licenseLogoURL A URL providing access to a logo that symbolizes the Li-cense.
Audubon
Core
Optional
25 CreditLine Free text for "please cite this as…"
Audubon
Core
Optional
26 attributionLogoURL The URL of icon or logo image to appear in source attribu-tion.
Audubon
Core
Optional
27 attributionLinkURL The URL where information about ownership, attribution, etc. of the resource may be found.
Audubon
Core
Optional
28 source An identifiable source from which the described re-sources was derived.
Audubon
Core
Optional and
Filled
29 creator The person or organization responsible for creating the media resource.
Audubon
Core
Optional and
Filled
30 provider Person or organization re-sponsible for presenting the media resource. If no sepa-rate Metadata Provider is at-tributed, this attributes also the metadata.
Audubon
Core
Optional and
Filled
31 metadataProvider Person or organization origi-nally responsible for providing the resource metadata rec-ord.
Audubon
Core
Optional and
Filled
32 metadataCreator Person or organization origi-nally creating the resource metadata record.
Audubon
Core
Optional and
Filled
33 description Description of collection or in-dividual resource, containing the Who, What, When, Where and Why as free-form text. This normative document is silent on the nature of format-ting in the text. It is the role of implementers of an AC con-crete representation (e.g. an XML Schema, an RDF repre-sentation, etc.) to decide and document how formatting ad-vice will be represented in De-scriptions serialized accord-ing to such representations.
Audubon
Core
Optional and
Filled
34 caption As alternative or in addition to description, a caption is free-
Audubon
Core
Optional and
Filled

NINA Report 1079
105
form text to be displayed to-gether with (rather than in-stead of) a resource that is suitable for captions (espe-cially images).
35 language Language(s) of resource itself represented in ISO639-1 or -3
Audubon
Core
Optional and
Filled
36 LocationShown The location that is shown or the place of the media con-tent, irrespective of the loca-tion from which the resource has been created.
Audubon
Core
Optional and
Filled
37 WorldRegion Name of a world region in some high level classification, such as names for continents, waterbodies, or island groups, whichever is most appropri-ate. The terms preferably are derived from a controlled vo-cabulary (to be defined).
Audubon
Core
Optional and
Filled
38 CountryCode The geographic location of the specific entity(ies) docu-mented by the media item, ex-pressed through a con-strained vocabulary of coun-tries using 2-letter ISO coun-try code (e. g. "it, si").
Audubon
Core
Optional and
Filled
39 CountryName This field can be free text, but where possible, the use of http://iptc.org/std/Iptc4xmpExt/1.0/xmlns/CountryCode is preferred.
Audubon
Core
Optional and
Filled
40 ProvinceState Optionally, the geographic unit immediately below the country level (individual states in federal countries, prov-inces, or other administrative units) in which the subject of the media resource (e. g., species, habitats, or events) were located (if such infor-mation is available in sepa-rate fields).
Audubon
Core
Optional and
Filled
41 City Optionally, the name of a city or place commonly found in gazetteers (such as a moun-tain or national park) in which the subjects (e. g., species, habitats, or events) were lo-cated.
Audubon
Core
Optional and
Filled
42 Sublocation Free-form text location details of the location of the subjects, down to the village, forest, or geographic feature etc., be-low the city or other place
Audubon
Core
Optional and
Filled

NINA Report 1079
106
name, especially information that could not be found in a gazetteer.
43 decimalLatitude Latitude of the location of the camera trap image in degree decimal
Darwin Core Optional and
Filled
44 decimalLongitude Longitude of the location of the camera trap image in de-gree decimal
Darwin Core Optional and
Filled
45 temporal The coverage (extent or scope) of the content of the resource. Temporal coverage will typically include temporal period (a period label, date, or date range) to which the sub-jects of the media or media collection relate. If dates are mentioned, they should follow ISO 8601. When the resource is a Collection, this refers to the temporal coverage of the collection.
Audubon
Core
Optional and
Filled
46 CreateDate The date of the creation for the original resource from which the digital media was derived or created. The date and time must comply with the World Wide Web Consortium (W3C) datetime practice, which requires that date and time representation corre-spond to ISO 8601:1998, but with year fields always com-prising 4 digits. This makes datetime records compliant with 8601:2004. AC datetime values may also follow 8601:2004 for ranges by sep-arating two IS0 8601 datetime fields by a solidus ("forward slash", '/'). See also the wik-ipedia IS0 8601 entry for fur-ther explanation and exam-ples.
Audubon
Core
Optional and
Filled
47 timeOfDay Free text information beyond exact clock times.
Audubon
Core
Optional and
Filled
48 physicalSetting The Setting of the content represented in a medium like images, sounds, movies. Constrained vocabulary of: "Natural" = Unmodified object in a natural setting of unmodi-fied object (e. g. living organ-isms in their natural environ-
Audubon
Core
Optional and
Filled

NINA Report 1079
107
ment); "Artificial" = Unmodi-fied object in artificial setting of (e. g. living organisms in ar-tificial environment: Zoo, Gar-den, Greenhouse, Labora-tory; photographic back-ground or background sound suppression). "Irrelevant" (e. g. background of Museum shots).
49 CVterm Controlled vocabulary of sub-jects to support broad classifi-cation of media items. Terms from various controlled vo-cabularies may be used. AC-recommended vocabularies are preferred and may be un-qualified literals (without a URI). For terms from other vo-cabularies either a precise URI should be used, or, when providing unqualified terms, to provide the source vocabulary in Subject Category Vocabu-lary.
Audubon
Core
Optional and
Filled
50 subjectCategoryVocabulary Any vocabulary or formal classification from which terms in Subject Category have been drawn
Audubon
Core
Optional and
Filled
51 tag General keywords or tags. Audubon
Core
Optional and
Filled
52 taxonCoverage A higher taxon (e. g., a genus, family, or order) at the level of the genus or higher, that co-vers all taxa that are the pri-mary subject of the resource (which may be a media item or a collection).
Audubon
Core
Optional and
Filled
53 scientificName Taxon names of organisms represented in the media re-source (with date and author-ship information if available) of the lowest level taxonomic rank that can be applied.
Audubon
Core
Optional and
Filled
54 identificationQualifier A brief phrase or a standard abbreviation ("cf. genus", "cf. species", "cf. var.", "aff.spe-cies", etc.) to express the de-terminer's doubts with respect to a specified taxonomic rank about the identification given in Scientific Name.
Audubon
Core
Optional and
Filled
55 vernacularName Common (= vernacular) names of the subject in one or several languages. The ISO
Audubon
Core
Optional and
Filled

NINA Report 1079
108
language name should be given in parentheses after the name if not all names are in Metadata Language.
56 nameAccordingTo The taxonomic authority used to apply the name to the taxon, e. g., a book or web service from which the name comes from.
Audubon
Core
Optional and
Filled
57 taxonID Equivalent to Scientific Name, but using GUIDs such as http URIs or LSIDs to refer to the taxon names or concepts.
Audubon
Core
Optional and
Filled
58 scientificNameSynonym One or several scientific names that are synonyms to the Scientific Name may be provided here.
Audubon
Core
Optional and
Filled
59 identifiedBy The name(s) of the person(s) who applied the Scientific Name to the sample.
Audubon
Core
Optional and
Filled
60 dateIdentified The date on which the per-son(s) given under Identfied By applied a Scientific Name to the resource.
Audubon
Core
Optional and
Filled
61 taxonCount An exact or estimated number of taxa at the lowest applica-ble taxon rank (usually spe-cies or infraspecific) repre-sented by the media resource (item or collection).
Audubon
Core
Optional and
Filled
62 subjectPart The portion of the organism, environment, etc. shown or particularly well illustrated.
Audubon
Core
Optional and
Filled
63 Flank Specific flank (right/left/front/back) of the subject represented in the media resource with respect to the acquisition device.
Darwin Core Optional and
Filled
64 sex A description of the sex of any organisms featured within the media, when relevant to the subject of the media, e. g., male, female, hermaphrodite, dioecious.
Audubon
Core
Optional and
Filled
65 lifeStage A description of the life-cycle stage of any organisms fea-tured within the media, when relevant to the subject of the media, e. g., larvae, juvenile, adult.
Audubon
Core
Optional and
Filled
66 subjectOrientation Specific orientiation (= direc-tion, view angle) of the subject represented in the media re-source with respect to the ac-quisition device.
Audubon
Core
Optional and
Filled
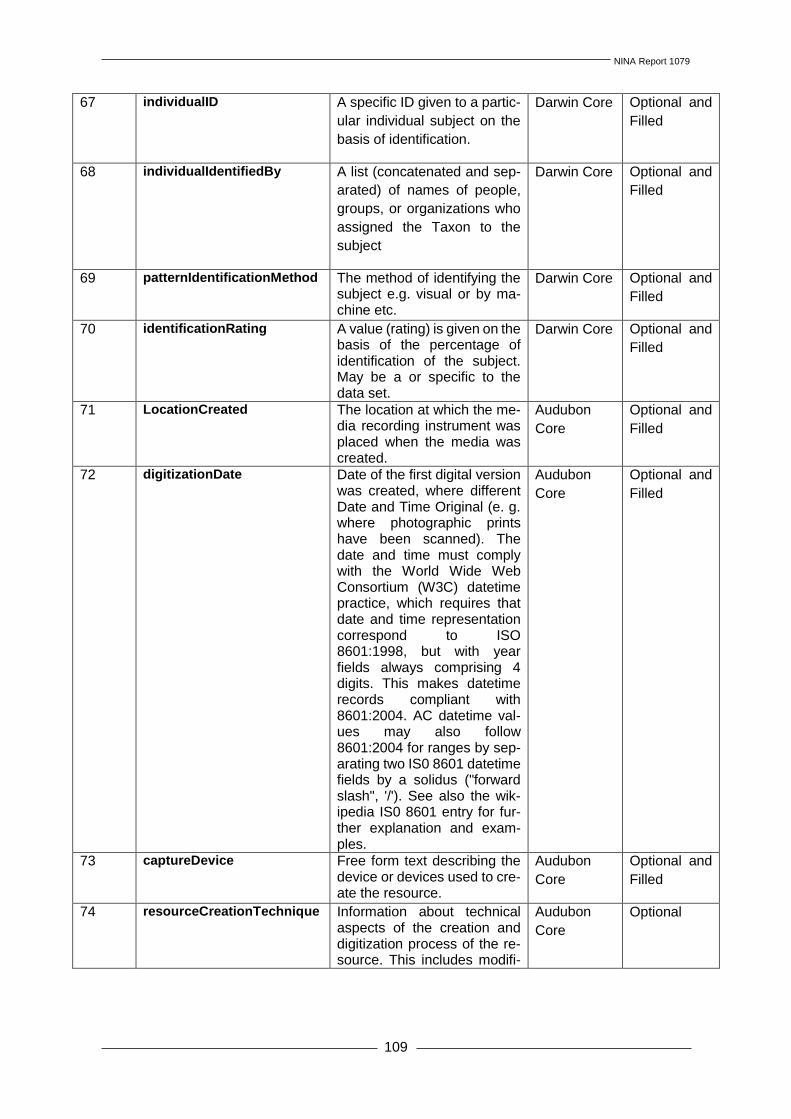
NINA Report 1079
109
67 individualID A specific ID given to a partic-
ular individual subject on the
basis of identification.
Darwin Core Optional and
Filled
68 individualIdentifiedBy A list (concatenated and sep-
arated) of names of people,
groups, or organizations who
assigned the Taxon to the
subject
Darwin Core Optional and
Filled
69 patternIdentificationMethod The method of identifying the subject e.g. visual or by ma-chine etc.
Darwin Core Optional and
Filled
70 identificationRating A value (rating) is given on the basis of the percentage of identification of the subject. May be a or specific to the data set.
Darwin Core Optional and
Filled
71 LocationCreated The location at which the me-dia recording instrument was placed when the media was created.
Audubon
Core
Optional and
Filled
72 digitizationDate Date of the first digital version was created, where different Date and Time Original (e. g. where photographic prints have been scanned). The date and time must comply with the World Wide Web Consortium (W3C) datetime practice, which requires that date and time representation correspond to ISO 8601:1998, but with year fields always comprising 4 digits. This makes datetime records compliant with 8601:2004. AC datetime val-ues may also follow 8601:2004 for ranges by sep-arating two IS0 8601 datetime fields by a solidus ("forward slash", '/'). See also the wik-ipedia IS0 8601 entry for fur-ther explanation and exam-ples.
Audubon
Core
Optional and
Filled
73 captureDevice Free form text describing the device or devices used to cre-ate the resource.
Audubon
Core
Optional and
Filled
74 resourceCreationTechnique Information about technical aspects of the creation and digitization process of the re-source. This includes modifi-
Audubon
Core
Optional

NINA Report 1079
110
cation steps ("retouching") af-ter the initial resource cap-ture.
75 thumbnailAccessURI URI of the resource itself. If this resource can be acquired by an http request, its http URL should be given. If not, but it has some URI in another URI scheme, that may be given here.
Audubon
Core
Optional
76 thumbnailFormat The technical format of the re-source (file format or physical medium).
Audubon
Core
Optional
77 thumbnailQualityVariant What this ServiceAccessPoint provides. Suggested values are "Thumbnail", "Trailer", "Lower Quality", "Medium Quality", "Good Quality", "Best Quality", "Offline"
Audubon
Core
Optional
78 thumbnailExtent The size, dimensions, or du-ration of the variant of the me-dia resource.
Audubon
Core
Optional
79 thumbnailFurtherInfor-mationURL
The URL of a Web site that provides additional infor-mation about (this version of) the media resource.
Audubon
Core
Optional
80 lowerQualityAccessURI URI of the resource itself. If this resource can be acquired by an http request, its http URL should be given. If not, but it has some URI in another URI scheme, that may be given here.
Audubon
Core
Optional
81 lowerQualityFormat The technical format of the re-source (file format or physical medium).
Audubon
Core
Optional
82 lowerQualityVariant What this ServiceAccessPoint provides. Suggested values are "Thumbnail", "Trailer", "Lower Quality", "Medium Quality", "Good Quality", "Best Quality", "Offline"
Audubon
Core
Optional
83 lowerQualityExtent The size, dimensions, or du-ration of the variant of the me-dia resource.
Audubon
Core
Optional
84 lowerQualityFurtherInfor-mationURL
The URL of a Web site that provides additional infor-mation about (this version of) the media resource.
Audubon
Core
Optional
85 mediumQualityAccessURI URI of the resource itself. If this resource can be acquired by an http request, its http URL should be given. If not, but it has some URI in another
Audubon
Core
Optional

NINA Report 1079
111
URI scheme, that may be given here.
86 mediumQualityFormat The technical format of the re-source (file format or physical medium).
Audubon
Core
Optional
87 mediumQualityVariant What this ServiceAccessPoint provides. Suggested values are "Thumbnail", "Trailer", "Lower Quality", "Medium Quality", "Good Quality", "Best Quality", "Offline"
Audubon
Core
Optional
88 mediumQualityExtent The size, dimensions, or du-ration of the variant of the me-dia resource.
Audubon
Core
Optional
89 mediumQualityFurtherInfor-mationURL
The URL of a Web site that provides additional infor-mation about (this version of) the media resource.
Audubon
Core
Optional
90 goodQualityAccessURI URI of the resource itself. If this resource can be acquired by an http request, its http URL should be given. If not, but it has some URI in another URI scheme, that may be given here.
Audubon
Core
Optional
91 goodQualityFormat The technical format of the re-source (file format or physical medium).
Audubon
Core
Optional
92 goodQualityVariant What this ServiceAccessPoint provides. Suggested values are "Thumbnail", "Trailer", "Lower Quality", "Medium Quality", "Good Quality", "Best Quality", "Offline"
Audubon
Core
Optional
93 goodQualityExtent The size, dimensions, or du-ration of the variant of the me-dia resource.
Audubon
Core
Optional
94 goodQualityFurtherInfor-mationURL
The URL of a Web site that provides additional infor-mation about (this version of) the media resource.
Audubon
Core
Optional
95 bestQualityAccessURI URI of the resource itself. If this resource can be acquired by an http request, its http URL should be given. If not, but it has some URI in another URI scheme, that may be given here.
Audubon
Core
Optional
96 bestQualityFormat The technical format of the re-source (file format or physical medium).
Audubon
Core
Optional
97 bestQualityVariant What this ServiceAccessPoint provides. Suggested values are "Thumbnail", "Trailer", "Lower Quality", "Medium
Audubon
Core
Optional

NINA Report 1079
112
Quality", "Good Quality", "Best Quality", "Offline"
98 bestQualityExtent The size, dimensions, or du-ration of the variant of the me-dia resource.
Audubon
Core
Optional
99 bestQualityFurtherInfor-mationURL
The URL of a Web site that provides additional infor-mation about (this version of) the media resource.
Audubon
Core
Optional
100 licensingException The licensing statement for this variant of the media re-source if different from that given in the “License State-ment” property of the re-source.
Audubon
Core
Optional
101 serviceExpectation A term that describes what service expectations users may have of the accessURL. Recommended terms include online (denotes that the URL is expected to deliver the re-source), authenticate (de-notes that the URL delivers a login or other authentication interface requiring completion before delivery of the re-source) published(non digital) (denotes that the URL is the identifier of a non-digital pub-lished work, for example a doi.) Communities should de-velop their own controlled vo-cabularies for Service Expec-tations.
Audubon
Core
Optional
102 variantDescription Text that describes this Ser-vice Access Point variant.
Audubon
Core
Optional
103 IDofContainingCollection If the resource is contained in a Collection, this field identi-fies that Collection uniquely. Its form is not specified by this normative document, but is left to implementers of spe-cific implementations.
Audubon
Core
Optional
104 relatedResourceID Resource related in ways not specified through a collection.
Before-after images Time-lapse series Different orientations/an-gles of view
Audubon
Core
Optional
105 providerID A globally unique ID of the provider of the current AC metadata record.
Audubon
Core
Optional

NINA Report 1079
113
106 derivedFrom A reference to an original re-source from which the current one is derived.
Audubon
Core
Optional
107 associatedSpecimenRefer-ence
A reference to a specimen as-sociated with this resource.
Audubon
Core
Optional
108 associatedObservationRef-erence
A reference to an observation associated with this resource.
Audubon
Core
Optional

NINA Report 1079
114
12.2 Poster at the GBIF Governing Board meeting, Sept. 17-19 2012 (Norway)

NINA Report 1079
115
12.3 Poster at the Conference of the Parties (COP), Oct. 8-19 2012 (India)


ISSN: 1504-3312 ISBN: 978-82-426-2396-6
801