platform support recommendations 2q 2014
DESCRIPTION
On a quarterly basis, Magnani Caruso Dutton tracks the use of stable releases of browsers, operating systems, and devices for the general U.S. population, identifying the current share of the user base and potential velocity for large-scale adoption of new and obsolesce of old platforms.TRANSCRIPT
1
MCD
Platform Support Recommendations
2014 Second Quarter
2
Quarterly, Magnani Caruso Dutton tracks
the use of stable releases of browsers,
operating systems, and devices for the
general U.S. population, identifying the
current share of the user base and
potential velocity for large-scale adoption
of new and obsolesce of old platforms.
Overview

3
The following table is our recommended
platform support policy. Both velocity
and lifecycle are factored. Platforms that
fit into these categories change
regularly, some faster than others.
Full and partial support types are defined
after the table.
Overview

4
D ŽĚĞƌŶ ϵϰй
Upcoming <=2%
Experimental <=1%
Antiquated <=1%
Aging <=2%
Might not function or display properly; no longer supported
Full core functionality with some display errors acceptable.
Full functionality and error-free display. Full core functionality with minor display & formatting errors acceptable.
Might not function or display properly; future support may be needed.
None Partial Full Partial None
Support Policy

5
Full Functionality
All features and functions display and
operates as designed and specified.
Support Type Definitions
6
Partial Functionality
Core functionality works correctly but
may have some display errors.
Functional errors may occur but will not
impinge on core functionality. Special
features, overlays or advanced
animation, may not function properly or
at all.
Support Type Definitions

7
As a new stable release of a browser, device, or
operating system moves into the Upcoming
category, it does not necessarily displace any
other supported platform. Conversely, a platform
in the Experimental category may never move
into the mainstream environment. We also
monitor certain platforms that have been “stuck”
in the Experimental group for some time but have
a high potential to suddenly break out and
become an Upcoming or even Modern platform.
A Note on Support Type Definitions

8
The recommendations outlined in this
report are based on the general U.S.
consumer market; with a couple of noted
exceptions. An individual website’s
platform support should be identified
based on its measurement analytics and
inform the design and development
specifications throughout the project.
Recommendations Summary

9
The following table summarizes the
browser by operating system support
recommendations as of June 2014.
Supporting documentation is provided
later.
Browser Support Recommendations

10
Win XP Win 7 Win 8 Mac 10.9 iOS Android
IE 8.x Partial Partial
IE 9.x Partial
IE 10.x Partial Partial
IE 11.x Full Full
Firefox 28.x Partial Partial Partial
Firefox 29.x Full Full Full Full
Firefox 30.x Full Full Full Full
Chrome 35 Full Full Full Full
Safari 7 Full
Mobile Safari Full
Android Browser Full
Mobile Chrome Full
Browser Support Recommendations

11
• Add full support of Firefox 29 and 30 to Win XP, Win 7, and Mac 10.9• Add partial support of Firefox 28 on Win XP, Win 7, and Mac 10.9• Drop support for versions of Firefox prior to version 28• Add full support of Chrome 35 to Win XP, Win 7, and Mac 10.9• Drop support for versions of Chrome prior to version 35
Chrome 36 is not added to the list since the stable version was just
recently released. As of this report, support isn’t warranted but we
expect full support by the end of the 2nd quarter 2014 due to automatic
upgrades.
As of this report, the Chrome for Mobile Browsers has slowly gained share on mobile devices. However, this share is almost completely on Android. For Android devices, its share is 23.41% and for iOS devices its share is 0.01% according to NetMarketshare. Therefore, we are not recommending the support of Chrome for Mobile on iOS devices.
Recommendation Changes for This Report

12
Kindle
Fire HD
iOS 5 Partial Partial
iOS 6 Full Full Full FulliOS 7 Full Full Full Full
Android v2.3 Partial
Android v4.1 Full
Android v4.2 Full Full
Android v4.3 Full
Android v4.4 Full Partial
iPod
Touch /
iPhone 4s iPhone 5 iPad 2
Nexus 7
iPad
3Gen
Kindle
Fire
Galaxy
S3
Galaxy
S4
Galaxy
Tab 2
Device Support Recommendations

13
• Add full support of Samsung Galaxy S3 on Android v4.1 and Android
v4.3.• Add full support of Samsung Galaxy S4 on Android v4.4.• Add full support of Amazon Kindle Fire HD on Android v4.2.• Add partial support of Google Nexus 7 on Android v4.4. • Add partial support of Samsung Galaxy Tab 2 on Android v4.2.
As of this report, Kindel Fire Phone market penetration is not available; as a result, we will continue to monitor this device for possible inclusion later this year.
As of writing this report, the market penetration for Kindle Fire and Kindle Fire HD is not available. Chikita stated that kindle Fire grabs 6.10% market share in North America. At this point, we recommend including both Kindle Fire and Kindle Hire HD since usage of Amazon Kindle Fire family has 6.10% and falls within our support policy.
Recommendation Changes for This Report
14
This section details the operating system (OS)
versions that garner 1% or more of total sessions.
Operating System Version Analysis
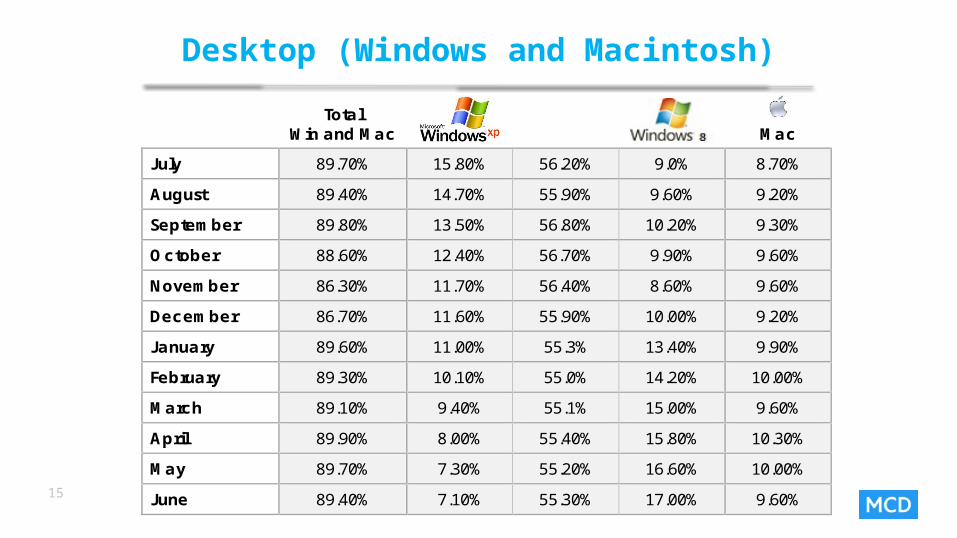
15
Total
Win and Mac
Mac
July 89.70% 15.80% 56.20% 9.0% 8.70%
August 89.40% 14.70% 55.90% 9.60% 9.20%
September 89.80% 13.50% 56.80% 10.20% 9.30%
October 88.60% 12.40% 56.70% 9.90% 9.60%
November 86.30% 11.70% 56.40% 8.60% 9.60%
December 86.70% 11.60% 55.90% 10.00% 9.20%
January 89.60% 11.00% 55.3% 13.40% 9.90%
February 89.30% 10.10% 55.0% 14.20% 10.00%
March 89.10% 9.40% 55.1% 15.00% 9.60%
April 89.90% 8.00% 55.40% 15.80% 10.30%
May 89.70% 7.30% 55.20% 16.60% 10.00%
June 89.40% 7.10% 55.30% 17.00% 9.60%
Desktop (Windows and Macintosh)
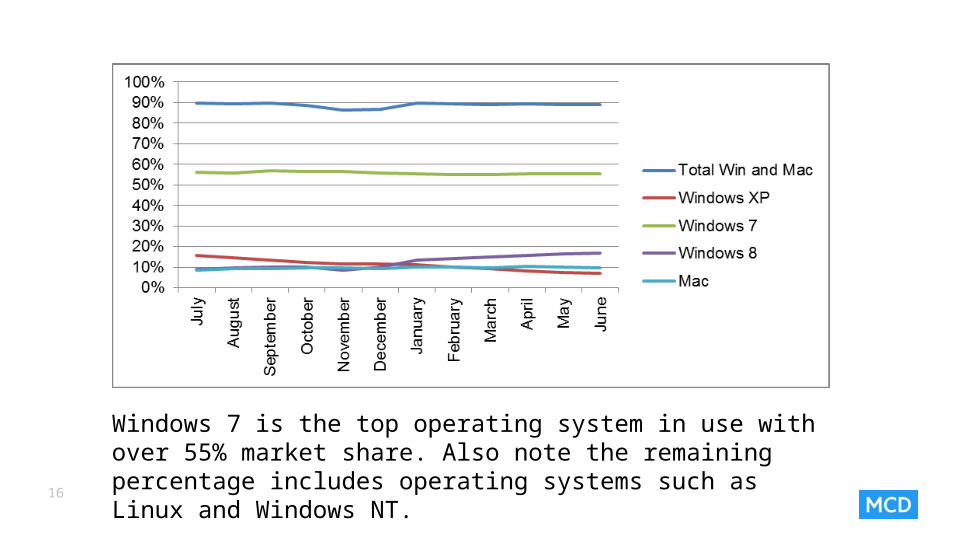
16
Windows 7 is the top operating system in use with over 55% market share. Also note the remaining percentage includes operating systems such as Linux and Windows NT.

17
Mac 10.6
Mac 10.7
Mac 10.8
Mac 10.9
July 1.68% 1.69% 3.28% 0.04%
August 1.65% 1.65% 3.42% 0.05%
September 1.68% 1.66% 3.69% 0.06%
October 1.60% 1.56% 3.31% 0.84%
November 1.53% 1.34% 1.85% 2.42%
December 1.47% 1.23% 1.66% 2.79%
January 1.43% 1.19% 1.47% 3.19%
February 1.40% 1.13% 1.32% 3.48%
March 1.29% 1.05% 1.18% 3.75%
April 1.23% 0.96% 1.06% 4.07%
May 1.11% 0.87% 0.97% 4.15%
June 0.94% 0.74% 0.80% 3.95%
Desktop (Macintosh Only)

18
Although Mac 10.9 has dropped below 4% we still expect it to quickly reach this market
penetration this quarter. We recommend adding full support to the Mac 10.9 operating
system. Mac 10.7 and 10.8 are significantly dropping against Mac 10.9; as a result, we
recommend dropping support of 10.7 and 10.8 for this current quarter.
Apple’s OS X Yosemite Beta was leased on July 21st, 2014 and will be available to 1M Mavericks user according to Tech Times. However, Apple announces that full release of Mac OS X Yosemite will be available this autumn but hasn’t released the date yet.

19
Total
iOS
Android Others
July 3.16% 1.03% 1.37% 0.76%
August 3.39% 1.21% 1.43% 0.75%
September 3.26% 0.95% 1.55% 0.76%
October 3.29% 1.12% 1.44% 0.73%
November 3.68% 1.20% 1.67% 0.81%
December 3.80% 1.13% 1.76% 0.91%
January 4.00% 1.23% 1.93% 0.84%
February 4.00% 1.21% 2.01% 0.78%
March 4.00% 1.32% 2.01% 0.67%
April 4.03% 1.20% 2.10% 0.80%
May 4.16% 1.27% 2.14% 0.75%
June 4.34% 1.23% 2.31% 0.73%
Mobile and Tablet
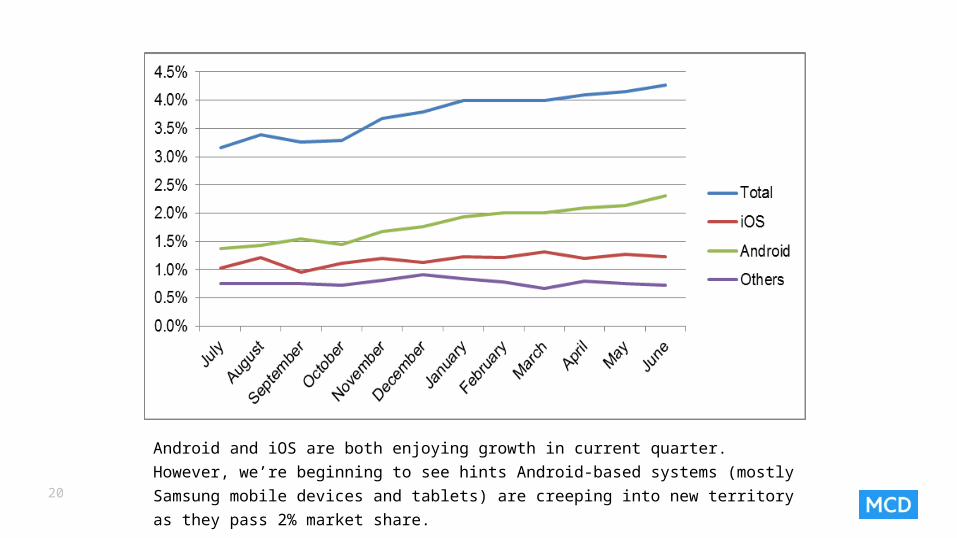
20
Android and iOS are both enjoying growth in current quarter. However, we’re
beginning to see hints Android-based systems (mostly Samsung mobile devices
and tablets) are creeping into new territory as they pass 2% market share.
21
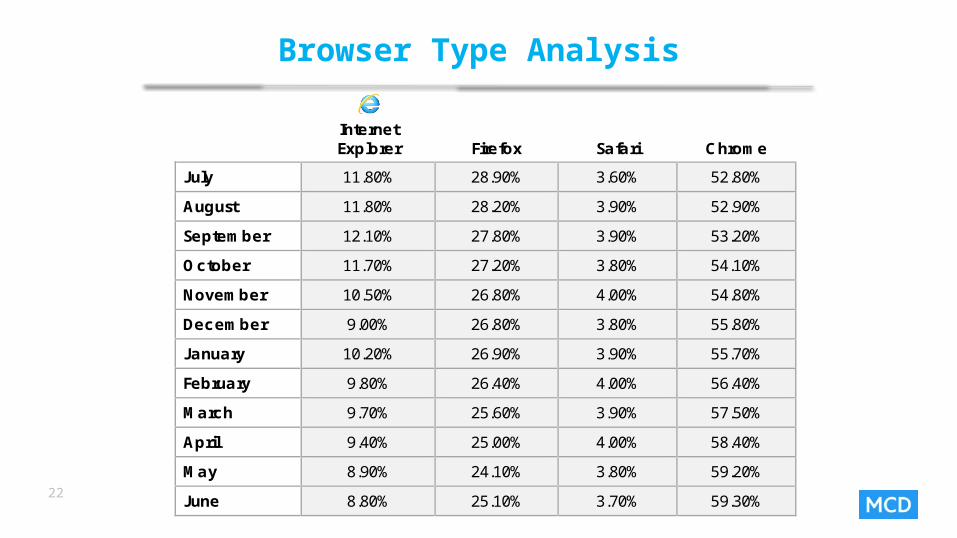
The following tables and charts
highlight desktop browser types and
versions with 1% or more of total
sessions.
Browser Type Analysis
22
Internet Explorer
Firefox
Safari
Chrome
July 11.80% 28.90% 3.60% 52.80%
August 11.80% 28.20% 3.90% 52.90%
September 12.10% 27.80% 3.90% 53.20%
October 11.70% 27.20% 3.80% 54.10%
November 10.50% 26.80% 4.00% 54.80%
December 9.00% 26.80% 3.80% 55.80%
January 10.20% 26.90% 3.90% 55.70%
February 9.80% 26.40% 4.00% 56.40%
March 9.70% 25.60% 3.90% 57.50%
April 9.40% 25.00% 4.00% 58.40%
May 8.90% 24.10% 3.80% 59.20%
June 8.80% 25.10% 3.70% 59.30%
Browser Type Analysis

23
We compared browser use for July 2013 to June 2014 by general market browser share, as
reported by w3schools, and noted some interesting differences in browser use. Chrome
use is significantly higher among the browsers in the general market as it outpaces Firefox
and Safari. Also note the very large difference in Safari – a browser primarily used in iOS
devices.
http://www.w3schools.com/browsers/browsers_stats.asp
24
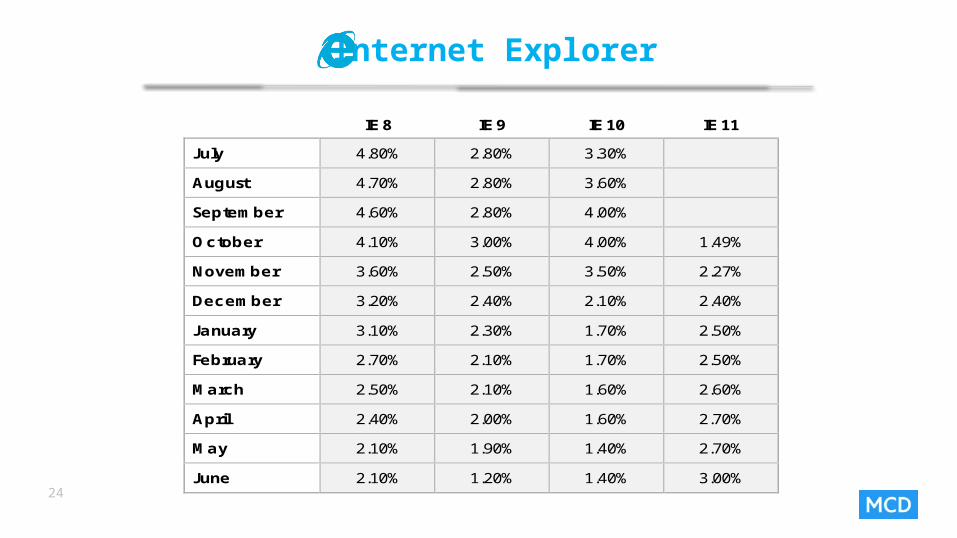
IE 8 IE 9 IE 10 IE 11
July 4.80% 2.80% 3.30%
August 4.70% 2.80% 3.60%
September 4.60% 2.80% 4.00%
October 4.10% 3.00% 4.00% 1.49%
November 3.60% 2.50% 3.50% 2.27%
December 3.20% 2.40% 2.10% 2.40%
January 3.10% 2.30% 1.70% 2.50%
February 2.70% 2.10% 1.70% 2.50%
March 2.50% 2.10% 1.60% 2.60%
April 2.40% 2.00% 1.60% 2.70%
May 2.10% 1.90% 1.40% 2.70%
June 2.10% 1.20% 1.40% 3.00%
Internet Explorer
25

26
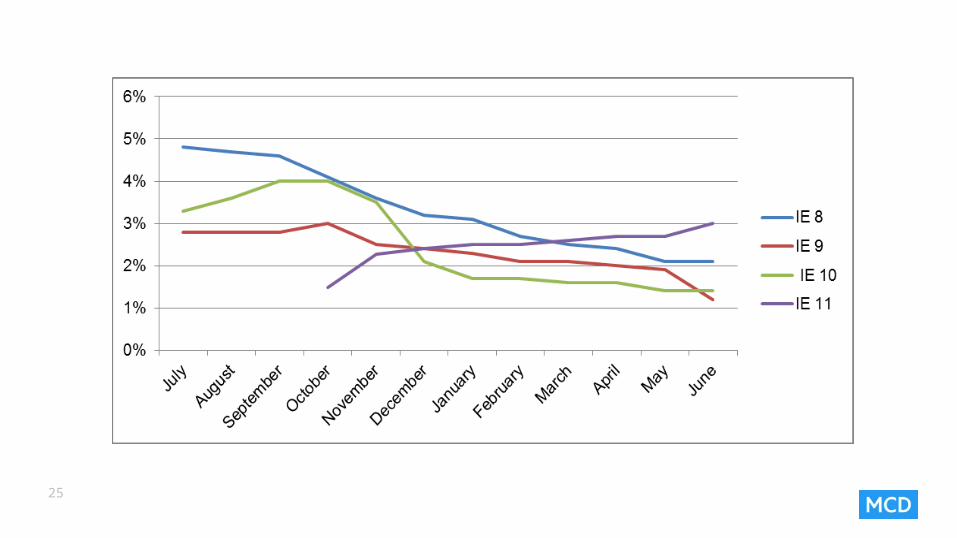
We’re seeing the slow deflation of the IE10 and 9 browsers largely
due to Microsoft auto updates. At 1.40% and 1.20% and gradually
moving down we recommend partial support of these browsers in
the current quarter. There is a possibility of 2014 will continue to see
large corporate users upgrading directly to IE11, Firefox, or Chrome.
IE11 has been intensely watched due to the connection between the
latest browser version auto updates on Windows 8 and 7. Until
recently, IE11 was only available on Windows 8 machines and
Windows RT devices, such as the Surface. However, Microsoft pushed
IE11 auto updates to Windows 7 machines as well. As a result we can
reliably say that IE11 will take a large percentage of market share in
the coming quarter against all IE browsers. At 3.00%, we recommend
full support of this browser version.
Internet Explorer

27
Firefox 28 Firefox 29 Firefox 30
July
August
September
October
November
December
January 0.30%
February 0.60% 0.10%
March 3.40% 0.30%
April 18.10% 1.10% 0.10%
May 5.20% 14.20% 0.20%
June 0.70% 10.50% 9.00%
Firefox

28

29
Firefox
Firefox has considerable competition from Safari and
Chrome. We see Firefox version 28 dropping sharply
from its release date to now. Since the browser
continues to drop, we can reliably project it will fall
below 1% by the end of the 3rd quarter of 2014.
Little more than a month after the release of Firefox
30, Mozilla released Firefox 31 on July 22, 2014.
Firefox 31 market penetration is not currently
available; therefore, we will monitor it in the coming
quarters for possible inclusion.
30
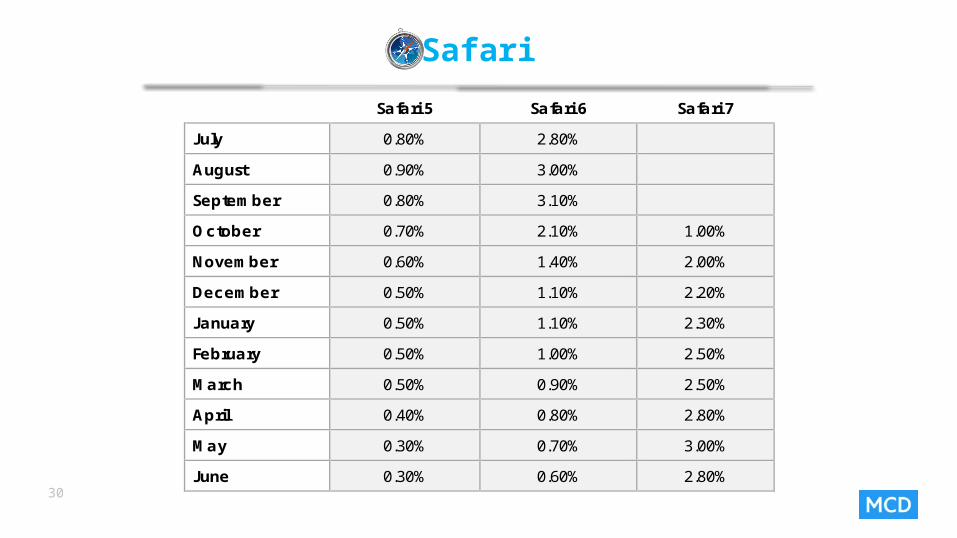
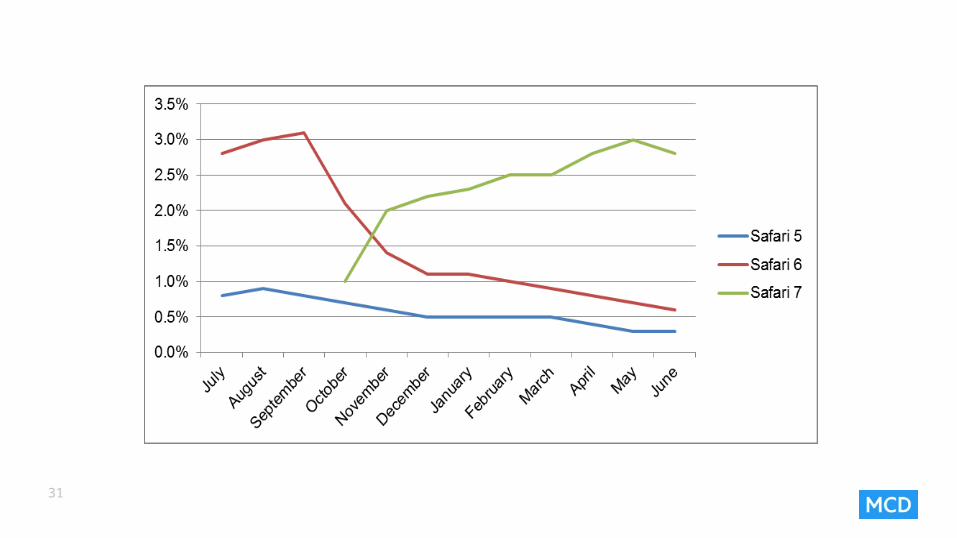
Safari 5 Safari 6 Safari 7
July 0.80% 2.80%
August 0.90% 3.00%
September 0.80% 3.10%
October 0.70% 2.10% 1.00%
November 0.60% 1.40% 2.00%
December 0.50% 1.10% 2.20%
January 0.50% 1.10% 2.30%
February 0.50% 1.00% 2.50%
March 0.50% 0.90% 2.50%
April 0.40% 0.80% 2.80%
May 0.30% 0.70% 3.00%
June 0.30% 0.60% 2.80%
Safari
31

32
Safari
At 0.50% and gradually moving down we recommend
not supporting Safari 5 any longer, nor Safari 6 since
it is at 0.60% and continues to move down. Safari 7
usage significantly increased and at 2.80% and
gradually moving up we recommend fully supporting
it.
33
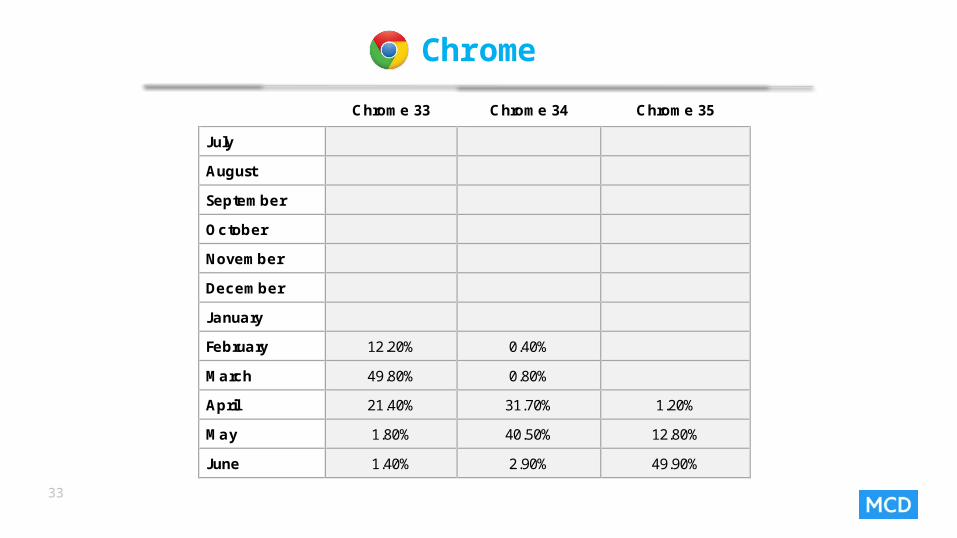
Chrome 33 Chrome 34 Chrome 35
July
August
September
October
November
December
January
February 12.20% 0.40%
March 49.80% 0.80%
April 21.40% 31.70% 1.20%
May 1.80% 40.50% 12.80%
June 1.40% 2.90% 49.90%
Chrome

34

35
We’re seeing a substantial deflation of Chrome 33 gradually
moving down, we recommend partial or no support for these
browsers.
Google released Chrome 36 version on July 8th, 2014.
Chrome 36 market penetrations is less than 1%, therefore,
we will monitor Chrome 36 in the coming quarters for
possible inclusion.
Chrome

36
http://gs.statcounter.com/#desktop+mobile-browser-US-monthly-201304-201403
Android
Mobile Safari
Blackberry
Mobile Chrome
July 32.45% 53.81% 3.05% 5.64%
August 31.85% 52.11% 4.29% 6.45%
September 30.80% 51.84% 4.75% 6.88%
October 30.19% 51.43% 4.62% 7.50%
November 29.84% 51.01% 4.39% 8.93%
December 29.03% 50.57% 4.14% 10.32%
January 27.60% 49.79% 3.25% 10.57%
February 26.09% 48.34% 2.52% 14.52%
March 24.43% 48.64% 1.64% 16.53%
April 22.67% 48.07% 1.43% 18.90%
May 21.24% 47.04% 1.35% 21.53%
June 19.53% 47.31% 1.32% 23.41%
Mobile and Tablet Browsers

37

38
We are watching considerable difference between the Mobile
Safari and Android browser usage on mobile phones and tablets.
Also note that the usage of the Mobile Chrome browser is
significantly increasing. At 23.41 % and gradually moving up, we
recommend full support of this browser in current quarter.
However, it is worth monitoring in 2014, as there is a possibility
by the end of second quarter numbers of people may opt for the
Nexus devices, LG G3, and Galaxy S5, along with existing
Android devices, which will impact the market share.
Despite Blackberry having market penetrations just above
1.32%, the general trend for Blackberry continues down;
therefore, we recommend not supporting this browser.
Mobile and Tablet Browsers

39http://gs.statcounter.com/#desktop+mobile+tablet-comparison-US-monthly-201404-201406
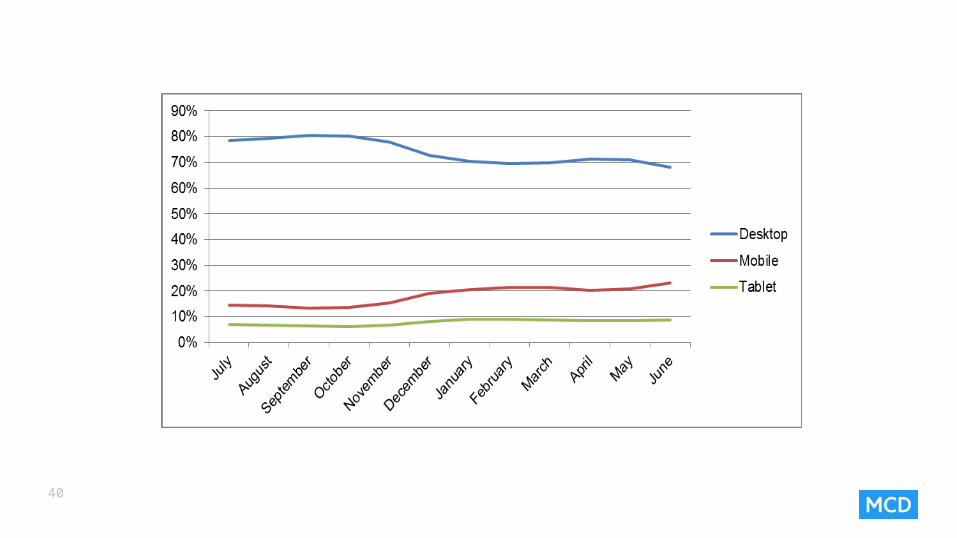
Desktop Mobile Tablet
July 78.34% 14.65% 7.01%
August 79.18% 14.16% 6.66%
September 80.36% 13.32% 6.33%
October 80.07% 13.73% 6.20%
November 78.01% 15.23% 6.76%
December 72.68% 19.18% 8.13%
January 70.50% 20.47% 9.03%
February 69.53% 21.36% 9.11%
March 69.88% 21.43% 8.69%
April 71.31% 20.24% 8.45%
May 70.88% 20.78% 8.34%
June 68.00% 23.17% 8.83%
Desktop and Tablet/Mobile Analysis
40

41
The desktop versus mobile and tablet difference is
considerable. Note that touch device usage is
considerably lower than might be expected given the
hype of touch devices in the general market. Even
though mobile and tablet use is small – it is worth
monitoring in 2014, as there is a possibility by the
end of the year to see an overwhelming majority of
people opting to use touch devices instead of
desktop. The last quarter already shows this growth
beginning to happen.
Desktop and Tablet/Mobile Analysis
42
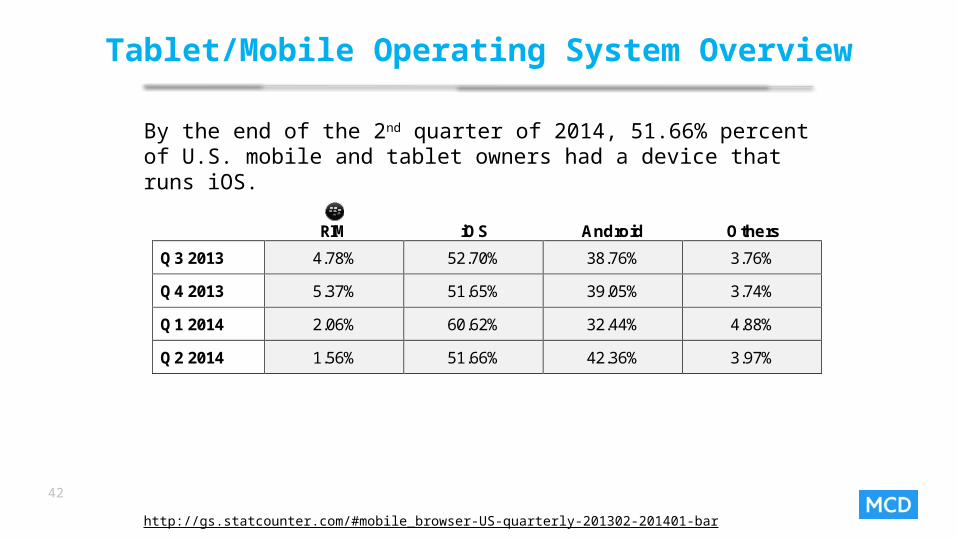
By the end of the 2nd quarter of 2014, 51.66% percent of U.S. mobile and tablet owners had a device that runs iOS.
http://gs.statcounter.com/#mobile_browser-US-quarterly-201302-201401-bar
RIM
iOS
Android Others
Q3 2013 4.78% 52.70% 38.76% 3.76%
Q4 2013 5.37% 51.65% 39.05% 3.74%
Q1 2014 2.06% 60.62% 32.44% 4.88%
Q2 2014 1.56% 51.66% 42.36% 3.97%
Tablet/Mobile Operating System Overview

43

44
In the U.S. iOS continues to dominate
market share of mobile and tablet
operating systems. Given RIM 1.56% and
the Blackberry browser share usage
hovers at 1.32% we do not recommend
support for this browser at this time.
Tablet/Mobile Operating System Analysis
45http://netmarketshare.com/operating-system-market-share.aspx?qprid=10&qpcustomd=1
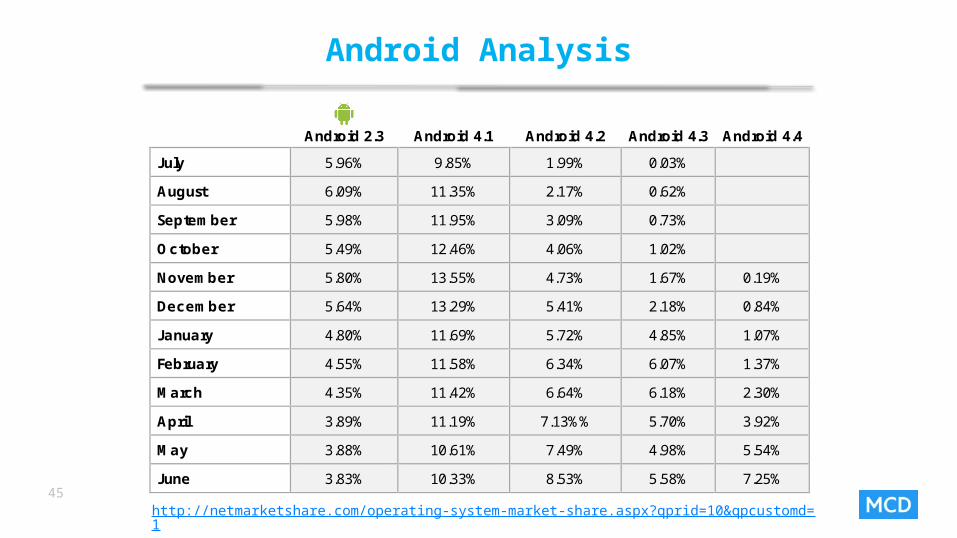
Android 2.3
Android 4.1
Android 4.2
Android 4.3
Android 4.4
July 5.96% 9.85% 1.99% 0.03%
August 6.09% 11.35% 2.17% 0.62%
September 5.98% 11.95% 3.09% 0.73%
October 5.49% 12.46% 4.06% 1.02%
November 5.80% 13.55% 4.73% 1.67% 0.19%
December 5.64% 13.29% 5.41% 2.18% 0.84%
January 4.80% 11.69% 5.72% 4.85% 1.07%
February 4.55% 11.58% 6.34% 6.07% 1.37%
March 4.35% 11.42% 6.64% 6.18% 2.30%
April 3.89% 11.19% 7.13%% 5.70% 3.92%
May 3.88% 10.61% 7.49% 4.98% 5.54%
June 3.83% 10.33% 8.53% 5.58% 7.25%
Android Analysis
46
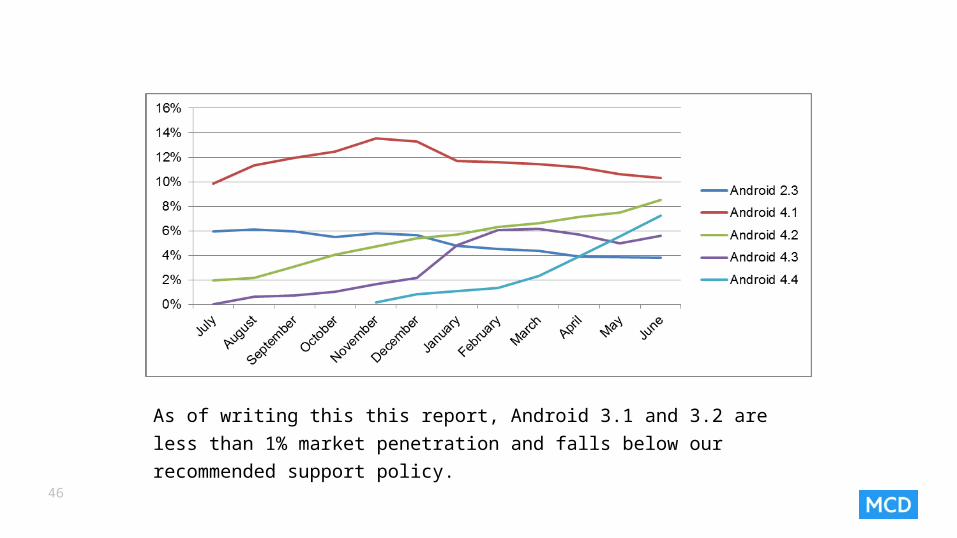
As of writing this this report, Android 3.1 and 3.2 are less than 1%
market penetration and falls below our recommended support policy.
47
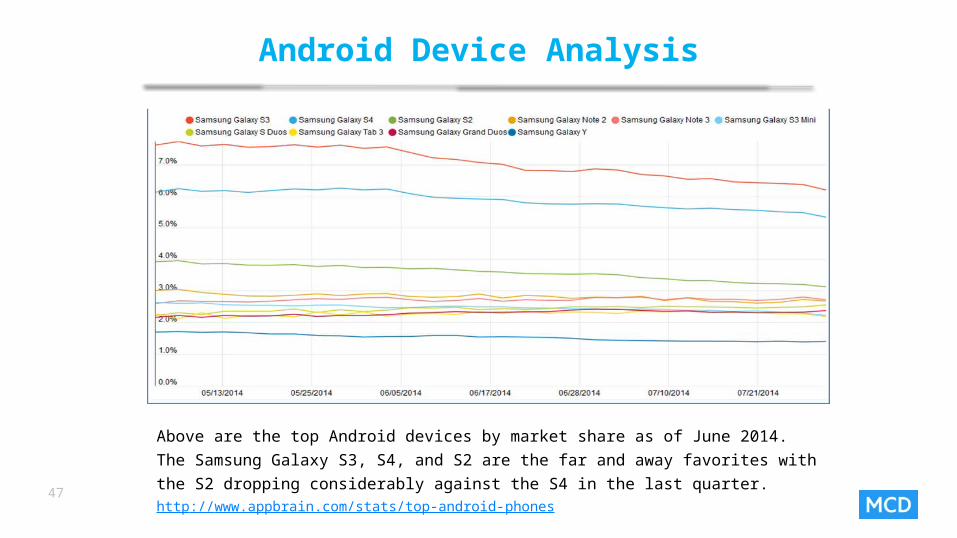
Above are the top Android devices by market share as of June 2014. The Samsung
Galaxy S3, S4, and S2 are the far and away favorites with the S2 dropping
considerably against the S4 in the last quarter. http://www.appbrain.com/stats/top-android-phones
Android Device Analysis
48
The Samsung Galaxy S3 and S4 are now listed in the top
Android phone list. At 6.80% and 5.80%, we recommend
continue to full support of Samsung Galaxy S4 and S3 in
current quarter. It is worth monitoring in 2014, as there is a
possibility by the end of the 1st quarter to see an
overwhelming majority of people opting to use Samsung
Galaxy S4.
As of this report, Galaxy S5 market penetration is not
available; as a result, we will continue to monitor this device
for possible inclusion in upcoming quarter.
Android Device Analysis

49
Amazon Kindle Fire Samsung Galaxy Google Nexus
3Q 2013 6.70% 5.1% 1.60%
4Q 2013 7.30% 5.75% 1.80%
1Q 2014 7.70% 6.10% 1.90%
2Q 2014 6.10% 8.30% 2.20%
Android Tablet Breakdown

50
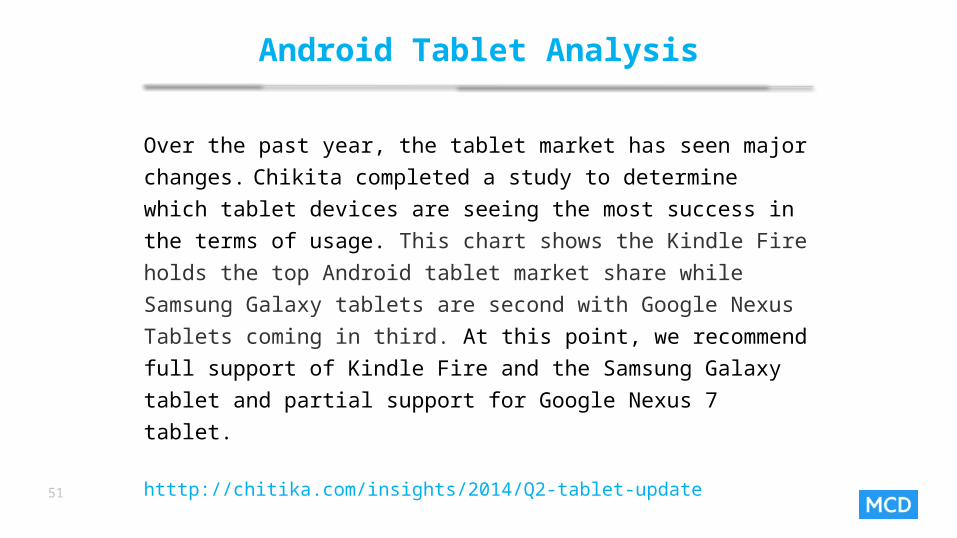
51
Over the past year, the tablet market has seen major
changes. Chikita completed a study to determine which tablet
devices are seeing the most success in the terms of usage.
This chart shows the Kindle Fire holds the top Android tablet
market share while Samsung Galaxy tablets are second with
Google Nexus Tablets coming in third. At this point, we
recommend full support of Kindle Fire and the Samsung
Galaxy tablet and partial support for Google Nexus 7 tablet.
htttp://chitika.com/insights/2014/Q2-tablet-update
Android Tablet Analysis

52 https://mixpanel.com/trends/#report/ios_frag/from_date:-122,to_date:-32
This section details iOS versions by type that garner 1% or more of total sessions.
iOS 5.x
iOS 6.x
iOS 7.x
July 4.61% 94.44% 0.88%
August 4.35% 94.30% 1.16%
September 3.29% 63.32% 33.24%
October 2.82% 23.37% 73.57%
November 2.80% 20.05% 76.83%
December 2.79% 18.45% 78.37%
January 2.65% 15.66% 81.25%
February 2.15% 12.55% 85.04%
March 1.73% 9.98% 88.14%
April 1.51% 8.36% 89.95%
May 1.37% 7.29% 91.14%
June 1.29% 6.96% 91.49%
iOS Breakdown

53

54
In the U.S. iOS 7 continues to dominate market share
of mobile and tablet operating systems over iOS 6
and 5. Note that iOS 5.x market share falls below 2%
and gradually moving down. At 1.29% we do
recommend partial support for this operating system
at this time.
As of this report, iOS4 is less than 1% market
penetration and falls below our recommended
support policy.
iOS Analysis

55 http://marketshare.hitslink.com/operating-system-market-share.aspx?qprid=10&qpcustomd=1
iPhone
iPad
July 22.47% 35.02%
August 22.84% 31.29%
September 22.38% 30.61%
October 22.25% 32.53%
November 22.01% 32.57%
December 22.36% 31.29%
January 21.51% 32.34%
February 22.48% 29.87%
March 23.15% 29.58%
April 22.31% 28.80%
May 21.75% 26.10%
June 21.03% 24.14%
iPhone versus iPad Breakdown

56

57http://david-smith.org/iosversionstats/
iPad 2G iPad 3G iPad 4G iPad Mini
iOS 5.x 3.10% 3.90%
iOS 6.x 14.20% 7.60% 8.40% 9.90%
iOS 7.x 80.10% 88.50% 91.60% 90.00%
iPad Breakdown

58

59
The adoption rate of iOS 7.x is
significantly higher than iOS 6.x and iOS
5.x among iPad users. At this time, we
recommend full support of iOS 7.x in
current quarter.
iPad Analysis

Look for the next quarterly update in October 2014.
60
MCD
Platform Support Recommendations
2014 Second Quarter