platforms for the development of digital television broadcasting and the internet in japan...
Post on 19-Dec-2015
213 views
TRANSCRIPT

Platforms for the Development of Digital Television Broadcasting and the Internet in Japan
Fourteenth Northeast Asia Economic Forum
Shenyang, China
20-21 September 2005
Hajime ONIKI
Osaka-Gakuin University, [email protected]
www.osaka-gu.ac.jp/php/oniki/

9/20-21/2005 H. Oniki
2
I. Introduction A. Overview of IT, DTV, and the Internet in Japan
Source of all statistical graphs in this presentation: MIC, Information and Communication in Japan (2005 White Paper), June 2005.

9/20-21/2005 3
Communications Industry: GDP (Value Added, 1995 prices)
0
10,000
20,000
30,000
40,000
50,000
60,000
70,000
80,000
Bill J PY

9/20-21/2005 4
Commnunications Industry (Pecentage of Value Added in GDP)
0.0
2.0
4.0
6.0
8.0
10.0
12.0
14.0
1995 1996 1997 1998 1999 2000 2001 2002 2003
%

9/20-21/2005 5
IT Investment of All Industries (1995 Prices)
0
5,000
10,000
15,000
20,000
25,000
1991 1992 1993 1994 1995 1996 1997 1998 1999 2000 2001 2002 2003
Bill J PY

9/20-21/2005 6
Percentage of IT Investment in Total Investment of AllIndustries
0.0
5.0
10.0
15.0
20.0
25.0
30.0
1991 1992 1993 1994 1995 1996 1997 1998 1999 2000 2001 2002 2003
%

9/20-21/2005 7
0
200
400
600
800
1000
1200
1400
1600
1800
1991 1992 19931994 1995 1996 1997 1998 1999 20002001 2002 2003
J apanUSKorea
Growth of IT Investment of all Industries: J apan, Korea, US
(1991=100)

9/20-21/2005 8
01,0002,0003,0004,0005,0006,0007,0008,0009,000
10,000
1996 1997 1998 1999 2000 2001 2002 2003 2004
固定通信移動通信
Mill. Telecommunications Subscribers
WirelineWireless

9/20-21/2005 9
Internet Users
0
10
20
30
40
50
60
70
80
90
1997 1998 1999 2000 2001 2002 2003 2004
Million

9/20-21/2005 10
Percentage of Internet Users in the Population
0
10
20
30
40
50
60
70
1997 1998 1999 2000 2001 2002 2003 2004
%

9/20-21/2005 11
World Internet Users
0
100
200
300
400
500
600
700
800
1991 1992 1993 1994 1995 1996 1997 1998 1999 2000 2001 2002 2003
Mill.

9/20-21/2005 12
1.1 1.1 1.1 1.2 1.6 1.8
48.940.1 40.1 37.5 34.9 32.4
20.527.3 28.3 30.4 33.9 36.1
26.9 28.6 28.4 29.0 27.7 27.7
2.5 2.9 2.1 1.8 1.9 2.0
0%
10%
20%
30%
40%
50%
60%
70%
80%
90%
100%
1998 1999 2000 2001 2002 2003
OceaniaEuropeAsiaAmericasAfirica
Area Composition of Internet Users

9/20-21/2005 13
Average Anuual Expenditures on Communications by Households
78,12383,565
90,046
99,266 102,611109,701
118,327124,362
132,864141,372
145,332
0
20,000
40,000
60,000
80,000
100,000
120,000
140,000
160,000
1994 1995 1996 1997 1998 1999 2000 2001 2002 2003 2004
J PY/ Year

9/20-21/2005 14
Percentage of Communications Expenditures by Householdsin Total Expenditures
2.1 2.3 2.5 2.6 2.8 3.1 3.4 3.6 3.9 4.0
012345678
1994 1995 1996 1997 1998 1999 2000 2001 2002 2003
(%)

9/20-21/2005 H. Oniki
15
Impact of the introduction of Digital Television (DTV) in Japan
Possibilities of processing DTV content by using the power of computer and storage technologies
DTV’s competition and coordination with the Internet
I. Introduction B. Objective of this presentation
9/20-21/2005 H. Oniki
16
II. Digital Broadcasting and the Internet in Japan A. Start of DTV in Japan (1/2)
1. Terrestrial DTV
Digital terrestrial television started at the end of 2003.
By 2011 analog television will be terminated.
regulated by Ministry of Internal Affairs and
Communication (MIC)

9/20-21/2005 H. Oniki
17
II. Digital Broadcasting and the Internet in Japan A. Start of DTV in Japan (2/2)
2. Other DTV’s
1996: CS broadcasts
1998: cable TV
2000: BS broadcasts
9/20-21/2005 18
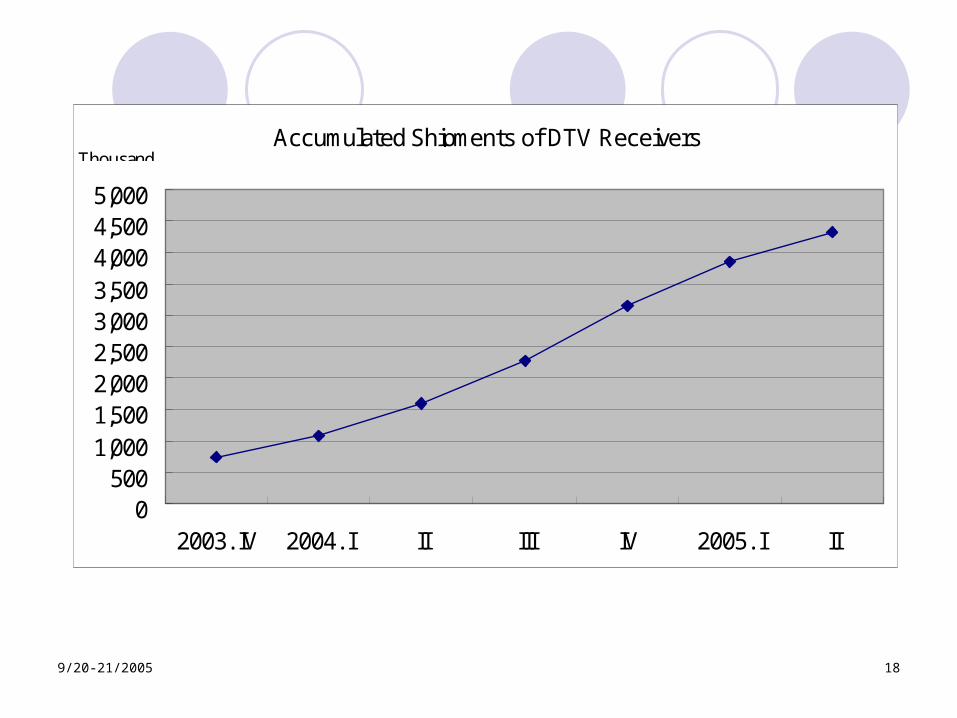
Accumulated Shipments of DTV Receivers
0500
1,0001,5002,0002,5003,0003,5004,0004,5005,000
2003. IV 2004. I II III IV 2005. I II
Thousand

9/20-21/2005 H. Oniki
19
II. Digital Broadcasting and the Internet in Japan B. Terrestrial TV in Japan (1/4)
1. Statistics
Terrestrial TV’s revenue:
80% of all revenue for broadcasting
Per capita (per consumer) annual revenue: JPY30,000
(US$250)
Japanese households watch TV 3 hours per day.

9/20-21/2005 20
Total Annual Revenue in Broadcast Industry
29,000
30,000
31,000
32,000
33,000
34,000
35,000
36,000
37,000
38,000
39,000
1996 1997 1998 1999 2000 2001 2002 2003
100Mill J PY

9/20-21/2005 21
0:00
1:00
2:00
3:00
4:00
1994 1995 1996 1997 1998 1999 2000 2001 2002 2003 2004
NHK総計
民放総計
Hours/ Day Television Watching by Households
PublidStattion(NHK)CommercialStation

9/20-21/2005 H. Oniki
22
II. Digital Broadcasting and the Internet in Japan B. Terrestrial TV in Japan (2/4)
2. Regulation
DTV considered to replace analog with digital content
not a new service
few changes in rules or regulations
no new entry

9/20-21/2005 H. Oniki
23
II. Digital Broadcasting and the Internet in Japan B. Terrestrial TV in Japan (3/4)
3. Economics
monopolistic status
no new licenses
average profits quite high
broadcasters in urban areas can bear costs for DTV transition
those located in rural areas may not
9/20-21/2005 H. Oniki
24
II. Digital Broadcasting and the Internet in Japan B. Terrestrial TV in Japan (4/4)
4. Impact of DTV transition explained from
technological aspect
a. noise reduction
b. realization of HDTV
c. spectrum saving
d. possibility of interactive TV

9/20-21/2005 H. Oniki
25
II. Digital Broadcasting and the Internet in Japan C. Impact of DTV
Possible to process DTV content after they are broadcast
desirable to prepare environment for content
processing
DTV and the Internet may be competitive and
complementary
Convergence of broadcasting and telecommunications.
9/20-21/2005 H. Oniki
26
III. Platforms for Efficient Utilization of DTV A. Restrictions on content utilization with DTV in Japan (1/2)
1. Rigid restrictions on utilizing content
All DTV programs are broadcast scrambled
B-CAS card required for viewing
Copy-once requirement

9/20-21/2005 H. Oniki
27
III. Platforms for Efficient Utilization of DTV A. Restrictions on content utilization with DTV in Japan (2/2)
2. Implications
Possible for a broadcaster to introduce pay TV
no broadcaster intends to introduce pay TV
“TiVo” in U.S.
Potential benefits of applications software for DTV content blocked by restrictions
<Figure 1>

9/20-21/2005 28
Copyright protection
Optimal state
Present state
Figure 1: Tradeoff of Copyright Protection and Applications Development
Applications development

9/20-21/2005 H. Oniki
29
III. Platforms for Efficient Utilization of DTV B. Platforms for DTV applications (1/6)
1. Present state of DTV
lot of content but no applications software
like computers in earlier days
little applications software but with a lot of analog
content

9/20-21/2005 H. Oniki
30
III. Platforms for Efficient Utilization of DTV B. Platforms for DTV applications (2/6)
2. Preparing environment for transactions of
content with a copyright
Business codes
Database and network system

9/20-21/2005 H. Oniki
31
III. Platforms for Efficient Utilization of DTV B. Platforms for DTV applications (3/6)
3. Transactions system for DTV content
Transacting goods and services
market mechanism
differences between (ordinary) goods and services
and content
Content can be copied with or without modification.

9/20-21/2005 H. Oniki
32
III. Platforms for Efficient Utilization of DTV B. Platforms for DTV applications (4/6)
4. Degree of complexities in transactions of
content
Cost of transacting digital content is high.

9/20-21/2005 H. Oniki
33
III. Platforms for Efficient Utilization of DTV B. Platforms for DTV applications (5/6)
5. System for transactions of digital content to be built on copyright laws
Many “rights” in relation to content
Status of rights to be attached to content
Information set: descriptor
Database of descriptors of content
Record of transactions of real estate
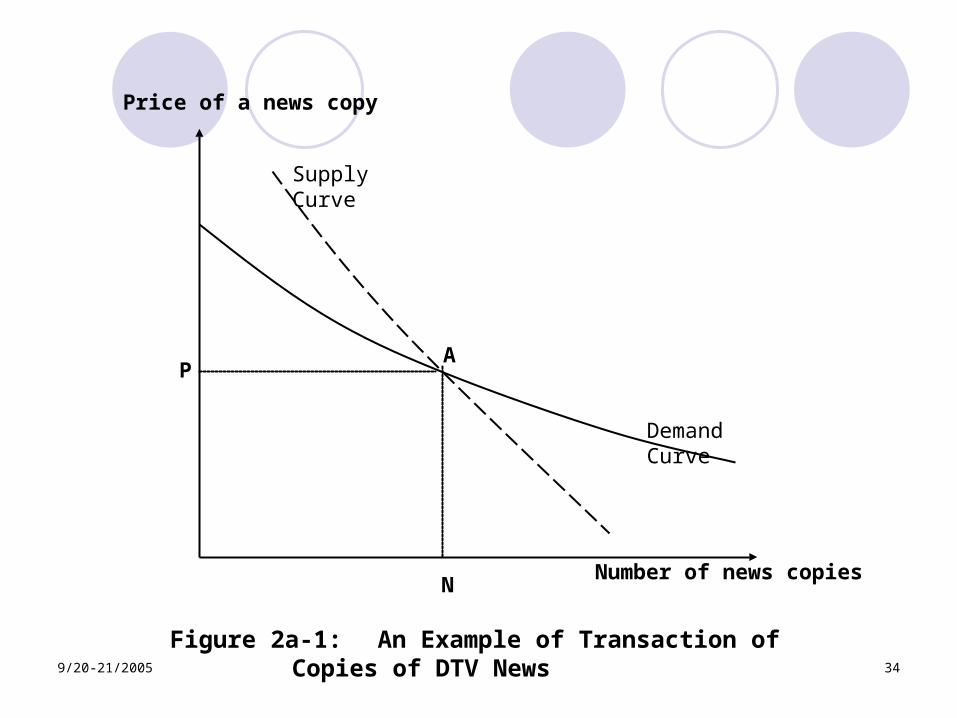
9/20-21/2005 34
Number of news copiesN
Price of a news copy
Supply Curve
Demand Curve
AP
Figure 2a-1: An Example of Transaction of Copies of DTV News
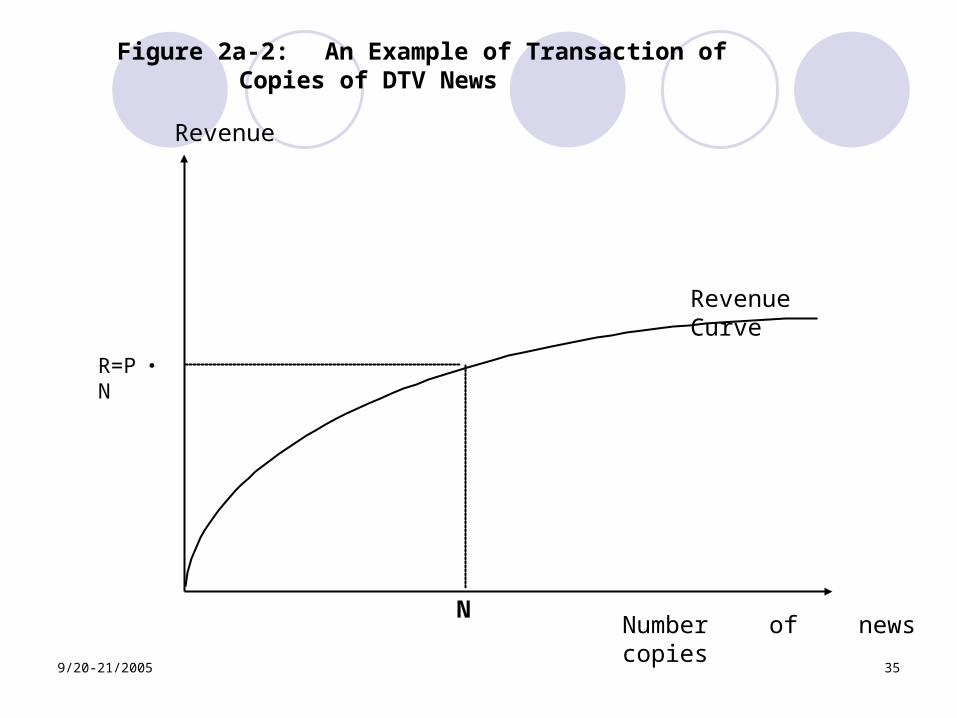
9/20-21/2005 35
Revenue Curve
R=P ・N
Revenue
Number of news copiesN
Figure 2a-2: An Example of Transaction of Copies of DTV News

9/20-21/2005 H. Oniki
36
III. Platforms for Efficient Utilization of DTV B. Platforms for DTV applications (6/6)
6. Example of simple descriptor of DTV
news content
<Figure 2b>

9/20-21/2005 37
Descriptor of Video Copy for Transaction
1. Video CharacteristicsTitle: Morning News Class.: General NewsBroadcast by: XYZ Network, Inc. at: Tokyo and other locationson: 02/15/2005 time: 9:00-10:00AM duration: 45 minCommercials: not included2. Supply-Price SchedulePrice per Copy (yen) No. of Copies registered for sale 1.000 ~ 5,000 700 ~ 1,000 500 ~ 2,000 310 ~ 5,000 220 ~ 10,000 160 ~ 20,000 100 ~ 50,000 80 50,000 ~ Figure 2b-1: Example of Descriptor of News Video for Sale

9/20-21/2005 38
Descriptor of Video Copy for Transaction
3. Current Registration for Purchasing a CopyNo. of Copies for Effective Purchase: 2513No. of Copies Delivered: 0Price Currently Bid: 310 yensClosing Time of Current Offer: Noon, 2/16/20054. Conditions for Copy Utilization
•Must use equipment with B-CAS compliance•Utilization Type: A2
•May retain single copy for viewing; Duplicate copies not allowed.
(2)May cut and use any portion(s) of video, but only one cut is allowed. Duplicating cut portion(s) not allowed. Cut portion(s) will be removed from the original video; the original video will be shortened by the (total) length of cut portion(s).
(3)Any video to which cut portion(s) of the original video are pasted may not be duplicated; such shall be used under the copy-once restriction.
Figure 2b-2: Example of Descriptor of News Video for Sale

9/20-21/2005 H. Oniki
39
III. Platforms for Efficient Utilization of DTV C. Status of broadcasters (1/2)
1. Monopoly in the supply of broadcast content
little incentive to let DTV content be utilized
with applications software for the benefit of
consumers
9/20-21/2005 H. Oniki
40
III. Platforms for Efficient Utilization of DTV C. Status of broadcasters (2/2)
2. Recent trend:
Content on IP-TV (August 2005)
by commercial broadcasters
Disclosure obligation of DTV content by direct governmental regulations
Information and Communication Council (July 2005)
DTV content to be supplied via the Internet

9/20-21/2005 H. Oniki
41
IV. Competition and Coordination of DTV and the Internet A. Vertical Structure of DTV and the Internet (1/2)
1. Vertical structure in communications
industry
Division of labor viewed vertically
<Figure 3>

9/20-21/2005 42
ServicesTeleph
onyInterne
tCable TV
Broadcast
Mode of Supply
Contents
(Contents of
telephone and fax)
E-mails,Web
BroadcastContents
CompetitiveNetworking Voice
TransmissionIP-Packet
TransmissionCable
TransmissionBroadcasting
Media
Electric current, Optical rays Spectrum
Twisted and coaxial cables,Optical fibers
(Antennas)
MonopolizedEquipmentStructures
andSpaces
Tunnels, Tubes, Poles, etc. Terrestri
al spectru
m spacesTerrestrial (physical) spaces
Infrastructure Wired
Wireless
Figure 3: The Layers Structure of the Services for Information Transmission
9/20-21/2005 H. Oniki
43
IV. Competition and Coordination of DTV and the Internet A. Vertical Structure of DTV and the Internet (2/2)
2. Competition and growth
Activities competing and substituting within single
layer
twisted copper pair to optical fibers
telephony from traditional voice transmission to new
IP-packet transmission
Best to promote competition layer-wise

9/20-21/2005 44
Annual Sales of Media Contents
4.6 4.8 4.9
1.0 0.9 0.9
5.3 5.1 5.0
0.0
2.0
4.0
6.0
8.0
10.0
12.0
2000 2002 2007
TextVoiceVideo
Trill J PY

9/20-21/2005 45
No. of Broadband Subscribers
02468
101214161820
1999 2000 2001 2002 2003 2004
Wireless FWA( )FTTHVia CableDSL
Mill.
9/20-21/2005 46
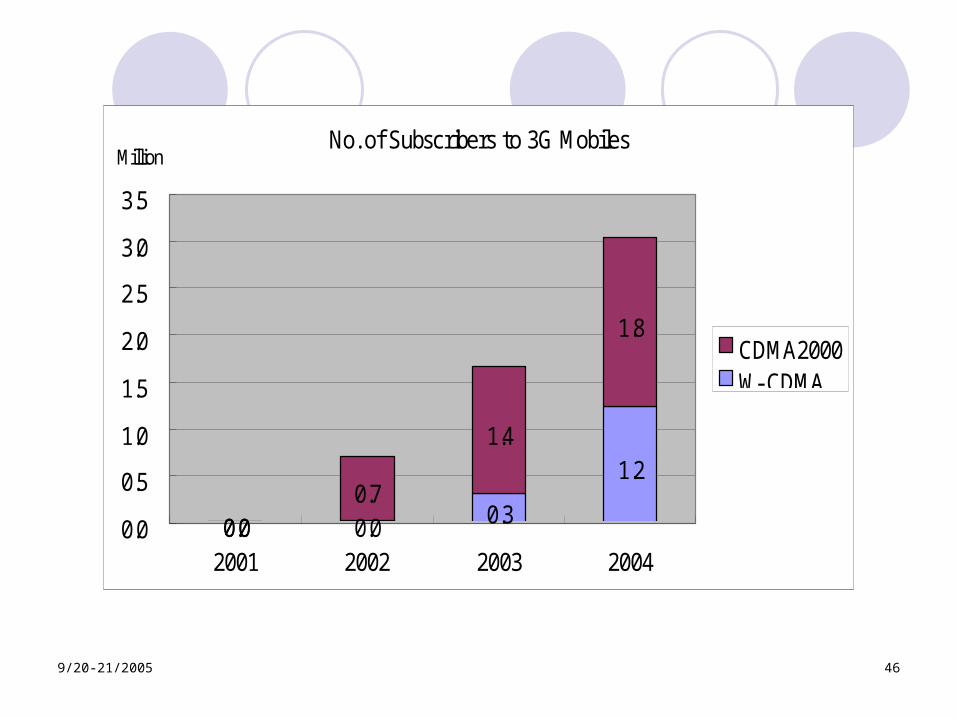
No. of Subscribers to 3G Mobiles
0.0 0.0 0.3
1.2
0.00.7
1.4
1.8
0.0
0.5
1.0
1.5
2.0
2.5
3.0
3.5
2001 2002 2003 2004
CDMA2000W- CDMA
Million

9/20-21/2005 H. Oniki
47
IV. Competition and Coordination of DTV and the Internet B. Monopoly in the infrastructure layer (1/3)
Legal and economic basis of supply of infrastructure
layer not clearly established
1. Wired communication
NTT supplies large portion of communications
infrastructure
“given” at the time of privatization

9/20-21/2005 H. Oniki
48
IV. Competition and Coordination of DTV and the Internet B. Monopoly in the infrastructure layer (2/3)
2. Wireless communication
Spectrum assigned by MIC without charging
economic values
far from being competitive or with free entry

9/20-21/2005 H. Oniki
49
IV. Competition and Coordination of DTV and the Internet B. Monopoly in the infrastructure layer (3/3)
3. Implications of monopoly
Monopolistic profits
Internal cross-subsidization in upper-layer
competition

9/20-21/2005 H. Oniki
50
IV. Competition and Coordination of DTV and the Internet C. Policies for fair competition at level-playing field (1/6)
1. Designation of “monopoly-front service”
to be determined by the government
regulate supply of services located at front level
so that monopolized group function as if a
competitive group

9/20-21/2005 H. Oniki
51
IV. Competition and Coordination of DTV and the Internet C. Policies for fair competition at level-playing field (2/6)
2. Vertical separation
Monopolistic operator be vertically separated from
competitive activities
structurally or in accounting
No regulation on competitive activities
supply of monopoly-front service be open to all purchasers

9/20-21/2005 H. Oniki
52
IV. Competition and Coordination of DTV and the Internet C. Policies for fair competition at level-playing field (3/6)
3. Regulation of monopoly
Monopolistic operator must act as price taker in supply
of infrastructure
<Figure 4>

9/20-21/2005 53
Supply of infrastructure Sservices
Price of
infrastructure services
Demand
Equilibrium
prices
Figure 4: Equilibrium Price of Infrastructure Service

9/20-21/2005 H. Oniki
54
IV. Competition and Coordination of DTV and the Internet C. Policies for fair competition at level-playing field (4/6)
4. Implications
Most difficulties and complexities in communications
industry arise from that every activity must use some
infrastructure (including space), which cannot be
supplied competitively without governmental
regulations.
<Figure 5>

9/20-21/2005 55
Services Economic unitsMode of supply
Final demand
Consumers, Firms, Governments, Public entities, etc
Competitive
Content supply
Content suppliers (newspapers, publishers, producers of music and video contents, news agencies, advertising
agencies, etc.)
Web, E-mails, and
other data
Information Transmission
Network-service providers(broadcast, telephone, access,
backbone, Internet, etc.)
Infrastructure
Supply of infrastructure for information transmission
(wired, wireless)
Monopolized
Figure 5: The Structure of IT Industries under Vertical Separation

9/20-21/2005 H. Oniki
56
IV. Competition and Coordination of DTV and the Internet C. Policies for fair competition at level-playing field (5/6)
5. Public corporations for infrastructure supply
a. Short-run behavior of monopolistic operator to simulate short-run service market
b. Long-run behavior of monopolistic operator
to simulate competitive capital market
Prohibited from maximizing rate of return from investment
9/20-21/2005 H. Oniki
57
IV. Competition and Coordination of DTV and the Internet C. Policies for fair competition at level-playing field (6/6)
6. Policy recommendations
Enforce monopoly-front and the price-taker
requirements

9/20-21/2005 58