playing favorites: conflicts of interest in mutual fund ... · playing favorites: conflicts of...
TRANSCRIPT

Playing favorites: Conflicts of interest in
mutual fund management
Diane Del Guercioa Egemen Gencb
Hai Tranc
March 21, 2016
Abstract: It is common for mutual fund managers to concurrently manage assets on behalf of clients outside the mutual fund industry. If these other accounts are more lucrative in terms of current or potential manager compensation, this provides an incentive for managers to favor these other accounts at the expense of mutual fund investors. Using a new dataset hand collected from mandatory SEC filings and therefore free of selection bias, we examine the performance of funds with managers who receive performance-based incentive fees in three different types of accounts: mutual funds, hedge funds, and separate accounts. We find that only funds with managers who receive incentive fees in hedge funds underperform peer mutual funds by an economically and statistically significant 9.6 bps per month in Carhart alpha, or 1.15% per year. Further tests using a sample of mutual fund managers who add a hedge fund during the sample period confirm our prior finding of the negative impact on mutual fund performance. We find that two proxies for a manager’s concern about the consequences of poor mutual fund performance can explain variation in the underperformance we document. Our evidence provides support for the conflicts of interest hypothesis in the debate on “side-by-side management” of mutual funds and hedge funds. aLundquist College of Business, 1208 University of Oregon, Eugene, OR 97403, 541 346 5179, Email: [email protected] bRotterdam School of Management, Erasmus University, 3062 PA Rotterdam, The Netherlands, Tel: +31 10 408 9505, E-mail: [email protected] cCollege of Business Administration, Loyola Marymount University, 1 LMU Drive, Los Angeles, CA 90045. Email: [email protected] We thank Tom Nohel, Z. Jay Wang, and Lu Zheng for providing us with the data on side-by-side management used in their 2010 paper. We would like to thank Dion Bongaerts, Yigitcan Karabulut, Vicky Lantushenko, Jongha Lim, Mathijs van Dijk,, Florian Weigert, Lu Zheng, and seminar participants at the 2016 European Winter Finance Summit, the 2016 AFA meetings, the 2015 Academy of Financial Services Annual Meeting, the 2015 Southern California Finance Conference, the 2015 Southern Finance Association meetings, Erasmus University, the University of California, Irvine, the University of Kentucky, and the University of Oregon for helpful comments. We thank Steve Liu, Ben Tan, Jingyun Yang, and especially Carl-Emmanuel Coffie for excellent research assistance.
1
1 Introduction
The nature of delegated asset management is that investors contract with an advisory firm to
provide portfolio management services in exchange for a fee. The scale economies inherent in
portfolio management suggest that advisory firms commonly contract with many different clients
simultaneously. As has long been recognized, advisory firms and portfolio managers may have
incentives to self-deal or to favor their most lucrative clients over others. The recent literature
has found direct evidence of this. For example, Gaspar et al (2006) find that mutual fund
families are able to strategically transfer performance to the funds that generate more profits for
the family, such as those offering higher fee rates or attracting greater assets under management.
Chaudhuri et al (2013) provide similar evidence for the segment of asset managers serving
institutional clients with separate accounts. Ben-Rephael and Israelsen (2015), using a
proprietary dataset from Ancerno Ltd. of executed trades, find direct evidence of favoritism in
trade allocation across different clients of the same advisory firm (fund family). This literature
provides evidence that managers are able to boost the returns of portfolios offering greater profits
to the advisory firm through cross-subsidization from less profitable portfolios. Other examples
of opportunities for cross-subsidization include cross-trades across client portfolios and strategic
allocations of underpriced IPO shares.
One of the more acute settings for cross-subsidization incentives that has garnered the
most attention is the simultaneous management of both mutual fund and hedge fund portfolios,
referred to in the academic literature as “side-by-side management.” Because of the large
incentive fee component of manager compensation that is standard in the hedge fund industry,
there is naturally a concern that the differences in compensation structure across these portfolios

2
would induce a manager to favor hedge fund clients at the expense of mutual fund clients.
Evidence from Lim et al (2016) suggest that management and incentive fees are only one aspect
of a hedge fund manager’s compensation, and in fact, the indirect incentives arising from future
inflows and the strategic use of leverage comprise the larger part of their compensation. They
estimate that these indirect incentives are 1.6 to over 6-times larger for hedge funds than for
mutual funds. Together, the differences in direct and indirect incentives imply a powerful
incentive for managers with both types of portfolios to favor their hedge fund clients.1
Evidence on whether side-by-side managers transfer performance from mutual funds to
hedge funds has been studied by Nohel et al (2010), Cici et al (2010), and Chen and Chen (2009)
with mixed results. Nohel et al and Chen and Chen find that mutual funds with side-by-side
managers actually outperform otherwise similar peer funds. They interpret this benefit for fund
investors as possibly arising from the ability of the mutual fund industry to retain skilled
managers by allowing them to also manage lucrative hedge funds, or from the effective policies
and internal controls of advisory firms that deter cross-subsidizing actions. However, Cici et al
find evidence consistent with favoritism and conclude that mutual fund investors are harmed by
side-by-side management. The contradicting evidence suggests that this issue remains
unresolved.
As these studies point out, the potential harm to fund investors from managers’ side-by-
side arrangements has captured the attention of legislators and regulators. While outright bans
have been considered, the SEC opted instead to mandate new fund disclosures beginning in 2005
to alert investors to these potential conflicts of interest and the fund’s policies on mitigating
1 While portfolio manager behavior should be driven by the compensation he receives from the advisory firm that employs him, this compensation, as well as its structure, is not observable. We make the assumption, as is common in the literature, that the manager’s compensation is correlated with that accruing to the advisory firm.

3
them.2 Specifically, the SEC requires funds to disclose the number of other accounts
concurrently managed along with their assets under management for each fund manager with
day-to-day responsibilities for the fund. Given concern over conflicts of interest arising from
situations where families charge performance-based fees (PBFs), or incentive fees, to some client
accounts and not to others, the SEC also requires the separate reporting of the subset of these
accounts and assets that have PBFs. In addition, these accounts need to be divided into three
different categories, specified by the SEC as registered investment companies, pooled investment
vehicles, and separate accounts.3 Registered investment companies typically mean mutual funds,
not only those managed for the fund family but also those managed on behalf of another family
through a sub-advisory contract. Pooled investment vehicles include hedge funds, but also other
categories of investments, such as commingled trusts. However, pooled investment vehicles
with PBFs indicate hedge funds. Separate accounts typically include accounts managed on
behalf of large clients, such as defined benefit and defined contribution pension plans or other
institutional clients.
These mandated disclosures allow us to investigate whether the presence of performance-
based fees in other accounts outside the mutual fund industry creates potential conflicts of
interest for managers. While the focus of the literature has been specifically on side-by-side
management of mutual funds and hedge funds, conceptually a manager has an incentive to favor
whichever type of client offers him the greatest compensation, or potential for future
compensation. While we cannot observe the details of the fee contracts or know the
2 For example, see footnote 4 in Nohel et al (2010) for examples of congressional legislators advocating bans on the practice. 3 The exact wording used by the SEC is “other accounts,” but we call them “separate accounts” to better differentiate them from the other categories of assets used by the SEC, i.e. registered investment companies and pooled investment vehicles. We verify that the mean assets under management per client in this category is $197 million, suggesting this category serves clients large enough to warrant a separate account and not be pooled with other investors.

4
performance-sensitivity of each client type, the detailed SEC disclosures allow us to cleanly
measure the client base for each manager of the fund. This allows for a test of whether the type
of client affects a mutual fund’s performance, rather than assuming that only simultaneous hedge
fund clients would have an effect.
Because mutual funds are required by regulation to have symmetric incentive fees, where
performance below a benchmark index is punished to the same degree that performance above
the benchmark is rewarded, we would not expect managers with this type of client to have as
strong an incentive to transfer performance away from the fund as managers with hedge funds.
A prediction regarding mutual fund managers who also manage separate accounts, however, is
less obvious, as it is unclear whether their direct and indirect incentives more closely resemble
mutual funds or hedge funds. Because their fees are the result of private negotiations between
the advisory firm and each client and are therefore not observable, whether manager incentives
for separate accounts with PBFs are significant enough to create conflicts of interest is an open
empirical question.
From these mandated SEC filings we hand-collect details at the manager level for each
actively-managed domestic equity mutual fund from 2005 to 2011 from the top 30 largest fund
families. Due to the non-standardized nature of the accounts disclosure within mutual fund
regulatory filings, we can most accurately collect data by fund family. We choose to focus on
the largest families for two reasons. First, because these 30 largest families account for 74% of
total assets under management in the mutual fund industry as of March 2005, we capture most of
the economic activity in the industry. Second, this should lead to more powerful tests given that
previous studies find greater evidence of conflicts of interest within the largest families in the
industry (Gaspar et al, 2006; Casavecchia and Tiwari, 2016).

5
Aggregating manager-level client data to the fund level, tests of performance effects
reveal that mutual funds with at least one side-by-side hedge fund manager underperform funds
with no side-by-side managers by 9.6 bps a month, or 115.2 bps a year, using Carhart alpha.
This effect is statistically and economically significant, and similar using other performance
measures, including holdings-based measures. Our tests also reveal that negative performance
effects are unique to funds with side-by-side hedge fund managers; concurrent management of
mutual funds or separate accounts with PBFs have no such negative impact.
Further tests using a sample of funds that switch from having no side-by-side managers to
having side-by-side managers during the sample period confirm our findings. Specifically, we
find that switcher funds underperform no-side-by-side funds by 21 bps a month in Carhart alpha
after the switch, whereas they did not underperform before the switch. Moreover, analogous
tests for funds that switch to having managers with separate accounts with PBFs do not show
underperformance after the switch. Together, these results support the focus on hedge funds in
the side-by-side literature, as these are the only client type consistent with a conflict of interest.
While we can cleanly measure client type and isolate that the effect is due to hedge funds,
due to data limitations we are unable to definitively isolate the cause of the mutual fund
underperformance. Because the SEC does not require disclosure of the identity or performance
of accounts outside the mutual fund industry, we are unable to examine directly whether side-by-
side hedge funds benefit from performance transfers or favorable treatment.4 We can, however,
use a variety of data sources to explore possible explanations for the documented mutual fund
underperformance.
4 Using the 2006 HFR dataset and 2006, 2012, and 2014 TASS datasets, we are only able to match 32.5% of the side-by-side mutual funds in our sample to hedge funds managed by the same manager.

6
To distinguish whether the performance effects are driven by manager effects versus by
the organizations the managers work for, we exploit the fact that 12.2% of funds in our sample
are outsourced to subadvisers who are hired by the fund family to manage the fund. We find that
none of the other funds managed by the same advisory firms, or managed by the same family,
are measurably affected. Thus, if underperformance of the SBS fund is driven by favoritism
toward hedge funds, this finding appears to rule out that costs are borne by other mutual funds in
the same firm. This finding also suggests that any favoritism is directed by the fund manager.
We also explore whether incentives at the individual manager level can explain the
pattern of underperformance we find. Because we have a breakdown of all of a manager’s assets
by client type, we are able to measure the percentage of his/her assets that are within the mutual
fund industry. A high percentage indicates that the bulk of the manager’s compensation and
presumably their loyalties and career concerns are focused on mutual funds. We find that the
underperformance of side-by-side hedge fund management is effectively mitigated if the
manager has an above-median percentage of assets within the mutual fund industry. We also
find a similar result if the manager’s fund has a greater percentage of direct-sold assets, or a
lower percentage of broker-sold assets. Del Guercio and Reuter (2014) find that direct-sold
funds have a clientele sensitive to past risk-adjusted performance. These results suggest that
managers refrain from favoring hedge funds if they have greater concerns about negative
consequences of poor performance in their mutual fund assets. These results are also suggestive
of deliberate cross-subsidization on the manager’s part, rather than a more benign explanation.
Nonetheless, we also explore whether a manager distraction story can provide an
alternative explanation for our results. Specifically, a conflict of interest might arise simply
because a new hedge fund account competes for the managers’ limited time and attention, and it

7
is this new distraction that causes mutual fund performance to suffer. Under the assumption that
active management requires more time and resources than passive management, we test whether
the degree of active management of the mutual funds declines after the manager adds a hedge
fund. Using both tracking error and the active share measure of Cremers and Petajisto (2009),
we do not find support for this alternative, suggesting that manager distraction or effort diversion
cannot be the full explanation.
Our comprehensive manager-level data offers several advantages over those used in
previous studies, allowing us to provide a more complete picture of the extent of side-by-side
arrangements in the industry. Because our hand-collected data are from required SEC regulatory
filings, it should be both reasonably accurate and complete, and more importantly, free of bias
from the selective reporting of fund information or manager names. This aspect of our dataset
stands in contrast to previous studies that match mutual fund databases to hedge fund databases,
which are widely known to be incomplete and self-reported, in addition to having only end-of-
period manager names and not historical names. We compare our sampling procedures and
reconcile the conflicting findings in the prior side-by-side management literature.
Given our comprehensive data, we are able to definitively report the prevalence of the
harmful type of side-by-side management within the top 30 fund families that employ a little
over 700 domestic equity portfolio managers in any given year of our 2005 to 2011 sample. We
find that approximately 7% of mutual fund managers simultaneously manage hedge funds, and
these managers handle the day-to-day management in 12.4% of fund-months. Thus, a significant
percentage of funds reveal conflicts of interest due to this practice, suggesting that investors
should pay attention to SEC disclosures of funds with managers reporting assets in pooled
investment vehicles with PBFs.
8
Our analyses also take into account the features of asset management that are most often
ignored in the literature. Previous studies examining favoritism either only consider possible
cross-subsidization within the mutual fund industry or restrict the sample to funds reporting
named managers (thus excluding many team-managed funds). Because the majority of fund
managers simultaneously manage assets outside the fund industry and in recent years
approximately two-thirds of funds are managed by teams, ignoring these pervasive
organizational structures of asset management could affect inferences.
2 Data
2.1 Datacollection
We obtain data on a fund manager’s other accounts under management from the Statement of
Additional Information, which is a required supplementary document to the fund’s prospectus
filed with the SEC (form N-1A with form type 485BPOS or 485APOS). The SEC requires all
funds to report this information every fiscal year starting with filings after February 28, 2005.
Because of the complexity of the data collection effort required, we focus on the funds from the
largest 30 fund families in CRSP, ranked by total assets of domestic equity funds under
management, as of March 31, 2005.5 Specifically, for these 30 families we hand collect accounts
under management information for all managers of active domestic equity mutual funds
available in the CRSP Survivor-Bias-Free U.S. Mutual Fund Database from 2005 to 2011.
These families represent 74% of actively-managed domestic equity industry assets. We identify
5 Hand-collection by family results in the most accurate data due to differences across families in reporting conventions. For example, some families report information on other managed accounts and whether the manager has accounts with PBFs in easy-to-collect tabular form, while other families report this information in text form, including in footnotes. Collecting the data by family minimizes omissions and errors due to families’ tendencies to use the same format for all of their funds. We also employ numerous data checks that give us a high degree of confidence in the integrity of the data.
9
domestic equity funds by relying on Lipper objective codes (CA, EI, G, GI, I, MC, MR, and SG)
and eliminate index funds based on the funds’ names. In cases where the Lipper code is missing
in a quarter we use the codes from surrounding quarters. We further drop variable annuities and
target date funds from our sample, since these funds include a large component of fixed income
investments in their portfolios.6 We include all funds in CRSP that exist from 2005 to 2011 that
meet our data filters from these 30 families. Thus, we add funds as these families start new
funds or acquire existing funds from other families during the sample period, and retain funds
until they merge or liquidate.7
In order to match CRSP mutual funds to their corresponding SEC filings, we obtain the
links to fund prospectuses through quarterly indexes provided by the SEC.8 The matches are
implemented based on exact name or ticker matches.9 For any remaining unmatched funds, we
identify close name matches and manually verify whether they are correct. Our matching
procedures result in a success rate of 97% of the CRSP funds in our sample.
For each fund-year observation, we hand collect the names of all portfolio managers
“responsible for the day-to-day management of the fund” as required by the SEC and reported in
the filings. For each manager-fund-year observation, we record the number of other accounts
concurrently managed along with their assets under management, both of which are required by
the SEC to be put in one of three categories: registered investment companies, pooled investment
6 Our regression results are stronger if we include variable annuities and target date funds in our final sample. 7 We use MGMT_CD in CRSP to assign funds to families (or if missing, mgmt_name). When a family in the original list of top 30 merges with another family in the top 30 we include those funds under the surviving family’s brand (e.g., Smith Barney Funds were acquired by Legg Mason Funds in 2006 and both were in our original list in 2005). But, when a family merges with a family outside our original list of top 30, we follow those funds only until the merger becomes effective (e.g., Merrill Lynch funds are acquired by Blackrock, which was not in our original list of top 30, and therefore not added to the sample). 8 Available at ftp://ftp.sec.gov/edgar/full-index/ 9 Since February 6, 2006, the SEC requires mutual funds to include tickers in their filings. We use a computer script to obtain tickers directly from the SEC Edgar website. Note that even though the SEC provides a listing of fund tickers on its website, this listing does not contain historical data.
10
vehicles, or separate accounts. The SEC also requires the separate reporting of the subset of
these accounts and assets that are subject to performance-based fees (PBFs). Families typically
include an explicit statement that no accounts have PBFs if this is the case. We also record the
effective date at which the information on accounts managed is applicable. The effective date is
typically three to four months before the filing date, which is why our final sample includes
observations for partial years in 2004 and 2011. We provide a sample filing in Appendix A.
The SEC-required categories allow us to paint a picture as to the nature of the assets each
manager controls (possibly jointly with other managers as part of a team), and via the
information on PBFs, whether their incentives might differ across their managed accounts
(clienteles). Registered investment companies typically mean mutual funds, but they could be
mutual funds managed for the fund family or managed on behalf of another family through a
sub-advisory contract, or as the underlying funds in variable annuity contracts. We will use the
more common term of mutual funds throughout the rest of the paper, and distinguish between
mutual funds with and without PBFs. Pooled investment vehicles include hedge funds, but can
also include commingled trusts or funds managed for sale to investors outside the U.S. Thus, we
use the label hedge funds only when pooled investment vehicles have PBFs, and use the more
general term of pooled investment vehicles otherwise.10 Separate accounts are typically
managed on behalf of defined benefit and defined contribution pension plans, insurance
10 We verify that the SEC category “pooled investment vehicle with PBFs” is synonymous with hedge funds in the following way. We take the list of 90 side-by-side domestic equity mutual funds in 2005 and 2006 from Nohel, Wang, and Zheng (2010) and retrieve the SEC prospectus filings (while some funds are already in our sample, others are in smaller families below the top 30). These are the two years of their sample that coincide with the availability SEC-required disclosures. We confirm that all but 12.2% (11 out of 90) of the mutual funds that they report as having side-by-side hedge fund managers are listed in the SEC filing as having “pooled investment vehicle accounts with PBFs”. One possible reason for the 11 cases where the filings explicitly state that their managers do not have any other accounts with PBFs is if the managers reported in the hedge fund databases are principals of the hedge funds but do not necessarily assume the day-to-day operation of the funds. The SEC prospectus only requires disclosures of other accounts in which the mutual fund manager assumes day-to-day responsibility. We thank Tom Nohel, Z. Jay Wang, and Lu Zheng for generously sharing their data.

11
companies, foundations, high-net-worth individuals, trusts, wrap account clients or other
institutional clients. We distinguish between separate accounts with and without PBFs.
2.2 Side‐by‐sidemanagement
Regulators have been concerned about serious conflicts of interest inherent in the simultaneous
management of mutual fund and hedge fund assets since at least 1971.11 Both regulators and the
academic literature naturally focus on side-by-side management of mutual funds and hedge funds
given the stark differences in the typical fee structure. Because the typical incentive fee
component of hedge fund compensation is large (e.g., 20%), managers have an incentive to favor
the fund that will pay a large bonus for outperformance, to the potential detriment of their other
clients.
While side-by-side hedge fund and mutual fund management has received the most
attention, the final SEC rules addressing potential conflicts of interest have taken a much more
general view. Conceptually a manager has an incentive to favor whichever type of client offers
him the greatest compensation, or potential for future compensation. This logic manifests in the
required new disclosures the SEC instituted in 2005 and in 2011. The final rule effective in 2005
requires mutual fund managers to disclose information on any assets under management with
performance-based fees (PBFs), not just hedge fund assets. Similarly, in 2011 the SEC requires
investment advisers to file a supplement to Form ADV disclosing whether the adviser charges
PBFs. In cases where the adviser charges PBFs to some client accounts and not to others, the
adviser must disclose the potential conflicts of interest, as well as the procedures and controls the
11 “In most instances the compensation arrangements provided by unregistered hedge funds are far more favorable to the investment manager per dollar of assets managed than the compensation provided for similar services by registered investment companies or other classes of accounts within an advisory complex. Here, as in other situations where differing compensation arrangements exist, there are potentially serious conflicts of interest.” (Institutional Investor Study Report of the Securities and Exchange Commission, Summary Volume, Part Two, Chapters IV-IX, 1971. Available at www.sechistorical.org)
12
adviser uses to address these conflicts.12 Thus, in both of these disclosures, any managed
accounts with PBFs are subject to disclosure, rather than limiting disclosure to simultaneous
management of hedge fund and non-hedge fund assets.
Because PBFs for mutual funds are required by regulation to be symmetric (fulcrum fees)
and are not particularly lucrative for funds (Elton et al., 2003), we would not expect this type of
account to provide a strong incentive to favor. In contrast, Rule 205-3 under the Investment
Advisers Act of 1940 gives investment advisers discretion to privately negotiate the structure of
PBFs with their institutional and high net worth individual clients without regulation, explicitly
allowing them to charge fees based on a share of account capital appreciation, provided that
clients meet a $2 million net worth minimum. Due to the confidential nature of these fee
arrangements, we cannot confirm whether separate account incentive fees are asymmetric or
closely resemble those of hedge funds. Therefore, it is an open question as to whether a mutual
fund manager simultaneously managing separate account assets with PBFs is likely to affect the
fund’s performance.
Because of the mandatory nature of the SEC filings and the comprehensiveness of our
sample of managers within the top 30 families, we believe our sample provides an accurate
picture of the prevalence of side-by-side management in the fund industry. Detailed SEC
disclosures, which cleanly disaggregate a mutual fund manager’s accounts by both client type
and whether they charge PBFs, allows us to test whether a mutual fund manager has the
strongest incentive to favor his hedge fund clients, relative to his other types of clients. In
12 Specifically, in Part 2A of Form ADV (Investment Adviser Brochure), “Item 6. Performance-Based Fees and Side-By-Side Management” is a required item disclosure. See SEC Release No. IA-3060.

13
contrast, the previous literature assumes that hedge funds are the only client type to induce a
conflict of interest for the manager or investment adviser.
Moreover, because the previous literature’s sample period pre-dates the availability of
mandatory disclosures that begin in 2005, they were limited to identifying side-by-side managers
by matching names in mutual fund and hedge fund databases. Nohel et al (2010) and Chen and
Chen (2009) compare fund manager names in CRSP or Morningstar Principia to names in a
hedge fund database. As these authors acknowledge, the resulting sample may be incomplete or
biased given that hedge fund databases are well known to be populated with managers who opt
in voluntarily and self-report data, and tend to have only end-of-period manager names and not
historical names (Nohel et al, 2010). Moreover, mutual fund manager names in CRSP and
Morningstar Principia are also incomplete and prone to error (Patel and Sarkissian, 2014). For
example, whereas all funds in our sample list managers by name in the SEC filings, in the CRSP
database 27% of these funds only have ‘team-managed’ listed in the manager field. Thus, a
significant number of side-by-side managers could potentially be missed by comparing names in
databases, suggesting the number of funds with side-by-side relationships is likely
underestimated by this sampling method.
Cici et al (2010) identify overlap at the advisory firm level between mutual fund and
hedge fund databases. They consider all of the mutual funds from an adviser offering a hedge
fund to be classified as side-by-side funds. This method likely overstates the extent of side-by-
side relationships, as most families have much less than 100% of their funds managed by side-
by-side managers. For example, Franklin Templeton appears in hedge fund databases, and thus
simultaneously manages both mutual funds and hedge funds, but our sample shows that only 6%
of Franklin Templeton mutual funds are managed by side-by-side managers.
14
In a later section 3.5, we revisit the previous literature that arrives at opposite conclusions
regarding the effect of side-by-side management on mutual fund performance. We discuss how
their sampling procedures likely underlie the differences in results.
2.3 Summarystatisticsonside‐by‐sidemanagementandfundcharacteristics
Our hand-collected dataset consists of 9,996 manager-fund-year observations. Table 1 contains
summary statistics on the prevalence of side-by-side management in this sample. We report
summary statistics each year for the set of unique fund managers. All summary statistics in
Table 1 are reported as of the year of the effective date (fund fiscal year-end date) rather than the
year of the filing date. Funds report information on accounts managed at the manager level and
exclude the assets of the fund itself in assets under management.13 Thus, by including unique
managers in each year we avoid double-counting since for a manager of multiple funds the
information on the other accounts and assets should be the same at all his reporting funds.14
Table 1 Panel A contains a summary of the percentage of managers who manage portfolios other
than the reporting fund itself and the assets under management of these other portfolios. Note
that the assets under management include assets assigned to the manager as part of a team and
may not be his sole responsibility.
The first column of Table 1 Panel A shows that the top 30 fund families by assets
employed over 700 unique domestic equity actively managed fund managers in any given year in
our sample period. The next column shows that it is quite rare for any manager to just manage a
single fund. About 95% of fund managers have additional accounts, and 88% of all fund
13 Some families state that the reported assets include the fund itself. In this case we subtract the fund’s assets from the total assets managed in mutual funds. 14 There may be slight differences in data for a manager in a year, due to differences in timing as well as in the sizes of reporting funds. We average all observations for a manager in a year to arrive at manager-year level data for this table.

15
managers manage additional mutual funds, averaging $14.5 billion in mutual fund assets on
average. Interestingly, it is reasonably common for managers to have day-to-day responsibility
for assets outside the mutual fund industry. Fifty-seven percent of fund managers manage other
pooled investment vehicles and 67% manage other separate accounts. Of these managers with
some outside assets, the pooled investment vehicle assets average $1.9 billion and the separate
account assets average $5.4 billion. On average, 76% of a manager’s total assets under
management are mutual funds, and therefore 24% are outside the fund industry in pooled
investment vehicles and separate accounts. The year by year averages suggest that these
percentages are fairly stable throughout our sample period.
Table 1 Panel B contains manager-level information on the prevalence of PBFs and the
assets under management for accounts with PBFs. We find that a little over one-quarter of the
managers manage any assets with PBFs. The next three columns show that PBFs are more
common in mutual funds and in separate accounts, where approximately 12.5% and 15.4% of
managers have them, respectively. Only 7% of all managers manage hedge funds. Note that the
three categories sum to over 26.5%, the percentage of managers with any type of PBFs,
indicating that there are managers who concurrently have multiple types of assets with PBFs.
The average assets in the hedge fund category ($262 million) are relatively small
compared to the mutual funds ($3.1 billion) and separate accounts ($1.62 billion) with PBFs, but
are relatively close to the average side-by-side hedge fund assets of $292 million in 2005
reported by Nohel et al (2010) and the average hedge fund assets in TASS from 1995-2010
($211 million) reported by Lim et al (2016). The similarity of these numbers suggests that the
SEC category of pooled investment vehicles with PBFs correctly captures side-by-side hedge
fund assets. In terms of relative significance, the percent of hedge fund assets relative to a

16
manager’s total assets under management is only 2.5%, on average, for managers with this type
of account.
Even though the size of hedge fund assets is relatively small compared to other accounts,
a manager’s incentive to favor hedge fund clients over mutual fund investors may still be
significant. These incentives are driven not only by the explicit high-powered compensation
structure but also by the implicit indirect incentive structure identified in Lim et al (2015). For
example, they estimate that for each incremental dollar earned by hedge fund investors, the
average manager expects to receive 16 cents from incentive fees and the increase in value of
their managerial ownership stake. However, the present value of expected rewards for
performance accruing to the manager from inflows and growth in future investments (indirect
incentives) is an even larger component of their compensation. Here, an incremental dollar
earned by hedge fund investors translates into 23 cents for the average manager. Notably, they
also estimate the indirect incentives for mutual fund managers and find that they range from 12%
to 63% as large as those for hedge fund managers, depending on model and parameter choices.
These estimates imply that a manager with both types of clients would gain a much larger reward
per unit of performance in the hedge fund than in the mutual fund.
Massa et al (2010) and Bar et al (2011) document that the percentage of mutual funds
with a single-manager declined, while the percentage with a team of managers rose, from 1994
to 2004. Patel and Sarkissian (2014) show that this trend continued until their sample ended in
2010, when 71% of funds have multiple managers. Table 2 contains a summary of our sample
where we also find pervasive team management. Unlike Table 1 which uses data at the unique
manager-year level, Table 2 uses fund-manager-year observations to document trends in single-
manager funds and team-managed funds over time. The typical fund in our sample has 2.4

17
managers and only 40% of funds have a single manager. Comparing our numbers to those of
Patel and Sarkissian (2014) who examine a broader sample of funds suggests that the top 30
families in our sample have similar rates of team management to the full sample. In 2010 we
find that 35% of funds have a single manager, whereas they report 29%. Similarly, they report
that 25% of funds have four or more managers, while we find that 23% of funds of the top 30
families have four or more managers.
Table 3 reports summary statistics at the fund level after we match our hand-collected
data with CRSP. To arrive at this sample, we first average manager-level data across all
members of a team to obtain fund-year observations. We then merge these yearly data to CRSP
monthly returns by matching the effective date (fiscal year-end date) to the following 12 months
of CRSP returns, or until the next effective date, whichever is earlier.15 Since Evans (2010)
shows that fund performance is subject to incubation bias, we eliminate fund months with less
than 24 months since inception and with total net assets below $5M in the previous month. We
eliminate all observations with missing values in fund-level characteristics used as control
variables in our regressions. Our final sample consists of 38,459 fund-month observations from
2005 to 2011.
To generate our main variables of interest indicating that a mutual fund’s managers
simultaneously manage other accounts with PBFs, we divide funds into four mutually exclusive
categories, which allow us to test whether the incentives provided by PBFs in certain types of
accounts have any impact on the performance of the reporting fund. Mutual fund w/ PBF only is
equal to 1 if any of the fund’s managers have PBFs only in mutual funds and not in any other 15 For example, if the effective date of the manager information is November 2008, we match this observation to CRSP observations that run from November 2008 to November 2009 or the next available effective date, whichever is earlier. Mutual funds typically have the same fiscal year-end date every year, but sometimes these year-end dates can be changed, and thus the effective date for reporting data may be different across years.

18
category of client, and equal to 0 otherwise. Separate acct w/ PBF – no hedge fund is equal to 1
if any of the fund’s managers have PBFs in separate accounts but not in hedge funds. Hedge
fund – no separate acct w/ PBF is equal to 1 if any of the fund’s managers have hedge funds, but
do not have PBFs in separate accounts. The last mutually exclusive category, Hedge fund +
separate acct w/ PBF is equal to 1 if any of the fund’s managers have both hedge funds and
separate accounts with PBFs. The indicator variable Any PBF is equal to 1 if any of the fund’s
managers has PBFs in any of the four categories.
The summary statistics in Table 3 indicate that 35.2% of fund-months have PBFs of any
type, and the largest category of client type within these managers are those with separate
accounts PBFs and no hedge funds. Nearly 12% of fund-months are in this category. The
category for funds with managers that only have mutual funds with PBFs, and thus have only
symmetric incentive fees in their other accounts comprise 10.8% of fund-months. Finally,
12.4% of fund-months have managers who also manage hedge funds; 6.5% with only hedge
funds and 5.8% with both hedge funds and separate accounts with PBFs. These statistics suggest
that a significant percentage of funds have managers who simultaneously manage assets with
incentive fees that could potentially present a conflict of interest. In the next section, we
examine the evidence for whether any of these incentives affect fund performance.
3 Results
3.1 Impactofsidebysidemanagementonmutualfundperformance
We explore the performance of mutual funds with side-by-side managers in a regression setting.
For each performance measure, we estimate the following panel regression using a set of control
19
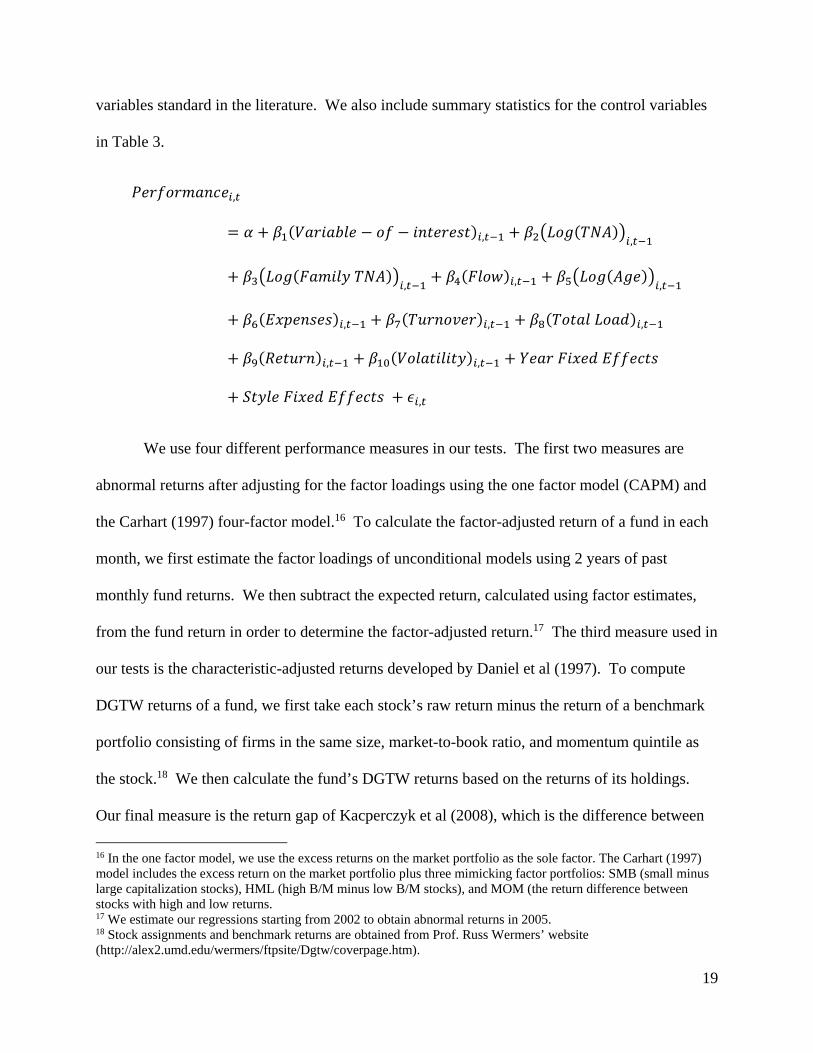
variables standard in the literature. We also include summary statistics for the control variables
in Table 3.
,
, ,
, , ,
, , ,
, ,
,
We use four different performance measures in our tests. The first two measures are
abnormal returns after adjusting for the factor loadings using the one factor model (CAPM) and
the Carhart (1997) four-factor model.16 To calculate the factor-adjusted return of a fund in each
month, we first estimate the factor loadings of unconditional models using 2 years of past
monthly fund returns. We then subtract the expected return, calculated using factor estimates,
from the fund return in order to determine the factor-adjusted return.17 The third measure used in
our tests is the characteristic-adjusted returns developed by Daniel et al (1997). To compute
DGTW returns of a fund, we first take each stock’s raw return minus the return of a benchmark
portfolio consisting of firms in the same size, market-to-book ratio, and momentum quintile as
the stock.18 We then calculate the fund’s DGTW returns based on the returns of its holdings.
Our final measure is the return gap of Kacperczyk et al (2008), which is the difference between
16 In the one factor model, we use the excess returns on the market portfolio as the sole factor. The Carhart (1997) model includes the excess return on the market portfolio plus three mimicking factor portfolios: SMB (small minus large capitalization stocks), HML (high B/M minus low B/M stocks), and MOM (the return difference between stocks with high and low returns. 17 We estimate our regressions starting from 2002 to obtain abnormal returns in 2005. 18 Stock assignments and benchmark returns are obtained from Prof. Russ Wermers’ website (http://alex2.umd.edu/wermers/ftpsite/Dgtw/coverpage.htm).

20
the fund’s actual gross return and the gross return implied by the fund’s lagged reported
holdings. This measure is intended to capture unobservables, such as the value added by
skillfully timed stock picks or the value destroyed by poor trade executions or agency costs.
Our regressions include the following lagged control variables: the logarithm of fund
size, the logarithm of family assets, past 12 month average fund flows, the logarithm of fund age,
expense ratio, turnover, total load fees, 12-month past fund returns, and 12 month volatility of
fund returns. Among others, Chen et al. (2004), Sirri and Tufano (1997), Wermers (2003), Pollet
and Wilson (2008) show that these fund characteristics influence future fund performance. The
standard errors for all panel regressions are clustered at the fund level. Table 4 Panel A presents
the coefficient estimates of these regressions with our four performance measures as the
dependent variables: CAPM alpha, Carhart alpha, DGTW return, and return gap. As an
exploratory step, we first use the Any PBF indicator as the independent variable of interest to
investigate the performance of mutual funds with at least one manager with any type of PBFs in
other accounts managed. The results shown in Panel A indicate that these funds underperform
the no-PBF funds by 8.3 bps per month in CAPM alpha and 4.3 bps in Carhart alpha, and 2 to 3
bps for the holdings-based measures.
In Panel B of Table 4, we use the four mutually exclusive indicator variables to evaluate
whether a particular type of PBFs in a manager’s other accounts has a greater effect on fund
performance. The omitted category in the regression is funds with no PBFs at all. Of the four
indicator variables, only the coefficient estimates of the categories with hedge funds are negative
and statistically significant, consistent across all four performance measures. In contrast, the
coefficients for Mutual fund w/ PBF only and Separate acct w/ PBF – no hedge fund are
insignificant and close to zero. These results suggest that only hedge fund client accounts have a
21
negative impact on mutual fund performance, consistent with the idea that these high-powered
incentive fees lead managers to strategically shift returns from mutual funds to hedge funds. The
results also imply that separate accounts appear to induce direct and indirect incentives more
similar to mutual funds than to hedge funds, and that the result in Panel A for Any PBF is driven
by the sub-sample of managers with hedge funds.
In Table 5, we combine the two variables Hedge fund – no separate acct w/ PBF and
Hedge fund + separate acct w/ PBF into one indicator variable, SBS, which is equal to 1 if the
mutual fund’s managers also have hedge funds (side-by-side mutual funds, or SBS, from here
forward), regardless of whether they also have PBFs in other types of accounts. Once again, we
control for the other mutually exclusive categories of accounts with PBFs, so the omitted group
is funds with no PBFs. The results confirm our prior finding that side-by-side hedge fund
management harms mutual fund performance. The first four columns of Table 5 show that
mutual funds with side-by-side hedge funds underperform peer funds with no PBFs by 18.3 bps
per month (CAPM alpha), 9.6 bps (Carhart alpha), 8.7 bps (DGTW), and 6.6 bps (return gap).
Across all four performance measures, the effects are large in economic magnitude (between
79.2 and 219.6 bps per year) and statistically significant at the 1% level.
Even though on average 12.4% of fund-months in our sample have managers with side-
by-side hedge funds, there is significant variation across families with regards to how many
funds are managed by side-by-side managers. Appendix C shows the names of families ranked
by percent of SBS funds. In three families the percent of funds with SBS managers ranges
between 90% and 100%, whereas eight families have no funds with SBS managers. Fidelity has
a single domestic equity fund with SBS managers. In some families there is substantial within-
family variation with regards to the SBS variable, and only 9 families have no variation. The

22
final four columns of Table 5 contain the same regressions, but also include family fixed effects.
The results are similar in sign and significance, and for three of the performance measures the
magnitude of the underperformance is even larger than without family fixed effects. In sum,
mutual funds with SBS hedge fund managers appear to significantly underperform both peer
funds without any accounts with PBFs, and non-SBS funds within their same family.
For ease of interpretation and exposition, we use indicator variables in the regressions to
capture side-by-side management by mutual fund managers. However, our data also allow us to
examine the effect of the size of side-by-side hedge funds on mutual fund underperformance. In
Appendix D, we report the results of regressions using continuous variables indicating the size of
other accounts concurrently managed. We use three variables corresponding with the three client
types: Log (TNA of hedge funds), Log (TNA of mutual funds w/ PBF), and Log (TNA of
separate accounts w/ PBF). These variables are not mutually exclusive. The results again
confirm our prior finding that only the side-by-side management of hedge funds leads to
underperformance in mutual funds. Additionally, larger hedge funds lead to more significant
underperformance for the mutual funds, consistent with the idea that managers have stronger
incentives to shift performance away from mutual funds when the potential payoff on the hedge
fund side is greater.
3.2 Evidencefromfundsthatchangeside‐by‐sidemanagementstatus
To provide more convincing evidence on the effect of side-by-side management, we focus on the
sample of funds that switch from having no SBS managers to having SBS managers during the
sample period. We compare the performance of this group, the “switchers,” to the group of
funds with no SBS managers, both before and after the switch.

23
We identify a total of 45 switcher funds during the sample period. We define the date of
the switch as the effective date listed in the SEC filing in which the fund’s status changes from
that of the previous effective date. The variable Pre-SBS switch is equal to 1 for switcher funds
in all fund-months before the switch date, whereas the variable Post-SBS switch is equal to 1 for
switcher funds in all fund-months after the switch date. Once again, we control for the other
mutually exclusive categories of accounts with PBFs, so the omitted group is funds with no
PBFs. Funds that switch multiple times or are SBS throughout the entire sample period are
deleted, implying that the omitted category and control group are funds with managers without
any type of PBF account. Note that since we only have annual observations of the side-by-side
status of fund managers, the switch might actually occur before the effective date, in which case
we would underestimate the magnitude of any effect.
We also classify the switchers into two groups based on the cause of the change in status;
31 funds switch because the current mutual fund managers add one or more hedge funds to the
assets they manage, whereas the remaining 14 funds switch because the funds add hedge fund
managers as new mutual fund managers. While we expect to see differences in fund
performance associated with both types of events, the change in side-by-side status of the
continuing management team is likely to be a cleaner test. In these cases, presumably the only
change is that one or more of the mutual fund managers now manage hedge funds that offer
more lucrative incentive fees. Testing for a separate effect for continuing managers allows for a
comparison of performance relative to the peer group before and after the switch for the same
group of funds and managers.
Table 6 Panel A presents the results of our tests. Note that the coefficients of the control
variables are qualitatively similar to those in earlier tables, and are omitted from the table to

24
enhance readability. The first four specifications in this table include style and year fixed
effects, while the last four specifications include year and family fixed effects. We find that the
coefficients on Post-SBS switch are negative and statistically significant at the 1% level across all
four performance measures, indicating that continuing managers who begin to manage hedge
funds underperform their peer funds post-switch. The economic magnitudes are even larger than
our earlier finding. Funds with continuing managers that switch status to SBS underperform
non-SBS funds by about 20 bps per month in Carhart alpha and range from 5.7 to 31 bps per
month underperformance for the other measures. The indicator variable New manager is equal
to 1 if the cause of the switch is due to adding hedge fund managers as managers new to the
fund. Interaction terms allow us to capture the differential effects of the two types of switch on
fund performance. The non-significance of the interaction term Post-SBS switch * New manager
shows that the group of switcher funds with new managers also experience similar levels of
underperformance after the switch. The coefficients for Pre-SBS switch and the interaction term
with New manager show that funds do not underperform before the switch (with the exception of
return gap). Moreover, we can reject the hypothesis that the coefficient on the Pre-SBS switch is
equal to the coefficient on the Post-SBS switch variable at the 10% level or better across
performance measures (with the exception of return gap once again.) Overall, these results
confirm our prior finding that high-powered incentives inherent in hedge fund management lead
to underperformance for SBS mutual funds. We draw similar inferences in specifications with
and without family fixed effects.
We also perform an analogous test for performance effects within a sample of funds that
switch from having no separate accounts with PBFs to having separate accounts with PBFs and
report the results in Table 6 Panel B. Similar to the above analysis, we test for differences in the

25
performance of this group before and after the switch relative to the control group of funds with
managers without any type of PBF account. Because both the hedge funds and the separate
accounts have PBFs in these samples of switchers, in comparing Panel A to Panel B we are
testing whether the client type is what matters. Of course, the client type in this case is also
likely correlated with the amount of compensation a manager receives per unit of performance.
Table 6 Panel B contains the results of the separate account switcher analysis, with the
same set of fixed effects as in Panel A. In contrast to SBS hedge fund switchers, we do not find
any underperformance after the switch due to an addition of separate accounts with PBFs. In
contrast, these switcher funds underperform non-PBF funds before the switch, but not after the
switch. We find statistically significant improvement in performance from before to after the
switch in three out of the eight specifications. Importantly, Panel B contrasts sharply with the
statistically significant decrease in performance observed for mutual funds with managers adding
hedge funds. In sum, the switcher analysis confirms our cross-sectional findings from Table 5.
Namely, mutual fund underperformance appears to be isolated to funds where managers
simultaneously manage hedge funds. Managers with other client types, including mutual funds
with PBFs or separate accounts with PBFs, are not associated with underperformance.
3.3 IstheunderperformanceofSBSmutualfundsdrivenbyfamily,
investmentadviser,orfundmanagereffects?
One explanation for our results is that SBS managers strategically shift performance from
the mutual funds they manage to their more lucrative hedge funds via some deliberate cross-
subsidization practices. Before exploring alternative explanations for the observed return
patterns, we test whether underperformance is also detectable at other mutual funds managed
within the same family. For example, under the hypothesis supported in the tests in Gaspar et al

26
(2006), families direct managers to maximize the family’s profits by favoring the more lucrative
funds, such as the ones that provide the most fee income. Using this same logic, if families
obtain higher profits from their hedge fund business, one might expect favoritism toward hedge
funds and away from either all of their mutual funds, or away from the “low-value” funds in the
family. We explore these possibilities in this section.
The analysis in Tables 5 and 6 consistently show that the underperformance of mutual
funds with SBS hedge fund managers is either similar or larger when family fixed effects are
included, implying that the results are not driven by an unobserved family characteristic. This
result also suggests that the underperformance is concentrated in the particular mutual fund
managed by a SBS hedge fund manager, as opposed to being spread across other funds in the
same family. To explore this further, we add a new variable to the main panel specification of
Table 5. Namely, we define the indicator variable SBS at the family level as equal to 1 if any
fund in that family is a SBS fund that month (i.e., if the family has a SBS fund in some other
time period but not in the current month this variable would equal 0).
To further distinguish whether the performance effects are driven by manager effects
versus by the organizations the managers work for, we exploit the fact that 12.2% of fund-
months in our sample are managed by subadvisers.19 In these cases, the advisory firm employing
the portfolio manager (e.g., Wellington) differs from the family (e.g., Hartford) distributing the
fund (e.g., Hartford Capital Appreciation) to the investing public. . We define the indicator
variable SBS at the adviser level as equal to 1 for any fund managed by the same advisory firm
employing at least one SBS hedge fund manager that month (e.g., Wellington). In this example,
19 We obtain information on the name of the investment advisory firm that employs the portfolio manager directly from the same fund prospectus filing where we obtain the manager-level information on other managed accounts. Thus, we have very accurate information on the identity of the adviser and subadviser of the fund (if subadvised).

27
other funds in the Hartford family would have a 0 value for SBS at the adviser level and have a 1
for SBS at the family level.
Table 7 repeats the specifications in the first four columns of Table 5, with the addition of
the variables defined above SBS at the family level and SBS at the adviser level. While the SBS
indicator continues to be significant at the 1% level and large in magnitude, neither of the
additional indicator variables is significant, which implies that underperformance is isolated to
the SBS fund itself, and other funds at the same family or advisory firm are not measurably
affected. The results suggest that any potentially deliberate cross-subsidization is occurring at
the direction of the fund manager rather than the advisory firm.
To rule out that the underperformance of SBS funds is because they are the “low value”
funds within the family, we use the definitions in Gaspar et al and examine the overlap between
SBS funds and “low value” funds. Specifically, we independently rank funds within each family
on fund expense ratio (including loads), Year-to-Date (YTD) raw returns (since January of
current year), and fund age, and categorize the bottom quartile of funds as “low-value” funds
(i.e., the lowest fee funds, the lowest YTD return funds, and the oldest funds). Since we find the
strongest underperformance after a fund switches from a non-SBS fund to a SBS fund, we
examine the overlap between “low-value” funds and SBS funds in the month prior to the switch.
Using the three measures of “low-value” funds, we find that 27%, 27%, and 20% of SBS funds
are also “low-value” funds according to the fee, YTD, and age measures, respectively. These
percentages are similar to the expected value of 25%, suggesting little overlap between the two
groups. If anything, older funds are underrepresented among SBS funds. In addition, we repeat
the specifications in Table 5 after adding indicator variables for “low-value” funds. With no
28
change in inferences; we continue to find quantitatively similar underperformance of SBS funds
(not reported).
3.4 Manager‐levelincentivestonotengageinfavoritism
We expect a manager to have a greater propensity to shift performance away from the
mutual fund toward the hedge fund if there were fewer consequences of doing so on the mutual
fund side. On the other hand, if the manager were to suffer substantial outflows or significantly
damage her reputation as a mutual fund manager, she might be more reluctant to risk the
negative consequences of favoring other clients. In this section, we investigate whether proxies
for manager-level incentives to avoid poor performance in the mutual funds they manage can
mitigate the underperformance of SBS hedge fund managers.
Earlier we show that there is substantial variation across fund managers in the extent to
which they focus on the mutual fund industry. Specifically, the SEC data allow us to calculate
the percentage of a manager’s total assets under management held in mutual funds (including the
TNA of the fund itself). We then average this across all members of the fund’s management
team to arrive at a fund-month level measure. We hypothesize that if a management team
receives the bulk of their compensation from mutual funds and are consequently relatively more
concerned about their reputation as mutual fund managers, there are greater incentives to allocate
effort and performance to mutual fund assets.
Table 8 provides supportive evidence for this hypothesis. We define the indicator
variable Manager(s) focused on mutual funds as equal to 1 if the percentage of total assets under
management held in mutual funds, averaged across all managers of the same fund, is higher than
the median percentage across all funds in that month. We then interact SBS with this indicator

29
variable. The coefficient on the interaction term is positive, large in magnitude, and statistically
significant at the 1% level (with the exception of the return gap measure). The coefficients
indicate that for some performance measures, SBS underperformance is completely offset when
its fund managers are focused on the mutual fund industry, relative to the focus of managers in
the median fund. This suggests that when managers receive most of their compensation from the
mutual fund industry, they have little incentive to favor hedge funds. Given that this measure
varies substantially within families, this is also consistent with the relative importance of
manager-level incentives to favor certain clients.
Another reason managers might want to avoid harming their mutual fund performance is if
they consequently suffer a large loss of flow. In contrast, if a manager has a clientele relatively
insensitive to poor performance, he will suffer little punishment in terms of lower compensation
from shifting performance to other clients. Del Guercio and Reuter (2014) find that direct-sold
mutual funds tend to have a clientele that is significantly more sensitive to past risk-adjusted
performance than that of broker-sold mutual funds. Consequently, they find evidence supporting
the hypothesis that managers of direct-sold funds have a greater incentive to generate alpha on
behalf of mutual fund investors. In our context, we would expect that managers of direct-sold
mutual funds to have a much weaker incentives to shift performance away from mutual funds
and toward hedge funds.
Table 9 contains the results of regressions similar to Table 5, where we add an indicator
variable, Direct-sold, which is equal to 1 if at least 50% of the fund’s TNA is distributed through
the direct-sold segment. The interaction term SBS*Direct Sold is the variable of interest. We
find this term is positive and significant at the 10% level or better for all performance measures
except for CAPM alpha. Similar to the SBS*Manager focused on mutual funds interaction, we
30
find that the positive effect completely offsets the negative performance effect of SBS
management.
In sum, we find that two proxies for a manager’s incentive to not jeopardize their
performance or reputation within the mutual fund industry help explain variation in
underperformance of SBS funds. This suggests that the average underperformance we find is
due to deliberate actions by the fund manager. Nonetheless, we explore a more benign
alternative explanation in section 3.6.
3.5 ReconcilingthefindingsofthepreviousSBSliterature
The previous literature has arrived at different conclusions on the effect of SBS
management on mutual fund performance. We believe our sample of SEC mandated disclosures
can provide new insights as to how differences in sampling methodologies can lead to different
results. To understand this, we replicate the sampling methodologies in Nohel et al (2010) and
Cici et al (2010) within the universe of funds from the 30 largest families in the 2005 to 2011
period, and compare results using these samples. Specifically, we create two indicator variables
Nohel et al SBS and Cici et al SBS that are designed to replicate the definitions of a SBS mutual
fund used in their papers within the universe of our sample of funds and families.20
Nohel et al SBS is equal to 1 if a fund manager name in either the Lipper/TASS or Hedge
Fund Research databases (2006, 2012, and 2014 versions of these databases) match a fund
manager name in the CRSP mutual fund database. Thus, managers who deliberately choose not
to self-report to one of these commercial hedge fund databases, or mutual fund managers at
funds listed in the CRSP database as “team managed,” will not be identified as SBS fund 20 Both of these papers identify hedge fund and mutual fund database matches without any restrictions on the size of the family. Nohel et al also consider all types of mutual funds and do not restrict to domestic equity funds. We believe we are accurately capturing their sampling methodologies within our sample period and universe of funds.
31
managers using this method. Moreover, this method will miss any manager who precedes the
manager listed in the last period of the database when names are provided, as historical manager
changes are unobservable. Relative to the SEC disclosures, we find that these limitations lead to
an incomplete sample that underestimates the extent of SBS management. Only 42% of SBS
fund-months, according to SEC data, are identified using this sampling methodology.
Cici et al (2010) identify their sample at the advisory firm level, and consider all mutual
funds at advisory firms that offer hedge funds as SBS funds in order to avoid the bias induced by
the selective reporting of only certain funds in hedge fund databases. They identify whether
advisory firm names in one of several commercial hedge fund databases or directories match
advisory firm names in the CRSP mutual fund database.21 Given that we do not have access to
all of their hedge fund data sources, we use our SEC list of advisory firms offering both mutual
funds and hedge funds and assume that they would identify these same firms. Cici et al SBS is
equal to 1 for every mutual fund offered by the same advisory firm in the list of firms offering
hedge funds. This definition labels funds with managers who do not manage hedge funds as
SBS funds, and therefore overstates the extent of SBS management, especially at advisory firms
with only a small percentage of SBS mutual funds. We find that 73% of fund-months where Cici
et al SBS is equal to 1 are actually not SBS funds according to the SEC data.
In Table 10, we repeat our main panel specification using the Nohel et al SBS and Cici et al
SBS indicator variables in separate regressions. Using the return gap performance measure used
in Cici et al (2010), Table 10 shows that we find similar results to those reported in their paper.
We find underperformance of SBS mutual funds by 2.6 to 2.9 bps per month in return gap using
21 The mapping from the CRSP mutual fund database to advisory firm name comes from the Thomson Reuters Mutual fund holdings (s12) database. The s12type5 file contains a mapping from fund-level identifiers to advisory firm name. We use this file to replicate the Cici et al SBS variable.

32
the Cici et al SBS indicator variable, depending on sample period. They report 3.3 bps per month
underperformance of SBS mutual funds relative to peer funds in 1994-2004. Notably, this is
about half of the magnitudes we find for the same return gap measure in Table 5. This is
consistent with our finding that non-SBS funds within advisory firms that offer hedge funds do
not underperform. Thus, identifying non-SBS funds as SBS funds will attenuate any
underperformance, leading to an underestimation of the effect of SBS management.
Using the Carhart alpha performance measure, which is the main measure in Nohel et al,
we find that the Nohel et al SBS indicator is not significantly different from zero over our full
sample period. However, restricting the sample to 2005-2007, which contains some overlap with
their sample period, we find outperformance of 17.5 bps per month, significant at the 5% level.
They report a statistically significant 10 bps per month outperformance for SBS diversified
equity mutual funds relative to peer funds from 1990-2006. Given our finding that the negative
effects of SBS hedge fund management are mitigated when the manager is focused on the mutual
fund industry (Manager(s) focused on mutual funds) and when the fund has a performance-
sensitive clientele (Direct-sold), we check whether their methodology oversamples these types of
funds.
Dividing “true” SBS funds into those where Nohel et al SBS equal to1 and those equal to 0,
we find large differences in these two variables consistent with systematic oversampling of funds
with managers focused on the mutual fund industry and managers of direct-sold funds.22 This
suggests that SBS hedge fund managers who have a large percentage of AUM outside the fund
industry or those whose funds are broker-sold are more likely to be listed as an anonymous team 22 Specifically, within “true” SBS funds, Manager(s) focused on mutual funds indicator variable has a mean of 37.2% when Nohel et al SBS equals 1, and a mean of 6.5% when Nohel et al SBS equals 0. The analogous numbers for Direct-sold indicator are 37.7% and 17.7%. T-tests reveal that the differences in means between the two groups (Nohel et al SBS equals 1 vs. 0) are significant at the 1% level for both indicator variables.

33
in CRSP or to choose not to report funds or manager names to commercial hedge fund databases.
This, in turn, leads to a different inference regarding the effect on mutual fund performance.
3.6 Alternativeexplanation:Managerdistraction
One alternative explanation for our results is that the addition of other accounts may
compete for the managers’ time and attention, and it is simply this new distraction that causes
fund performance to suffer. This potential conflict of interest might be particularly relevant if
simultaneously managed accounts have different objectives, benchmarks, and time horizons as
the management team must allocate its time across diverse multiple accounts. For example,
Agarwal et al (2015) investigate fund managers that switch from single-tasking (i.e., managing
one open-end fund) to multi-tasking (i.e., managing multiple open-end funds). If spreading time,
attention, and effort across more funds induces underperformance, one would expect both the
managers’ original incumbent fund and the newly managed funds’ performance to suffer after
multi-tasking begins. Instead, they find that the performance of the incumbent fund deteriorates
after the switch, while the new or acquired fund’s performance improves, suggesting a deliberate
diversion of effort.
While we cannot observe the performance of the manager’s newly acquired hedge fund in
our sample, we can explore a manager distraction and effort diversion hypothesis in other ways.
While our switcher analysis suggests that only the addition of hedge fund clients, and not
separate accounts with PBFs, leads to mutual fund underperformance, this may still be consistent
with a distraction story. For example, it may be that a new separate account will be managed in
a much more similar manner to the existing mutual fund, relative to a new hedge fund.

34
The greater distraction and effort required to implement hedge fund strategies might
account for the difference in the performance effect between the two client types. Note that the
distraction we have in mind is more than simply the effects of getting more assets to manage.
We show in Table 1 that only 5% of sample fund managers do not manage any other fund or
account and that managers with other separate accounts with PBFs have larger assets under
management in these accounts, on average, than they do in hedge funds they manage. If mutual
fund underperformance is solely driven by managers’ effort diversion due to additional accounts,
we should observe some level of underperformance for these funds that gain separate accounts
after the switch. In addition, we should also be able to detect whether the manager allocates less
effort toward managing the fund after adding a new hedge fund to their activities.
To provide further evidence on this alternative, we test the hypothesis that the addition of a
side-by-side hedge fund will result in the manager devoting less time and effort to the active
management of the mutual fund. Specifically, under the assumption that active management
requires more time and resources than more passive management or closet indexing, we compare
the degree of active management of switcher funds relative to non-side-by-side funds before and
after the switch. We expect to see a decrease in the fund’s active management if the
management teams of switchers focus their efforts primarily on SBS accounts after the switch.
We use the active share measure of Cremers and Petajisto (2009) and a fund tracking error
measure to conduct this test.
Table 11 contains the results in which we regress active management proxies onto Pre-SBS
switch, Post-SBS switch, and the interactions of these variables with the New manager variable,
which is equal to 1 if the cause of the switch is due to adding hedge fund managers as new
mutual fund managers, similar to Table 6. In the first four columns, the dependent variables are

35
the average active share measure in the subsequent 12 months, and the average tracking error
measure in the subsequent 12 months.23 Active share and tracking error might capture different
dimensions of active management (Cremers and Petajisto, 2009). In addition, in the final two
columns we follow Del Guercio and Reuter (2014) and construct an indicator that takes the value
of 1 if both the average 12-month active share and tracking error of a fund are above their
respective medians and zero otherwise, where the median value is measured within each
investment style.
We find that active management of switcher funds does not significantly decrease after the
addition of hedge funds to the managers’ accounts, inconsistent with an effort diversion story. If
anything, our results support an increase in active management as some of the differences from
pre- to post-switch are positive and significant (not reported in the tables). An increase in active
management is possibly due to fund managers mimicking some of the hedge fund active bets and
taking similar positions in their mutual fund portfolios.
4 ConclusionThe potential conflicts of interests arising from the side-by-side management evoke some debate
in the recent literature. Papers focusing on the simultaneous management of mutual funds and
hedge funds (Nohel, Wang, Zheng (2010), Cici, Gibson and Moussawi (2010)) have come to
opposite conclusions regarding whether this practice is harmful or beneficial to mutual fund
investors. Nohel et al find superior performance in funds with managers who also manage hedge
funds, suggesting that side-by-side management is a way to keep talented managers within the
family. However, Cici et al find that side-by-side management leads to underperformance by the
23 We use the average of lead 12 months because active share and tracking error are slow moving variables. However, using 1-month, 3-month, 6-month, and 12-month lead values of these variables as dependent variables instead does not change inferences.

36
mutual funds, suggesting that managers favor more lucrative hedge funds at the expense of
mutual funds.
To shed additional light on this unresolved question, in this paper we investigate the
performance effect of side-by-side management using the SEC mandated disclosures beginning
in 2005. According to the SEC, the rationale behind this mandate is to enable investors to assess
the potential conflicts of interests as a result of side-by-side management. Advisor firms share
similar concerns in fund prospectuses and argue that they implement various policies to
eliminate them. Our results show that these concerns are warranted. We find that funds with
side-by-side managers underperform its peers without side-by-side managers, particularly when
a fund’s manager has a greater percentage of their assets under management outside the fund
industry or has a relatively performance-insensitive mutual fund clientele. Overall, our results
cast doubt on the effectiveness of the monitoring and governance mechanisms that advisor firms
put in place to mitigate the conflicts of interests due to side-by-side management.

37
REFERENCES
Agarwal, Vikas, Linlin Ma, and Kevin Mullally, 2015, Managerial Multitasking in the Mutual
Fund Industry, working paper Georgia State University
Bar, Michaela, Alexander Kempf, and Stefan Ruenzi, 2011, Is a Team Different than the Sum of
its Parts? Evidence from Mutual Fund Manages, Review of Finance 15, 359–396.
Ben-Rephael, Azi and Ryan D. Israelsen, 2015, Are Some Clients More Equal than Others?
Evidence of Price Allocation by Delegated Portfolio Managers, working paper Indiana
University.
Carhart, Mark M., 1997, On Persistence in Mutual Fund Performance, Journal of Finance 52,
57-82.
Casavecchia, Lorenzo, and Ashish Tiwari, 2016, Cross Trading by Investment Advisers:
Implications for Mutual Fund Performance, Journal of Financial Intermediation 25, 99-
130.
Chaudhuri, Ranadeb, Zoran Ivkovic, and Charles Trzcynka, 2013, Cross Subsidization in
Institutional Asset Management Firms, working paper Indiana University.
Chen, Joseph, Harrison Hong, Ming Huang, and Jeffrey D. Kubik, 2004, Does Fund Size Erode
Mutual Fund Performance? The Role of Liquidity and Organization, American Economic
Review 94, 1276-1302.
Chen, Li-Wen and Fan Chen, 2009, Does Concurrent Management of Mutual and Hedge Funds
Create Conflicts of Interest? Journal of Banking and Finance 33, 1423–1433.
Cici, Gjergji, Scott Gibson, and Rabih Moussawi, 2010, Mutual Fund Performance when Parent
Firms Simultaneously Manage Hedge Funds, Journal of Financial Intermediation 19,
169–187.

38
Cremers, Martijn, and Antti Petajisto, 2009, How Active is Your Fund Manager? A New
Measure that Predicts Performance, Review of Financial Studies 22, 3329–3365.
Daniel, Kent, Mark Grinblatt, Sheridan Titman, and Russ Wermers, 1997, Measuring Mutual
Fund Performance with Characteristic-Based Benchmarks, Journal of Finance 52, 1035-
1058.
Del Guercio, Diane, and Jonathan Reuter, 2014, Mutual Fund Performance and the Incentive to
Generate Alpha, Journal of Finance 69, 1673-1704.
Elton, Edwin J., Martin J. Gruber, and Christopher R. Blake, 2003, Incentive Fees and Mutual
Funds, Journal of Finance 58, 779-804.
Evans, Richard, 2010, Mutual Fund Incubation, Journal of Finance 65, 1581–1611.
Gaspar, Jose-Miguel, Massimo Massa, and Pedro Matos, Favoritism in Mutual Fund Families?
2006, Evidence on Strategic Cross-Fund Subsidization, Journal of Finance 61, 73–104.
Kacperczyk, Marcin, Clemens Sialm, and Lu Zheng, 2008, Unobserved Actions of Mutual
Funds, Review of Financial Studies 21, 2379-2416.
Lim, Jongha, Berk Sensoy, and Michael Weisbach, 2016, Indirect Incentives of Hedge Fund
Managers, Journal of Finance, forthcoming.
Massa, Massimo, Jonathan Reuter, and Eric Zitzewitz, 2010, When Should Firms Share Credit
with Employees? Evidence from Anonymously Managed Mutual Funds, Journal of
Financial Economics 95, 400–424.
Nohel, Tom, Z. Jay Wang, and Lu Zheng, 2010, Side-by-Side Management of Hedge Funds and
Mutual Funds, Review of Financial Studies 23, 2342–2373.
39
Patel, Saurin and Sergei Sarkissian, 2014, To Group or not to Group: Evidence from CRSP,
Morningstar Principia, and Morningstar Direct Mutual Fund Databases, working paper
McGill University.
Pollet, J. M. and M. Wilson (2008), How Does Size Affect Mutual Fund Behavior?, Journal of
Finance 63, 2941–69.
Sirri, Erik R., and Peter Tufano, 1998, Costly search and mutual fund flows, Journal of Finance
53, 1589-1622.
Wermers, Russ, 2003, Is Money Really 'Smart'? New Evidence on the Relation Between Mutual
Fund Flows, Manager Behavior, and Performance Persistence, Working paper,
University of Maryland

40
Appendix A. Sample SEC Filing containing information on management of other portfolio accounts by fund managers
AllianceBernstein Value Funds Prospectus (Statement of Additional Information)1 EQUITY INCOME FUND. The management of, and investment decisions for, the Fund's portfolio are made by the Adviser's U.S. Equity Senior Investment Management Team. Mr. Christopher W. Marx, Mr. Joseph G. Paul, Mr. John D. Phillips, Jr. and Mr. Greg L. Powell are the investment professionals with the most significant responsibility for the day-to-day management of the Fund's portfolio. The following tables provide information regarding registered investment companies other than the Fund, other pooled investment vehicles and other accounts over which the Fund's portfolio managers also have day-to-day management responsibilities. The tables provide the numbers of such accounts, the total assets in such accounts and the number of accounts and total assets whose fees are based on performance. The information is provided as of the Fund's fiscal year ended November 30, 2010. ------------------------------------------------------------------------------------------ REGISTERED INVESTMENT COMPANIES (excluding the Fund) ------------------------------------------------------------------------------------------ Number of Total Assets Total Registered of Registered Number of Total Assets Investment Investment Registered of Registered Companies Companies Investment Investment Managed with Managed with Companies Companies Performance- Performance- Portfolio Manager Managed Managed based Fees based Fees ------------------------------------------------------------------------------------------ Christopher W. Marx 61 $10,880,000,000 1 3,768,000,000 Joseph G. Paul 153 $29,019,000,000 3 6,492,000,000 John D. Phillips, Jr. 61 $10,880,000,000 1 3,768,000,000 Greg L. Powell 151 $29,015,000,000 3 6,492,000,000 ----------------------------------------------------------------------------------------- POOLED INVESTMENT VEHICLES ----------------------------------------------------------------------------------------- Number of Pooled Total Investment Number of Vehicles Total Assets of Pooled Managed Pooled Investment Investment Total Assets of with Vehicles Managed Vehicles Pooled Investment Performance- with Performance- Portfolio Manager Managed Vehicles Managed based Fees based Fees ----------------------------------------------------------------------------------------- Christopher W. Marx 50 $ 1,495,000,000 None None Joseph G. Paul 237 $13,665,000,000 9 365,000,000 John D. Phillips, Jr. 50 $ 1,495,000,000 None None Greg L. Powell 223 $11,978,000,000 6 318,000,000 -----------------------------------------------------------------------------------------
1 This filing available at http://www.sec.gov/Archives/edgar/data/910036/000091957411001864/d1170239_485-b.txt

41
OTHER ACCOUNTS ----------------------------------------------------------------------------------------- Number of Total Other Total Assets Number of Accounts of Other Other Total Assets Managed with Accounts with Accounts of Other Performance- Performance- Portfolio Manager Managed Accounts Managed based Fees based Fees -------------------------------------------------------------------------------------------- Christopher W. Marx 32,647 $18,376,000,000 5 166,000,000 Joseph G. Paul 33,024 $62,015,000,000 43 4,732,000,000 John D. Phillips, Jr. 32,647 $18,376,000,000 5 166,000,000 Greg L. Powell 33,024 $62,015,000,000 43 4,732,000,000
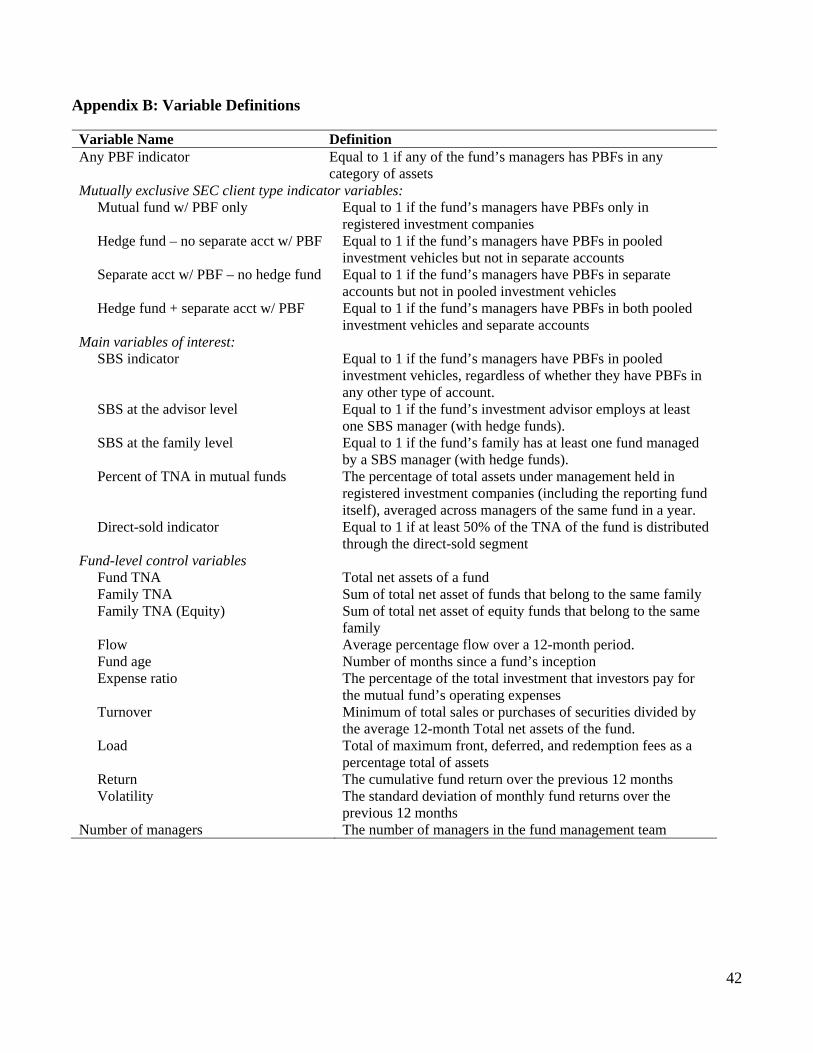
42
Appendix B: Variable Definitions
Variable Name Definition Any PBF indicator Equal to 1 if any of the fund’s managers has PBFs in any
category of assets Mutually exclusive SEC client type indicator variables: Mutual fund w/ PBF only Equal to 1 if the fund’s managers have PBFs only in
registered investment companies Hedge fund – no separate acct w/ PBF Equal to 1 if the fund’s managers have PBFs in pooled
investment vehicles but not in separate accounts Separate acct w/ PBF – no hedge fund Equal to 1 if the fund’s managers have PBFs in separate
accounts but not in pooled investment vehicles Hedge fund + separate acct w/ PBF Equal to 1 if the fund’s managers have PBFs in both pooled
investment vehicles and separate accounts Main variables of interest: SBS indicator Equal to 1 if the fund’s managers have PBFs in pooled
investment vehicles, regardless of whether they have PBFs in any other type of account.
SBS at the advisor level Equal to 1 if the fund’s investment advisor employs at least one SBS manager (with hedge funds).
SBS at the family level Equal to 1 if the fund’s family has at least one fund managed by a SBS manager (with hedge funds).
Percent of TNA in mutual funds The percentage of total assets under management held in registered investment companies (including the reporting fund itself), averaged across managers of the same fund in a year.
Direct-sold indicator Equal to 1 if at least 50% of the TNA of the fund is distributed through the direct-sold segment
Fund-level control variables Fund TNA Total net assets of a fund Family TNA Sum of total net asset of funds that belong to the same family Family TNA (Equity) Sum of total net asset of equity funds that belong to the same
family Flow Average percentage flow over a 12-month period. Fund age Number of months since a fund’s inception Expense ratio The percentage of the total investment that investors pay for
the mutual fund’s operating expenses Turnover Minimum of total sales or purchases of securities divided by
the average 12-month Total net assets of the fund. Load Total of maximum front, deferred, and redemption fees as a
percentage total of assets Return The cumulative fund return over the previous 12 months Volatility The standard deviation of monthly fund returns over the
previous 12 months Number of managers The number of managers in the fund management team

43
Appendix C: Across-family variation of side-by-side management
This table illustrates the variation across families with regards to the percentage of funds with side-by-side managers. Side-by-side managers are defined as those managing mutual funds and hedge funds simultaneously. We use data from the Statement of Additional Information, which is a required supplementary document to the fund’s prospectus filed with the SEC (form N-1A with form type 485BPOS or 485APOS) to identify other accounts with PBFs managed by mutual fund managers.
Fund family’s name Percent of funds in the family
with side-by-side managers
CALAMOS ADVISORS LLC 100.0%DIMENSIONAL FUND ADVISORS INC 98.4%ROYCE & ASSOCIATES LLC 94.4%ALLIANCEBERNSTEIN LP 49.4%SCUDDER INVESTMENTS 36.8%PIMCO ADVISORS 33.3%HARTFORD MUTUAL FUNDS 22.4%LEGG MASON/WESTERN ASSET MGMT 16.2%PUTNAM INVESTMENT MANAGEMENT LLC 14.1%RIVERSOURCE INVESTMENTS LLC 11.6%VANGUARD GROUP INC 8.5%FEDERATED INVESTORS 6.7%FRANKLIN TEMPLETON INVESTMENTS 6.1%SMITH BARNEY FUND MGMT 6.0%COLUMBIA FUNDS 5.5%MERRILL LYNCH INV MANAGERS 5.3%DREYFUS CORPORATION 4.6%AIM INVESTMENTS 4.0%MFS INVESTMENT MANAGEMENT 2.1%JANUS CAPITAL MANAGEMENT LLC 1.8%VAN KAMPEN ASSET MANAGEMENT 1.0%FIDELITY MANAGEMENT & RESEARCH COMPANY 0.7%AMERICAN CENTURY INVESTMENT MGMT INC 0.0%AMERICAN FUNDS 0.0%BANK OF NEW YORK 0.0%DODGE & COX 0.0%DAVIS SELECTED ADVISERS LP 0.0%LORD ABBETT & COMPANY LLC 0.0%OPPENHEIMERFUNDS INC/CENTENNIAL 0.0%T ROWE PRICE ASSOCIATES INC 0.0%
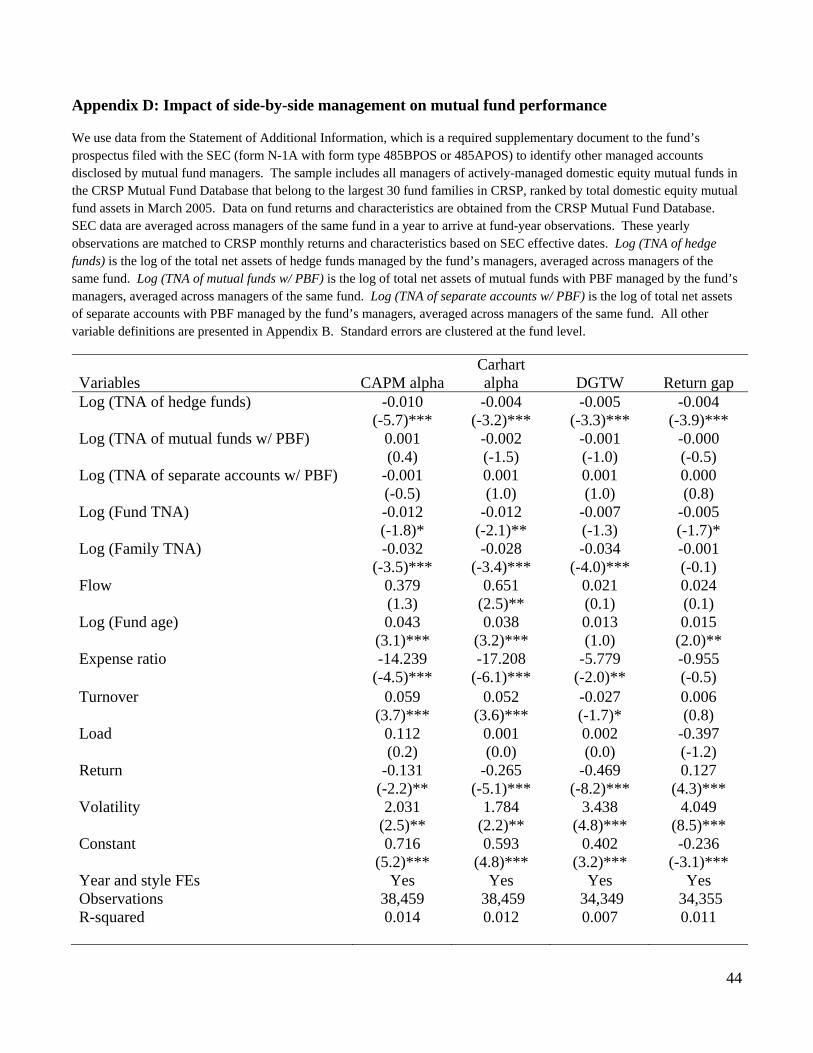
44
Appendix D: Impact of side-by-side management on mutual fund performance
We use data from the Statement of Additional Information, which is a required supplementary document to the fund’s prospectus filed with the SEC (form N-1A with form type 485BPOS or 485APOS) to identify other managed accounts disclosed by mutual fund managers. The sample includes all managers of actively-managed domestic equity mutual funds in the CRSP Mutual Fund Database that belong to the largest 30 fund families in CRSP, ranked by total domestic equity mutual fund assets in March 2005. Data on fund returns and characteristics are obtained from the CRSP Mutual Fund Database. SEC data are averaged across managers of the same fund in a year to arrive at fund-year observations. These yearly observations are matched to CRSP monthly returns and characteristics based on SEC effective dates. Log (TNA of hedge funds) is the log of the total net assets of hedge funds managed by the fund’s managers, averaged across managers of the same fund. Log (TNA of mutual funds w/ PBF) is the log of total net assets of mutual funds with PBF managed by the fund’s managers, averaged across managers of the same fund. Log (TNA of separate accounts w/ PBF) is the log of total net assets of separate accounts with PBF managed by the fund’s managers, averaged across managers of the same fund. All other variable definitions are presented in Appendix B. Standard errors are clustered at the fund level.
Variables CAPM alphaCarhart alpha DGTW Return gap
Log (TNA of hedge funds) -0.010 -0.004 -0.005 -0.004 (-5.7)*** (-3.2)*** (-3.3)*** (-3.9)*** Log (TNA of mutual funds w/ PBF) 0.001 -0.002 -0.001 -0.000 (0.4) (-1.5) (-1.0) (-0.5) Log (TNA of separate accounts w/ PBF) -0.001 0.001 0.001 0.000 (-0.5) (1.0) (1.0) (0.8) Log (Fund TNA) -0.012 -0.012 -0.007 -0.005 (-1.8)* (-2.1)** (-1.3) (-1.7)* Log (Family TNA) -0.032 -0.028 -0.034 -0.001 (-3.5)*** (-3.4)*** (-4.0)*** (-0.1) Flow 0.379 0.651 0.021 0.024 (1.3) (2.5)** (0.1) (0.1) Log (Fund age) 0.043 0.038 0.013 0.015 (3.1)*** (3.2)*** (1.0) (2.0)** Expense ratio -14.239 -17.208 -5.779 -0.955 (-4.5)*** (-6.1)*** (-2.0)** (-0.5) Turnover 0.059 0.052 -0.027 0.006 (3.7)*** (3.6)*** (-1.7)* (0.8) Load 0.112 0.001 0.002 -0.397 (0.2) (0.0) (0.0) (-1.2) Return -0.131 -0.265 -0.469 0.127 (-2.2)** (-5.1)*** (-8.2)*** (4.3)*** Volatility 2.031 1.784 3.438 4.049 (2.5)** (2.2)** (4.8)*** (8.5)*** Constant 0.716 0.593 0.402 -0.236 (5.2)*** (4.8)*** (3.2)*** (-3.1)*** Year and style FEs Yes Yes Yes Yes Observations 38,459 38,459 34,349 34,355 R-squared 0.014 0.012 0.007 0.011
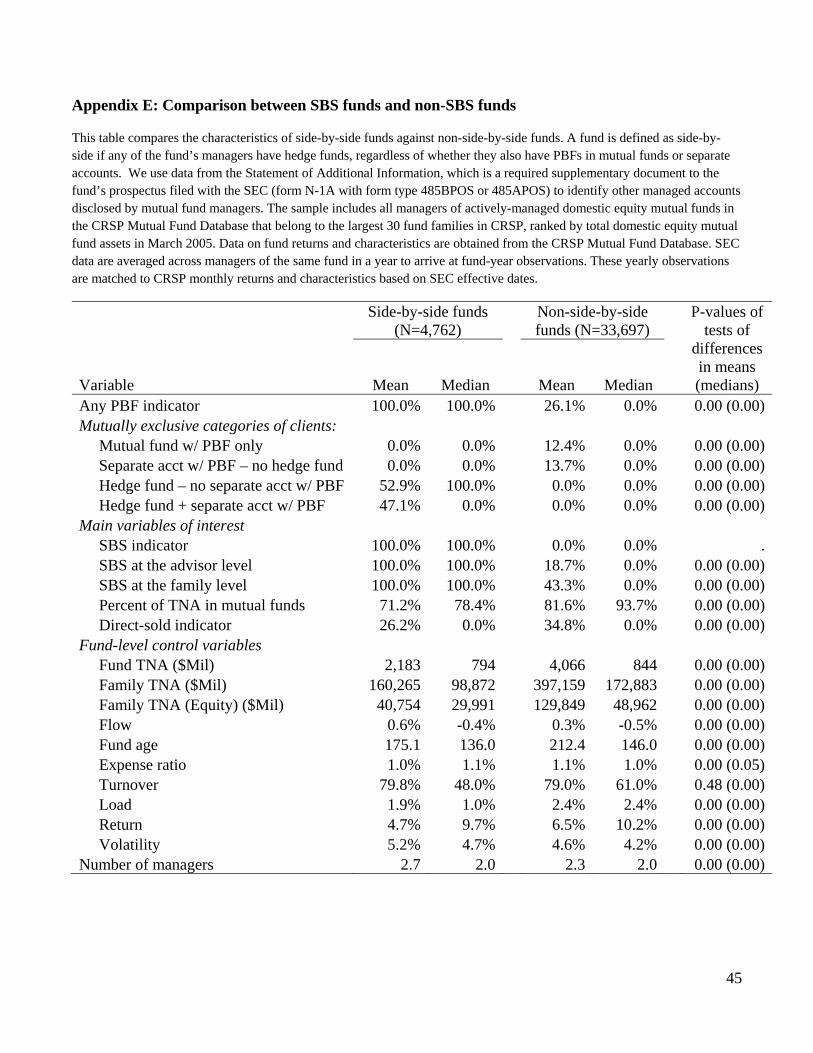
45
Appendix E: Comparison between SBS funds and non-SBS funds
This table compares the characteristics of side-by-side funds against non-side-by-side funds. A fund is defined as side-by-side if any of the fund’s managers have hedge funds, regardless of whether they also have PBFs in mutual funds or separate accounts. We use data from the Statement of Additional Information, which is a required supplementary document to the fund’s prospectus filed with the SEC (form N-1A with form type 485BPOS or 485APOS) to identify other managed accounts disclosed by mutual fund managers. The sample includes all managers of actively-managed domestic equity mutual funds in the CRSP Mutual Fund Database that belong to the largest 30 fund families in CRSP, ranked by total domestic equity mutual fund assets in March 2005. Data on fund returns and characteristics are obtained from the CRSP Mutual Fund Database. SEC data are averaged across managers of the same fund in a year to arrive at fund-year observations. These yearly observations are matched to CRSP monthly returns and characteristics based on SEC effective dates.
Side-by-side funds
(N=4,762) Non-side-by-side funds (N=33,697)
P-values of tests of
differences in means (medians) Variable Mean Median Mean Median
Any PBF indicator 100.0% 100.0% 26.1% 0.0% 0.00 (0.00)Mutually exclusive categories of clients: Mutual fund w/ PBF only 0.0% 0.0% 12.4% 0.0% 0.00 (0.00) Separate acct w/ PBF – no hedge fund 0.0% 0.0% 13.7% 0.0% 0.00 (0.00) Hedge fund – no separate acct w/ PBF 52.9% 100.0% 0.0% 0.0% 0.00 (0.00) Hedge fund + separate acct w/ PBF 47.1% 0.0% 0.0% 0.0% 0.00 (0.00)Main variables of interest SBS indicator 100.0% 100.0% 0.0% 0.0% . SBS at the advisor level 100.0% 100.0% 18.7% 0.0% 0.00 (0.00) SBS at the family level 100.0% 100.0% 43.3% 0.0% 0.00 (0.00) Percent of TNA in mutual funds 71.2% 78.4% 81.6% 93.7% 0.00 (0.00) Direct-sold indicator 26.2% 0.0% 34.8% 0.0% 0.00 (0.00)Fund-level control variables Fund TNA ($Mil) 2,183 794 4,066 844 0.00 (0.00) Family TNA ($Mil) 160,265 98,872 397,159 172,883 0.00 (0.00) Family TNA (Equity) ($Mil) 40,754 29,991 129,849 48,962 0.00 (0.00) Flow 0.6% -0.4% 0.3% -0.5% 0.00 (0.00) Fund age 175.1 136.0 212.4 146.0 0.00 (0.00) Expense ratio 1.0% 1.1% 1.1% 1.0% 0.00 (0.05) Turnover 79.8% 48.0% 79.0% 61.0% 0.48 (0.00) Load 1.9% 1.0% 2.4% 2.4% 0.00 (0.00) Return 4.7% 9.7% 6.5% 10.2% 0.00 (0.00) Volatility 5.2% 4.7% 4.6% 4.2% 0.00 (0.00) Number of managers 2.7 2.0 2.3 2.0 0.00 (0.00)

46
Table 1: The prevalence of assets under management outside the mutual fund industry by fund managers
We use data from the Statement of Additional Information, which is a required supplementary document to the fund’s prospectus filed with the SEC (form N-1A with form type 485BPOS or 485APOS) to identify other managed accounts disclosed by mutual fund managers. The sample includes all managers of actively-managed domestic equity mutual funds in the CRSP Mutual Fund Database that belong to the largest 30 fund families in CRSP, ranked by total domestic equity mutual fund assets in March 2005. For these 30 families, we include each manager listed as having day-to-day responsibility for managing the fund in the Statement of Additional Information. Funds are required to disclose every fiscal year the number of accounts and the assets under management in three categories: registered investment companies, pooled investment vehicles, and separate accounts. The SEC also requires funds to disclose if any of the other managed accounts are subject to performance-based fees (PBFs), and the assets under management in each category subject to this incentive fee. In all our tables, we use the more common term “mutual funds” for registered investment companies. We also use the term “hedge funds” for pooled investment vehicles with PBFs and use the more general term of pooled investment vehicles otherwise. In each panel, we report statistics as of the effective date of the information listed in the prospectus. The sample contains some observations with effective dates in 2004 and 2011, but we exclude these partial years in the table below. However, in the row “All manager-years” we include observations from these partial years as well. The data collected are manager-fund-year observations, but we average observations across all funds for a manager in a year to arrive at the manager-year dataset used for this table. Panel A contains the percentage of all manager-years disclosing any of these account types, as well as the percentage disclosing accounts under the three SEC-required categories. Panel A also contains the average assets under management for each category, for those manager-years that have non-zero assets in each of these categories. Panel B contains the percentage of manager-years with any accounts subject to PBFs, as well as the percentage of manager-years of each account category type subject to PBFs. Panel B also contains the average assets under management subject to PBFs for each category, for those manager-years that have non-zero assets with PBFs in these categories.

47
Panel A: Management of additional accounts and average assets under management by mutual fund managers
Year
Total
number of unique
managers
Percent of all mutual fund managers with:
For managers with non-zero accounts: Average assets under management
($MM) in:
For all managers:
any additional accounts
other mutual funds
pooled investment
vehicles
separate accounts
other mutual funds
pooled investment
vehicles
separate accounts
Percent of TNA in all mutual funds
2005 701 94.7% 87.4% 54.5% 67.9% 12,536 881 5,533 77.5% 2006 744 94.5% 86.4% 56.0% 64.1% 14,831 1,941 6,382 77.3% 2007 752 94.9% 88.8% 56.6% 67.2% 17,754 2,951 8,673 75.5% 2008 737 95.1% 88.5% 59.6% 67.2% 13,417 2,255 4,938 74.4% 2009 773 95.6% 89.0% 57.6% 68.2% 13,130 1,496 3,649 73.6% 2010 751 95.6% 89.3% 57.3% 65.4% 16,150 1,584 5,140 77.3% All manager-years 5,073 95.0% 88.2% 56.5% 66.9% 14,493 1,880 5,444 75.9%
Panel B: Outside accounts and assets under management with performance-based fees (PBFs) by mutual fund managers
Year
Total number
of managers
Percent of all managers with PBFs in:
For managers with non-zero accounts: Average assets under management ($MM) with PBFs in:
any additional accounts
other mutual funds
hedge funds
separate accounts
other mutual funds
hedge funds
separate accounts
2005 701 19.8% 7.6% 5.0% 12.8% 3,545 180 1,298 2006 744 23.7% 10.9% 7.0% 15.2% 3,206 375 2,138 2007 752 25.5% 13.0% 6.3% 15.6% 3,797 304 2,866 2008 737 28.5% 13.2% 8.0% 16.3% 2,976 313 1,774 2009 773 31.7% 14.1% 9.2% 18.0% 2,544 143 1,010 2010 751 29.3% 15.4% 6.8% 16.0% 2,706 227 993 All manager-years 5,073 26.5% 12.5% 7.0% 15.4% 3,123 262 1,621

48
Table 2: Number of funds and managers per fund by year
Data on manager names are collected from the Statement of Additional Information, which is a required supplementary document to the fund’s prospectus filed with the SEC (form N-1A with form type 485BPOS or 485APOS). The sample includes all managers of actively-managed domestic equity mutual funds in the CRSP Mutual Fund Database that belong to the largest 30 fund families in CRSP, ranked by total domestic equity mutual fund assets in March 2005. This table uses data at the fund-manager level to document trends in singer-manager funds and team-managed funds. The sample contains some observations with effective dates in 2004 and 2011, but we exclude these partial years in the table below. However, in the row “All years” we include observations from these partial years as well.
Year
Total number of funds
Average
number of managers
% of funds with: 1
manager
2
managers
3
managers
4 or more managers
2005 592 2.19 45.9% 25.3% 13.5% 15.2%2006 626 2.26 43.6% 25.7% 12.6% 18.1%2007 635 2.34 40.3% 29.6% 10.4% 19.7%2008 638 2.34 40.4% 28.8% 11.4% 19.3%2009 642 2.54 36.6% 29.8% 10.7% 22.9%2010 616 2.63 34.7% 29.7% 12.7% 22.9%All years 4,172 2.40 40.0% 28.3% 12.0% 19.6%

49
Table 3: Summary statistics at the fund-month level
We use data from the Statement of Additional Information, which is a required supplementary document to the fund’s prospectus filed with the SEC (form N-1A with form type 485BPOS or 485APOS) to identify other managed accounts disclosed by mutual fund managers. The sample includes all managers of actively-managed domestic equity mutual funds in the CRSP Mutual Fund Database that belong to the largest 30 fund families in CRSP, ranked by total domestic equity mutual fund assets in March 2005. Data on fund returns and characteristics are obtained from the CRSP Mutual Fund Database. SEC data are averaged across managers of the same fund in a year to arrive at fund-year observations. These yearly observations are matched to CRSP monthly returns and characteristics based on SEC effective dates. Any PBF is an indicator variable equal to 1 if any of the fund’s managers has PBFs in any category of assets. Mutual fund w/ PBF only is equal to 1 if the fund’s managers have PBFs only in mutual funds. Hedge fund – no separate acct w/ PBF is equal to 1 if the fund’s managers have hedge funds but no separate accounts with PBFs. Separate acct w/ PBF – no hedge fund is equal to 1 if the fund’s managers have PBFs in separate accounts but no hedge funds. SBS is an indicator variable equal to 1 if the fund has at least one manager with hedge funds. Percent of TNA in mutual funds is the percentage of total assets under management held in mutual funds (including the reporting fund itself), averaged across managers of the same fund in a year.
Variable Mean Median Standard Deviation P25 P75
Any PBF indicator 35.2% 0.0% 47.8% 0.0% 100.0%Mutually exclusive SEC client type indicator variables: Mutual fund w/ PBF only 10.8% 0.0% 31.1% 0.0% 0.0% Separate acct w/ PBF – no hedge fund 12.0% 0.0% 32.5% 0.0% 0.0% Hedge fund – no separate acct w/ PBF 6.5% 0.0% 24.7% 0.0% 0.0% Hedge fund + separate acct w/ PBF 5.8% 0.0% 23.4% 0.0% 0.0%Main variables of interest SBS indicator 12.4% 0.0% 32.9% 0.0% 0.0% SBS at the advisor level 28.8% 0.0% 45.3% 0.0% 100.0% SBS at the family level 50.3% 100.0% 50.0% 0.0% 100.0% Percent of TNA in mutual funds 80.3% 91.9% 24.6% 69.4% 99.5% Direct-sold indicator 33.7% 0.0% 47.3% 0.0% 100.0%Fund-level control variables Fund TNA ($Mil) 3,833 839 11,308 218 2,888 Family TNA ($Mil) 367,827 157,532 467,183 82,277 297,395 Family TNA (Equity) ($Mil) 118,818 44,648 159,223 28,067 122,447 Flow 0.4% -0.4% 3.6% -1.4% 0.9% Fund age 207.8 144.0 192.0 82.0 255.0 Expense ratio 1.0% 1.1% 0.4% 0.8% 1.3% Turnover 79.1% 60.0% 71.5% 29.9% 107.0% Load 2.4% 2.2% 2.1% 0.0% 4.2% Return 6.3% 10.2% 22.5% -4.2% 18.9% Volatility 4.6% 4.3% 2.4% 2.8% 6.0%Number of managers 2.3 2.0 1.8 1.0 3.0

50
Table 4: Impact of side-by-side management on mutual fund performance
We use data from the Statement of Additional Information, which is a required supplementary document to the fund’s prospectus filed with the SEC (form N-1A with form type 485BPOS or 485APOS) to identify other managed accounts disclosed by mutual fund managers. The sample includes all managers of actively-managed domestic equity mutual funds in the CRSP Mutual Fund Database that belong to the largest 30 fund families in CRSP, ranked by total domestic equity mutual fund assets in March 2005. Data on fund returns and characteristics are obtained from the CRSP Mutual Fund Database. SEC data are averaged across managers of the same fund in a year to arrive at fund-year observations. These yearly observations are matched to CRSP monthly returns and characteristics based on SEC effective dates. Any PBF is an indicator variable equal to 1 if any of the fund’s managers has PBFs in any category of assets. Mutual fund w/ PBF only is equal to 1 if the fund’s managers have PBFs only in mutual funds. Hedge fund – no separate acct w/ PBF is equal to 1 if the fund’s managers have hedge funds but no separate accounts with PBFs. Separate acct w/ PBF – no hedge fund is equal to 1 if the fund’s managers have separate accounts with PBFs but no hedge funds. Hedge fund + separate acct w/ PBF is equal to 1 if the fund’s managers have both hedge funds and separate accounts with PBFs. All other variable definitions are presented in Appendix B. Standard errors are clustered at the fund level.
Panel A: Impact of any PBF account on fund performance
Variables CAPM alpha Carhart alpha DGTW Return gap Any PBF indicator -0.083 -0.043 -0.029 -0.023 (-4.5)*** (-2.6)*** (-1.9)* (-2.6)** Log (Fund TNA) -0.014 -0.012 -0.007 -0.006 (-2.1)** (-2.2)** (-1.3) (-1.9)* Log (Family TNA) -0.018 -0.018 -0.023 0.006 (-2.2)** (-2.3)** (-3.3)*** (1.3) Flow 0.380 0.665 0.033 0.029 (1.3) (2.5)** (0.1) (0.2) Log (Fund age) 0.047 0.038 0.014 0.016 (3.4)*** (3.2)*** (1.1) (2.2)** Expense ratio -12.475 -15.765 -4.128 0.166 (-4.1)*** (-5.7)*** (-1.5) (0.1) Turnover 0.061 0.051 -0.024 0.009 (3.8)*** (3.5)*** (-1.5) (1.1) Load 0.183 0.000 -0.016 -0.402 (0.4) (0.0) (-0.0) (-1.2) Return -0.131 -0.269 -0.472 0.126 (-2.2)** (-5.1)*** (-8.3)*** (4.3)*** Volatility 1.965 1.733 3.381 4.005 (2.4)** (2.1)** (4.6)*** (8.4)*** Constant 0.678 0.536 0.331 -0.281 (5.2)*** (4.6)*** (2.9)*** (-4.0)*** Year and style FEs Yes Yes Yes Yes Observations 38,459 38,459 34,349 34,355 R-squared 0.014 0.012 0.007 0.011

51
Panel B: Impact of different types of PBF accounts on fund performance
Variables CAPM alpha
Carhart alpha DGTW Return gap
Mutually exclusive SEC client type indicator variables: Mutual fund w/ PBF only -0.040 0.004 0.010 0.003 (-1.4) (0.1) (0.4) (0.2) Separate acct w/ PBF – no hedge fund -0.022 -0.033 -0.010 -0.005 (-0.8) (-1.5) (-0.4) (-0.5) Hedge fund – no separate acct w/ PBF -0.233 -0.089 -0.073 -0.062 (-5.2)*** (-2.1)** (-2.1)** (-2.7)*** Hedge fund + separate acct w/ PBF -0.130 -0.103 -0.103 -0.072 (-3.7)*** (-3.9)*** (-3.5)*** (-4.0)*** Log (Fund TNA) -0.012 -0.012 -0.007 -0.005 (-1.8)* (-2.1)** (-1.2) (-1.7)* Log (Family TNA) -0.031 -0.027 -0.032 -0.000 (-3.4)*** (-3.2)*** (-3.7)*** (-0.0) Flow 0.418 0.663 0.026 0.029 (1.5) (2.5)** (0.1) (0.2) Log (Fund age) 0.044 0.037 0.012 0.015 (3.1)*** (3.1)*** (1.0) (2.0)** Expense ratio -13.780 -16.790 -5.434 -0.777 (-4.4)*** (-6.0)*** (-1.9)* (-0.4) Turnover 0.057 0.051 -0.026 0.006 (3.6)*** (3.5)*** (-1.7)* (0.8) Load 0.053 -0.029 -0.000 -0.400 (0.1) (-0.1) (-0.0) (-1.2) Return -0.135 -0.267 -0.470 0.126 (-2.3)** (-5.1)*** (-8.3)*** (4.3)*** Volatility 2.082 1.790 3.426 4.048 (2.5)** (2.2)** (4.7)*** (8.5)*** Constant 0.846 0.648 0.447 -0.198 (6.2)*** (5.2)*** (3.4)*** (-2.5)** Year and style FEs Yes Yes Yes Yes Observations 38,459 38,459 34,349 34,355 R-squared 0.014 0.012 0.007 0.011

52
Table 5: Impact of side-by-side hedge fund management on fund performance
We use data from the Statement of Additional Information, which is a required supplementary document to the fund’s prospectus filed with the SEC (form N-1A with form type 485BPOS or 485APOS) to identify other managed accounts disclosed by mutual fund managers. The sample includes all managers of actively-managed domestic equity mutual funds in the CRSP Mutual Fund Database that belong to the largest 30 fund families in CRSP, ranked by total domestic equity mutual fund assets in March 2005. Data on fund returns and characteristics are obtained from the CRSP Mutual Fund Database. SEC data are averaged across managers of the same fund in a year to arrive at fund-year observations. These yearly observations are matched to CRSP monthly returns and characteristics based on SEC effective dates. SBS is an indicator variable equal to 1 if any of the fund’s managers have hedge funds, regardless of whether they also have PBFs in mutual funds or separate accounts. Mutual fund w/ PBF only is equal to 1 if the fund’s managers have PBFs only in mutual funds. Separate acct w/ PBF – no hedge fund is equal to 1 if the fund’s managers have separate accounts with PBFs but no hedge funds. All other variable definitions are presented in Appendix B. Standard errors are clustered at the fund level.

53
Variables CAPM alpha
Carhart alpha DGTW Return gap
CAPM alpha
Carhart alpha
DGTW Return gap
SBS indicator -0.183 -0.096 -0.087 -0.066 -0.193 -0.115 -0.134 -0.064 (-6.2)*** (-3.7)*** (-3.5)*** (-4.1)*** (-4.3)*** (-3.0)*** (-3.7)*** (-2.8)*** Mutual fund w/ PBF only -0.043 0.004 0.011 0.003 -0.072 -0.026 -0.001 0.006 (-1.5) (0.2) (0.4) (0.2) (-2.2)** (-0.9) (-0.0) (0.4) Sep acct w/ PBF – no hedge fund -0.022 -0.033 -0.010 -0.005 -0.022 -0.010 -0.018 0.016 (-0.8) (-1.5) (-0.4) (-0.5) (-0.6) (-0.4) (-0.6) (1.1) Log (Fund TNA) -0.012 -0.012 -0.007 -0.005 -0.021 -0.019 -0.011 -0.008 (-1.8)* (-2.1)** (-1.2) (-1.7)* (-3.3)*** (-3.2)*** (-2.1)** (-2.4)** Log (Family TNA) -0.030 -0.027 -0.032 -0.000 -0.245 -0.187 -0.169 -0.015 (-3.3)*** (-3.2)*** (-3.7)*** (-0.0) (-5.1)*** (-5.1)*** (-3.5)*** (-0.7) Flow 0.383 0.668 0.036 0.032 0.312 0.580 -0.036 0.012 (1.3) (2.5)** (0.1) (0.2) (1.1) (2.3)** (-0.1) (0.1) Log (Fund age) 0.044 0.037 0.012 0.015 0.046 0.039 0.016 0.021 (3.1)*** (3.1)*** (1.0) (2.0)** (3.3)*** (3.2)*** (1.5) (2.8)*** Expense ratio -13.897 -16.775 -5.403 -0.766 -8.374 -11.560 -3.431 0.664 (-4.4)*** (-6.0)*** (-1.9)* (-0.4) (-2.8)*** (-4.2)*** (-1.1) (0.3) Turnover 0.061 0.051 -0.027 0.006 0.050 0.047 -0.020 -0.000 (3.8)*** (3.5)*** (-1.7)* (0.8) (3.1)*** (3.1)*** (-1.2) (-0.0) Load 0.107 -0.037 -0.014 -0.405 1.453 1.150 1.074 -0.271 (0.2) (-0.1) (-0.0) (-1.2) (2.3)** (1.9)* (1.9)* (-0.6) Return -0.131 -0.268 -0.472 0.126 -0.117 -0.250 -0.485 0.114 (-2.2)** (-5.1)*** (-8.3)*** (4.3)*** (-2.0)** (-4.8)*** (-8.9)*** (4.0)*** Volatility 2.078 1.791 3.430 4.048 1.138 1.292 2.264 3.764 (2.6)** (2.2)** (4.7)*** (8.5)*** (1.7)* (1.9)* (3.7)*** (7.5)*** Constant 0.828 0.650 0.451 -0.196 3.157 2.416 1.942 -0.044 (6.1)*** (5.3)*** (3.4)*** (-2.5)** (5.8)*** (5.8)*** (3.6)*** (-0.2) Year FEs Yes Yes Yes Yes Yes Yes Yes Yes Style FEs Yes Yes Yes Yes No No No No Family FEs No No No No Yes Yes Yes Yes Observations 38,459 38,459 34,349 34,355 38,459 38,459 34,349 34,355 R-squared 0.014 0.012 0.007 0.011 0.016 0.014 0.009 0.011

54
Table 6 Panel A: Analysis of change in side-by-side management status (hedge fund switchers)
This table contains estimates from regressions examining funds that switch from having no side-by-side managers (no managers with hedge funds) to having side-by-side managers (with hedge funds) during the sample period. We use data from the Statement of Additional Information, which is a required supplementary document to the fund’s prospectus filed with the SEC (form N-1A with form type 485BPOS or 485APOS) to identify other managed accounts disclosed by mutual fund managers. The sample includes all managers of actively-managed domestic equity mutual funds in the CRSP Mutual Fund Database that belong to the largest 30 fund families in CRSP, ranked by total domestic equity mutual fund assets in March 2005. Data on fund returns and characteristics are obtained from the CRSP Mutual Fund Database. SEC data are averaged across managers of the same fund in a year to arrive at fund-year observations. These yearly observations are matched to CRSP monthly returns and characteristics based on SEC effective dates. Pre-SBS switch is an indicator variable equal to 1 for switcher funds in all fund-months before the switch. Post-SBS switch is an indicator variable equal to 1 for switcher funds in all fund-months after the switch. For all other funds these indicator variables are 0. New manager is an indicator variable equal to 1 if a fund changes its side-by-side management status due to adding new managers with side-by-side hedge fund accounts. Standard errors are clustered at the fund level.
Variables CAPM alpha
Carhart alpha DGTW
Return gap
CAPM alpha
Carhart alpha DGTW
Return gap
Pre-SBS switch -0.031 0.000 -0.032 -0.055 -0.072 -0.033 -0.061 -0.050 (-0.5) (0.0) (-0.7) (-1.9)* (-1.1) (-0.7) (-1.3) (-1.7)* Pre-SBS switch * New manager -0.047 -0.151 -0.065 0.032 -0.034 -0.126 -0.050 0.036 (-0.6) (-2.0)* (-1.0) (0.7) (-0.4) (-1.6) (-0.9) (0.7) Post-SBS switch -0.212 -0.191 -0.188 -0.078 -0.313 -0.214 -0.207 -0.057 (-2.9)*** (-3.6)*** (-3.4)*** (-2.8)*** (-3.9)*** (-3.7)*** (-3.9)*** (-2.0)** Post-SBS switch * New manager -0.188 -0.066 0.068 0.003 -0.118 -0.044 0.080 -0.030 -0.031 0.000 -0.032 -0.055 (-0.9) (-0.5) (1.0) (-0.4) Constant 0.648 0.408 0.302 -0.245 2.482 1.814 1.737 -0.203 (4.7)*** (3.4)*** (2.2)** (-2.9)*** (4.8)*** (4.4)*** (3.0)*** (-0.8) Control variables Yes Yes Yes Yes Yes Yes Yes Yes Year FEs Yes Yes Yes Yes Yes Yes Yes Yes Style FEs Yes Yes Yes Yes No No No No Family FEs No No No No Yes Yes Yes Yes Observations 33,560 33,560 30,083 29,982 33,560 33,560 30,083 29,982 R-squared 0.014 0.013 0.006 0.011 0.015 0.013 0.008 0.011 P-value of Wald test: Pre-SBS switch = Post-SBS switch 0.080* 0.006** 0.050** 0.560 0.027** 0.013** 0.054* 0.866

55
Table 6 Panel B: Analysis of switches from having no separate accounts with PBFs to having separate accounts with PBF
This table contains estimates from regressions examining funds that switch from having no managers separate accounts with PBFs to having managers with separate accounts with PBFs during the sample period. We use data from the Statement of Additional Information, which is a required supplementary document to the fund’s prospectus filed with the SEC (form N-1A with form type 485BPOS or 485APOS) to identify other managed accounts disclosed by mutual fund managers. The sample includes all managers of actively-managed domestic equity mutual funds in the CRSP Mutual Fund Database that belong to the largest 30 fund families in CRSP, ranked by total domestic equity mutual fund assets in March 2005. Data on fund returns and characteristics are obtained from the CRSP Mutual Fund Database. SEC data are averaged across managers of the same fund in a year to arrive at fund-year observations. These yearly observations are matched to CRSP monthly returns and characteristics based on SEC effective dates. Pre-sep acct w/ PBF switch is an indicator variable equal to 1 for switcher funds in all fund-months before the switch. Post-sep acct w/ PBF switch is an indicator variable equal to 1 for switcher funds in all fund-months after the switch. For all other funds these indicator variables are 0. New manager is an indicator variable equal to 1 if a fund switches from having no separate accounts w/ PBF to having separate accounts with PBF due to adding new managers with these accounts. Standard errors are clustered at the fund level.
Variables CAPM alpha
Carhart alpha DGTW
Return gap
CAPM alpha
Carhart alpha DGTW
Return gap
Pre-sep acct w/ PBF switch -0.105 -0.153 -0.072 -0.047 -0.045 -0.117 -0.072 -0.049 (-2.2)** (-2.8)*** (-1.8)* (-2.0)** (-0.8) (-1.8)* (-1.4) (-1.5) Pre-sep acct w/ PBF *New manager -0.125 -0.020 -0.206 0.020 -0.164 -0.026 -0.209 0.021 (-1.3) (-0.2) (-2.5)** (0.5) (-1.9)* (-0.3) (-2.6)*** (0.5) Post-sep acct w/ PBF switch -0.027 -0.029 -0.029 0.005 -0.001 -0.021 -0.055 0.013 (-0.7) (-1.1) (-0.8) (0.3) (-0.0) (-0.6) (-1.2) (0.5) Post-sep acct w/ PBF *New manager 0.005 0.002 0.007 -0.025 0.017 0.043 0.036 -0.021 (0.1) (0.0) (0.1) (-0.8) (0.2) (0.6) (0.6) (-0.6) Constant 0.794 0.660 0.396 -0.224 3.542 2.719 2.391 -0.072 (5.4)*** (5.0)*** (2.7)*** (-2.7)*** (5.6)*** (5.7)*** (3.5)*** (-0.3) Control variables Yes Yes Yes Yes Yes Yes Yes Yes Year FEs Yes Yes Yes Yes Yes Yes Yes Yes Style FEs Yes Yes Yes Yes No No No No Family FEs No No No No Yes Yes Yes Yes Observations 33496 33496 29951 29951 33,496 33,496 29,951 29,951 R-Squared 0.015 0.013 0.007 0.011 0.016 0.014 0.009 0.011 P-value of Wald test: Pre-switch = Post-switch 0.224 0.054* 0.439 0.048** 0.485 0.145 0.757 0.032**
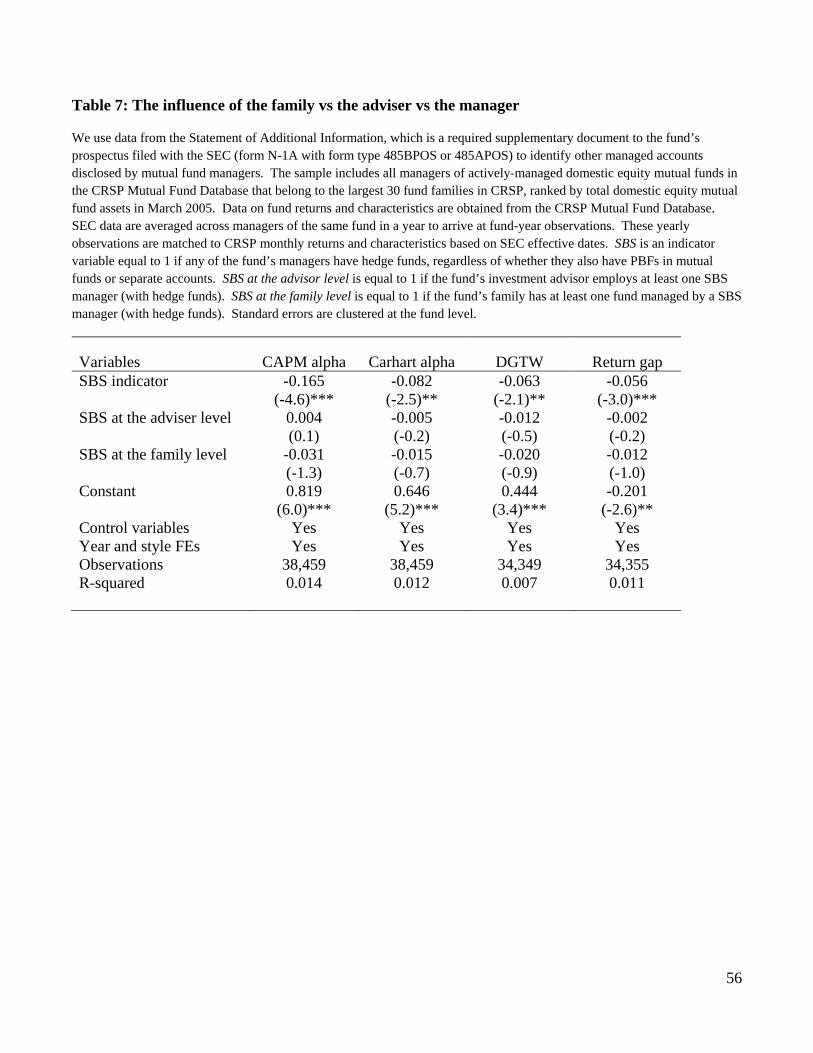
56
Table 7: The influence of the family vs the adviser vs the manager
We use data from the Statement of Additional Information, which is a required supplementary document to the fund’s prospectus filed with the SEC (form N-1A with form type 485BPOS or 485APOS) to identify other managed accounts disclosed by mutual fund managers. The sample includes all managers of actively-managed domestic equity mutual funds in the CRSP Mutual Fund Database that belong to the largest 30 fund families in CRSP, ranked by total domestic equity mutual fund assets in March 2005. Data on fund returns and characteristics are obtained from the CRSP Mutual Fund Database. SEC data are averaged across managers of the same fund in a year to arrive at fund-year observations. These yearly observations are matched to CRSP monthly returns and characteristics based on SEC effective dates. SBS is an indicator variable equal to 1 if any of the fund’s managers have hedge funds, regardless of whether they also have PBFs in mutual funds or separate accounts. SBS at the advisor level is equal to 1 if the fund’s investment advisor employs at least one SBS manager (with hedge funds). SBS at the family level is equal to 1 if the fund’s family has at least one fund managed by a SBS manager (with hedge funds). Standard errors are clustered at the fund level.
Variables CAPM alpha Carhart alpha DGTW Return gap SBS indicator -0.165 -0.082 -0.063 -0.056 (-4.6)*** (-2.5)** (-2.1)** (-3.0)*** SBS at the adviser level 0.004 -0.005 -0.012 -0.002 (0.1) (-0.2) (-0.5) (-0.2) SBS at the family level -0.031 -0.015 -0.020 -0.012 (-1.3) (-0.7) (-0.9) (-1.0) Constant 0.819 0.646 0.444 -0.201 (6.0)*** (5.2)*** (3.4)*** (-2.6)** Control variables Yes Yes Yes Yes Year and style FEs Yes Yes Yes Yes Observations 38,459 38,459 34,349 34,355 R-squared 0.014 0.012 0.007 0.011

57
Table 8: The relative importance of assets under management in mutual funds
We use data from the Statement of Additional Information, which is a required supplementary document to the fund’s prospectus filed with the SEC (form N-1A with form type 485BPOS or 485APOS) to identify other managed accounts disclosed by mutual fund managers. The sample includes all managers of actively-managed domestic equity mutual funds in the CRSP Mutual Fund Database that belong to the largest 30 fund families in CRSP, ranked by total domestic equity mutual fund assets in March 2005. Data on fund returns and characteristics are obtained from the CRSP Mutual Fund Database. SEC data are averaged across managers of the same fund in a year to arrive at fund-year observations. These yearly observations are matched to CRSP monthly returns and characteristics based on SEC effective dates. SBS is an indicator variable equal to 1 if the fund has at least one manager with hedge funds. Manager(s) focused on mutual funds indicator is equal to 1 if the percentage of total assets under management held in mutual funds (including the reporting fund itself), averaged across managers of the same fund in a year, is higher than the median percentage across all funds in that month. Standard errors are clustered at the fund level.
Variables CAPM alpha
Carhart alpha DGTW Return gap
SBS indicator -0.205 -0.126 -0.134 -0.058 (-6.0)*** (-4.6)*** (-4.8)*** (-3.2)*** Manager(s) focused on mutual funds indicator 0.012 0.026 -0.005 0.038 (0.6) (1.5) (-0.3) (3.7)*** SBS*Manager(s) focused on mutual funds indicator 0.150 0.259 0.251 0.024 (2.5)** (4.4)*** (5.5)*** (0.8) Constant 0.803 0.605 0.454 -0.176 (6.0)*** (5.0)*** (3.4)*** (-2.2)** Control variables Yes Yes Yes Yes Year and style FEs Yes Yes Yes Yes Observations 38,212 38,212 34,135 34,355 R-squared 0.015 0.013 0.008 0.012

58
Table 9: The effect of distribution channel
We use data from the Statement of Additional Information, which is a required supplementary document to the fund’s prospectus filed with the SEC (form N-1A with form type 485BPOS or 485APOS) to identify other managed accounts disclosed by mutual fund managers. The sample includes all managers of actively-managed domestic equity mutual funds in the CRSP Mutual Fund Database that belong to the largest 30 fund families in CRSP, ranked by total domestic equity mutual fund assets in March 2005. Data on fund returns and characteristics are obtained from the CRSP Mutual Fund Database. SEC data are averaged across managers of the same fund in a year to arrive at fund-year observations. These yearly observations are matched to CRSP monthly returns and characteristics based on SEC effective dates. SBS is an indicator variable equal to 1 if the fund has at least one manager with hedge funds. Direct-sold indicator is equal to 1 if 50% or more of the TNA of the fund is distributed through the direct-sold segment. Standard errors are clustered at the fund level.
Variables CAPM alpha Carhart alpha DGTW Return gap SBS indicator -0.180 -0.124 -0.118 -0.084 (-5.1)*** (-4.4)*** (-4.3)*** (-4.1)*** Direct-sold indicator 0.051 0.038 0.045 -0.018 (2.0)* (1.6) (2.1)** (-1.3) SBS*Direct-sold indicator 0.030 0.142 0.146 0.056 (0.5) (2.5)** (3.2)*** (1.9)* Constant 0.835 0.640 0.458 -0.195 (6.1)*** (5.2)*** (3.4)*** (-2.4)** Control variables Yes Yes Yes Yes Year and style FEs Yes Yes Yes Yes Observations 37,851 37,851 33,979 34,100 R-squared 0.015 0.013 0.007 0.011

59
Table 10: Effect of SBS management using Nohel et al (2010) and Cici et al (2010) sampling methodologies
We use data from the Statement of Additional Information, which is a required supplementary document to the fund’s prospectus filed with the SEC (form N-1A with form type 485BPOS or 485APOS) to identify other managed accounts disclosed by mutual fund managers. The sample includes all managers of actively-managed domestic equity mutual funds in the CRSP Mutual Fund Database that belong to the largest 30 fund families in CRSP, ranked by total domestic equity mutual fund assets in March 2005. Data on fund returns and characteristics are obtained from the CRSP Mutual Fund Database. SEC data are averaged across managers of the same fund in a year to arrive at fund-year observations. These yearly observations are matched to CRSP monthly returns and characteristics based on SEC effective dates. Nohel et al SBS is an indicator variable equal to 1 if the fund has at least one SBS manager according to the sampling methodology in Nohel et al (2010). Cici et al SBS is an indicator variable equal to 1 if the fund has at least one SBS manager according to the sampling methodology in Cici et al (2010).
Variables CAPM alpha
Carhart alpha DGTW Return gap
CAPM alpha
Carhart alpha
DGTW Return gap
Panel A: Full sample (2005-2011) Nohel et al SBS -0.140 -0.022 -0.020 -0.013
(-2.9)*** (-0.5) (-0.5) (-0.8)
Cici et al SBS -0.068 -0.025 -0.027 -0.026 (-3.7)*** (-1.6) (-1.8)* (-2.9)*** Constant 0.747 0.531 0.331 -0.284 0.690 0.534 0.339 -0.269 (5.5)*** (4.5)*** (2.7)*** (-3.8)*** (5.3)*** (4.6)*** (2.9)*** (-3.7)*** Control variables Yes Yes Yes Yes Yes Yes Yes Yes Year and style FEs Yes Yes Yes Yes Yes Yes Yes Yes Observations 38,459 38,459 34,349 34,355 38,459 38,459 34,349 34,355 R-squared 0.014 0.012 0.007 0.011 0.016 0.014 0.009 0.011 Panel B: Sub sample (2005-2007)Nohel et al SBS 0.135 0.175 0.160 -0.021 (1.8)* (2.3)** (2.9)*** (-0.7) Cici et al SBS -0.051 -0.020 -0.016 -0.029 (-2.1)** (-0.8) (-0.6) (-2.3)** Constant 1.222 0.467 0.879 -0.340 1.357 0.589 0.995 -0.313 (6.3)*** (2.7)*** (4.5)*** (-3.1)*** (7.2)*** (3.3)*** (5.0)*** (-2.8)*** Control variables Yes Yes Yes Yes Yes Yes Yes Yes Year and style FEs Yes Yes Yes Yes Yes Yes Yes Yes Observations 38,459 38,459 34,349 34,355 38,459 38,459 34,349 34,355 R-squared 0.014 0.012 0.007 0.011 0.016 0.014 0.009 0.011

60
Table 11: Analysis of active management (hedge fund switchers)
This table contains regression estimates from regressions examining funds that switch from having no side-by-side managers (no hedge funds) to having side-by-side managers (with hedge funds) during the sample period. We use data from the Statement of Additional Information, which is a required supplementary document to the fund’s prospectus filed with the SEC (form N-1A with form type 485BPOS or 485APOS) to identify other managed accounts disclosed by mutual fund managers. The sample includes all managers of actively-managed domestic equity mutual funds in the CRSP Mutual Fund Database that belong to the largest 30 fund families in CRSP, ranked by total domestic equity mutual fund assets in March 2005. Data on fund returns and characteristics are obtained from the CRSP Mutual Fund Database. SEC data are averaged across managers of the same fund in a year to arrive at fund-year observations. These yearly observations are matched to CRSP monthly returns and characteristics based on SEC effective dates. The dependent variable in columns (1) and (2) is the average Active Share in the subsequent 12 months, whereas, in columns (3) and (4), it is the average of Tracking Error in the subsequent 12 months. In the last two columns, the dependent variable (AsTE) is an indicator variable equal to 1 if a fund’s active share and tracking error are above their respective medians, where the median value is measured within each investment style. Pre-SBS switch is an indicator variable equal to 1 for switcher funds in all fund-months before the switch. Post-SBS switch is an indicator variable equal to 1 for switcher funds in all fund-months after the switch. For all other funds these indicator variables are 0. New manager is an indicator variable equal to 1 if a fund changes its side-by-side management status due to adding new managers with side-by-side accounts. Standard errors are clustered at the fund level.
Variables Active Share Active Share Tracking Error Tracking Error AsTe AsTe Pre-SBS switch -0.061 -0.054 -0.001 -0.001 -0.139 -0.063
(-2.0)** (-1.2) (-3.7)*** (-3.1)*** (-2.3)** (-0.8) Pre-SBS switch * New manager -0.017 0.000 -0.226 (-0.4) (0.7) (-2.3)** Post-SBS switch -0.029 -0.023 0.000 0.000 0.010 0.059
(-0.9) (-0.5) (0.5) (0.2) (0.1) (0.6) Post-SBS switch * New manager -0.059 -0.001 -0.237
(-1.1) (-1.3) (-2.0)** Constant 0.471 0.469 -0.001 -0.001 -0.480 -0.490
(5.8)*** (5.7)*** (-0.7) (-0.8) (-2.0)** (-2.0)** Control variables Yes Yes Yes Yes Yes Yes Observations 30,614 30,483 30,429 30,316 30,482 30,361 R-Squared 0.453 0.453 0.399 0.399 0.082 0.086