plc in latin america sergio angeli, cto plc ventures july 2007
TRANSCRIPT

PLC in Latin America
Sergio Angeli, CTO PLC Ventures
July 2007

2
1. About PLC Ventures
2. PLC opportunities in Latin America
• Telecom
• Smart Grid
• Government
3. Case Study: PLC Proof of Concept Guatemala
• Description
• Challenges
• Results
4. Conclusions
Table of Contents

3
About PLC Ventures

4
Corporate structure
(Mexican Operating Company)
(Territory: Cono Sur, Br, Ar, Chile) (Territory: Cono Norte: Mx, Central America, Caribbean, Andean Region)
(Brazilian Operating Company) (Peruvian Operating Company)(Guatemalan Operating Company)
99.99% 99.99%
(Technological Assets, licensees, software) (Supply Agmts with related and 3rd parties)
1.0% 99%
100% 100%100%
0.01%
(PR Operating Company)
Local Partner
75% 25%0.01%
Local Partner Local Partner Local Partner
99.99%
Local Partner
0.01%
Campollo Group

5
ODM Manufacturer
Service Provider Utility
Co.
Local Partner 2
Local Partner 1
Price and Delivery Guarantee
License and Support Contract
Manufacturing and Technical
Support Contract
Last Mile Access
PLC Assets Admin/Opp Software
Development
Customization Scalability
Price, QoS Cost Guarantee
Voice & Data Strategic Contributions Capital Investment
Chipset Supplier
Accessories Suppliers
Partner Agreement
Cost
s S
tru
ctu
reP
rofi
tab
ilit
y
Local Operating
Co.
Utility
IRU
Fiber ProviderOutsource Install.& Maint.
I&M Contract
Backbone Contract
Development Institutions
Smart Grid Connectivity National Security
11
PLC Operator Model

6
Backbone
SP 1 SP 2
CarriersInternational connections
Service Providers(ILEC, CLEC, ISP)
PLC OperatorIntegration, deployment,network operation and management
MV MV
LV
LVLV
FO
NMS
End Users
PLC Operator Model
Electric UtilityInfrastructure provider
Smart Grid user

7
Facts
PLC Ventures is technology “agnostic”.
PLC Ventures has manufacturing agreements and commercial arrangements with leading manufacturers/ODMs of PLC equipment and accessories. In addition we developed a proprietary PLC Network Management System for remote and real time network administration.
PLC Ventures has offices in 6 countries and a team of 20 professionals. We have installed PLC technology test pilots in different electrical grids in America and Europe.
In Latin America, our strategic market, we have developed a model of PLC Operator whereby we lease electric grids and develop PLC networks, to provide voice and data service to final users, with one or more telecom carriers.
To date, we have executed 2 exclusive IRUs: with EEGSA (Iberdrola) in Guatemala y LDS (PSEG) in Peru, totaling 1.5 million electric clients as potential market.
PLC Ventures has deployed two commercial test pilots, in Guatemala and Peru, for Proof of Concept of the technology and its commercial viability. These pilots include the participation of the electric companies, telecom carriers and final telecom subscribers.
The results have been conclusive: PLC as access technology offers an economic alternative for last mile transport of voice and data services with excellent quality of service (QoS).

8
PLC in Latin America

9
Telecom Solutions
Home Network/Triple Play
Access Network/Triple Play
Utility Solutions
Smart Grid
Government Solutions
Digitalization
Market drivers / limitations
Triple play initiatives
Limited by broadband penetration
Limited offering by incumbents
Lack of access to incumbent last mile
Technical and non-technical losses
Regulatory dependant
Digital divide
Access to economic support
PLC Applications in Latin America

10
PLC presents competitive advantages for Telecom in Latin America :
Limited availability of alternative “last miles” for telecommunication services, as incumbent operators normally do not open their network for third party service providers.
Market growth opportunity given by low penetration of broadband services, data and voice.
PLC enables solutions to crucial problems to electric companies in Latin America:
Technical and non technical losses, ranging in the region from low single digits in countries like Peru and Chile to higher than 20% in countries like Honduras and some electric distribution companies in Brazil.
PLC is the most efficient alternative for a mass deployment of social digital programs:
High penetration and capillarity of electric networks compared to other telecommunication networks, including traditional telephony, wireless, and cable.
PLC Opportunity in Latin America

11
Telecom Penetration in Latin America

12
Quality of Service Maintain levels of quality between stipulated thresholds
» Monitoring of Transients, Flicker, Voltage Surge, Faults» Harmonic and Inter-harmonic Analysis
According to feedback gathered by PLC Ventures, Utilities in Latin America have particular needs that can be addressed through Smart Grid solutions:
Operations Reduce service down time, improve efficiency
» Quickly detect, identify and locate problems Faults detectors, Re-closers, etc.» Remote network operation RTUs, Capacitor banks automation, load balancing, etc.
Smart Grid Applications
Billing Efficient reading and collection, reduce non-technical losses
» Targeted automatic reading,» Fraud detection

13
Digital Divide
Electricity grid penetration: 90 %
Total of Homes with Internet Access in Brazil (%)
15%
85%
YES NO
0% 20% 40% 60% 80% 100%
SOUTHEAST
SOUTH
MID-WEST
NORTH
NORTHEAST
Homes with Internet Access per Region in Brazil
YES
NO
Several initiatives exist today in Brazil to breach the “Digital divide”GESAC (Barrerinhas, etc.), change in FUST use policy, etc.
Source: Atrlas de Energia Elétrica do Brasil – 2a Edição - ANEEL
Source: Comitê Gestor da Internet no Brasil (July / August 2006)
Source: Comitê Gestor da Internet no Brasil (July / August 2006)
14
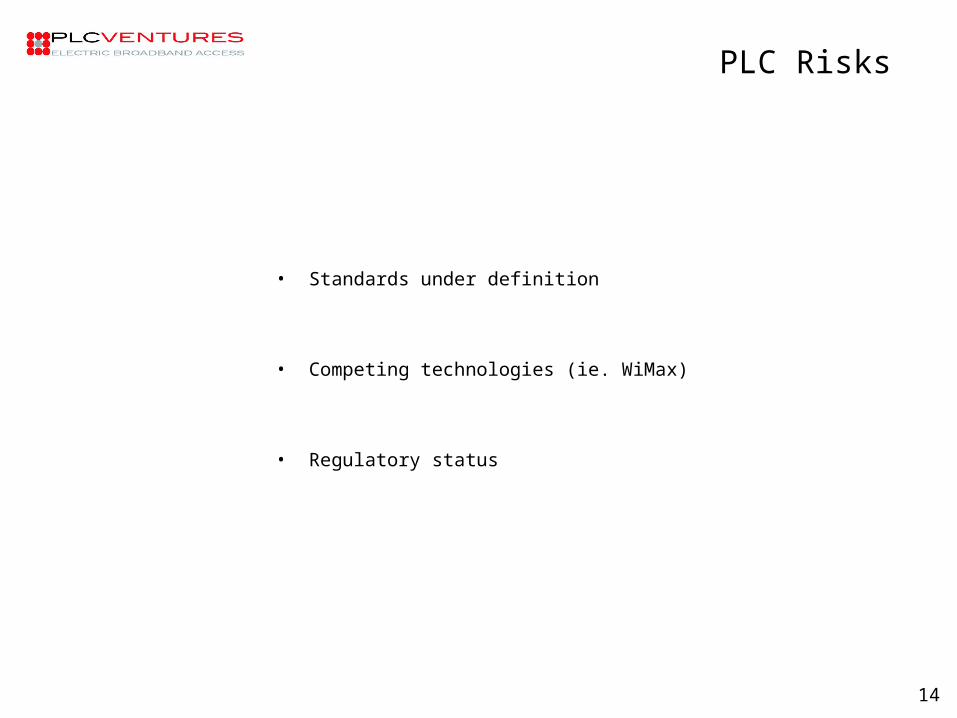
PLC Risks
• Standards under definition
• Competing technologies (ie. WiMax)
• Regulatory status

15
Case Study: PLC Proof of Concept in Guatemala

16
Introduction
• Commercial Project Guatemala– Broadband Internet Access and Fixed Telephony for end users
• Business and residential users• 750.000 electric customers, 80% of grid enabled with PLC
– 100.000 forecasted telecom end users in 2 years, 200.000 in 5 years – Smart Grid applications for the utility
• Project Plan– 1st Stage: Lab tests and small field trials – DONE– 2nd Stage: Proof of Concept – 95% completed
• A. Prove the technical feasibility of PLC as an Access Medium in the electric grids of Guatemala.
• B. Prove the commercial feasibility of PLC in a business model of “Carriers’ Carrier”.– 3rd Stage Commercial roll out – end 2007 / beginning 2008
Participant Role
EEGSA •Infrastructure (electric grid)
•Technical Support (electrical instalation) – outsourced
COMCEL •Internet Service Provider – ISP
•IP Telephony Services Provider – VoIP Provider
EBA Guatemala PLC Ventures Group
•PLC Technology – access network infrastructure equipments, management
software, integration, CPEs
•Project Management
End Users •Personal Computer, service use, feedback.

17
PoC Footprint & Status
Home Passed 800
PLC Infrastructure units 42
CPEs (existing customers) 100
Underground transformers 4
Overhead transformers 32

18
Logical Network Diagram
ISPVoIP SP
NPL NOC
PL
C A
cces
s N
etw
ork
– Z
on
e 15
FOBackbone
1 .Service Providers’ links converge to the Backbone
2 .BPL Access network is remotely managed from the NOC.
3 .Transport links connect NOC to last mile BPL network clusters
4 .Telecommunications signals are transmitted through the electric grid using BPL technology
5 .Clients connect their CPEs to the electric socket to gain access to services.
Service Providers’ Gateways and NOC
Key PLC Access Network Components
PLC Nodes Coupling Units CPEs NMS
MV Grid
MV Grid
MV Grid
LV Grid
LV Grid
LV Grid LV GridLV Grid
*Diagram for reference purposes only, actual number of deployed units NOT reflected.

19
LV PLC Coverage & Frequency Planning
20
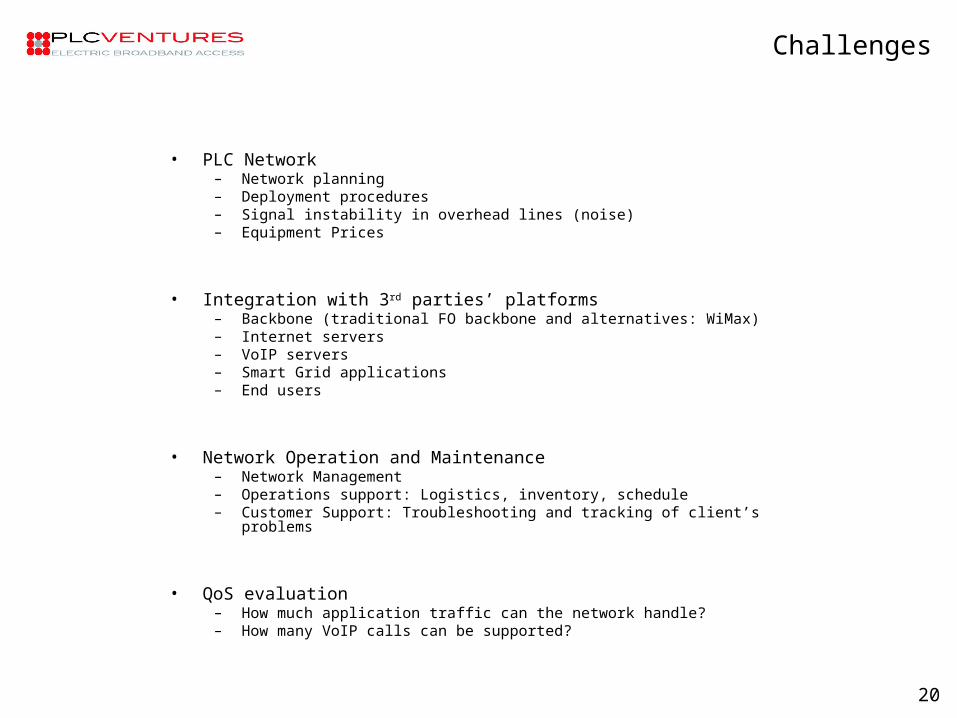
Challenges
• PLC Network– Network planning– Deployment procedures– Signal instability in overhead lines (noise)– Equipment Prices
• Integration with 3rd parties’ platforms– Backbone (traditional FO backbone and alternatives: WiMax)– Internet servers– VoIP servers– Smart Grid applications– End users
• Network Operation and Maintenance– Network Management– Operations support: Logistics, inventory, schedule– Customer Support: Troubleshooting and tracking of client’s problems
• QoS evaluation– How much application traffic can the network handle?– How many VoIP calls can be supported?

21
PLC deployment process, network planning and procedures:
M
SM
T T
S S
TM
SSMM
S S S S
M
S S
S S S S S S S S
M
S SSM
S S S S S S S S
TM
S SSM
S S S S S S S S S S
SM
SM
S S
MT
Edificio
BT
1
2 3 4 5
6 7 8 9 10 11 12
M
S S
Down Up Down Up Down Up Down Up Down Up Down Up
Latency (ms) - - 6,3 7 9,6 9,7 12,2 12,1 18,2 17 21 19Throughput (%) - - 100 100 100 100 100 100 100 100 100 100Active Clients
Latency (ms) - - 7,3 8 10,5 12 13,8 14 19 18 23 21Throughput (%) 100 100 100 100 100 100 100 100 100 100 100 100Active Clients
Latency (ms) - - 8,7 10 10,5 15 14,8 16,5 21,5 22 26,5 24Throughput (%) 100 100 100 100 100 100 100 100 100 100 100 100Active Clients
Latency (ms) - - 10 14,5 14 18,5 18 20,5 28 26 32,5 31,5Throughput (%) 100 100 100 100 100 100 100 100 100 100 100 100Active Clients
Latency (ms) - - 16 19 19,5 23 23 26 35 30 39 35Throughput (%) 100 100 100 100 100 100 94 98 89 95,2 84,2 93,9Active Clients
Latency (ms) - - 19 25 23 30 24 30 39,5 37 43 40Throughput (%) 98,4 100 73,1 100 69,9 97,5 63,5 94,5 61,2 85,6 58,1 84,4Active Clients
Latency (ms) - - 22 27 23 32 28 35 43,2 40 45,9 42Throughput (%) 86,6 100 60,6 98,1 58,8 94,1 56,3 87,7 55,3 79,3 50,9 77,7Active Clients 37 40
22 27 32 37
27 3221
16 18
6
6
4 6
6
21 23
3
VoIP Calls
112
16 2111
Internet StreamsNumber of CPEs: 40 0 2
Internet BW: 512k/256k
12
0
1
4
8
16
20 25
22
28 33
14 19
10 15
12 14 18 23
1
2116
8 24 2910
12 17
-
1. Area Selection 2. Grid Analysis 3. Network Planning 4. Software simulation 5. Deployment 6. Network Management
Challenge: PLC network
Signal instability in overhead lines:
Alternatives:• Line Conditioning
– Eliminating the noise source
• Firmware improvement– Intensive research work done withchipset providers to improve system stability
• Differential signal injection– Sometimes useful, but not always effective
• Line separation = 70 cm• Wavelength (λ = c / f) = 10 meters (@ 30MHz)
– Not always possible• Single phase circuits
– Twice the cost• Two coupling units required
Lámpara electronica - 40 ms
-0.6
-0.5
-0.4
-0.3
-0.2
-0.1
0
0.1
0.2
0.3
-0.0
046
-0.0
018
0.00
09
0.00
36
0.00
64
0.00
91
0.01
18
0.01
45
0.01
73
0.02
00
0.02
27
0.02
54
0.02
82
0.03
09
0.03
36
Segundos
Vo
ltio
s Chan1
60Hz
Percentage of noise sources types found in Zone 15
Dead-end line79%
Top-pin7%
Vertical7%
Unidentified7%

22
• Backbone, QoS– Packets tagging and prioritization– Same configuration used in backbone, ISP NOC and PLC network
• SIP parameters
• Internet configuration
Challenge: Integration
PLC
VLAN Info Management
Data 1
Data 2
Voice
RADIUS
FTP Server
SQL DB
Management Server
EBA NMS
SP1
SP2
SP3
VLAN Switch
Administrators, Operators

23
Challenge: Network Management
NMS main functions:
•Trouble Tickets
•Inventory
•Task Scheduler
•Elements auto configuration and monitoring

24
PLC Network
Real-time Monitoring Traffic Simulation
Challenge: QoS Evaluation
QoS evaluation platforms: IxChariot – Console & EndpointsJDSU* - Appliance & Capture Agents

25
Results

26
Link Transformer LV HE to Dr. Girón
Clinicas Medicas building HE to client Dr. Otto Reyna
MV HE to TRD5 (MV Repeater)
TDR (MV Repeater) to Multimedica building HE
Voltage LV – 220 V LV-220V MV – 13 kV MV – 13 kV
Topology LV Overhead Underground Overhead Overhead and Underground (with intermediary transition)
Transmission Mode
10 (Max 85 Mbps) 10 (Max 85 Mbps) 5 (Máx 133 Mbps) 5 (Máx 133 Mbps)
PLC Performance

27
MV - OverheadMV - Underground TransitionLV access Tx RxMDUs 49 46Single homes 45 27
Down (**) Up (**)Data 1 512 512Data 2 1024 1024
Data (512) + VoIP (G711) 700 512Data VoIP
1 1
MOSPacket Loss
JitterLatency
Prioritization802.1p
VLANs per Cluster
4.2 + (*)0.15% (*)
30ms (max)
ToS
PLC
Avg. Bandwidth (Mbps)4045
1.7 - 2 ms
Avg VOIP Quality
VoIP
Data
Throughput (kbps) - w/ BW limitation
*Tests done with IXChariot platform** Upstream and Downstream rates are user configurable
QoS performance
-
10.00
20.00
30.00
40.00
50.00
60.00
Mb
ps
Rx Tx
Enlaces Infraestructura de Acceso
Enlaces Aereos Media Tensión
Enlaces Aereo-Subterráneo Media Tension
Acometidas en Baja Tensión
Enlaces Aereos Baja Tensión
-
20.00
40.00
60.00
80.00
100.00
120.00
Mb
ps
Rx Tx
CPE( Clientes) Internos Edificio -> Master
Clinicas Médicas Multimédica Maria del Alma

28
VoIP service statistics
Simultaneous calls
Calls per hour

29
User Satisfaction Poll Results

30
• Network characteristics:– Protocol: SIP– CODEC: G.711– Digital Services: Caller-ID, on-hold, transfer, redirect
• VoIP Quality measurement– VoIP traffic simulation – Stress test
• IxChariot software suite• 45 simultaneous calls in PLC Cluster
– 20 Real VoIP calls– 25 Simulated VoIP calls
– VoIP real-time traffic monitoring• Network Sniffer Appliance & Agents• Traffic Analyzer
– User satisfaction polls
• Results (average)– MOS: 4.2
• Recommended value: >3.5– Latency: 13ms (avg. one way, from CPE to Softswitch)
• Recommended value: < 100 ms– Jitter: 2.281 ms
• Recommended value: < 20ms– Packet loss: 0.1%
• Recommended value: < 0.2%– Total VoIP traffic in cluster: up to 4000 Kbps
Recommended values based on ITU Recommendations G.107 and P.800 and / or experiences from commercial VoIP deployments.
QoS evaluation
31
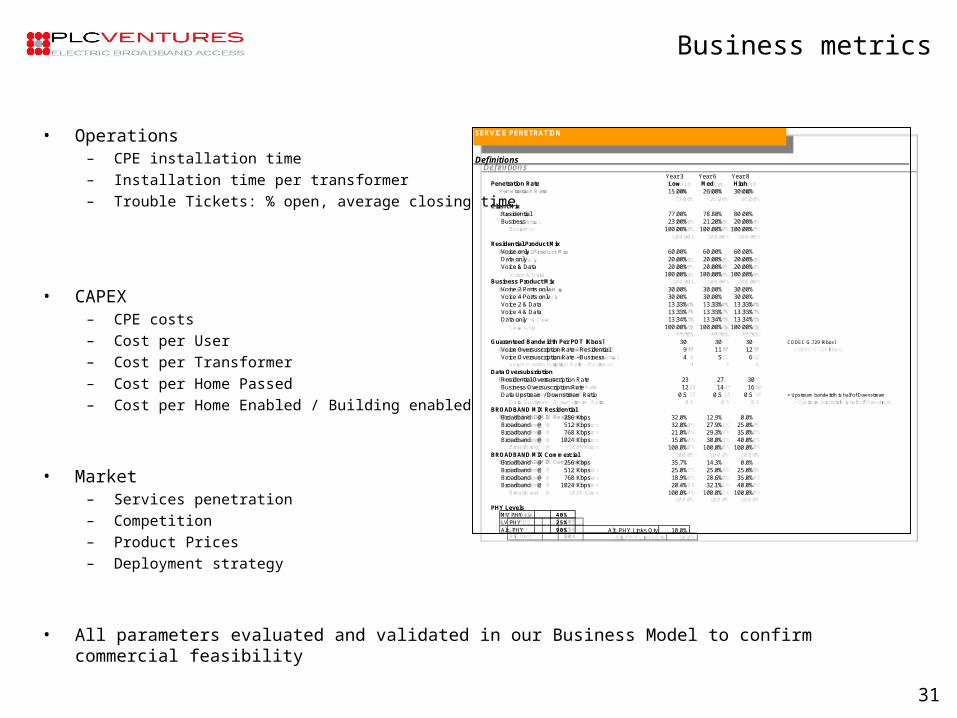
Business metrics
• Operations– CPE installation time– Installation time per transformer– Trouble Tickets: % open, average closing time
• CAPEX– CPE costs– Cost per User– Cost per Transformer– Cost per Home Passed– Cost per Home Enabled / Building enabled
• Market– Services penetration– Competition– Product Prices– Deployment strategy
• All parameters evaluated and validated in our Business Model to confirm commercial feasibility
SERVICE PENETRATION
Definitions
Year 3 Year 6 Year 8Penetration Rate Low Med High
15.00% 26.00% 30.00%
Client MixResidential 77.00% 78.80% 80.00%Business 23.00% 21.20% 20.00%
100.00% 100.00% 100.00%
Residential Product MixVoice only 60.00% 60.00% 60.00%Data only 20.00% 20.00% 20.00%Voice & Data 20.00% 20.00% 20.00%
100.00% 100.00% 100.00%Business Product Mix
Voice 2 Ports only 30.00% 30.00% 30.00%Voice 4 Ports only 30.00% 30.00% 30.00%Voice 2 & Data 13.33% 13.33% 13.33%Voice 4 & Data 13.33% 13.33% 13.33%Data only 13.34% 13.34% 13.34%
100.00% 100.00% 100.00%
Guaranteed Bandwidth Per POT [Kbps] 30 30 30 CODEC G.729 [Kbps]
Voice Oversuscription Rate - Residential 9 11 12 Voice Oversuscription Rate - Business 4 5 6
Data OversubsriptionResidential Oversuscription Rate 23 27 30Business Oversuscription Rate 12 14 16Data Upstream / Downstream Ratio 0.5 0.5 0.5 = Upstream bandwitdh is half of Downstream
BROADBAND MIX ResidentialBroadband @ 256 Kbps 32.0% 12.9% 0.0%Broadband @ 512 Kbps 32.0% 27.9% 25.0%Broadband @ 768 Kbps 21.0% 29.3% 35.0%Broadband @ 1024 Kbps 15.0% 30.0% 40.0%
100.0% 100.0% 100.0%BROADBAND MIX Commercial
Broadband @ 256 Kbps 35.7% 14.3% 0.0%Broadband @ 512 Kbps 25.0% 25.0% 25.0%Broadband @ 768 Kbps 18.9% 28.6% 35.0%Broadband @ 1024 Kbps 20.4% 32.1% 40.0%
100.0% 100.0% 100.0%
PHY LevelsMV PHY 40%LV PHY 25%Alt. PHY 90% Alt. PHY Links Qty 10.0%

32
Conclusions

33
Keys for a successful PLC deployment
ODM / OEM
Backbone
Utility
Subcontractor
•Viable IRU execution
•Clear O&M procedures definition
•Use the right technology
•Development of appropriate applications and solutions
•Appropriate Network design
•Efficient network management
Micro chips
ISP
VoIP
IRU
O&M Procedures
Technology
Products
Services
Interconnection
Support
Access Network
Software
I+DEngineering
Project Management

34
Conclusions: Value Proposition
PLC in Latin America: Telecom Market Opportunity• Most Competitive Alternative Last Mile, in terms of deployment time and cost
• “Industry disruptive” opportunity comparable to wireless plays of the 90s
PLC Ventures: Operator strengths• Electric Contracts (Irrevocable Right of Use of Electric Grids)
• Technology Assets (3rd party technology contracts, Proprietary Assets)
• Proof-of-Concept Deployments
• Negotiating with Electric Distribution Companies
• PLC Technology Know-how, Team and Field Experience
• Economies of Scale, from Regional Presence

35
Thank you
Contact information:
Sergio Angeli, CTO, PLC Ventures
e-mail: [email protected]
USA: +1 305 365 0102
Guatemala: +502 2382 4040
Contact information:
Sergio Angeli, CTO, PLC Ventures
e-mail: [email protected]
USA: +1 305 365 0102
Guatemala: +502 2382 4040