please cite this article as: narasimha, m., mainza, a.n ...337846/uq337846_oa.pdf · this model has...
TRANSCRIPT

A semi-mechanistic model of hydrocyclones – developed from industrial dataand inputs from CFD
M. Narasimha, A.N. Mainza, P.N. Holtham, M.S. Powell, M.S. Bren-nan
PII: S0301-7516(14)00105-7DOI: doi: 10.1016/j.minpro.2014.08.006Reference: MINPRO 2641
To appear in: International Journal of Mineral Processing
Received date: 22 August 2013Revised date: 6 June 2014Accepted date: 16 August 2014
Please cite this article as: Narasimha, M., Mainza, A.N., Holtham, P.N., Powell, M.S.,Brennan, M.S., A semi-mechanistic model of hydrocyclones – developed from indus-trial data and inputs from CFD, International Journal of Mineral Processing (2014), doi:10.1016/j.minpro.2014.08.006
This is a PDF file of an unedited manuscript that has been accepted for publication.As a service to our customers we are providing this early version of the manuscript.The manuscript will undergo copyediting, typesetting, and review of the resulting proofbefore it is published in its final form. Please note that during the production processerrors may be discovered which could a!ect the content, and all legal disclaimers thatapply to the journal pertain.

ACCE
PTED
MAN
USCR
IPT
ACCEPTED MANUSCRIPT
1
A SEMI-MECHANISTIC MODEL OF HYDROCYCLONES – DEVELOPED FROM INDUSTRIAL DATA AND INPUTS FROM CFD
M. Narasimhaa*, A.N. Mainzab, P.N. Holtham c, M.S. Powell c , M. S. Brennan c
a Department of Chemical Engineering, IIT Hyderabad, Ordinance Factory Estate, Yeddumailaram, 502205, India.
bCentre for Minerals Research, Chemical Engineering, University of Cape Town, Rondebosch, 7701, Cape Town, South Africa
cJKMRC, Sustainable Mineral Institute, The University of Queensland, Isles Road, Indooroopilly 4068, Queensland, Australia.
ABSTRACT
The flow behavior in hydrocyclones is extremely complex, leading the designers to rely on
empirical equations for predicting cyclone performance. A number of classifying cyclone models
have been developed and used in mineral comminution circuit simulators in the past. The
problem with these empirical cyclone models is that they cannot be used outside the range of
conditions under which they were developed. A semi-mechanistic hydrocyclone model is
developed using the dimensionless approach based on both the fluid mechanics concepts from
Computational fluid dynamics (CFD) simulations and the wide range of industrial cyclone
performance data. The improved model consist a set of equations for the water split to underflow
( fR ), reduced cut-size ( cd50 ), throughput (Q) and sharpness of the separation (α). The model
for fR , cd50 , Q gives a very good fit to the data. The alpha model shows reasonable correlation
for the cyclone design and operating conditions. Additional data sets were used to validate the
new hydrocyclone model by comparing the predictions of the model equations with the
experimental results.
Key words: Hydrocyclone, mathematical modelling, computational fluid dynamics, classification
* Corresponding author: [email protected], Fax: +91 40 2301 6003

ACCE
PTED
MAN
USCR
IPT
ACCEPTED MANUSCRIPT
2
1. Introduction Feed slurry is introduced under the high pressure tangentially into the hydrocyclone. This creates
the centrifugal force and the flux of particles toward the radial positions, thus leading to phase
separation. Although the design and operation of the hydrocyclone is simple, the flow behavior is
complex. This poses a challenge when developing a mathematical model that can be applied for
the design and the optimization of this device. As a result many designers rely on empirical
equations for predicting cyclone performance. In addition to capacity, hydrocyclones are usually
modelled in terms of partition curve properties namely; cut-size, flow split and sharpness of
separation. One of the first comprehensive model that was used to predict the performance of
industrial hydrocyclones was developed by Lynch and co-workers at University of Queensland
(Lynch and Rao, 1968; Rao, 1966). This model was applied to predict the cyclones performance
at Mount Isa Mines, Australia. The methodology has been successfully adopted in the minerals
industry (Lynch, 1977). The relationships in their model were derived from analysis of
experimental data collected from numerous trials performed to capture the effect of operational
and geometric variables. A number of classifying cyclone models, with some mechanistic basis,
has been developed over the past four decades (Nageswararao, 1978; Plitt, 1976; Svarovsky,
1984). The two commonly used in simulation packages are Plitt (1976) and Nageswararao
(1978) which have been incorporated into the MODSIM and JKSimMet software respectively.
These models have been successfully used in grinding circuit simulations.
The Plitt (1976) model consist equations for cyclone throughput, volumetric flow split, cut-size
and sharpness of classification using the original data from Rao's (1966) tests on a 50.8-cm
diameter hydrocyclone along with those from 3.1, 6.2 and 15.2 cm diameter units. This model
implicitly assumes that the cyclone performance is independent of feed material characteristics
and is claim that performance could be estimated with reasonable accuracy even when no
experimental data are available.
The Nageswararao (1978) model consists of three basic equations: The capacity equation relating
feed flow rate with operating pressure, and two partition curve properties namely; the water
recovery to the underflow (Rf) and the corrected cut-point, (d50c). The Whiten equation (Lynch
and Rao, 1975) is then used to estimate the sharpness of separation (α). These three equations
include the material-specific parameters that take up the effects of differences in feed size
distribution solids content and the influences of cyclone geometry variables.

ACCE
PTED
MAN
USCR
IPT
ACCEPTED MANUSCRIPT
3
Other hydrocyclone models include (Asomah, 1996; Castro, 1990; Kojovic, 1988; Lynch et al.,
1975; Marlow, 1973; Tavares et al., 2002; Xiao, 1997). Asomah (1996) included the cyclone
inclination to the vertical position and attempted to develop an explicitly equation for the
sharpness of separation. Castro (1990) re-fitted a number of additional data sets to obtain slightly
different values of the exponents in the Nageswararao (1978) equations. Combining the first
industrial database on cyclones generated at JKMRC (Rao, 1966) with the laboratory data (Plitt,
1976) developed an alternative general-purpose cyclone model.
The problem with the above-mentioned empirical cyclone models is that they cannot be used
outside the range of conditions under which they were developed. Furthermore, any change to
the design of the cyclone (e.g. cone angle, body length etc) means that the empirical constants
have to be refitted.
In view of this shortcoming, inputs from mathematical models based on fluid mechanics are
highly desirable. Alternatively multi-phase flow in cyclones can be modelled more
fundamentally by Computational Fluid Dynamics (CFD). CFD provides a means of predicting
velocity profiles under a wide range of design and operating conditions.
There are numerous numerical studies on the flow and the particle motion in hydrocyclones
(Boysan et al., 1982; Brennan et al., 2007; Delgadillo and Rajamani, 2005; 1996; He et al., 1999;
Hsieh and Rajamani, 1988; Hsieh and Rajamani, 1991; Narasimha et al., 2006a; Narasimha et
al., 2007; Narasimha et al., 2005; Nowakowski et al., 2004; Nowakowski et al., 2000; Suasnabar,
2000 and Narasimha 2010) and these studies have used a wide range of turbulence and
multiphase models. It is well understood that in future studies, the focus should be to model the
three-dimensional flow in a hydrocyclone with at least the Reynolds stress model/LES. The
particle simulations should at least include the effects of the turbulence on the particles. All these
developed models are mainly applicable to low to moderate feed solid concentration levels. A
successful CFD model would be a useful tool for studying design dimensions. More importantly,
alternative geometries may be rapidly examined. However, CFD simulations can be used to
provide information on key variables that affect the performance of the hydrocyclone alone and
how they can be presented in terms of dimensionless terms that can be incorporated in semi-
empirical models.

ACCE
PTED
MAN
USCR
IPT
ACCEPTED MANUSCRIPT
4
In this paper, the development of improved semi-empirical hydrocyclone model is attempted by
collecting an extensive historical data base. Inputs on particle classification mechanism elucidate
from CFD were used to understand and identify the key flow variables that affect the cyclone
performance when classifying the particles by size wise. Although historical data covered a wide
range of conditions further tests were performed at both full scale and pilot-plant to fill the gaps,
especially at low to moderate feed solids concentration and for different cone sections. A new
cyclone model structure based on a dimensionless approach that incorporates the variables
suggested to be important from the CFD is reported and model validation results are given.
2. Data Collection A large number of data sets containing the performance of hydrocyclones when operated under
different conditions and various designs was compiled and used for the development of the
model. The composition of the data includes larger portion of the historical data, the data
collected from series of tests conducted with pilot and laboratory size cyclones to fill the gaps in
the database such as hydrocyclones operating at on low feed solids and the data from
hydrocyclones fitted with various cone angles.
2.1. Historical data
The following is a summary of researchers who have extensively measured the hydrocyclone
performance data used for the development of the new model reported in this work.
(Rao, 1966)
(Nageswararao, 1978)
(Castro, 1990)
(Asomah, 1996)
(Hinde et al., 1979)
Rao (1966) conducted closely controlled tests with 150, 250, 381, and 508 mm size Krebs
cyclones, using limestone and copper ore slurries. The aim of the work was to study the effects
of change in the cyclone outlets (vortex finder and spigot) dimensions, the feed pressure and the
concentration of solids in the feed pulp on the capacities and classification performance. Lynch
et al. (1975) developed the linear cyclone models using these data sets.

ACCE
PTED
MAN
USCR
IPT
ACCEPTED MANUSCRIPT
5
Nageswararao (1978) conducted classification tests on 100, 150, 250 and 381 mm size Krebs
cyclones by varying the design and operating conditions and obtained a wide range of data with
limestone as a feed material. Further the influence of cone angle and cyclone length was studied
using a 150 mm Krebs cyclone. Nageswararao (1978) had developed an industrial classifying
cyclone model using the Lynch and Rao (1975), Rao (1966) and the above mentioned data sets.
This model has been widely used in mineral comminution circuit simulator, JKSimMet.
Hinde et al., (1979), Mackay et al., (1981) performed tests using a large diameter industrial
cyclone (31 inch cyclone) with a tangential inlet and the feed material for the test work
comprised heavy minerals. The aim of the test work was to evaluate the influence of the spigot
size, inlet diameter, feed flow rate and feed solids concentrations on the classifying performance
of the hydrocyclone.
Castro (1990) conducted experiments in a 10 inch Krebs cyclone to determine the effect of
rheology on the hydrocyclone performance. These tests had two levels (fine and coarse) feed size
distribution with three levels of fluid viscosities. The feed solids concentration was varied from
25 wt% to 75 wt%. Further the industrial tests were also conducted to validate the developed
model in a 508 mm Krebs cyclone operating with Mount Isa Copper ore, Australia. This series of
tests treated the slurry using different vortex finder and spigot diameters and used two levels of
feed solids concentration.
Asomah (1996) conducted an extensive series of experiments in 4 and 20 inch cyclones while
studying the effect of inclination on cyclone performance. For the first time a cyclone model for
the inclination effect was built and validated with limited data. In addition to the above data
bases, a number of datasets on 15, 10 and 6 inch Warman cyclones were provided by JKTech to
supplement the historical data. These data sets were used for validating the new cyclone model.
A review of the historical database indicated a number of gaps such as:
Most of the previous historical data has feed solids concentration in range of 40-70 wt%.
Feed solids data below 40wt% is essential for developing a generalized hydrocyclone
model.
Some of the historical data sets from Lynch and Rao (1975) test work didn’t include large
scale cyclones tests.

ACCE
PTED
MAN
USCR
IPT
ACCEPTED MANUSCRIPT
6
The historical data has a limited range of data on cone angle affect.
Limited range of data for large diameter cyclones below 40 wt% feed solid concentration.
Additional experiments were performed covering the conditions that were missing in the
database complied from historical data. The additional experiments performed included:
2.2. Experimental work at JK pilot plant
Work was conducted using a 10 inch Krebs cyclone in the JKMRC pilot plant. Thirty two tests
were conducted using the two cone angle conical sections; 10.5 and 20 degrees, and feed solids
concentrations in the range of 10-30 % solids by mass of limestone. Spigot diameter and feed
pressure were also varied.
2.3. Low feed solids test work performed at Krebs Engineers, US
37 tests on a 20 inch cyclone were conducted by Mainza et al., (2006) at Krebs Engineers in
Tucson has been included in the model data sets. The design of the cyclone test rig was based on
the rig designed for testing the three product cyclone at Eastern Platinum, Lonmin (Mainza,
2006). The provision to measure the feed and product flow rates at the Krebs Engineers cyclone
testing facility made it possible to perform tests with a bigger diameter cyclone and the rig
enabled accurate measurements of the flow split which are difficult to obtain in cyclones of this
size.
For the tests by Mainza et al., (2006) the feed % solids, spigot diameter, and feed inlet pressure
were varied. (Mainza et al., 2006) conducted 26 tests on a conventional cyclone with just a gMax
inlet and 11 tests on a complete gMax design. gMax design is one of the latest Krebs’s design
with multi-cone sections and an improved inlet design.
Table 1: Data collection
2.4. Data compilation
A summary of the data used for model development is given in Table 1. The data were collected
from 4, 6, 10, 15, 20, and 30 inch hydrocyclones operating with various minerals are collated for

ACCE
PTED
MAN
USCR
IPT
ACCEPTED MANUSCRIPT
7
model development. A total of 479 hydrocyclone tests has been collected and compiled (Table 1)
into a data set for model development and validation.
2.5. Quality of the data
The efficiency curves for 479 data sets have been plotted to check the data quality. It has been
found that most of the data sets appear to be good as far as the efficiency curve is concerned, but
only a few data sets have obvious measurement errors. Some data sets appeared have poor
efficiency curves for modeling studies. Figure 1 shows an example of efficiency curves from the
high quality data used in the model. Apart from the standard efficiency curve anomalies, a
further check on the quality of data was made using the standard deviations on the parameter
estimates of each and every efficiency curve used. For example, as a result of the sampling
problems and size measurement handling errors encountered in the work of Mainza et al., (2006)
the standard deviations of the efficiency curve fitting parameters listed in Table 2 were high. It
should also be mentioned that the highest inconsistency were noted at alpha values of
approximately 4.0. In instances where the average standard deviation level was high a decision
was made to exclude the data from further analysis. The e results from the example being
considered show a significant problem with the parameter estimation for part of the model
building data, as shown in Figure 1
Figure 1: Cyclone efficiency curves for Krebs 20 inch design
3. CFD inputs for model development
As reported elsewhere by authors (Narasimha, 2010), the hydrocyclones can be modelled
successfully by multi-phase CFD model up to moderate solids concentrations. The information
from the CFD simulations presented in this work was incorporated in the semi-empirical model
developed in this work.
3.1. Tangential velocity
In a hydrocyclone, the tangential velocity is the key velocity component in separating the particle
in a centrifugal field. The tangential velocity of the fluid in a given cyclone increases as radius
ACCE
PTED
MAN
USCR
IPT
ACCEPTED MANUSCRIPT
8
decreases from the cyclone wall and reaches a maximum and then decreases as the air-core is
approached. The free vortex condition where there is complete conservation of angular
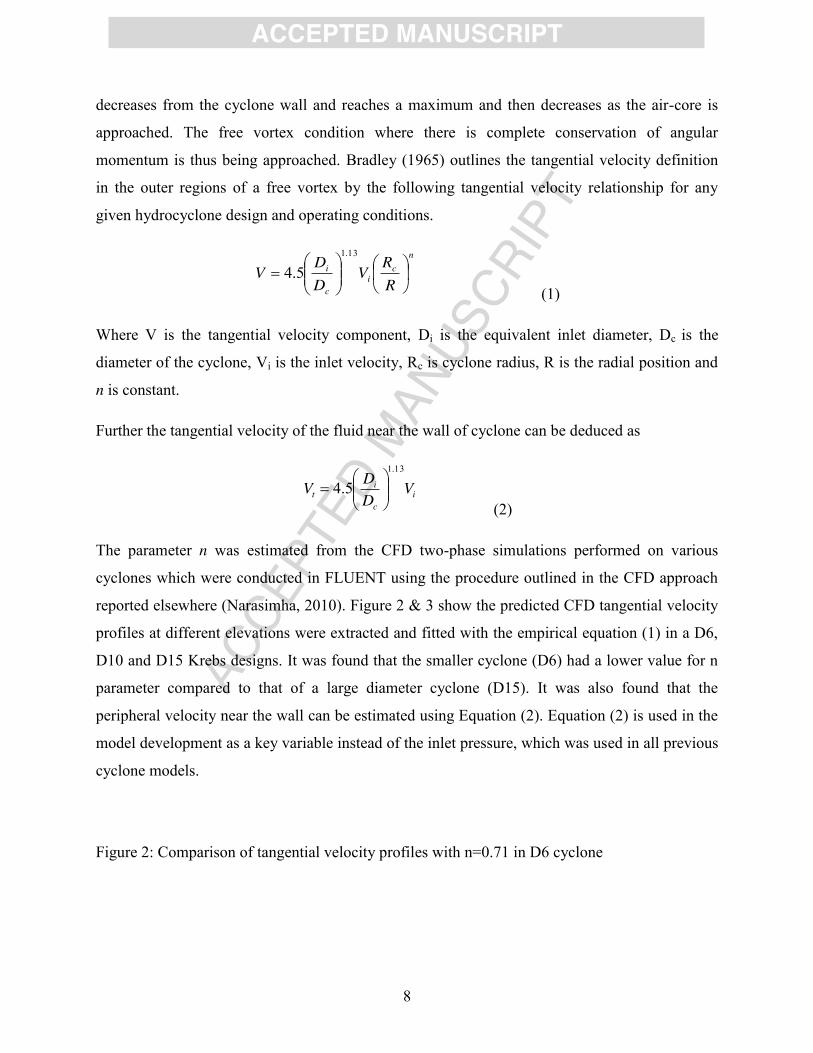
momentum is thus being approached. Bradley (1965) outlines the tangential velocity definition
in the outer regions of a free vortex by the following tangential velocity relationship for any
given hydrocyclone design and operating conditions.
nc
ic
i
RRV
DDV
13.1
5.4 (1)
Where V is the tangential velocity component, Di is the equivalent inlet diameter, Dc is the
diameter of the cyclone, Vi is the inlet velocity, Rc is cyclone radius, R is the radial position and
n is constant.
Further the tangential velocity of the fluid near the wall of cyclone can be deduced as
ic
it V
DDV
13.1
5.4
(2)
The parameter n was estimated from the CFD two-phase simulations performed on various
cyclones which were conducted in FLUENT using the procedure outlined in the CFD approach
reported elsewhere (Narasimha, 2010). Figure 2 & 3 show the predicted CFD tangential velocity
profiles at different elevations were extracted and fitted with the empirical equation (1) in a D6,
D10 and D15 Krebs designs. It was found that the smaller cyclone (D6) had a lower value for n
parameter compared to that of a large diameter cyclone (D15). It was also found that the
peripheral velocity near the wall can be estimated using Equation (2). Equation (2) is used in the
model development as a key variable instead of the inlet pressure, which was used in all previous
cyclone models.
Figure 2: Comparison of tangential velocity profiles with n=0.71 in D6 cyclone

ACCE
PTED
MAN
USCR
IPT
ACCEPTED MANUSCRIPT
9
Figure 3: Comparison of tangential velocity profiles with (a) n=0.76 in D10 cyclone and (b)
n=0.77 in D15 cyclone
3.2. Turbulent diffusion coefficient
The multi-phase turbulence analysis discussed by authors (Narasimha, 2010; Narasimha et al.,
2010) shows that turbulent mixing becomes less important with larger particles but has a
significant influence on the dispersion of fine particles.
Further an attempt was made to test and use a simple empirical correlation for diffusion
coefficient calculations available in the literature for hydrocyclones. To this end, a number of
equations were tested and analysed (Narasimha et al., 2010). It was observed that equation (3)
developed by (Neesse, 1971) for calculating the diffusion coefficient in hydrocyclones is suitable
since it is directly related to the hydrocyclone geometry, specifically to the cone angle.
)2/tan(** ct DkD (3)
Where θ is the cone angle, k is the radial velocity constant.
Usually the variation in cone angle changes the flow reversals and the locus of zero vertical
velocity (LZVV) near the bottom of the conical section of hydrocyclones. He and Laskowski,
(1994), Mangadoddy Narasimha et al., (2007), Narasimha et al., (2007) showed that the flow
reversals are responsible for an increased dispersion of particles in the conical section. Hence
equation (3) based on Neesse, (1971) was adopted for the model development reported in this
work.
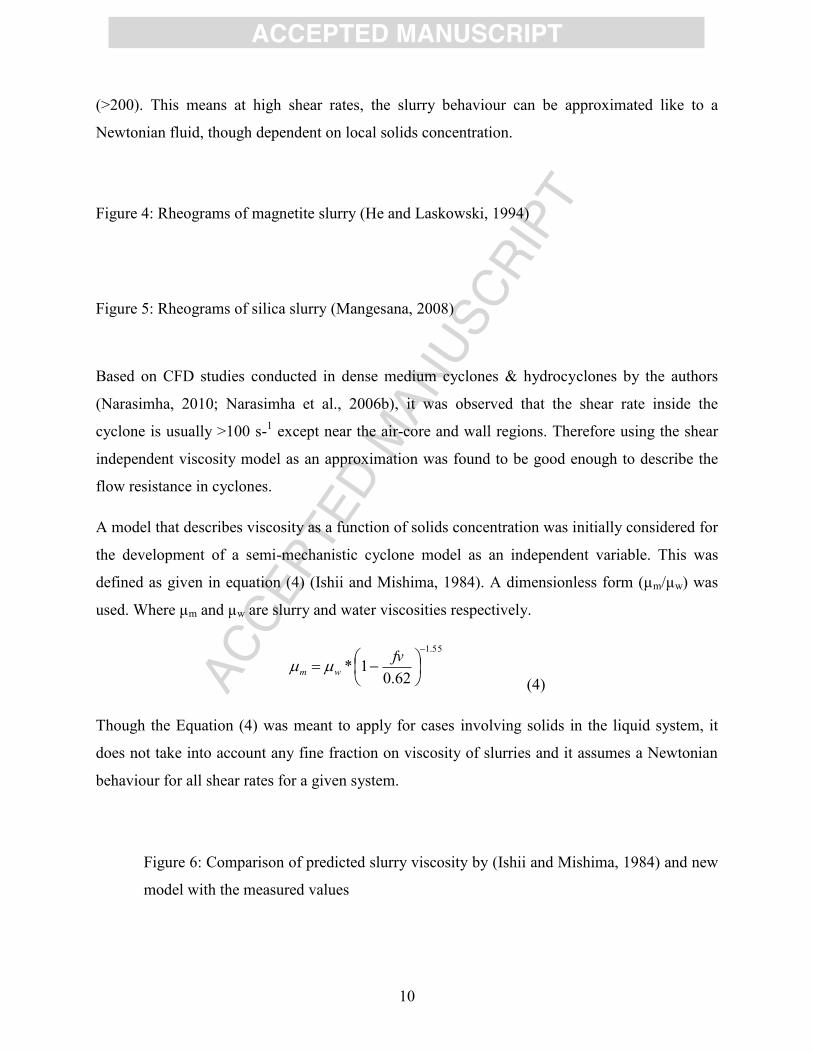
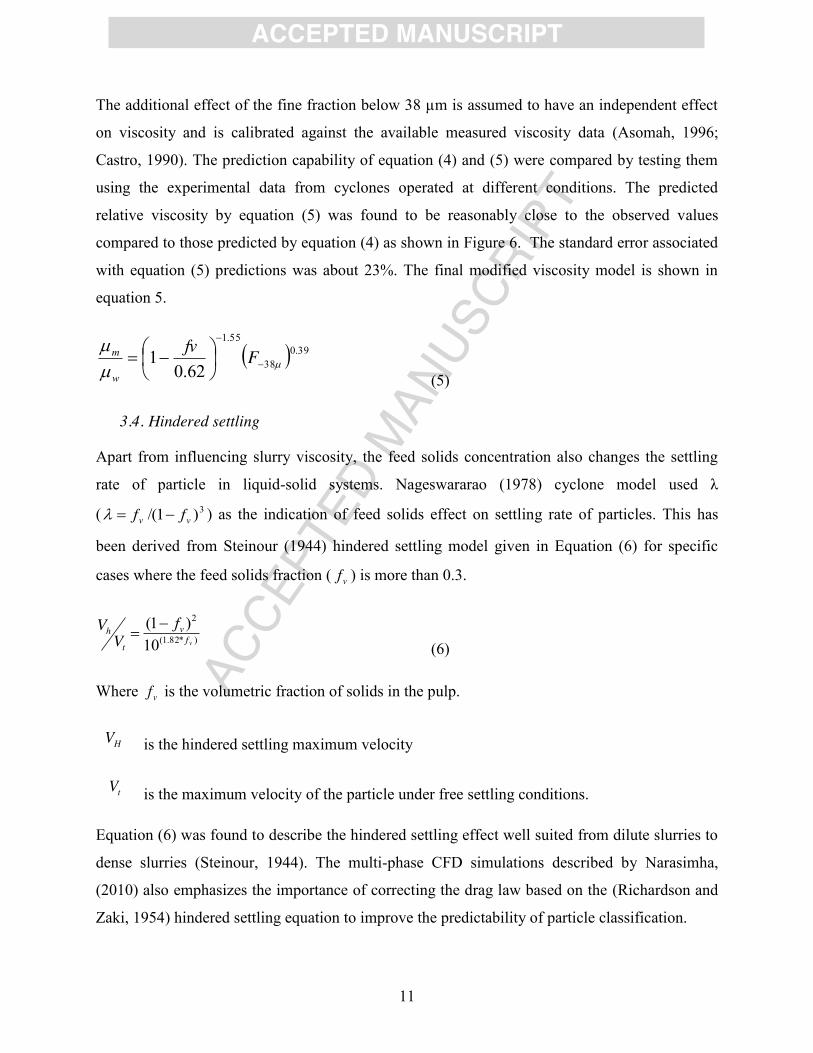
3.3. Slurry viscosity
It is important to consider slurry rheology to understand the separation mechanism for
hydrocyclones (He and Laskowski, 1994; Narasimha, 2007; Shi, 1994). It was shown by many
researchers that the viscosity of a suspension increases with solids concentration. Typical
rheograms for magnetite (He and Laskowski, 1994) and silica (Mangesana, 2008) which display
non-Newtonian behaviour are shown in the Figure 4 and 5. From Figure 4, it was observed that
though the overall flow curve shows a non-Newtonian behaviour, with shear thinning as shear
rate increases, the apparent viscosity (slope of the rheogram) is constant at higher shear rates
ACCE
PTED
MAN
USCR
IPT
ACCEPTED MANUSCRIPT
10
(>200). This means at high shear rates, the slurry behaviour can be approximated like to a
Newtonian fluid, though dependent on local solids concentration.
Figure 4: Rheograms of magnetite slurry (He and Laskowski, 1994)
Figure 5: Rheograms of silica slurry (Mangesana, 2008)
Based on CFD studies conducted in dense medium cyclones & hydrocyclones by the authors
(Narasimha, 2010; Narasimha et al., 2006b), it was observed that the shear rate inside the
cyclone is usually >100 s-1 except near the air-core and wall regions. Therefore using the shear
independent viscosity model as an approximation was found to be good enough to describe the
flow resistance in cyclones.
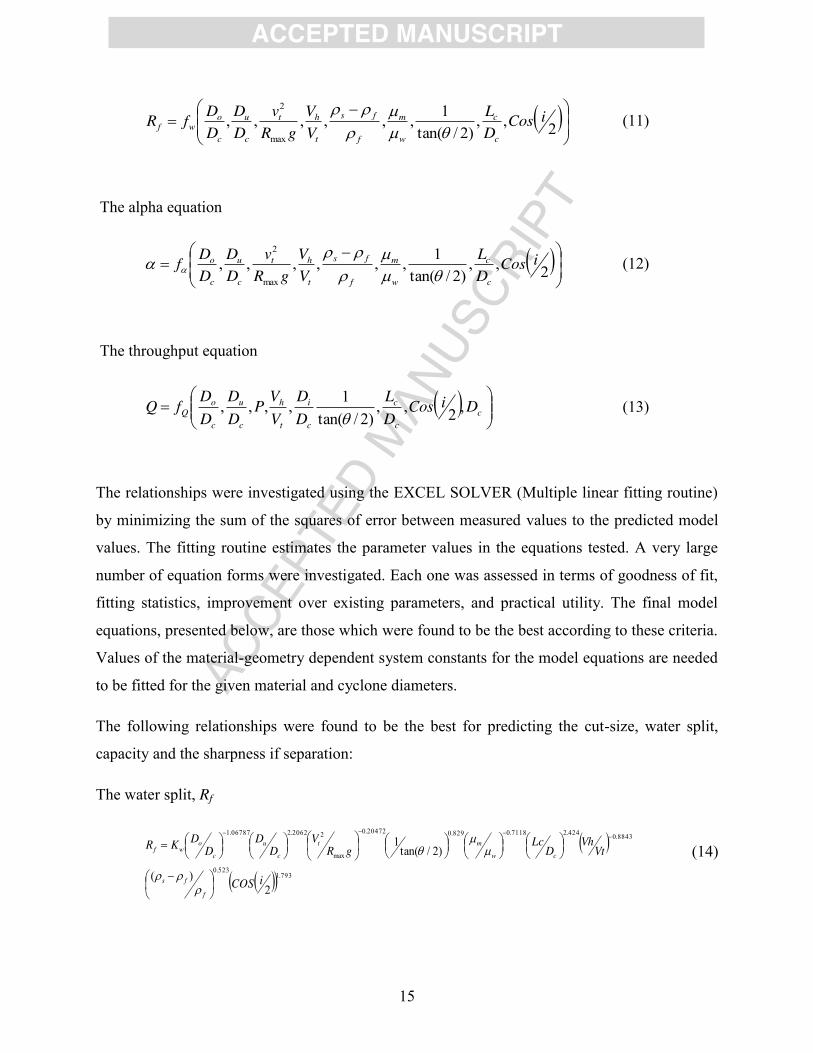
A model that describes viscosity as a function of solids concentration was initially considered for
the development of a semi-mechanistic cyclone model as an independent variable. This was
defined as given in equation (4) (Ishii and Mishima, 1984). A dimensionless form (µm/µw) was
used. Where µm and µw are slurry and water viscosities respectively.
55.1
62.01*
fvwm
(4)
Though the Equation (4) was meant to apply for cases involving solids in the liquid system, it
does not take into account any fine fraction on viscosity of slurries and it assumes a Newtonian
behaviour for all shear rates for a given system.
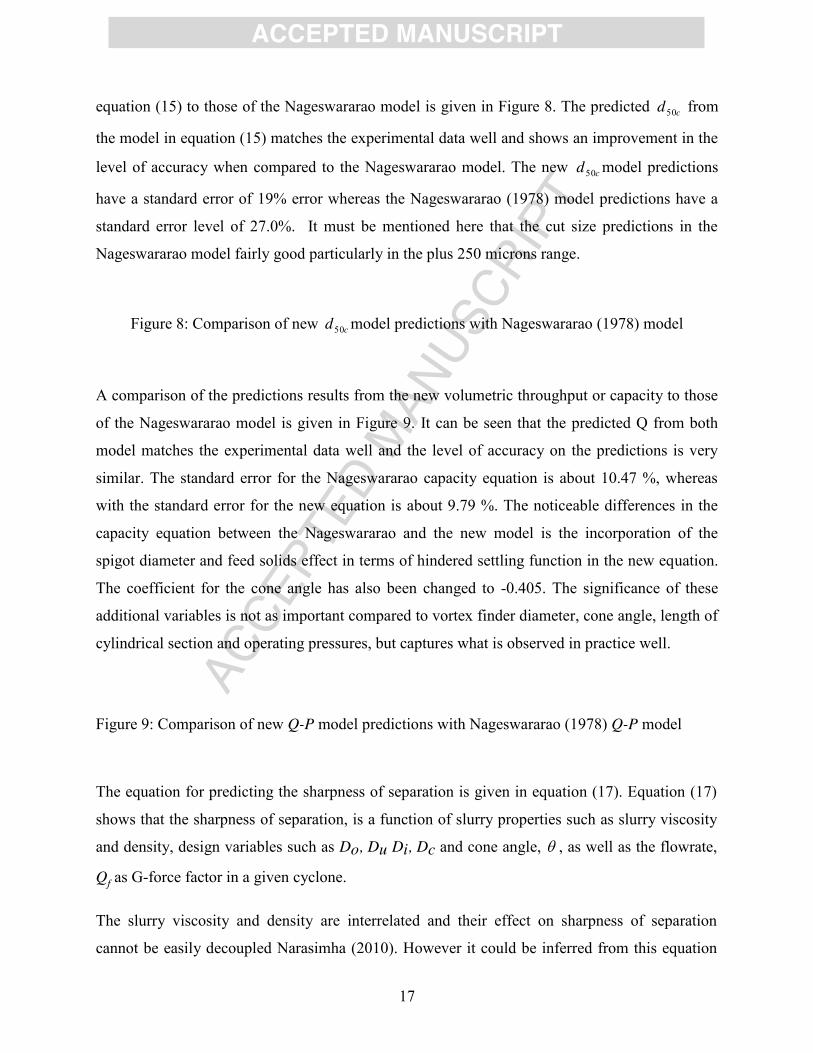
Figure 6: Comparison of predicted slurry viscosity by (Ishii and Mishima, 1984) and new
model with the measured values
ACCE
PTED
MAN
USCR
IPT
ACCEPTED MANUSCRIPT
11
The additional effect of the fine fraction below 38 µm is assumed to have an independent effect
on viscosity and is calibrated against the available measured viscosity data (Asomah, 1996;
Castro, 1990). The prediction capability of equation (4) and (5) were compared by testing them
using the experimental data from cyclones operated at different conditions. The predicted
relative viscosity by equation (5) was found to be reasonably close to the observed values
compared to those predicted by equation (4) as shown in Figure 6. The standard error associated
with equation (5) predictions was about 23%. The final modified viscosity model is shown in
equation 5.
39.038
55.1
62.01
Ffv
w
m
(5)
3.4. Hindered settling
Apart from influencing slurry viscosity, the feed solids concentration also changes the settling
rate of particle in liquid-solid systems. Nageswararao (1978) cyclone model used λ
( 3)1/( vv ff ) as the indication of feed solids effect on settling rate of particles. This has
been derived from Steinour (1944) hindered settling model given in Equation (6) for specific
cases where the feed solids fraction ( vf ) is more than 0.3.
)*82.1(
2
10)1(
vfv
t
h fV
V
(6)
Where vf is the volumetric fraction of solids in the pulp.
HV is the hindered settling maximum velocity
tV is the maximum velocity of the particle under free settling conditions.
Equation (6) was found to describe the hindered settling effect well suited from dilute slurries to
dense slurries (Steinour, 1944). The multi-phase CFD simulations described by Narasimha,
(2010) also emphasizes the importance of correcting the drag law based on the (Richardson and
Zaki, 1954) hindered settling equation to improve the predictability of particle classification.

ACCE
PTED
MAN
USCR
IPT
ACCEPTED MANUSCRIPT
12
4. Semi-mechanistic model
The development of an improved hydrocyclone model is attempted by collecting an extensive
data base as described in the data collection section. Inputs from Computational Fluid Dynamics
(CFD) on particle classification mechanism from were considered to understand and identify the
key flow parameters that affect the cyclone performance while separating the particles by size
basis. Using the experimental data and inputs from CFD a new cyclone model structure based on
the dimensionless approach was then formulated.
The most commonly changed variables for cyclones in industrial practice are Du, Do, P or Qf, fs
or ρp, µm, and θ. However the influence of the inlet diameter (Di), cone angle (θ) and cyclone
length (Lc) on hydrocyclone performance are also important and therefore need to be known
when selecting the optimum design for any specific duty. Therefore in developing the
hydrocyclone model for the present work, the following variables were considered: Dc, Do, Du,
Di, P or Qf, fs or ρp, µm,, ρ, i, Lc. fv, g. These are the same variables used by (Nageswararao, 1978)
except the inclination angle (i).
A number of additional compound dimensionless groups like Reynolds number, G-forces,
viscosity ratio, turbulent diffusion coefficient (related to the flow reversals in the cyclone) are
defined in order to develop various cyclone model structures to predict the accurate values of
fR , cd50 , α, Q. The definitions of these groups are discussed in the following section.
4.1. Reynolds Number
The conditions of flow in cyclone in general can be expressed in terms of Reynolds number eR .
The definition is generally chosen in terms of cyclone diameter and feed inlet velocity, that is:
(7)
Where
c
euDR

ACCE
PTED
MAN
USCR
IPT
ACCEPTED MANUSCRIPT
13
Whenever eR used for any model equations, the independent effect of viscosity was not included
separately.
4.2. Centrifugal force
The major driving force for the separation of solids particles in a hydrocyclone is the centrifugal
force generated by the rotational flow of slurry. In general, the higher the centrifugal force the
less underflow water split (Rf) and the higher separation efficiency. To some extent, Rf and d50C
depends on G forces around the spigot area. Instead of P or Qf variables, a new compound term
called the G-number, which is the ratio of centrifugal forces at the wall of the cyclone to gravity
forces was used in the model development. This was defined as shown in equation (8).
G-number =
gRVt
max
2 (8)
Where Vt is the tangential velocity as has been calculated using equation (2) as suggested by
Lilge (1962) and Tavares et al., (2002)
4.3. Turbulence diffusion co-efficient
To some extent, the turbulence dispersion of fine particles also causes the entrainment between
the coarser particles and flow along with water to underflow. In order to account for these effects
on Rf, d50C and alpha a simple normalized turbulence diffusion coefficient shown in equation (3)
suggested by Neesse (1971), Neesse et al., (1986) was used.
)2/(Tan
DkD
c
t (9)
Where θ is the cone angle, k is the radial velocity constant, Dt is turbulent diffusion coefficient
and Dc is the cyclone diameter.
4.4. Hydrocyclone model equations
A generalised model for industrial hydrocyclones, which includes equations for water split to the
underflow (Rf), corrected cut size ( cd50 ), sharpness of separation (α), and capacity (Q) was

ACCE
PTED
MAN
USCR
IPT
ACCEPTED MANUSCRIPT
14
formulated to evaluate their performance. The following dimensionless variables were used in
the model:
reduced vortex finder, co DD /
reduced spigot, cu DD /
reduced inlet, ci DD /
reduced length of the cylindrical section, cc DL /
Normalized turbulent dispersion coefficient (cone angle), )2/()/( TankDD ct
The diameter of the cyclone cD was chosen as the characteristic dimension of length to which all
other physical cyclone dimensions were normalized.
The operating variables consider were
the relative slurry viscosity, w
m
the hindered settling factor, )*82.1(
2
10)1(
vfv
t
h fV
V
G-forces,
gRVt
max
2or Reynolds number, Re
relative particle density, f
fs
or s
fs
Taking into account all the practical hydrocyclone models developed by other researchers,
together with the current state-of-art models and latest test results, the following equations, were
investigated:
The cd50 equation
2,,,
)2/tan(1,,Re,,,50 iCos
DD
DL
VV
DD
DDf
Dd
c
i
c
c
f
fs
t
h
c
u
c
od
c
c
(10)
The water split equation
ACCE
PTED
MAN
USCR
IPT
ACCEPTED MANUSCRIPT
15
2,,
)2/tan(1,,,,,,
max
2iCos
DL
VV
gRv
DD
DDfR
c
c
w
m
f
fs
t
ht
c
u
c
owf
(11)
The alpha equation
2,,
)2/tan(1,,,,,,
max
2iCos
DL
VV
gRv
DD
DDf
c
c
w
m
f
fs
t
ht
c
u
c
o
(12)
The throughput equation
c
c
c
c
i
t
h
c
u
c
oQ DiCos
DL
DD
VVP
DD
DDfQ ,2,,
)2/tan(1,,,,
(13)
The relationships were investigated using the EXCEL SOLVER (Multiple linear fitting routine)
by minimizing the sum of the squares of error between measured values to the predicted model
values. The fitting routine estimates the parameter values in the equations tested. A very large
number of equation forms were investigated. Each one was assessed in terms of goodness of fit,
fitting statistics, improvement over existing parameters, and practical utility. The final model
equations, presented below, are those which were found to be the best according to these criteria.
Values of the material-geometry dependent system constants for the model equations are needed
to be fitted for the given material and cyclone diameters.
The following relationships were found to be the best for predicting the cut-size, water split,
capacity and the sharpness if separation:
The water split, Rf
793.1523.0
8843.0424.27118.0829.020472.0
max
22062.206787.1
2)(
)2/tan(1
iCOS
VtVh
DLc
gRV
DD
DDKR
f
fs
cw
mt
c
u
c
owf
(14)

ACCE
PTED
MAN
USCR
IPT
ACCEPTED MANUSCRIPT
16
The cut size equation
217.0034.11988.0187.0936.0
436.0703.0
)*82.1(
200.1093.1
50
2)(1Re
101
f
fs
c
c
c
ifv
c
u
c
od
c
c iCosTanD
LDDfv
DD
DDK
Dd
(15)
Volume throughput, Q
092.0048.030.0
405.0037.0099.1
245.0
0 )2()2/tan(/1
iCos
VV
DL
DD
DDPDD
DKQt
h
c
c
c
u
c
o
pc
c
iQ
(16)
The Sharpness of separation, α
2.0182.0127.0837.1567.0
72.0
)*82.1(
2868.0016.0
max
227.0
)2/tan(1)(
101
180
c
c
w
m
s
ps
c
u
fvt
c
o
DL
DD
fviCosgRV
DD
K
(17)
A comparison of the water split predictions results for the model in equation (14) to those of the
Nageswararao model is given in Figure 7. It can be seen that the predicted Rf from the model in
equation (14) matches the experimental data better than the predictions from the Nageswararao
model. The error with Nageswararao (1978) water split model is about 63%, whereas with the
new water split model error is about 30%.
Figure 7: Comparison of new Rf model predictions with Nageswararao (1978) model
The high powers on the relative vortex finder, relative spigot, cone angle, cylindrical length,
inclination, and feed solids represented in terms of a hindered settling factor and viscosity in the
new water split equation suggests that these have a high influence than the G-forces or the
deportment of water in the hydrocyclone. A comparison of the predictions results for cut-size in
ACCE
PTED
MAN
USCR
IPT
ACCEPTED MANUSCRIPT
17
equation (15) to those of the Nageswararao model is given in Figure 8. The predicted cd50 from
the model in equation (15) matches the experimental data well and shows an improvement in the
level of accuracy when compared to the Nageswararao model. The new cd50 model predictions
have a standard error of 19% error whereas the Nageswararao (1978) model predictions have a
standard error level of 27.0%. It must be mentioned here that the cut size predictions in the
Nageswararao model fairly good particularly in the plus 250 microns range.
Figure 8: Comparison of new cd50 model predictions with Nageswararao (1978) model
A comparison of the predictions results from the new volumetric throughput or capacity to those
of the Nageswararao model is given in Figure 9. It can be seen that the predicted Q from both
model matches the experimental data well and the level of accuracy on the predictions is very
similar. The standard error for the Nageswararao capacity equation is about 10.47 %, whereas
with the standard error for the new equation is about 9.79 %. The noticeable differences in the
capacity equation between the Nageswararao and the new model is the incorporation of the
spigot diameter and feed solids effect in terms of hindered settling function in the new equation.
The coefficient for the cone angle has also been changed to -0.405. The significance of these
additional variables is not as important compared to vortex finder diameter, cone angle, length of
cylindrical section and operating pressures, but captures what is observed in practice well.
Figure 9: Comparison of new Q-P model predictions with Nageswararao (1978) Q-P model
The equation for predicting the sharpness of separation is given in equation (17). Equation (17)
shows that the sharpness of separation, is a function of slurry properties such as slurry viscosity
and density, design variables such as Do, Du Di, Dc and cone angle, , as well as the flowrate,
Qf as G-force factor in a given cyclone.
The slurry viscosity and density are interrelated and their effect on sharpness of separation
cannot be easily decoupled Narasimha (2010). However it could be inferred from this equation

ACCE
PTED
MAN
USCR
IPT
ACCEPTED MANUSCRIPT
18
that an increase in slurry viscosity and/or density will bring about a decrease in the sharpness of
separation value, which is in agreement with the conclusions of other researchers (Asomah 1996,
Kojovic 1988).
Nageswararao did not develop an explicit equation for predicting the sharpness of separation.
Therefore the authors have compared their predictions with results what is obtained using
Asomah’s model (1996). The measured versus predicted values for the sharpness of separation
equations for new alpha model and Asohma (1996) model are shown in Figure 10.
Figure 10: Comparison of new sharpness of the efficiency curve model predictions with
Asomah (1996) model
The standard error for the new sharpness of separation model predictions is 23.4% whereas the
Asomah (1996) model predictions is 41.5%.
5. Model validation 224 additional data sets were used to validate the new hydrocyclone model. The data sets which
were used to validate the model were not part of the model development data sets. The
application-dependent system constants were refitted to each set of data in all cases, but the
parameter values in equations 14-17 were not changed. A summary of the model validation data
sets on various cyclone sizes is given in Table 2.
Table 2: Summary of supplementary data sets used for model validation.
5.1. Krebs D4, D6 and D10 data sets
These data sets comprise 122 tests conducted in 4, 6 and 10 inch Krebs cyclones using fine
limestone material. In all cases, the cyclone was operated vertically. The data is captured whilst
the cyclone was operated with 10-50 wt% feed solids, spigot range of 16-28 mm, vortex finder
range of 17-78 mm and feed pressure range of 50-200 kpa. These data sets were used to validate
the four equations. Figure 11 shows the measured versus model predicted values of the
throughput, water recovery to underflow, cut-size and the sharpness of separations for the three

ACCE
PTED
MAN
USCR
IPT
ACCEPTED MANUSCRIPT
19
Krebs cyclones tested. The comparison shows that the model predicts cd50 , fR , Q predicts fairly
well. The predictions for the sharpness of separation are reasonably good.
Figure 11: Measured versus predicted values for D4 , D6 and D10 Krebs cyclones data sets
5.2. 120 cm cyclone Nageswararo (1978) data
These data sets comprise 22 tests from Nageswarao (1978) data base for large-scale (120 cm)
cyclone. As described by Nageswararo (1978), the cyclone was operated at Bougainville copper
ore mine using the primary cyclone overflow Copper ore fines as the cyclone feed material. The
cyclone was operated with 40-60 wt% (high feed solids) feed solids, spigot range of 200-350
mm, vortex finder of 600 mm and feed pressure range of 30-50 kPa. These data sets are also
independent from the model development data sets.
Figure 12 shows the measured versus model predicted values of the throughput, water recovery
to underflow and cut-size for the 120 cm large-scale cyclone data. The model predictions were
generally good for all three equations.
Figure 12: Measured versus predicted values for 120 cm cyclone (Nageswararo (1978)) data
5.3. JKTech data sets
Nearly 80 data sets of the JKTech were used to validate further the cyclone model equations.
These data sets were used for the model validation process. These tests were carried out with
381, 25.4, 15, 10 cm diameter Warman hydrocyclones.
Figure 13 shows the measured versus predicted values of Q, cd50 , fR and , for the JK TECH
data sets. The model predictions were again quite good for Q, cd50 and fR models, whereas
predictions were poorly predicted. Since the original model equations are developed for the
cyclones geometrically similar of Krebs design. One should carry extensive design of
experiments in Warman cyclones in future in order to build perfect models.

ACCE
PTED
MAN
USCR
IPT
ACCEPTED MANUSCRIPT
20
Figure 13: Measured versus predicted values for the JKTech data sets.
6. Model applicability and limitations The model developed in this study offers a number of advantages including:
Significant improvement in underflow water split (Rf) predictions in comparison to other
models
Influence of hydrocyclone inclination, feed slurry viscosity and particle density on the
hydrocyclone performance are included in the model equations
An equation for sharpness of the separation is included that allows prediction for changes
in particle deportment with improved cyclone operation
The effect of solids concentration on hydrocyclone performance was accounted for
through the viscosity and particle hindered settling rates terms leading to improved model
predictions for changes in feed solids concentration.
An explicit term has been included which accounts for differences in feed slurry viscosity
for a range of particle size distributions and solids concentrations. This term takes into
account the influence of fine particles on viscosity.
Improved predictions of the performance of hydrocyclones can be made using this new
model because in addition to the influence of key design variables terms that account for
most of the fluid and particle flow characteristics have been included. The data used to
develop the model in this work has a wide range of feed solids concentration from low (3%)
to high (70%) solids by weight.. This new model is also implemented into JKSimMet 6.0
version as a potential model for industrial classification predictions.
Although the new model predicts the performance of hydrocyclones reasonably well it has a
number of limitations/requirements that should be taken into account when using this model;
Model parameters need to be fitted at least to one set of experimental data for a given
feed material and design conditions.

ACCE
PTED
MAN
USCR
IPT
ACCEPTED MANUSCRIPT
21
Although the model can be applied to sub 10 microns feed materials the model has not
been tested sufficiently for applications in this size range and the response has not been
verified.
This model is unaccounted the fish-hook phenomena
The prediction of sharpness of the separation still requires further work due to some
scatter observed in the results.
Though this average particle density based model equations have potential for application
to minerals with different density components in the feed further work is required to
improve predictions for such feed materials.
7. Conclusions
An improved Empirical hydrocyclone model was developed from a data base comprising
historical data from hydrocyclone tests performed by numerous researchers and additional tests
were performed by the authors to capture variables that were not included in the historical data
base Inputs on particle classification mechanism from CFD were considered to understand and
identify the key flow parameters that affect the cyclone performance in the application involving
particle classification by size. The new cyclone model structure is based on the dimensionless
approach makes it possible to combine geometry dimensions and as well as flow terms in simple
equations that can be used to predict performance measured by efficiency curve properties and
capacity. The following conclusions can be made from the n new cyclone model developed in
this work:
An extensive data base covering a wide range of cyclones is collocated from historical
experimental data sets and additional experiments. Experiments on 10 and 20 inch Krebs
cyclones were performed to fill the gaps in the data base, especially at low to moderate
feed solids concentration and at different cone sections.
Inputs from CFD studies were considered in understanding the flow pattern of fluid and
solid particles inside cyclones. Tangential velocity, turbulent diffusion, slurry viscosity
and particle hindered settling correlations were identified from CFD as the key inputs to
the particle classification mechanism for the Empirical model.

ACCE
PTED
MAN
USCR
IPT
ACCEPTED MANUSCRIPT
22
A new cyclone model structure based on a dimensionless approach has been developed.
The approach used to develop the model is based on multiple linear fitting routine for
model parameters estimation.
The model for fR , cd50 , Q give a very good fit to the data compare to Nageswararao
(1978) models. While the model for the separation sharpness gave reasonable correlations
with the cyclone design and operating conditions. Compared to Asomah (1996)’s
separation sharpness model, the new model predicts an improved values.
224 additional data sets were used to validate the new hydrocyclone model by comparing
the predictions of the model equations with the experimental results. The data sets which
were used to validate the model were not part of the model development data sets. The
application-dependent system constants (Kw, Kd, KQ, Kα) were refitted to each set of data
in all cases.
8. Acknowledgments
The authors would like to express their sincere thanks to Prof. Emmy Manlapig, Manager,
AMIRA P9N, JKMRC, University of Queensland, Australia, and AMIRA-P9N & P9O
research sponsors and management, for their keen interest, encouragement and funding for
undertaking these studies.
9. Nomenclature
Cone angle of cyclone (degree)
d50c corrected separation (classification) size
Dc cyclone diameter
Di inlet diameter
Do vortex finder diameter
Du spigot diameter
Ea actual efficiency
Ec corrected efficiency

ACCE
PTED
MAN
USCR
IPT
ACCEPTED MANUSCRIPT
23
Eu Euler number = Dp
1/2 . r . v2 = pressure loss factor based on the static pressure
drop across the cyclone
fs feed percent solids in cyclone feed slurry (wt.)
fv feed volume fraction of solids
38F Fine fraction below 38 m in the cyclone feed
g acceleration due to gravity
h free vortex height of cyclone (distance from bottom of
vortex finder to the top of spigot)
i inclination angle, degrees
Lc cylinder length
L cyclone length
P, p cyclone inlet pressure, pressure drop across the cyclone
P40 size 40% feed material passing
P80 size 80% feed material passing
Q, QF feed volume flow rate
R radius of cyclone
Ra radius of air core at the discharge level
CR Cyclone radius, m
Re Reynolds number = v . Dc . r
m ;
where v inlet velocity = 24
cDQ
Rf fraction of feed water to underflow

ACCE
PTED
MAN
USCR
IPT
ACCEPTED MANUSCRIPT
24
Rv volumetric recovery of feed to underflow
v characteristic fluid velocity in a cyclone (subscripts:
t = tangential, r = radial, z = axial )
CV Cyclone periphery tangential velocity, m/s
hV particle hindered settling velocity, m/s
tV particle terminal settling velocity, m/s
sharpness of separation or cut
loss velocity reduction factor
fluid viscosity (subscripts: p = pulp or m = slurry, l = liquid, w = water)
fluid density (subscripts: p = pulp or m = slurry or
suspension, l = liquid, s = solid)
feed volume % solids
10. References
Asomah, A.K., 1996. Improved models of hydrocyclones. PhD thesis, The University of
Queensland..
Boysan, F., Ayers, W.H., Swithenbank, J., 1982. A fundamental mathematical modelling
approach to cyclone design. Trans. Instn Chem Engrs 60, 222-230.
Bradley, D., 1965. The Hydrocyclone. Pergamon Press Ltd, London
Brennan, M.S., Narasimha, M., Holtham, P.N., 2007. Multiphase modelling of hydrocyclones -
prediction of cut-size. Minerals Engineering 20, 395-406.
Castro, O., 1990. An investigation of pulp rheology effects and their application to the
dimensionless type hydrocyclone models. M.Eng.Sc. Thesis, University of Queensland.
Delgadillo, J.A., Rajamani, R.K., 2005. A comparative study of three turbulence-closure models
for the hydrocyclone problem. International Journal of Mineral Processing 77, 217-230.
ACCE
PTED
MAN
USCR
IPT
ACCEPTED MANUSCRIPT
25
Griffiths, W.D., Boysan, F., 1996. Computational fluid dynamics and empirical modelling of a
number of cyclone samplers. Journal of Aerosol Science 27, 281-304.
He, P., Salcudean, M., Gartshore, I.S., 1999. A numerical simulation of hydrocyclones. Chemical
Engineering Research and Design 77, 429-441.
He, Y.B., Laskowski, J.S., 1994. Effect of dense medium properties on the separation
performance of a dense medium cyclone. Minerals Engineering 7, 209-221.
Hinde, A.L., Jennery, G.R., Mackay, J.G., 1979. The classification performance of a
hydrocyclone. Chamber of Mines of South Africa Research Organisation, pp. 1-61.
Hsieh, K.T., Rajamani, K., 1988. Phenomenological model of the hydrocyclone: Model
development and verification for single-phase flow. International Journal of Mineral Processing
22, 223-237.
Hsieh, K.T., Rajamani, K., 1991. Mathematical model of the hydrocyclone based on physics of
fluid flow. AIChE Journal 37, 735-746.
Ishii, M., Mishima, K., 1984. Two-fluid model and hydrodynamic constitutive relations. Nuclear
Engineering and Design 82, 107-126.
Kojovic, T., 1988. The development and application of MODEL - An automated model builder
for mineral processing. PhD thesis, The University of Queensland.
Lilge, E.O., 1962. Hydrocyclone fundamentals. IMM Trans (Bulletin), 523-546.
Lynch, A.J., 1977. Mineral Crushing and Grinding Circuits: Their Simulation, Optimisation,
Design and Control. Elsevier Scientific Publinsing Company 340, 340.
Lynch, A.J., Rao, T.C., 1968. Studies on the operating characteristics of hydrocyclone classifiers.
Indian Journal of Technology 6, 106-114.
Lynch, A.J., Rao, T.C., 1975. Modelling and scale up of hydrocyclone classifiers (also
discussion of paper), XI IMPC, Cagliari, pp. 9-25.
Lynch, A.J., Rao, T.C., Bailey, C.W., 1975. The influence of design and operating variables on
the capacities of hydrocyclone classifiers. IJMP 2, 29-37.
Mackay, J.G., Hinde, A.L., Loclier, A., Wilson, A., 1981. Hydrocyclone performance at high cut
sizes. Chamber of Mines of South Africa, pp. 1-71.
Mainza, A., N.,, Olson, T., Powell, M.S., Stewart, T., 2006. P9N Private communication.
Mainza, A.N., 2006. Contributions to the Understanding of Three Product Cyclones in the
Classification of Dual Density Platinum Ores. PhD Thesis, The University of Cape Town.

ACCE
PTED
MAN
USCR
IPT
ACCEPTED MANUSCRIPT
26
Mangadoddy Narasimha, Brennan, M.S., Holtham, P.N., Banerjee, P.K., 2007. Numerical
analysis of the changes in dense medium feed solids on dense medium cyclone performance.,
16th Australasian Fluid Mechanics Conference (AFMC), Gold Coast, Queensland, Australia, pp.
1042-1049.
Mangesana, N., Mainza, A. A., Govender, I., van der Westhuizen, A. P., Narasimha, M., 2008.
The effect of particle sizes and solids concentration on the rheology of silica sand based
suspensions. Journal of the South African Institute of Mining and Metallurgy 108, 237-243.
Marlow, D., 1973. A mathematical analysis of hydrocyclone data. M.Sc. thesis, University of
Queensland.
Nageswararao, K., 1978. Further developments in the modelling and scale-up of industrial
hydrocyclones. PhD thesis, The University of Queensland.
Narasimha, M., 2010. Improved computational and empirical models of hydrocyclones.
University of Queensland, JKMRC.
Narasimha, M., Brennan, M., Holtham, P.N., 2006a. Large eddy simulation of hydrocyclone-
prediction of air-core diameter and shape. International Journal of Mineral Processing 80, 1-14.
Narasimha, M., Brennan, M., Mainza, A.N., Holtham, P.N., 2010. Towards improved
hydrocyclone models: Contributions from CFD, (IMPC 2010), , 6-10th Sep, 2010., XXV
International Mineral Processing Congress.
Narasimha, M., Brennan, M.S., Holtham, P.N., Napier-Munn, T.J., 2006b. A comprehensive
CFD model of dense medium cyclone performance. Minerals Engineering 20, 414-426.
Narasimha, M., Brennan, M.S., Holtham, P.N., Napier-Munn, T.J., 2007. A comprehensive CFD
model of dense medium cyclone performance. Minerals Engineering 20, 414-426.
Narasimha, M., Brennan, M. S., Holtham, P. N. and Banerjee, P. K. , 2007. Numerical Analysis
of the Changes in Dense Medium Feed Solids on Dense Medium Cyclone Performance. In:
Jacobs, Peter, McIntyre, Tim, Cleary, Matthew, Buttsworth, David, Mee, David, Clements, Rose,
Morgan, Richard and Lemckert, Charles, 16th Australasian Fluid Mechanics Conference
(AFMC). Gold Coast, Queensland, Australia, 1042-1049.
Narasimha, M., Sripriya, R., Banerjee, P.K., 2005. CFD modelling of hydrocyclone-prediction of
cut size. International Journal of Mineral Processing 75, 53-68.
Neesse, T., 1971. The hydrocyclone as a turbulence classifier. Chemie Technik 23, 146-152.

ACCE
PTED
MAN
USCR
IPT
ACCEPTED MANUSCRIPT
27
Neesse, T., Dallman, W., Espig, D., 1986. Effect of turbulence on the efficiency of separation in
hydrocyclones at high feed solids concentrations. Aufbereitungs Technik 919, 6-14.
Nowakowski, A.F., Cullivan, J.C., Williams, R.A., Dyakowski, T., 2004. Application of CFD to
modelling of the flow in hydrocyclones. Is this a realizable option or still a research challenge?
Minerals Engineering 17, 661-669.
Nowakowski, A.F., Kraipech, W., Williams, R.A., Dyakowski, T., 2000. Hydrodynamics of a
hydrocyclone based on a three-dimensional multi-continuum model. Chemical engineering
journal 80, 275-282.
Plitt, I.R., 1976. A mathematical model of the hydrocyclone classifier. CIM Bulletin December,
114-122.
Rao, T.C., 1966. The characteristics of hydrocyclones and their application as control units in
comminution circuits. PhD thesis, The University of Queensland.
Richardson, J.F., Zaki, W.N., 1954. Sedimentation and fluidisation. Part 1. trans. Inst. Chem.
Eng. 32, 35-53.
Shi, F., 1994. Slurry rheology and its effects on grinding. University of Qld.
Steinour, H.H., 1944. Rate of sedimentation, suspensions of uniform size angular particles.
Industrial and Engineering Chemistry 36, 840-847.
Suasnabar, D.J., 2000. Dense medium cyclone performance, enhancements via computational
modeling of the physical process. Ph.D. Thesis, University of New South Wales, Sydney.
Svarovsky, L., 1984. Hydrocyclones.
Tavares, L.M., Souza, L.L.G., Lima, J.R.B., Possa, M.V., 2002. Modeling classification in small
diameter hydrocyclones under variable rheological conditions. Minerals Engineering 15, 613-
622.
Xiao, J., 1997. Extensions of model building techniques and their applications in mineral
processing. Ph.D. Thesis, The University of Queensland.
ACCE
PTED
MAN
USCR
IPT
ACCEPTED MANUSCRIPT
28
List of the Figures:
Figure 1: Cyclone efficiency curves for Krebs 20 inch design
Figure 2: Comparison of tangential velocity profiles with n=0.71 in D6 cyclone
Figure 3: Comparison of tangential velocity profiles with (a) n=0.76 in D10 cyclone and (b)
n=0.77 in D15 cyclone
Fig 4: Rheograms of magnetite slurry (He and Laskowski, 1994)
Fig 5: Rheograms of silica slurry (Magesena et al 2008)
Fig 6: Comparison of predicted slurry viscosity by Ishii and Mishima (1984) and new model
with the measured values
Fig 7: Comparison of new Rf model predictions with Nageswararao (1978) model
Fig 8: Comparison of new cd50 model predictions with Nageswararao (1978) model
Figure 9: Comparison of new Q-P model predictions with Nageswararao (1978) Q-P model
Fig 10: Comparison of new model predictions with Asomah (1996) model
Fig 11: Measured versus predicted values for D4 , D6 and D10 Krebs cyclones data sets
Figure 12: Measured versus predicted values for 120 cm cyclone (Nageswararo (1978)) data

ACCE
PTED
MAN
USCR
IPT
ACCEPTED MANUSCRIPT
29
Figure 13: Measured versus predicted values for the JKTech data sets.
List of the Tables: Table 1: Data collection
Table 2: Standard deviations of the efficiency curve fitting parameters for Mainza et al [25]
series
Table 3: Summary of supplementary data sets used for model validation

ACCE
PTED
MAN
USCR
IPT
ACCEPTED MANUSCRIPT
30
Figure 1

ACCE
PTED
MAN
USCR
IPT
ACCEPTED MANUSCRIPT
31
Figure 2

ACCE
PTED
MAN
USCR
IPT
ACCEPTED MANUSCRIPT
32
Figure 3

ACCE
PTED
MAN
USCR
IPT
ACCEPTED MANUSCRIPT
33
Figure 4

ACCE
PTED
MAN
USCR
IPT
ACCEPTED MANUSCRIPT
34
Figure 5
ACCE
PTED
MAN
USCR
IPT
ACCEPTED MANUSCRIPT
35
Figure 6

ACCE
PTED
MAN
USCR
IPT
ACCEPTED MANUSCRIPT
36
Figure 7

ACCE
PTED
MAN
USCR
IPT
ACCEPTED MANUSCRIPT
37
Figure 8

ACCE
PTED
MAN
USCR
IPT
ACCEPTED MANUSCRIPT
38
Figure 9

ACCE
PTED
MAN
USCR
IPT
ACCEPTED MANUSCRIPT
39
Figure 10

ACCE
PTED
MAN
USCR
IPT
ACCEPTED MANUSCRIPT
40
Figure 11

ACCE
PTED
MAN
USCR
IPT
ACCEPTED MANUSCRIPT
41
Figure 12
ACCE
PTED
MAN
USCR
IPT
ACCEPTED MANUSCRIPT
42
Figure 13
ACCE
PTED
MAN
USCR
IPT
ACCEPTED MANUSCRIPT
43
Table 1: Data collection
Data Source Diameter of cyclone (inches)
No. of tests
Material Aim of the tests
Rao [1] 20 91 Silica Design variables effect
6 25 Silica Design variables effect
Nageswararao
[5]
15 14 Limestone Design variables effect
10 11 Limestone Design variables effect
6 20 Limestone Cone angle & cyclone length effects
4 3 Limestone Design variables effect
Castro [8] 10 30 Limestone Viscosity effect
20 26 Mt Isa-Copper ore Viscosity effect
Asomah
[10]
4 21 Mt Leyson Inclination effect (0-135 degrees)
4 17 Limestone Inclination effect (0-67.5 degrees)
20 10 Pb-Zn ores Inclination effect (0-90 degrees)
20 32 Cu-ore Inclination effect (0-135 degrees)
20 26 MnO2 and Magnetite
Inclination effect (0-90 degrees)
4 17 Mineral identity tests
Density effect
Mainza et al. ( [25]
20 23 Tailings Low percent feed solids effect
Narasimha [26]
10 25 Limestone Cone angle-low feed solids effect
Hinde[27] 30 61 Gold minerals Design variables effect (Tangential inlet)
Castro [8] 30 27 Limestone Spigot and feed solids effects
Total data sets 479

ACCE
PTED
MAN
USCR
IPT
ACCEPTED MANUSCRIPT
44
Table 2: Standard deviations of the efficiency curve fitting parameters for Mainza et al [25] series
Test No. Stdev Remark Test No. Stdev Remark T1 2.706805 T14 1.72577 T2 5.093553 Rejected T15 1.623081 T3 1.452174 T16 1.811158 T4 1.099117 T17 2.487352 T5 4.294604 Rejected T18 1.305326 T6 4.334167 Rejected T19 1.53409 T7 1.601805 T20 1.382568 T8 1.210095 T21 1.451335 T9 2.645263 T22 1.878071 T10 1.512631 T23 1.549191 T11 1.209600 T24 1.371612 T12 1.131119 T25 1.017412 T13 1.388801 T26 2.617663 Avg. Stdev
1.978245
ACCE
PTED
MAN
USCR
IPT
ACCEPTED MANUSCRIPT
45
Table 3: Summary of supplementary data sets used for model validation
Data Source Diameter of cyclone (inches)
No. of tests
Material Aim of the tests
Narasimha [26]
4 36 Limestone feed solids effect
Design & operating variables
10 30 Limestone Cone angle-low feed solids effect
6 56 Limestone feed solids effect
Design & operating variables
Nageswararao [5]
50 22 Copper ore Feed solids effectPressure & spigot variations
JK TECH data 4, 5, 10 & 20 80 Various mineral slurries
Operating &Design variables effect

ACCE
PTED
MAN
USCR
IPT
ACCEPTED MANUSCRIPT
46
Highlights
A semi-mechanistic hydrocyclone model is developed based on dimensionless approach
The inputs from CFD simulations and industrial cyclone performance data are used
The model for fR , cd50 , Q gives a very good fit to the experimental data.
The α model gives reasonable correlation with the cyclone experimental data
New semi-empirical cyclone model is validated extensively with additional data sets