plos one 2015
TRANSCRIPT
RESEARCH ARTICLE
Molecular and In Vivo Characterization ofCancer-Propagating Cells Derived fromMYCN-Dependent MedulloblastomaZai Ahmad1, Lukasz Jasnos2, Veronica Gil1, Louise Howell2, Albert Hallsworth1,Kevin Petrie1, Tomoyuki Sawado2‡*, Louis Chesler1‡
1 Division of Clinical Studies, The Institute of Cancer Research, London, SM2 5NG, United Kingdom,2 Division of Molecular Pathology, The Institute of Cancer Research, London, SM2 5NG, United Kingdom
‡ TS and LC are joint senior authors on this work.* [email protected]
AbstractMedulloblastoma (MB) is the most common malignant pediatric brain tumor. While the path-
ways that are deregulated in MB remain to be fully characterized, amplification and/or over-
expression of theMYCN gene, which is has a critical role in cerebellar development as a
regulator of neural progenitor cell fate, has been identified in several MB subgroups. Pheno-
typically, aberrant expression of MYCN is associated with the large-cell/anaplastic MB vari-
ant, which accounts for 5-15% of cases and is associated with aggressive disease and poor
clinical outcome. To better understand the role of MYCN in MB in vitro and in vivo and to aid
the development of MYCN-targeted therapeutics we established tumor-derived neuro-
sphere cell lines from the GTML (Glt1-tTA/TRE-MYCN-Luc) genetically engineered mouse
model. A fraction of GTML neurospheres were found to be growth factor independent, ex-
pressed CD133 (a marker of neural stem cells), failed to differentiate upon MYCN withdraw-
al and were highly tumorigenic when orthotopically implanted into the cerebellum. Principal
component analyzes using single cell RNA assay data suggested that the clinical candidate
aurora-A kinase inhibitor MLN8237 converts GTML neurospheres to resemble non-MYCN
expressors. Correlating with this, MLN8237 significantly extended the survival of mice bear-
ing GTML MB allografts. In summary, our results demonstrate that MYCN plays a critical
role in expansion and survival of aggressive MB-propagating cells, and establish GTML
neurospheres as an important resource for the development of novel therapeutic strategies.
IntroductionIn children, medulloblastoma (MB) is the most frequently occurring primitive neuroectoder-mal tumor (PNET) originating in the brain and has been classified into four major subtypesbased on copy number variation and transcription profiles: MBWNT, MBSHH (sonic hedgehog),MBGroup3 and MBGroup4 [1,2]. Despite the advances made in MB molecular classification, inthe majority of pediatric MB (with the exception of aberrant SHH andWNT pathways)
PLOSONE | DOI:10.1371/journal.pone.0119834 March 18, 2015 1 / 20
OPEN ACCESS
Citation: Ahmad Z, Jasnos L, Gil V, Howell L,Hallsworth A, Petrie K, et al. (2015) Molecular and InVivo Characterization of Cancer-Propagating CellsDerived from MYCN-Dependent Medulloblastoma.PLoS ONE 10(3): e0119834. doi:10.1371/journal.pone.0119834
Academic Editor: Javier S Castresana, University ofNavarra, SPAIN
Received: July 11, 2014
Accepted: January 16, 2015
Published: March 18, 2015
Copyright: © 2015 Ahmad et al. This is an openaccess article distributed under the terms of theCreative Commons Attribution License, which permitsunrestricted use, distribution, and reproduction in anymedium, provided the original author and source arecredited.
Data Availability Statement: All relevant data arewithin the paper and its Supporting Information files.
Funding: This work was supported by funds from theInstitute of Cancer Research, American Institute forCancer Research (11-0301), Cancer ResearchUnited Kingdom (C34648/A12054), and BrainTumour Charity (SDBTT 6/88). The funders had norole in study design, data collection and analysis,decision to publish, or preparation of the manuscript.
Competing Interests: The authors have declaredthat no competing interests exist.
oncogenic signaling pathways that are therapeutically targetable remain to be identified. Recentresearch has, however, demonstrated that MB harboring MYCN amplification and/or overex-pression may also be targeted [3]. Amplification of theMYCN gene is associated with a poorprognosis [4,5], is observed in MBSHH, MBGroup3 and MBGroup4 subtypes [6–10] and is aber-rantly expressed in the majority of human MB [11]. Despite the growing importance of MYCNas a therapeutic target in MB, however, we still have a poor understanding of how aberrantMYCN expression transforms neural stem/progenitor cells to tumors. We previously reporteda genetically engineered mouse model (GEMM) of MYCN-driven MB (GTML: Glt1-tTA/TRE-MYCN-Luc) in which MYCN expression is controlled by doxycycline (dox) (Tet-off). Usingthis system we showed that targeted expression of MYCN induces both classic and large cellanaplastic (LCA) pathology independent of SHH [11]. Subgroup classification based on geneexpression profiles derived from human medulloblastoma samples in comparison to transgenicmice suggested that GTML and GTML/Trp53KI/KI mice displayed expression profiles charac-teristic of human MBGroup3 [3]. Neurosphere lines established from GTML mice proliferate ro-bustly, express neuronal markers, and form tumors when orthotopically implanted into thebrains of mice [12]. These results suggest that GTML neurosphere cultures contain tumor-propagating cells, making this a potentially useful system with which the transformative role ofMYCN in MB genesis could be elucidated.
In this context, we conducted a series of molecular and cytological studies to characterizeneurosphere cultures established from GTMLmice. Single cell analysis revealed the expansionof a homogeneous cell population is dependent on MYCN expression for survival. These spher-oids are resistant to differentiation, and have features characteristic of partially-committed neu-ral stem and progenitor cells with MYCN expression, including upregulation of Nestin, CD133,Otx2, and Musashi, expression of which are associated with maintenance of an undifferentiatedstate, and typical of MB-stem/progenitors. Cerebellar implantation of GTML neurospheres sub-populations showed that tumor propagating-potential resided in CD133+ but not CD15+ orCD15- cells. Furthermore, treatment of tumors with MLN8237, an aurora-A kinase inhibitorthat induces MYCN oncoprotein degradation [13], effectively extended the survival rate ofGTML mice with aggressive MB. These results clarify the role of MYCN in cellular transforma-tion and progression of MB, strengthening the hypothesis that MYCN drives the expansion andenrichment of CD133+ tumor-propagating cells capable of generating aggressive MB.
Materials and Methods
Mouse husbandryThe GTML mouse model has been described previously [11]. All mouse procedures were ap-proved by the Institute of Cancer Research Ethical Committee following UK Home Officeguidelines (Project License Number: 70/7945). All surgery was performed under anesthetic iso-flurothane, and all efforts were made to minimize suffering.
Neurosphere isolation and cultureTissue was isolated from GTML tumors or postnatal P5, P8, P21 cerebellum and midbrain andtransferred into cold HBSS (Invitrogen). The tissues were then cut into 2–3mm2 pieces and en-zymatically dissociated at 37°C using Liberase Blendzyme 1 (0.62 Wunsch units/ml, Roche) inPBS for 15–45 min. The enzyme reaction was stopped using 10% volume of Fetal Calf Serum(FCS, PAA) before the cells were triturated in DMEM/F12 media containing B27 and filteredthrough a 70μmmesh. Subsequently the cells were cultured in DMEM/F12 medium (Invitro-gen) supplemented with 2% B27 supplement (Invitrogen), 20ng/ml epidermal growth factor
Characterization of MYCN-Dependent Medulloblastoma
PLOSONE | DOI:10.1371/journal.pone.0119834 March 18, 2015 2 / 20
(EGF, Sigma), 20ng/ml fibroblast growth factor (bFGF-basic, Invitrogen) and 100 units/mlpenicillin/streptomycin.
To examine cell division rates, neurospheres were dissociated by pipetting, and cells stainedwith trypan blue were counted using a hemocytometer. Alternatively, cells were counted usingthe Guava PCA-96 instrument after staining with Guava ViaCount Flex reagent (1:50, Milli-pore), according to the manufacturers protocol.
For assessment of differentiation potentials, cells were plated onto coverslips coated bypoly-D-lysine (0.1M, Sigma), 0.1% gelatin or laminin (0.5μg–2.0μg/ml, Invitrogen) and grownunder differentiation conditions for up to 14 days. Differentiation medium is composed ofDMEM/F12 medium supplemented with 10% FCS, B27 with or without 1 μg/ml retinoic acid(Sigma Aldrich). We also plated freshly sorted GTML cells in the presence of 0.5–1.0mg/ml ofcollagen (Invitrogen; A1048301) in the pro-differentiation neurobasal media with serum.
Orthotopic implantationTo examine the tumorigenic potential, cells directly obtained from primary tumors, GTMLspheres, or their derivatives were resuspended in neurosphere media and injected into the cere-bellum of FVB/N female mice: following numbers of cells were implanted: primary tumors(25 or 100 cells/site), M10519 cells (passages 10–27, 25 to 10,000 cells/site) or freshly sortedcells (10 cells/site).
Mice aged 6–8 weeks were anesthetized using inhalation of anesthetic isoflurothane. An in-cision (1cm2) was made in the midline of the scalp over the cerebellum, and a small hole with adiameter of 1mm was made in the skull using a dental drill at a position 1mm lateral from themidline and between 1 and 2 mm posterior to the lambdoidal suture avoiding any obviousblood vessels. Cells were injected at a depth of 2 mm using a 10 μl Hamilton syringe in a stereo-taxic frame. The needle was left in place for a further 2 minutes to avoid reflux. The needle wasremoved gently to avoid dislodging tumor cells. The skull was then sealed using surgical glue.After the implantation tumor progression was monitored weekly using the IVIS Living ImageSystem (Caliper Life Sciences) according to the manufacturer’s instructions. Luciferase imagingwas conducted as described previously [11] except that D-luciferin potassium salt (ParkinElmer) in PBS was used at 15 mg/kg.
Doxycycline treatment was conducted as described in our previous paper [11]. Briefly, micewith progressed tumors measured with a signal of 1x10⁹ photons/s were fed with chow (Test-Diet) containing doxycycline at 200 mg/kg to provide a daily dose of approximately 32 mg/kg.Tumor burden was determined by bioluminescence.
Immunohistochemistry and ImmunocytochemistryFor immunocytochemistry neurospheres were embedded in OCT mounting media (BDH) andslowly frozen using isopropanol cooled in liquid nitrogen. Then 4μm thick cryosections weremounted on poly-lysine coated slides (VWR) and fixed with 4% paraformaldehyde (PFA,Sigma) in PBS for 10 minutes. After subsequent washes with TBS the sections were thenblocked with 10% bovine serum albumin (BSA, Sigma), 15mM glycine (Sigma) and 0.02% Tri-ton x100 (Sigma) in TBS for 1 hour at room temperature. For mouse antibodies sections wereblocked using the MOM blocking kit (Vector Laboratories) according to the manufacturer’s in-struction. Sections were incubated with primary antibody overnight in blocking solution (0.1%BSA-PBS) at room temperature and after subsequent washes with TBS slides were labelledwith secondary antibodies conjugated with Alexa Fluor (1:500, Molecular Probes). Slides werecounterstained with DAPI (Sigma) and then were mounted with Fluoromount G (SouthernBiotech).
Characterization of MYCN-Dependent Medulloblastoma
PLOSONE | DOI:10.1371/journal.pone.0119834 March 18, 2015 3 / 20
For immunohistochemistry, tumor samples were fixed in 4% paraformaldehyde in PBS for24hrs to 7days. Samples were decalcified with 0.3M EDTA and then processed using the LeicaASP300S tissue processor to create a paraffin wax block. Sections were cut at 4μM for hematoxy-lin and eosin staining and immunohistochemistry was conducted as previously described [14].
Antibodies used for immunohistochemistry and immunocytochemistry were: MYCN (OP-13, Calbiochem), Ki67 (556003, BD Pharmingen), GFAP (Z0334, DAKO), CD15 (332778, BDBioscience), Tuj1 (BAM1195, R&D), Cleaved Caspase 3 (9664, Cell Signaling).
Immunoblot analysisNeurospheres were cultured under normal and differentiation conditions in the presence orabsence of 1μg/ml doxycycline. Spheres were harvested, and then suspended in cell lysis buffer(Cell Signaling Technology) according to manufacturer’s protocol. Immunoblot analysis wasperformed as described [14]. Following antibodies were used: MYCN (OP-13, Calbiochem),c-MYC (SC-40, Santa Cruz), Nestin (ab5968, Abcam), beta-actin (4967, Cell Signaling Tech-nology) and GAPDH (2118, Cell Signaling Technology).
Flow cytometry and fluorescence-activated cell sortingFor cell cycle analyses, GTML spheres were treated with 1μg/ml doxycycline and samples weretaken at 0, 2, 4, 6, 8, 24, and 48 hours. The samples were fixed using 70% ice-cold ethanol, andthen were stored at 4°C for at least 30 min. Then cells were stained with propidium iodide (PI)(40μg/ml, Invitrogen) at 37°C for 30 min, and then were stored at 4°C for 24 hours. Cell cycleprofiles were analyzed using a Becton Dickinson LSR II fluorescence-activated cell analyzer.
To isolate the CD15+ and CD15- or CD133+ and CD133- populations, M10519 GTML neu-rospheres were dissociated into single cells, and then were stained with anti-CD15 conjugatedwith FITC (1:100, Millipore) or anti-CD133 conjugated with PE (1:100, Miltenyi Biotec) for at30 min on ice, washed with PBS containing 0.3% Bovine Serum Albumin with antibiotics. Cellswere then counterstained with 0.5μg/ml of DAPI in PBS and sorted through a Becton DickinsonFACS Aria. Cells were sorted into DMEM/F12 media containing growth factors and B27. Thepurity of each population was assessed at the end of each sort using the same analyzer.
Purification of CD133+/- cells using magnetic beadsM10519 GTML neurospheres were dissociated into single cells using the Neurosphere Dissocia-tion kit P (Miltenyi Biotec) following manufacturer’s instruction. After the dissociation, cellswere centrifuged at 500xg for 10min and then pellet was resuspended in 1ml of PBS supple-mented with 2%FBS and 1 mM EDTA (sorting buffer). Isolation of CD133+ and CD133- popu-lations was initially performed through magnetic separation (Easysep, Stemcell Technologies),followed by a final purification step using the FACS ARIA (BD Biosciences). Cell suspension(0.5ml, 2x10⁷ cells) was incubated with 50μl of anti-CD133 (Prominin-1) PE-conjugated anti-body (Miltenyi Biotec) or anti-IgG1 conjugated with PE (Miltenyi Biotec) for 10 min at 4°C.Cells were then washed with sorting buffer and incubated with 100μl of PE-selection cocktail(EasySep PE selection kit, Stemcell Technologies) per 1ml of sorting buffer for 15 min at roomtemperature following addition of EasySep 50μl nanoparticles per 1ml of cell suspension priorto magnetic separation. To improve the purity, the magnetic separation process was repeatedtotal three times. The purity of bead-bound or -unbound fractions was assessed using the FACSLSRII analyzer (BD Biosciences). Both CD133+ and CD133- fractions were further purifiedfrom bead-bound and—unbound fractions, respectively, using the FACS ARIA (BD Biosci-ences). 7AAD (Beckman Coulter) was used to exclude dead cells in FACS analyses. Live cellswere counted with trypan blue staining prior to orthotopic implantation (10 cells per site).
Characterization of MYCN-Dependent Medulloblastoma
PLOSONE | DOI:10.1371/journal.pone.0119834 March 18, 2015 4 / 20
Limited dilution analysisThe M10519 cells (100, 10, and 1 cell(s) per 100 μl of neurobasal media in the presence ofgrowth factors) were plated into a 96 well plate for prolonged culture. The cells were monitoredbi-weekly to assess sphere formation, and then the final estimate was made approximately 4weeks post seeding.
Primers for single cell assaysFor this study, we initially designed 48 primers for (i) factors that are expressed in three distinctMB subtypes [5,15–17], (ii) known neural stem cell markers, (iii) known cancer markers and(iv) MYCN targets. We examined these together with 93 primers we used for mouse embryonicstem cells in our previous studies [18,19] for primer validation using cDNA from GTML andmouse embryonic stem cells. Out of 141 primers, we selected 96 primers that passed the primervalidation, the process of which has been described previously [18].
Cell sorting for single cell assaysThe accuracy of sorting process was determined as follows. First, 2x10⁵ cells were stained using0.4μl Carboxyfluorescein diacetate N-succinimidyl Ester (CFSE) fluorescent dye (Sigma Al-drich), and single cells were sorted using a cell sorter Becton Dickinson into AG480F slides(Beckman Coulter). Then the presence of labeled cells was inspected under a fluorescent mi-croscope CKX41 (Olympus) to confirm that only one cell was spotted at a reaction site of theslide. If two cells were found at a single reaction site, calibration of the sorting machine was re-started from the beginning. Once sorting accuracy was confirmed, sample cells were labeledwith propidium iodide, sorted into PCR tubes, and then frozen. Cells were then thawed on iceto disrupt the cell membranes.
Reverse transcription and target-specific amplificationThe experimental detail is described in our previous paper [18]. Briefly, reverse transcriptionand cDNA amplification were conducted as follows. The reaction was incubated at 50°C for15 minutes, 95°C for 2 minutes, followed by 18 cycles of 95°C for 15 second and 60°C for 4minutes. Unincorporated primers were subsequently removed by treating with Exonuclease I(Exo I, NEB). A reaction mixture contains 10 μl of amplified cDNA, 0.4μl of 10 x Exo I buffer,0.8μl Exo I enzyme (20u/μl), and 2.8μl of RT-PCR grade water. Reaction was held at 37°C for30 min, then at 80°C for 15 minutes to inactivate of Exo I. Finally, DNA Suspension Buffer(36μl) was added to each sample (total 50μl).
Analyses using BioMark systemExperimental details are described in our previous papers [19] [18], except that we used 96x96Gene Expression IFC Array plates (Fluidigm Corporation) in this study. Sample and primermixtures were loaded separately to inlets located on both sides of the array. A BioMark qPCRreaction mix was composed of 2.5μl of 2xTaqMan Gene Expression Master Mix (Applied Bio-systems), 0.25μl of 20x DNA Binding Dye Sample Loading Reagent (Fluidigm Corporation),0.25μl of 20x EvaGreen DNA binding dye (Biotium) and 2μl of Exo I-treated cDNA sample. Aprimer reaction mix was composed of 2.5μl of 2xAssay Loading Reagent, 1.25μl of DNA Sus-pension Buffer, and 1.25μl of a 20μM primer pair. Sample loading was done according to theinstruction manual of the BioMark system.
Characterization of MYCN-Dependent Medulloblastoma
PLOSONE | DOI:10.1371/journal.pone.0119834 March 18, 2015 5 / 20
Data validationTo evaluate the formation of non-specific amplification products due to primer-dimer forma-tion or non-specific annealing, we conducted melting curve analyses for each primer as previ-ously described [18].
Statistical analysisCq values higher than the threshold for reliable Cq values (Cqthreshold, S1 Table) were omittedfrom the statistical analyses as described [18]. Principal component analysis and hierarchicalclustering analysis (Ward’s method) were conducted using R. It should be noted that for cluster-ing analyses and principal component analysis, Cq values higher than Cqthreshold were treated asunreliable values, and thus were all replaced with Cqthreshold+1d. The Kolmogorov-Smirnov testwas used to evaluate the differences of correlation coefficient distributions of data sets derivedfrom two sample sets, due to the presence of skewness of the distribution and uneven number ofobservations between compared groups, both of which were not suitable for conducting stron-ger tests. The Log-rank test was used to evaluate the difference of the survival distributions oftwo sample groups.
Results
Establishment of GTML neurosphere linesIn this study we aimed to identify tumor-propagating cells in MB, and to establish an efficientpre-clinical study system to examine the potential of small molecules in preventing tumor devel-opment. We utilized the Glt1-tTA/TRE-MYCN-luciferase (GTML) transgenic mouse model, inwhich suppression of humanMYCN and luciferase is achievable in a dox-dependent manner inbrain tissue [11,12] (S1 Fig.). In this system, tumor development is preventable by dox, andtumor progression is visible using in-vivo bioluminescent imaging (S1 Fig.); both tumor burdenand in vitro cell growth is linearly correlated with luciferase signal intensity (S1 Fig.) [11].
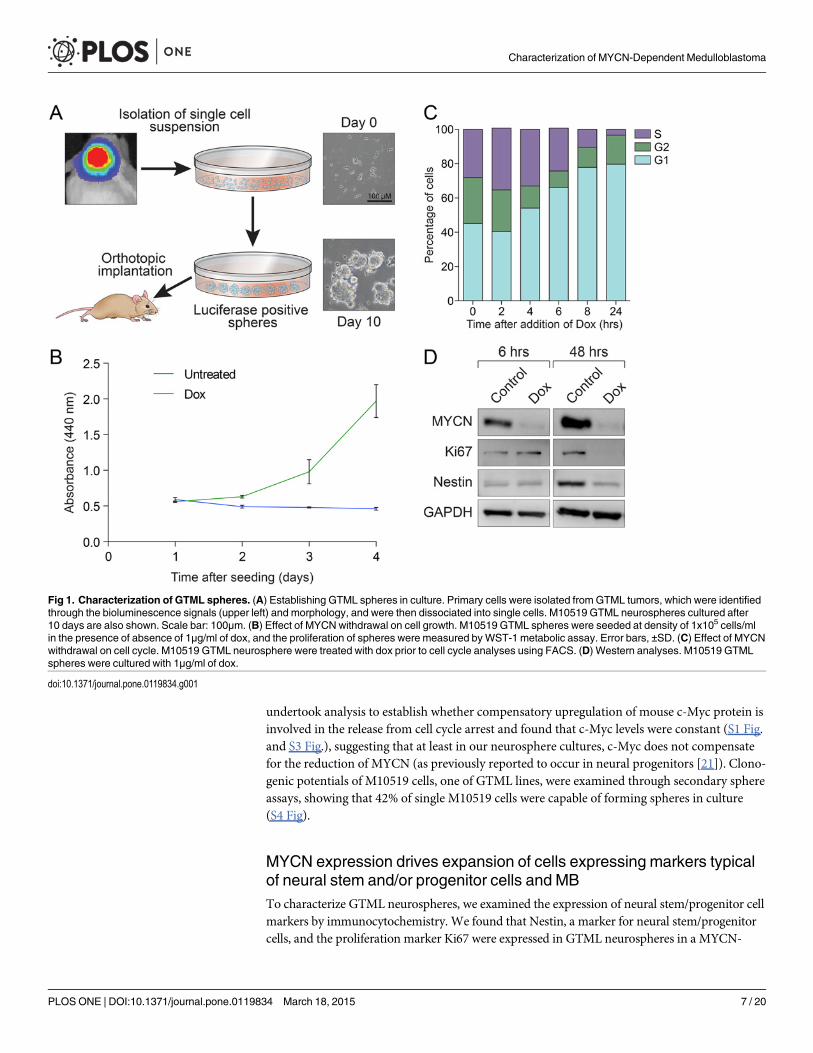
Primary tissues were surgically isolated from growing tumors monitored by weekly lucifer-ase imaging (Fig. 1A and S1 Fig.). The excised tumors were dissociated and cultured in serum-free neurobasal media containing EGF and bFGF [20], and established neurospheres within3–7 days (Fig. 1A), in contrast to explants of midbrain or cerebellum from wild type mice(which had a limited life span of 7–10 passages). Cells established from at least 6 different pri-mary tumors at various ages were immortal and exhibited a doubling time of approximately24 hrs. (S2 Table and S1 Fig.). Taken together these data suggest the existence of a highly prolif-erative, transformed cell most likely driven by MYCN transgene expression.
To examine the role of MYCN in the growth of GTML cells, we treated M10519 GTML neu-rospheres (as well as additional cell lines, see S2 Fig.) with dox, and found clear evidence thatgrowth is dependent on MYCN (Fig. 1B). Cell cycle analyses using flow cytometry showedclear accumulation of growth-restricted cells in G1 phase, within 4 to 6 hours of treatment(Fig. 1C), Growth restriction was coincident with complete suppression of MYCN, but not c-Myc protein (S1 Fig. and S3 Fig.), reduced levels of Ki67, a proliferation marker, and Nestin, aneural stem and/or progenitor marker, at 48 hours after withdrawal of MYCN (Fig. 1D andS1 Fig.). Interestingly, in contrast to our previously-established GTML lines with wild typeTrp53 [12], arrested GTML cells rapidly expanded after removal of dox (S1 Fig.), suggestingthat MYCN withdrawal is cytostatic in a fraction of these cells and that growth arrest is revers-ible. The inconsistency among the GTML cells utilized in the two studies may be due, at leastin part, to the fact that all of GTML cells established in the present study harbor spontaneousmutations in the region of the Trp53 gene encoding the p53 DNA-binding domain [3]. We
Characterization of MYCN-Dependent Medulloblastoma
PLOSONE | DOI:10.1371/journal.pone.0119834 March 18, 2015 6 / 20
undertook analysis to establish whether compensatory upregulation of mouse c-Myc protein isinvolved in the release from cell cycle arrest and found that c-Myc levels were constant (S1 Fig.and S3 Fig.), suggesting that at least in our neurosphere cultures, c-Myc does not compensatefor the reduction of MYCN (as previously reported to occur in neural progenitors [21]). Clono-genic potentials of M10519 cells, one of GTML lines, were examined through secondary sphereassays, showing that 42% of single M10519 cells were capable of forming spheres in culture(S4 Fig).
MYCN expression drives expansion of cells expressing markers typicalof neural stem and/or progenitor cells and MBTo characterize GTML neurospheres, we examined the expression of neural stem/progenitor cellmarkers by immunocytochemistry. We found that Nestin, a marker for neural stem/progenitorcells, and the proliferation marker Ki67 were expressed in GTML neurospheres in a MYCN-
Fig 1. Characterization of GTML spheres. (A) Establishing GTML spheres in culture. Primary cells were isolated from GTML tumors, which were identifiedthrough the bioluminescence signals (upper left) and morphology, and were then dissociated into single cells. M10519 GTML neurospheres cultured after10 days are also shown. Scale bar: 100μm. (B) Effect of MYCNwithdrawal on cell growth. M10519 GTML spheres were seeded at density of 1x10⁵ cells/mlin the presence of absence of 1μg/ml of dox, and the proliferation of spheres were measured byWST-1 metabolic assay. Error bars, ±SD. (C) Effect of MYCNwithdrawal on cell cycle. M10519 GTML neurosphere were treated with dox prior to cell cycle analyses using FACS. (D) Western analyses. M10519 GTMLspheres were cultured with 1μg/ml of dox.
doi:10.1371/journal.pone.0119834.g001
Characterization of MYCN-Dependent Medulloblastoma
PLOSONE | DOI:10.1371/journal.pone.0119834 March 18, 2015 7 / 20
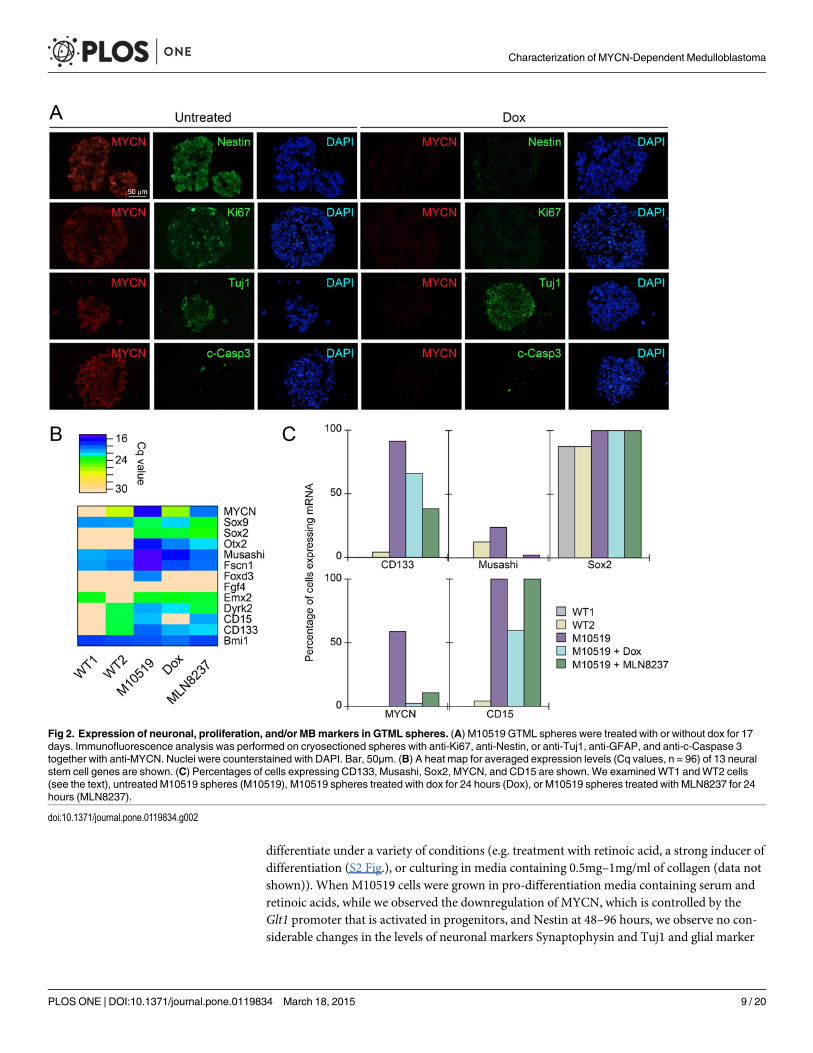
dependent manner (Fig. 2A). Expression of a neuron-specific progenitor marker Tuj1 [22] wasnot however visibly altered by MYCN withdrawal (Fig. 2A), implying that depletion of MYCNdoes not dramatically affect the degree of differentiation in culture. In contrast to our previousobservation in GTML tissues [11], no prominent decrease of Cleaved Caspase 3, a marker of apo-ptosis, was observed upon MYCNwithdrawal (Fig. 2A and S3 Fig.). To obtain a more detailedpicture of gene expression at the single cell level, we analyzed a M10519 line (we found GTMLlines we established in this study were remarkably similar) using 96-plexed single cell qRT-PCR(S5 Fig. and S6 Fig.). This analysis indicated that commonmarkers for MB and neural stem cellsincluding NeuroD1 [23], CD133 (Prominin 1) [24–27], Otx2 [11,28], and Musashi [29] weredownregulated by MYCNwithdrawal (Fig. 2B and S5 Fig.). The frequency of cells expressingmarkers including CD133 andMusashi was also decreased by dox, while other stem cell markersincluding Sox2 were unaffected by MYCNwithdrawal (Fig. 2C and S5 Fig.). Expression of mark-ers for astrocytes and ependymal cells (GFAP) [30], astrocytes (S100b) [31], granule neuron pro-genitors and glioma (Olig2) [32–34] were barely detectable (S5 Fig.) or rarely observed (S5 Fig.)in single cell analyses. Correlating with the rapid growth in culture, MYCN expression up-regu-lated master regulators for cell cycle progression, E2F1 and E2F2, both of which are MYCN tar-gets [35] (S5 Fig.). CD133, a marker for S, G2, andM phases of neural stem cells [36] (Fig. 2Band 2C). MYCN, as expected, was barely detectable in M10519 cells treated with dox (Fig. 2Band 2C). Taken together, these results suggest that MYCN expression results in the expansion ofcells with markers typical of neural stem cells and/or progenitors associated withMB tumorigenesis.
96-gene (see S3 Table and Janos et al [19]) expression profiles for 96 single M10519 cells dis-played a degree of heterogeneity (S6 Fig.). Single cell BioMark HD expression data are shown inS3 Table. To evaluate the difference of correlation coefficient distributions of data sets derivedfrom two populations, using the Kolmogorov-Smirnov test we calculated pairwise correlationcoefficients of expression levels for 96 genes in a given cell population. The mean correlation co-efficient (r̄) for M10519 neurospheres was 0.77, and the difference between M10519 cells andWT1 (r̄ = 0.71, NM10519 = 1081, NWT1 = 990, D = 0.2662, P = 2.2x10⁻¹⁶) or WT2 (r̄ = 0.60,NM10519 = 1081, NWT2 = 990 D = 0.57, P = 2.2x10⁻¹⁶) cells was statistically significant. Thesedata indicate that while the expression profiles of individual cells in the M10519 neurospherepopulation are not entirely homogeneous in nature, the transcription profiles among cells inWT1 andWT2 neurosphere cultures derived from normal cerebella are significantly more het-erogeneous. Furthermore, MYCN withdrawal resulted in a significant reduction of the heteroge-neity index (r̄ = 0.69, NM10519 = 1081, NM10519+Dox = 990, D = 0.27, P = 2.2x10⁻¹⁶). Takentogether, these results suggest that MYCN expression elevates the level of cellular homogeneityand expands cells with neural stem and progenitor markers.
MYCN drives expansion of cells resistant to differentiation stimuli incultureInterestingly, despite the stem cell and/or progenitor-like transcription profile of the expandedcells in neurosphere cultures, GTML cells expressing MYCN displayed only limited differentia-tion potential in vitro. Following 8 days of growth in serum-containing pro-differentiationmedia, we found that three GTML lines retained morphological features typical of undifferenti-ated cells (S2 Fig.), although we found that the neural stem/progenitor marker Nestin wasdownregulated after 2 days of MYCN withdrawal (Fig. 1D). By contrast, the same conditionsinduced differentiation of neurospheres established from wild type cerebella (S2 Fig.). The ap-parent loss of differentiation potential in GTML cells suggest that genetic or epigenetic changemay occur after prolonged MYCN activation. We also found that GTML cells failed to fully
Characterization of MYCN-Dependent Medulloblastoma
PLOSONE | DOI:10.1371/journal.pone.0119834 March 18, 2015 8 / 20
differentiate under a variety of conditions (e.g. treatment with retinoic acid, a strong inducer ofdifferentiation (S2 Fig.), or culturing in media containing 0.5mg–1mg/ml of collagen (data notshown)). When M10519 cells were grown in pro-differentiation media containing serum andretinoic acids, while we observed the downregulation of MYCN, which is controlled by theGlt1 promoter that is activated in progenitors, and Nestin at 48–96 hours, we observe no con-siderable changes in the levels of neuronal markers Synaptophysin and Tuj1 and glial marker
Fig 2. Expression of neuronal, proliferation, and/or MBmarkers in GTML spheres. (A) M10519 GTML spheres were treated with or without dox for 17days. Immunofluorescence analysis was performed on cryosectioned spheres with anti-Ki67, anti-Nestin, or anti-Tuj1, anti-GFAP, and anti-c-Caspase 3together with anti-MYCN. Nuclei were counterstained with DAPI. Bar, 50μm. (B) A heat map for averaged expression levels (Cq values, n = 96) of 13 neuralstem cell genes are shown. (C) Percentages of cells expressing CD133, Musashi, Sox2, MYCN, and CD15 are shown. We examinedWT1 andWT2 cells(see the text), untreated M10519 spheres (M10519), M10519 spheres treated with dox for 24 hours (Dox), or M10519 spheres treated with MLN8237 for 24hours (MLN8237).
doi:10.1371/journal.pone.0119834.g002
Characterization of MYCN-Dependent Medulloblastoma
PLOSONE | DOI:10.1371/journal.pone.0119834 March 18, 2015 9 / 20

GFAP (S3 Fig.). Taken together, these results suggest that MYCN expression results in the en-richment of cells with markers typical of stem and/or progenitor cells, driving expansion ofhighly proliferative cells resistant to differentiation stimuli. The apparent loss of differentiationpotential in GTML spheres is in contrast with neurospheres derived from human MB (forwhichMYCN status was not examined) [27] or the Ptc-/- mouse model [37], suggesting thatpersistent expression of MYCN drives irreversible commitment to expansion of cells with neu-ral stem and progenitor markers.
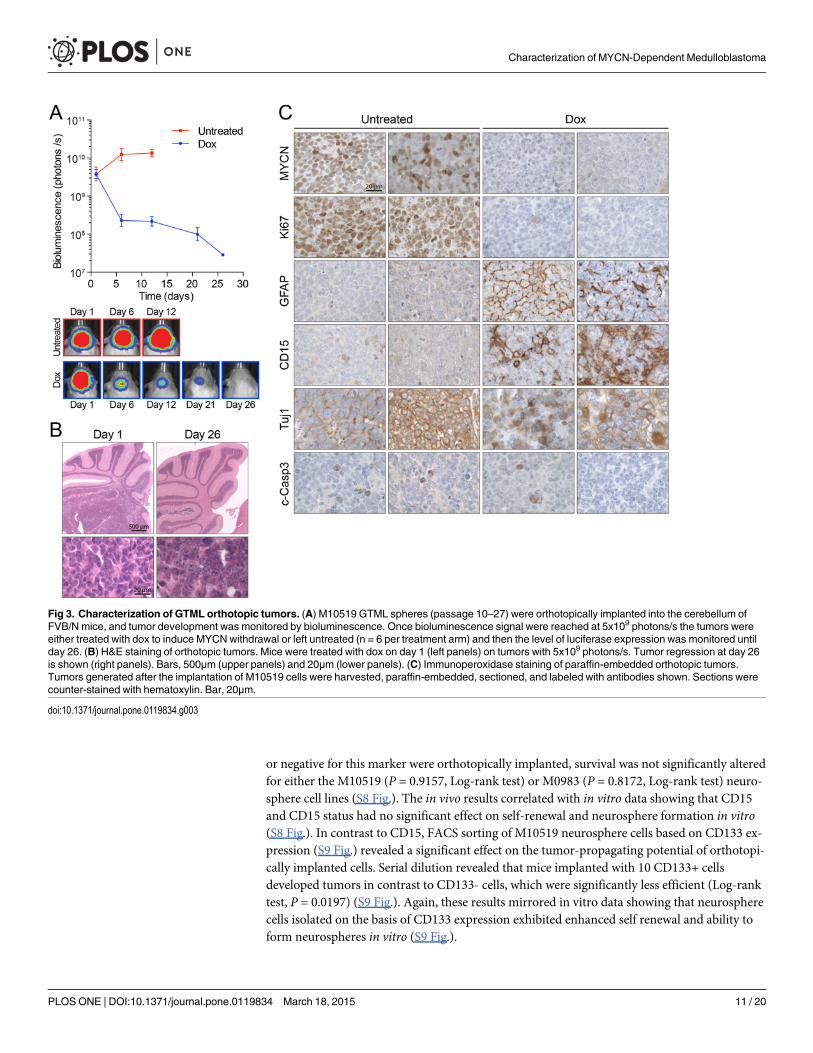
MYCN-driven GTML neurospheres retain properties of primary tumors invivoWe recently showed that neurospheres derived from GTML mice are capable of forming tu-mors in a MYCN-dependent manner when orthotopically implanted in the cerebella of non-transgenic littermates [12]. As expected, the addition of dox to diet rapidly reduced biolumi-nescence (Fig. 3A) and tumor burden (Fig. 3B) in mice implanted with M10519 cells. To evalu-ate the impact of MYCN withdrawal in vivo, we examined expression of biomarkers inorthotopic tumors. Immunohistochemical analysis (Fig. 3C) showed that tumor regression in-duced by MYCN withdrawal correlated with the loss of expression of the Ki67 proliferationmarker. While GTML cells grow as neurospheres in culture even in the presence of differentia-tion inducers (S2 Fig.), in a tissue environment 26 days post-initiation of dox treatment, levelsof the glial marker GFAP were elevated, the staining pattern of neuronal marker Tuj1 was al-tered to a mosaic “salt and pepper” fashion, and MYCN displayed increased cytoplasmic locali-zation (Fig. 3C). Interestingly, CD15 (SSEA-1/Lex), a putative marker for medulloblastoma inPtc1mutant mice [38,39], also displayed elevated and distributed staining profiles uponMYCN withdrawal. We did not find the elevation of c-Caspase 3, a marker for apoptosis, byMYCN withdrawal suggesting that the tumor regression by MYCN withdrawal was caused bymechanisms other than increasing levels of cell death, with cell-cycle arrest and induction of se-nescence likely candidates [11]. These results suggest that in the tissue environment tumor re-gression by MYCN withdrawal is involved in partial differentiation and loss of proliferation,but is not associated with apoptotic cell death.
Tumorigenic potential of GTML neurospheres resides in CD133+ cellsWhile the cancer stem cell hypothesis predicts that only a minority of cancer cells within atumor are usually endowed with tumorigenic potential, our orthotopic implantation assay sug-gested that both primary tumor and GTML spheres comprise large number of cancer-propa-gating cells (S7 Fig.). Limiting dilution experiments established an 80% or 50% efficiency fortumor formation from as few as 100 implanted GTML (passages 10–27) or primary tumor cells(S7 Fig.), suggesting that MYCN acts to expand a cancer propagating cell within neurospherecultures. We compared M10519 (passage 13) and M14942 lines (passage 11) and the differencein tumor incidence following orthotopic implantation was not statistically significant (Log-rank test, P = 0.4480) (S7 Fig.). Both neurosphere lines remained highly tumorigenic after 20passages (data not shown).
To identify cancer-propagating cells enriched in neurospheres, we performed flow cytome-try for CD133 and CD15, two neural stem cell surface antigens that have been identified asmarkers of tumor-propagating potential in MB [25,27,38,39]. Given that our single cell expres-sion data suggested that both CD15 and CD133 were considerably upregulated by MYCN ex-pression in M10519 GTML neurospheres (S5 Fig. and S6 Fig.), we examined whetherexpression of either marker was associated with tumor-forming potential. Fluorescence activat-ed cell sorting (FACS)-based CD15 expression revealed that when MB cell populations positive
Characterization of MYCN-Dependent Medulloblastoma
PLOSONE | DOI:10.1371/journal.pone.0119834 March 18, 2015 10 / 20
or negative for this marker were orthotopically implanted, survival was not significantly alteredfor either the M10519 (P = 0.9157, Log-rank test) or M0983 (P = 0.8172, Log-rank test) neuro-sphere cell lines (S8 Fig.). The in vivo results correlated with in vitro data showing that CD15and CD15 status had no significant effect on self-renewal and neurosphere formation in vitro(S8 Fig.). In contrast to CD15, FACS sorting of M10519 neurosphere cells based on CD133 ex-pression (S9 Fig.) revealed a significant effect on the tumor-propagating potential of orthotopi-cally implanted cells. Serial dilution revealed that mice implanted with 10 CD133+ cellsdeveloped tumors in contrast to CD133- cells, which were significantly less efficient (Log-ranktest, P = 0.0197) (S9 Fig.). Again, these results mirrored in vitro data showing that neurospherecells isolated on the basis of CD133 expression exhibited enhanced self renewal and ability toform neurospheres in vitro (S9 Fig.).
Fig 3. Characterization of GTML orthotopic tumors. (A) M10519 GTML spheres (passage 10–27) were orthotopically implanted into the cerebellum ofFVB/N mice, and tumor development was monitored by bioluminescence. Once bioluminescence signal were reached at 5x10⁹ photons/s the tumors wereeither treated with dox to induce MYCNwithdrawal or left untreated (n = 6 per treatment arm) and then the level of luciferase expression was monitored untilday 26. (B) H&E staining of orthotopic tumors. Mice were treated with dox on day 1 (left panels) on tumors with 5x10⁹ photons/s. Tumor regression at day 26is shown (right panels). Bars, 500μm (upper panels) and 20μm (lower panels). (C) Immunoperoxidase staining of paraffin-embedded orthotopic tumors.Tumors generated after the implantation of M10519 cells were harvested, paraffin-embedded, sectioned, and labeled with antibodies shown. Sections werecounter-stained with hematoxylin. Bar, 20μm.
doi:10.1371/journal.pone.0119834.g003
Characterization of MYCN-Dependent Medulloblastoma
PLOSONE | DOI:10.1371/journal.pone.0119834 March 18, 2015 11 / 20

Given that single cell expression analysis showed that the great majority of M10519GTML cells expressed CD133 (Fig. 2C), it was possible that a small number of contaminatingCD133+ cells in the CD133- fraction were responsible for residual tumor forming activity(S9 Fig.). To address this issue we sought to obtain more highly purified CD133+ and CD133-populations through anti-CD133 antibody-based magnetic separation followed by FACS(Fig. 4A). Purified CD133+ or CD133- cells were then implanted into the cerebellum of FVBNmice (10 cells per site). Mice implanted with CD133+ cells developed aggressive tumors within50 days (n = 10) (Fig. 4B), in contrast to mice implanted with CD133- cells, which failed to de-velop tumors (n = 10) (Fig. 4C, P = 0.0017, Log-rank test). Taken together, these results suggestthat MYCN acts to clonally expand highly proliferative tumor-propagating cell in GTML neu-rospheres resembling a stem and/or progenitor-like cell marked by CD133 positivity.
Pharmacologic inhibition of MYCN is effective against GTML MBAmplification of bothMYC andMYCN occurs in poor-outcome MBGroup3 andMBGroup4 [6–10].MYCN expression is also induced by SHH signaling and as such is highly expressed inMBSHH
[1,12,15,40–43]. Drugs that interfere with MYC family oncoprotein stability or function have
Fig 4. Tumor-propagating potential of CD133+ cells. (A) Purification of CD133+ and CD133- cells. M10519 cells (passage 13) were stained with anti-IgG1or anti-Prominin-1 (CD133) conjugated with PE prior to purification. Stained cells were first separated into bead-bound and bead-unbound fractions bymagnetic beads conjugated with anti-PE (middle panels). Then each fraction was further purified by FACS sorting. (B) Orthotopic tumors generated afterimplantation of CD133+ cells (10 cells per mouse). Sections were stained with hematoxylin and eosin. Bars, 1000μm (upper), 50μm (lower). (C) Kaplan-Meier curves for overall survival of mice implanted with 10 CD133+ (red, n = 10) or CD133- (blue, n = 10) M10519 cells per site.
doi:10.1371/journal.pone.0119834.g004
Characterization of MYCN-Dependent Medulloblastoma
PLOSONE | DOI:10.1371/journal.pone.0119834 March 18, 2015 12 / 20
therefore been suggested as potential therapeutic strategies to treat these MB subtypes. We there-fore examined the effect of an Aurora-A kinase inhibitor MLN8237 on GTMLMB. Aurora-A as-sociates with MYCN, preventing Fbxw7-mediated proteasomal degradation of MYCN [44]. Ourprevious results in neuroblastoma cell lines suggested that MLN8237 blocks the interaction be-tween Aurora A andMYCN, exposing MYCN to proteasomal degradation [13]. MLN8237 is ef-fective in MYCN-driven transgenic mouse models of neuroblastoma (TH-MYCN), in whichhigh-level expression of MYCN is driven in neural crest by a tyrosine hydroxylase (TH) promot-er [13,45]. Recently Lehman’s group and we have independently shown that MLN8237 given tomice with tumors penetrated through the blood-brain barrier [3,46], causing the reduction ofMYCN levels in brain tissues.
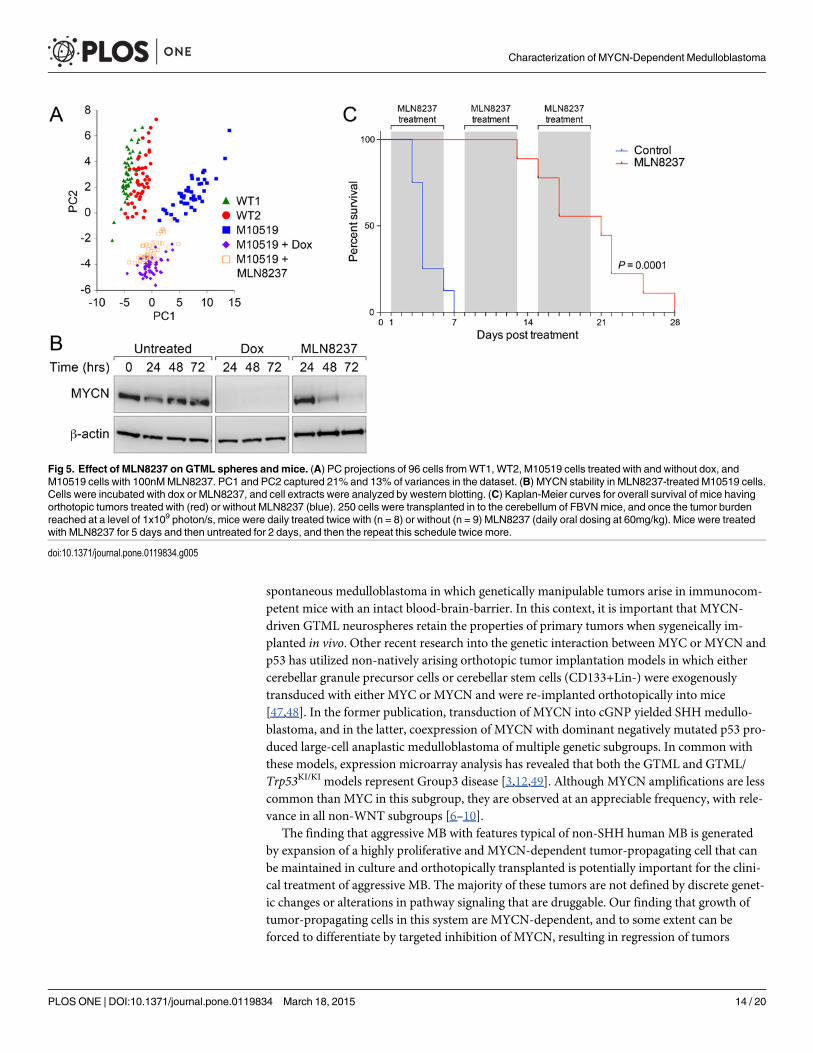
Single cell expression studies suggested that MLN8237 reduces the probability (Fig. 2C) andrate (Fig. 2B) of expression of CD133 similar to dox, suggesting that both effects may similarlydiminish the tumor-propagating potential of GTML cells. To evaluate the global impact ofMLN8237 on the transcription profile of M10519 GTML line, we conducted principal compo-nent analysis (PCA) with single cell expression data. Single cell expression data obtained fromwild type neural cells from midbrain (WT1) and from cerebellum (WT2), untreated M10519cells, compared to cells in which MYCN is targeted either genetically (with dox) or withMLN8237 revealed that cells segregated into two or more subgroups discriminated on the PC1-/PC2 axis. On the PCA projection, WT clusters (WT1 and WT2 cells) were located in closeproximity, but distanced from the (untreated) M10519 cell cluster. M10519 cells form a distin-guished cluster along the PC1 axis, as well as dox- and MLN8237-treated cells formed partiallyoverlapping clusters (Fig. 5A). This profile correlated with the result obtained from a hierarchi-cal clustering analysis. Clusters derived fromM10519 cells can be divided into three sub-groups: untreated M10519 cells only, dox-treated M10519 cells only, and cells treated with doxor MLN8237 (S10 Fig.). The first cluster is located away from the second and third clusters,which are more similar to each other. The relatively close distance between M10519 cells+doxand M10519 cells+MLN8237 in two clustering analyses suggested MLN8237 affects regulatorypathways regulated by MYCN. Similar to dox-treated cells, known MYCN targets includingE2F1 and E2F2, and neural stem cell markers including CD133, Musashi and Otx2 were down-regulated in MLN8237-treated M10519 cells (Fig. 2B, 2C and S5 Fig.). Emergence of thesegroups correlated with degradation of MYCN as determined by immunoblot analysis (Fig. 5B).
Finally, the effect of MLN8237 on MYCN pathways translated to survival extension in micebearing well-established tumors. In a survival study, we treated tumors continuously eitherwith vehicle or MLN8237. Mice in the untreated cohort developed lethal tumors within aweek, whereas mice in the treatment arm displayed significantly longer survival (Log-rank test,P< 0.0001) (Fig. 5C). When we treated mice for 12 days with MLN8237, we observed againlonger survival compared to control (Log-rank test, P = 0.01) (S11 Fig.). Correlating with theseresults, immunohistochemistry suggests that treatment of orthotopically-implanted tumorswith MLN8237 for 24 hours resulted in modest and dramatic reduction of MYCN and Ki67levels, respectively (data not shown). These results correlated with our recent observation thatMLN8237 inhibited tumor growth and prolonged survival in medulloblastoma-bearing GTMLmice, which carry Trp53mutation [3].
DiscussionHere we show that GTML neurospheres represent a powerful tool for analysis of the molecularmechanisms of MYCN-dependent transformation. They are also an efficient platform for invitro and in vivo pre-clinical evaluation of small molecule therapeutics for MYCN-driven MB.GTML transgenic mice represent the only native model of MYC oncoprotein family-driven
Characterization of MYCN-Dependent Medulloblastoma
PLOSONE | DOI:10.1371/journal.pone.0119834 March 18, 2015 13 / 20
spontaneous medulloblastoma in which genetically manipulable tumors arise in immunocom-petent mice with an intact blood-brain-barrier. In this context, it is important that MYCN-driven GTML neurospheres retain the properties of primary tumors when sygeneically im-planted in vivo. Other recent research into the genetic interaction between MYC or MYCN andp53 has utilized non-natively arising orthotopic tumor implantation models in which eithercerebellar granule precursor cells or cerebellar stem cells (CD133+Lin-) were exogenouslytransduced with either MYC or MYCN and were re-implanted orthotopically into mice[47,48]. In the former publication, transduction of MYCN into cGNP yielded SHHmedullo-blastoma, and in the latter, coexpression of MYCN with dominant negatively mutated p53 pro-duced large-cell anaplastic medulloblastoma of multiple genetic subgroups. In common withthese models, expression microarray analysis has revealed that both the GTML and GTML/Trp53KI/KI models represent Group3 disease [3,12,49]. Although MYCN amplifications are lesscommon than MYC in this subgroup, they are observed at an appreciable frequency, with rele-vance in all non-WNT subgroups [6–10].
The finding that aggressive MB with features typical of non-SHH human MB is generatedby expansion of a highly proliferative and MYCN-dependent tumor-propagating cell that canbe maintained in culture and orthotopically transplanted is potentially important for the clini-cal treatment of aggressive MB. The majority of these tumors are not defined by discrete genet-ic changes or alterations in pathway signaling that are druggable. Our finding that growth oftumor-propagating cells in this system are MYCN-dependent, and to some extent can beforced to differentiate by targeted inhibition of MYCN, resulting in regression of tumors
Fig 5. Effect of MLN8237 on GTML spheres andmice. (A) PC projections of 96 cells fromWT1, WT2, M10519 cells treated with and without dox, andM10519 cells with 100nMMLN8237. PC1 and PC2 captured 21% and 13% of variances in the dataset. (B) MYCN stability in MLN8237-treated M10519 cells.Cells were incubated with dox or MLN8237, and cell extracts were analyzed by western blotting. (C) Kaplan-Meier curves for overall survival of mice havingorthotopic tumors treated with (red) or without MLN8237 (blue). 250 cells were transplanted in to the cerebellum of FBVNmice, and once the tumor burdenreached at a level of 1x10⁹ photon/s, mice were daily treated twice with (n = 8) or without (n = 9) MLN8237 (daily oral dosing at 60mg/kg). Mice were treatedwith MLN8237 for 5 days and then untreated for 2 days, and then the repeat this schedule twice more.
doi:10.1371/journal.pone.0119834.g005
Characterization of MYCN-Dependent Medulloblastoma
PLOSONE | DOI:10.1371/journal.pone.0119834 March 18, 2015 14 / 20
highlights the therapeutic potential of MYCN-targeted treatment approaches for patients withaggressive MB. It should also be noted, however, that MYCN withdrawal only caused the cellcycle arrest in GTML spheres and the temporal remission of orthotropic tumors in a tissue en-vironment; we observed that prolonged (> 2 weeks) treatment of GTML mice with dox occa-sionally resulted in the emergence of dox-resistant tumors (data not shown). Phenotypically,the relapsed tumors resembled the original orthotopic tumors, expressing MYCN, Ki67, butnot GFAP in the presence of dox (data not shown). These results suggest that there appears tobe small number of cancer cells, in which MYCN expression is not controlled by rTA only. Al-ternatively, dox may not be efficiently delivered to a part of tissues, from which the outgrowthof new tumors may occur. Regardless of the mechanism, these results clearly suggest that tar-geting MYCN with a single drug may only result in the short-term remission, and thus a com-binatorial treatment with other drugs may be necessarily to eradicate cancer cells.
While GTML neurospheres appear to be a powerful tool to study the nature of cancer-prop-agating cells, we found apparent inconsistencies in differentiation potential between cells cul-tured as neurospheres or implanted orthotopically into the cerebellum. GTML cells retainsphere morphology reminiscent of undifferentiated cells in culture in the presence of differenti-ation inducers following MYCN withdrawal. In orthotopic tumors, we detected evidence of en-hanced staining for markers associated with neuronal and glial differentiation. Thisdiscrepancy can be explained by the fact that the latter was examined in a tissue environment,while the former was examined in culture without any biological niche. Since we found thatMYCN withdrawal in GTML neurospheres results in the decrease of Nestin after 2 days, cer-tain levels of differentiation may be triggered in dox-treated GTML cells. Culturing GTMLcells in a microenvironment that is permissive to differentiation, for example, with astrocytes[50] may help establishing a more advanced pre-clinical system that recapitulates the nature oftumor cells in a tissues environment.
Supporting InformationS1 Fig. Fine-tuning of tumor growth in the GTML system. (A) Simultaneous tissue specificexpression of humanMYCN and luciferase is driven by TRE-mediated expression in a targetmouse (TRE-MYCN-Luc, TML). Mating of single-transgenic TMLmice with those expressingthe Tetracycline transactivator (tTA) under the control of the Glutamate transporter (GLT1)promoter (GLT1-tTA) provides CNS specificity confined to the hindbrain. Dox (Dox)-mediatedinhibition of TRE activation allows robust genetic control of MYCN and luciferase (Luc) expres-sion. (B) Monitoring tumor growth through bioluminescence. Rapid tumor growth from days 81to 99 is shown (C) M10519 cells were cultured and then incubated with luciferin, and then the lu-ciferase signals were measured. The bioluminescence signal was correlated with the number ofspheres or cells. Error bars, ±SD. (D) Effect of growth factors (GF) on three GTML lines (M0983,M14942, and M10519). Spheres were cultured with or without 20ng/ml of bFGF and EGF andcell numbers were counted. Error bars, ±SD. (E) Re-entry to growth after removal of dox. ThreeGTML lines (M0983, M21446, and M10519) were treated with dox for 7 days, and then cellswere cultured without dox. Error bars, ±SD. (F) Stability of MYCN and c-Myc proteins upondox treatment. Cell extracts fromM21446 GTML cells were examined by western analyses.Spheres were cultured in the presence or absence of dox (1 or 3μg/ml) and harvested at 6 hours.(TIF)
S2 Fig. Growth and differentiation characteristics of GTML spheres. (A) Effect of MYCNwithdrawal and differentiation inducers on M10519 GTML cells. M10519 GTML spheres werecultured in neurobasal media with growth factors and either vehicle, dox (1μg/ml) or pro-differentiation containing serum and retinoic acid (Diff. Media) as indicated and sphere
Characterization of MYCN-Dependent Medulloblastoma
PLOSONE | DOI:10.1371/journal.pone.0119834 March 18, 2015 15 / 20
formation and bioluminescence signals were monitored. Bar, 100μm. (B) Effect of serum anddox on three GTML lines (M14942, M0982, and M10519) and wild type cells from the cerebel-lum. Spheres were cultured for 8 days in neurobasal media with growth factors and either vehi-cle, dox (1μg/ml), serum, or pro-differentiation containing serum and retinoic acid (Diff.Media) as indicated. Bar, 100μm.(TIF)
S3 Fig. Protein marker expression profiles in GTML spheres. (A) Impact of MYCN with-drawal and differentiation inducers on marker expression in M10519 GTML cells. M10519GTML spheres were cultured in neurobasal media with growth factors and either vehicle, dox(1μg/ml) or pro-differentiation containing serum and retinoic acid (Diff. Media) as indicated.(B) M10519 GTML spheres were treated with vehicle or dox for 7 days and expression ofCleaved Caspase 3 and MYCN analyzed by immunofluorescence. Nuclei were counterstainedwith DAPI. Bar, 50μm.(TIF)
S4 Fig. Limiting-dilution sphere assay using M10519 cells. Serial dilutions (100, 10 and 1cells per well) GTML cells were cultured in neurobasal media with B27 and growth factors. Thenumbers of wells containing spheres were counted.(TIF)
S5 Fig. Expression analysis of M10519 GTML cells.Heat map showing expression levels(Cq values) of 96 genes. Indicated are wild-type cells from midbrain (WT1) or cerebellum(WT2), untreated M10519 spheres (M10519), M10519 spheres treated with dox for 24 hours(+Dox), or M10519 spheres treated with MLN8237 for 24 hours (+MLN8237). Mean expres-sion values obtained from 96 single cells for each condition are shown.(TIF)
S6 Fig. Single cell Expression analysis of M10519 GTML cells.Heat map showing expressionlevels (Cq values) of 96 genes from single cells (n = 96 cells for each condition). Indicated arewild-type cells from midbrain (WT1) or cerebellum (WT2), untreated M10519 spheres(M10519), M10519 spheres treated with dox for 24 hours (M10519+Dox), or M10519 spherestreated with MLN8237 for 24 hours (M10519+MLN8237).(TIF)
S7 Fig. Characterization of GTML spheres by orthotopic implantation. (A) Serial dilutionsof M10519 GTML cells (passage 10–27) were implanted into the cerebellum of immunocompe-tent (FVB/N) mice: n = 10 (for 1000, 5000, 1000, 250, and 100 cells); n = 9 (for 50 and 25 cells);n = 10 for tumor cells implanted without in vitro expansion. Tumor incidence was evaluatedby monitoring bioluminescence twice per week. (B) Kaplan-Meier curve showing overall sur-vival of mice implanted with M14942 (blue, passage 11, n = 5), and M10519 (red, passage 10,n = 5) cells. 250 cells were implanted orthotopically per site.(TIF)
S8 Fig. Tumor-propagating potential of FACS-sorted CD15+ cells. (A) Sorting of CD15+and CD15- populations fromM21446 GTML cells by FACS. (B, C) Kaplan-Meier curves foroverall survival of mice implanted with CD15+ or CD15- cells from (B) M21446 (passage 20)and (C) M0983 (passage 10) cells. 10 cells were implanted into the cerebellum per mouse (n = 5for each). (D) Sphere assays using FACS-sorted CD15+ and CD15- cells (M10519 cells, passage18). 50 cells per well were plated onto a 24-well plate containing neurobasal media in the pres-ence of growth factors and collagen (1mg/ml) and then cultured for four weeks.(TIF)
Characterization of MYCN-Dependent Medulloblastoma
PLOSONE | DOI:10.1371/journal.pone.0119834 March 18, 2015 16 / 20
S9 Fig. Tumor-propagating potential of FACS-sorted CD133+ cells. (A) Sorting of CD133+and CD133- populations fromM10519 GTML cells (passage 23) by FACS. Cells were incubat-ed with control IgG1 or anti-CD133 conjugated with PE prior to sorting. (B) Kaplan-Meiercurve showing overall survival of mice implanted with CD133+ or CD133- cells. 10 cells wereimplanted into the cerebellum per mouse (n = 5 for each). (C) 3D neurosphere assays usingFACS-sorted CD133+ and CD133- cells (M10519, passage 23). 50 cells per well were platedonto a 24-well plate containing neurobasal media in the presence of growth factors and colla-gen (1mg/ml) and then cultured for four weeks.(TIF)
S10 Fig. Hierarchical clustering analysis of GTML following treatment with dox orMLN8237. “M10519” cluster (black), “M10519+dox” cluster (green), and “M10519+MLN8237plus M10519+Dox cluster” (blue) are shown.(TIF)
S11 Fig. Effect of MLN8237 on GTML mice. Kaplan-Meier curves for overall survival of micebearing orthotopic tumors treated with MLN8237 (red) or vehicle (blue). 250 cells (M10519cells, passage 16) were transplanted into the cerebellum of FBVN mice and treatment initiatedwhen tumor-associated bioluminescence signal reached 1x10⁹ photon/s. Mice were treated byoral gavage (30mg/kg twice daily) with MLN8237 (red, n = 4) or vehicle (blue, n = 4). Micewere treated with MLN8237 or vehicle for a period 12 days as indicated by grey shading.(TIF)
S1 Table. List of 96 genes with primer sequences used in BioMark qPCR.(XLSX)
S2 Table. Characteristics of GTML tumor-derived neurosphere cell lines.(DOCX)
S3 Table. BioMark qPCR expression data.(XLSX)
AcknowledgmentsWe thank Dr Ian Titley, Dr Sanne Kuiper, and Gowri Vijayaraghavan (ICR) for technical sup-port. We thank Prof Mel Greaves, Dr Lyndal Kearney and Dr Tony Ford (ICR) for criticalreading and discussion. We thank Dr Fredrik Swartling (Uppsala Universitet) for helpful dis-cussion of our data.
Author ContributionsConceived and designed the experiments: KP TS LC. Performed the experiments: ZA LJ VGAH LH. Analyzed the data: ZA LJ VG. Wrote the paper: ZA KP TS LC.
References1. Taylor MD, Northcott PA, Korshunov A, Remke M, Cho YJ et al. Molecular subgroups of medulloblasto-
ma: the current consensus. Acta Neuropathol. 2012; 123: 465–472. doi: 10.1007/s00401-011-0922-zPMID: 22134537
2. Manoranjan B, Venugopal C, McFarlane N, Doble BW, Dunn SE et al. Medulloblastoma stem cells:modeling tumor heterogeneity. Cancer Lett. 2013; 338: 23–31. doi: 10.1016/j.canlet.2012.07.010PMID: 22796365
3. Hill RM, Kuijper S, Lindsey JC, Petrie K, Schwalbe EC et al. Combined MYC and P53 Defects Emergeat Medulloblastoma Relapse and Define Rapidly Progressive, Therapeutically Targetable Disease.Cancer Cell. 2015; 27: 72–84. doi: 10.1016/j.ccell.2014.11.002 PMID: 25533335
Characterization of MYCN-Dependent Medulloblastoma
PLOSONE | DOI:10.1371/journal.pone.0119834 March 18, 2015 17 / 20
4. Pfister S, Remke M, Benner A, Mendrzyk F, Toedt G et al. Outcome prediction in pediatric medulloblas-toma based on DNA copy-number aberrations of chromosomes 6q and 17q and the MYC and MYCNloci. J Clin Oncol. 2009; 27: 1627–1636. doi: 10.1200/JCO.2008.17.9432 PMID: 19255330
5. Kool M, Koster J, Bunt J, Hasselt NE, Lakeman A et al. Integrated genomics identifies five medulloblas-toma subtypes with distinct genetic profiles, pathway signatures and clinicopathological features. PLoSOne. 2008; 3: e3088. doi: 10.1371/journal.pone.0003088 PMID: 18769486
6. Jones DT, Jager N, Kool M, Zichner T, Hutter B et al. Dissecting the genomic complexity underlying me-dulloblastoma. Nature. 2012; 488: 100–105. doi: 10.1038/nature11284 PMID: 22832583
7. Northcott PA, Shih DJ, Peacock J, Garzia L, Morrissy AS et al. Subgroup-specific structural variationacross 1,000 medulloblastoma genomes. Nature. 2012; 488: 49–56. doi: 10.1038/nature11327 PMID:22832581
8. Pugh TJ, Weeraratne SD, Archer TC, Pomeranz Krummel DA, Auclair D et al. Medulloblastoma exomesequencing uncovers subtype-specific somatic mutations. Nature. 2012; 488: 106–110. doi: 10.1038/nature11329 PMID: 22820256
9. Robinson G, Parker M, Kranenburg TA, Lu C, Chen X et al. Novel mutations target distinct subgroupsof medulloblastoma. Nature. 2012; 488: 43–48. doi: 10.1038/nature11213 PMID: 22722829
10. Roussel MF, Robinson GW. Role of MYC in Medulloblastoma. Cold Spring Harb Perspect Med. 2013; 3.
11. Swartling FJ, Grimmer MR, Hackett CS, Northcott PA, Fan QW et al. Pleiotropic role for MYCN in me-dulloblastoma. Genes Dev. 2010; 24: 1059–1072. doi: 10.1101/gad.1907510 PMID: 20478998
12. Swartling FJ, Savov V, Persson AI, Chen J, Hackett CS et al. Distinct neural stem cell populations giverise to disparate brain tumors in response to N-MYC. Cancer Cell. 2012; 21: 601–613. doi: 10.1016/j.ccr.2012.04.012 PMID: 22624711
13. Brockmann M, Poon E, Berry T, Carstensen A, Deubzer HE et al. Small molecule inhibitors of aurora-ainduce proteasomal degradation of N-myc in childhood neuroblastoma. Cancer Cell. 2013; 24: 75–89.doi: 10.1016/j.ccr.2013.05.005 PMID: 23792191
14. Chesler L, Schlieve C, Goldenberg DD, Kenney A, Kim G et al. Inhibition of phosphatidylinositol 3-ki-nase destabilizes Mycn protein and blocks malignant progression in neuroblastoma. Cancer Res.2006; 66: 8139–8146. PMID: 16912192
15. Kool M, Korshunov A, RemkeM, Jones DT, Schlanstein M et al. Molecular subgroups of medulloblasto-ma: an international meta-analysis of transcriptome, genetic aberrations, and clinical data of WNT,SHH, Group 3, and Group 4 medulloblastomas. Acta Neuropathol. 2012; 123: 473–484. doi: 10.1007/s00401-012-0958-8 PMID: 22358457
16. Monje M, Beachy PA, Fisher PG. Hedgehogs, flies, Wnts and MYCs: the time has come for manythings in medulloblastoma. J Clin Oncol. 2011; 29: 1395–1398. doi: 10.1200/JCO.2010.34.0547 PMID:21357776
17. Eberhart CG. Three down and one to go: modeling medulloblastoma subgroups. Cancer Cell. 2012;21: 137–138. doi: 10.1016/j.ccr.2012.01.013 PMID: 22340583
18. Jasnos L, Sawado T. Determining cell division symmetry through the dissection of dividing cells usingsingle-cell expression analysis. Nat Protoc. 2014; 9: 505–516. doi: 10.1038/nprot.2014.032 PMID:24504476
19. Jasnos L, Aksoy FB, Hersi HM, Wantuch S, Sawado T. Identifying division symmetry of mouse embry-onic stem cells: negative impact of DNAmethyltransferases on symmetric self-renewal. Stem Cell Re-ports. 2013; 1: 360–369. doi: 10.1016/j.stemcr.2013.08.005 PMID: 24319670
20. Mao P, Joshi K, Li J, Kim SH, Li P et al. Mesenchymal glioma stem cells are maintained by activatedglycolytic metabolism involving aldehyde dehydrogenase 1A3. Proc Natl Acad Sci U S A. 2013; 110:8644–8649. doi: 10.1073/pnas.1221478110 PMID: 23650391
21. Knoepfler PS, Cheng PF, Eisenman RN. N-myc is essential during neurogenesis for the rapid expan-sion of progenitor cell populations and the inhibition of neuronal differentiation. Genes Dev. 2002; 16:2699–2712. PMID: 12381668
22. Lee MK, Tuttle JB, Rebhun LI, Cleveland DW, Frankfurter A. The expression and posttranslationalmodification of a neuron-specific beta-tubulin isotype during chick embryogenesis. Cell Motil Cytoskele-ton. 1990; 17: 118–132. PMID: 2257630
23. Rostomily RC, Bermingham-McDonogh O, Berger MS, Tapscott SJ, Reh TA, Olson JM. Expression ofneurogenic basic helix-loop-helix genes in primitive neuroectodermal tumors. Cancer Res. 1997; 57:3526–3531. PMID: 9270024
24. Uchida N, Buck DW, He D, ReitsmaMJ, Masek M et al. Direct isolation of human central nervous sys-tem stem cells. Proc Natl Acad Sci U S A. 2000; 97: 14720–14725. PMID: 11121071
25. Singh SK, Hawkins C, Clarke ID, Squire JA, Bayani J et al. Identification of human brain tumour initiat-ing cells. Nature. 2004; 432: 396–401. PMID: 15549107
Characterization of MYCN-Dependent Medulloblastoma
PLOSONE | DOI:10.1371/journal.pone.0119834 March 18, 2015 18 / 20
26. Singh SK, Clarke ID, Terasaki M, Bonn VE, Hawkins C et al. Identification of a cancer stem cell inhuman brain tumors. Cancer Res. 2003; 63: 5821–5828. PMID: 14522905
27. Hemmati HD, Nakano I, Lazareff JA, Masterman-Smith M, Geschwind DH et al. Cancerous stem cellscan arise from pediatric brain tumors. Proc Natl Acad Sci U S A. 2003; 100: 15178–15183. PMID:14645703
28. Michiels EM, Oussoren E, Van Groenigen M, Pauws E, Bossuyt PM et al. Genes differentially express-ed in medulloblastoma and fetal brain. Physiol Genomics. 1999; 1: 83–91. PMID: 11015565
29. Sakakibara S, Imai T, Hamaguchi K, Okabe M, Aruga J et al. Mouse-Musashi-1, a neural RNA-bindingprotein highly enriched in the mammalian CNS stem cell. Dev Biol. 1996; 176: 230–242. PMID:8660864
30. Eng LF. Glial fibrillary acidic protein (GFAP): the major protein of glial intermediate filaments in differen-tiated astrocytes. J Neuroimmunol. 1985; 8: 203–214. PMID: 2409105
31. Deloulme JC, Raponi E, Gentil BJ, Bertacchi N, Marks A et al. Nuclear expression of S100B in oligo-dendrocyte progenitor cells correlates with differentiation toward the oligodendroglial lineage and mod-ulates oligodendrocytes maturation. Mol Cell Neurosci. 2004; 27: 453–465. PMID: 15555923
32. Zhou Q, Wang S, Anderson DJ. Identification of a novel family of oligodendrocyte lineage-specificbasic helix-loop-helix transcription factors. Neuron. 2000; 25: 331–343. PMID: 10719889
33. Lu QR, Yuk D, Alberta JA, Zhu Z, Pawlitzky I et al. Sonic hedgehog—regulated oligodendrocyte lineagegenes encoding bHLH proteins in the mammalian central nervous system. Neuron. 2000; 25: 317–329.PMID: 10719888
34. Marie Y, Sanson M, Mokhtari K, Leuraud P, Kujas M et al. OLIG2 as a specific marker of oligodendrogli-al tumour cells. Lancet. 2001; 358: 298–300. PMID: 11498220
35. Oliver TG, Grasfeder LL, Carroll AL, Kaiser C, Gillingham CL et al. Transcriptional profiling of the Sonichedgehog response: a critical role for N-myc in proliferation of neuronal precursors. Proc Natl Acad SciU S A. 2003; 100: 7331–7336. PMID: 12777630
36. Sun Y, KongW, Falk A, Hu J, Zhou L et al. CD133 (Prominin) negative human neural stem cells are clo-nogenic and tripotent. PLoS One. 2009; 4: e5498. doi: 10.1371/journal.pone.0005498 PMID: 19430532
37. Yang ZJ, Ellis T, Markant SL, Read TA, Kessler JD et al. Medulloblastoma can be initiated by deletionof Patched in lineage-restricted progenitors or stem cells. Cancer Cell. 2008; 14: 135–145. doi: 10.1016/j.ccr.2008.07.003 PMID: 18691548
38. Ward RJ, Lee L, Graham K, Satkunendran T, Yoshikawa K et al. Multipotent CD15+ cancer stem cellsin patched-1-deficient mouse medulloblastoma. Cancer Res. 2009; 69: 4682–4690. doi: 10.1158/0008-5472.CAN-09-0342 PMID: 19487286
39. Read TA, Fogarty MP, Markant SL, McLendon RE, Wei Z et al. Identification of CD15 as a marker fortumor-propagating cells in a mouse model of medulloblastoma. Cancer Cell. 2009; 15: 135–147. doi:10.1016/j.ccr.2008.12.016 PMID: 19185848
40. Hatton BA, Knoepfler PS, Kenney AM, Rowitch DH, de Alboran IM et al. N-myc is an essential down-stream effector of Shh signaling during both normal and neoplastic cerebellar growth. Cancer Res.2006; 66: 8655–8661. PMID: 16951180
41. Kenney AM, Widlund HR, Rowitch DH. Hedgehog and PI-3 kinase signaling converge on Nmyc1 topromote cell cycle progression in cerebellar neuronal precursors. Development. 2004; 131: 217–228.PMID: 14660435
42. Korshunov A, Remke M, Kool M, Hielscher T, Northcott PA et al. Biological and clinical heterogeneity ofMYCN-amplified medulloblastoma. Acta Neuropathol. 2012; 123: 515–527. doi: 10.1007/s00401-011-0918-8 PMID: 22160402
43. Northcott PA, Fernandez LA, Hagan JP, Ellison DW, GrajkowskaW et al. The miR-17/92 polycistron isup-regulated in sonic hedgehog-driven medulloblastomas and induced by N-myc in sonic hedgehog-treated cerebellar neural precursors. Cancer Res. 2009; 69: 3249–3255. doi: 10.1158/0008-5472.CAN-08-4710 PMID: 19351822
44. Sjostrom SK, Finn G, HahnWC, Rowitch DH, Kenney AM. The Cdk1 complex plays a prime role in reg-ulating N-myc phosphorylation and turnover in neural precursors. Dev Cell. 2005; 9: 327–338. PMID:16139224
45. WeissWA, Aldape K, Mohapatra G, Feuerstein BG, Bishop JM. Targeted expression of MYCN causesneuroblastoma in transgenic mice. EMBO J. 1997; 16: 2985–2995. PMID: 9214616
46. Van Brocklyn JR, Wojton J, MeisenWH, Kellough DA, Ecsedy JA et al. Aurora-A Inhibition Offers aNovel Therapy Effective against Intracranial Glioblastoma. Cancer Res. 2014; 74: 5364–5370. doi: 10.1158/0008-5472.CAN-14-0386 PMID: 25106428
Characterization of MYCN-Dependent Medulloblastoma
PLOSONE | DOI:10.1371/journal.pone.0119834 March 18, 2015 19 / 20

47. Kawauchi D, Robinson G, Uziel T, Gibson P, Rehg J et al. A mouse model of the most aggressive sub-group of human medulloblastoma. Cancer Cell. 2012; 21: 168–180. doi: 10.1016/j.ccr.2011.12.023PMID: 22340591
48. Pei Y, Moore CE, Wang J, Tewari AK, Eroshkin A et al. An animal model of MYC-driven medulloblasto-ma. Cancer Cell. 2012; 21: 155–167. doi: 10.1016/j.ccr.2011.12.021 PMID: 22340590
49. Poschl J, Stark S, Neumann P, Grobner S, Kawauchi D et al. Genomic and transcriptomic analysesmatch medulloblastomamouse models to their human counterparts. Acta Neuropathol. 2014; 128:123–136. doi: 10.1007/s00401-014-1297-8 PMID: 24871706
50. Lim DA, Alvarez-Buylla A. Interaction between astrocytes and adult subventricular zone precursorsstimulates neurogenesis. Proc Natl Acad Sci U S A. 1999; 96: 7526–7531. PMID: 10377448
Characterization of MYCN-Dependent Medulloblastoma
PLOSONE | DOI:10.1371/journal.pone.0119834 March 18, 2015 20 / 20