plug-in hybrid electric vehicle charging infrastructure review · inl/ext-08-15058 u.s. department...
TRANSCRIPT
INL/EXT-08-15058
U.S. Department of Energy Vehicle
Technologies Program – Advanced Vehicle Testing Activity
Plug-in Hybrid Electric Vehicle Charging Infrastructure Review
Final Report Battelle Energy Alliance
Contract No. 58517
Kevin Morrow Donald Karner
James Francfort
November 2008
The Idaho National Laboratory is a U.S. Department of Energy National Laboratory Operated by Battelle Energy Alliance
INL/EXT-08-15058
U.S. Department of Energy Vehicle Technologies Program – Advanced Vehicle Testing Activity
Plug-in Hybrid Electric Vehicle Charging Infrastructure Review
Kevin Morrowa Donald Karnerb
James Francfortc
November 2008
Final Report Battelle Energy Alliance
Contract No. 58517
Prepared for the U.S. Department of Energy
Assistant Secretary for Energy Efficiency and Renewable Energy Under DOE Idaho Operations Office
Contract DE-AC07-05ID14517
a Electric Transportation Engineering Corporation b Electric Transportation Applications c Idaho National Laboratory

Disclaimers This document highlights work sponsored by agencies of the U.S. Government. Neither the U.S. Government nor any agency thereof, nor any of its employees, makes any warranty, express or implied, or assumes any legal liability or responsibility for the accuracy, completeness, or usefulness of any information, apparatus, product, or process disclosed, or represents that its use would not infringe privately owned rights. Reference herein to any specific commercial product, process, or service by trade name, trademark, manufacturer, or otherwise does not necessarily constitute or imply its endorsement, recommendation, or favoring by the U.S. Government or any agency thereof. The views and opinions of authors expressed herein do not necessarily state or reflect those of the U.S. Government or any agency thereof.

iii
ABSTRACT
Plug-in hybrid electric vehicles (PHEVs) are under evaluation by the U.S. Department of Energy Vehicle Technologies Program’s Advanced Vehicle Testing Activity and other various stakeholders to better understand their capability and potential petroleum reduction benefits. PHEVs could allow users to significantly improve fuel economy over a standard hybrid electric vehicle, and in some cases, depending on daily driving requirements and vehicle design, PHEVs may have the ability to eliminate fuel consumption entirely for daily vehicle trips. The cost associated with providing charging infrastructure for PHEVs, along with costs for onboard power electronics and the batteries associated with PHEV technology, will be key factors in the success of PHEVs.
This report analyzes the infrastructure requirements for PHEVs in single family residential, multi-family residential, and commercial situations. Costs associated with this infrastructure are tabulated, providing an estimate of the infrastructure costs associated with PHEV deployment.
iv
CONTENTS
ABSTRACT................................................................................................................................................. iii 1. EXECUTIVE SUMMARY ................................................................................................................ 3 2. INTRODUCTION.............................................................................................................................. 3 3. PLUG-IN HYBRID ELECTRIC VEHICLE TRIP ANALYSIS ....................................................... 4
3.1 2001 National Household Travel Survey................................................................................. 4 3.1.1 National Household Travel Survey of Historical Trends............................................ 4 3.1.2 Trip Purpose—2001 National Household Travel Survey ........................................... 8 3.1.3 Vehicle Type and Age Trends .................................................................................... 9
3.2 Actual Plug-In Hybrid Electric Vehicle Driving and Charging Trends................................ 12 4. PLUG-IN HYBRID ELECTRIC VEHICLE CHARGING PARAMETERS .................................. 14 5. INFRASTRUCTURE COST ANALYSIS....................................................................................... 16
5.1 Background ............................................................................................................................ 16 5.1.1 Level 1 ...................................................................................................................... 16 5.1.2 Level 2 ...................................................................................................................... 18 5.1.3 Level 3 ...................................................................................................................... 19
5.2 National Electrical Code ........................................................................................................ 20 5.3 Electric Utility Interface......................................................................................................... 20 5.4 Commercial Charging Infrastructure ..................................................................................... 21
5.4.1 Americans with Disabilities Act Requirements ........................................................ 21 5.4.2 Lighting and Shelter.................................................................................................. 22 5.4.3 Access Control and Customer Support ..................................................................... 23 5.4.4 Signage...................................................................................................................... 23
5.5 SITING REQUIREMENTS................................................................................................... 24 5.5.1 Residential Garage .................................................................................................... 24 5.5.2 Apartment Complex.................................................................................................. 25 5.5.3 Commercial Facility.................................................................................................. 25
5.6 OTHER USES........................................................................................................................ 26 5.7 INFRASTRUCTURE SCENARIOS ..................................................................................... 27
5.7.1 Residential Garage Charging .................................................................................... 27 5.7.2 Apartment Complex Charging .................................................................................. 28 5.7.3 Commercial Facility Charging.................................................................................. 29
6. INFRASTRUCTURE COST............................................................................................................ 30
FIGURES
Figure 3-1. Average daily vehicle trips for all types of vehicles in the NHTS surveys conducted since 1969. .................................................................................................................................... 5
Figure 3-2. Average vehicle trip lengths for all types of vehicles in the NHTS surveys conducted since 1969. .................................................................................................................................... 6
v
Figure 3-3. Average daily vehicle miles traveled for all types of vehicles in the NHTS surveys conducted since 1969.................................................................................................................... 6
Figure 3-4. Oil prices from 1970 to 2003. .................................................................................................... 7 Figure 3-5. Oil prices from 1994 through 2006 (NYMEX Light Sweet). .................................................... 7 Figure 3-6. Average annual vehicle miles traveled per household in 2001 by trip purpose. ........................ 8 Figure 3-7. Average annual vehicle trips per household by trip purpose. .................................................... 8 Figure 3-8. Average vehicle trip lengths by trip purpose.............................................................................. 9 Figure 3-9. Vehicle distribution by vehicle type per the National Household Travel Surveys
conducted since 1969.................................................................................................................... 9 Figure 3-10. Average vehicle age by vehicle type per the National Household Travel Surveys
conducted since 1969.................................................................................................................. 10 Figure 3-11. Distribution of vehicles by vehicle age and type from the 2001 National Household
Travel Survey. ............................................................................................................................ 10 Figure 3-12. Average annual miles per vehicle by vehicle age from the 2001 National Household
Travel Survey. ............................................................................................................................ 11 Figure 3-13. Daily vehicle miles travelled by vehicle age from the 2001 National Household
Travel Survey. ............................................................................................................................ 11 Figure 3-14. Time of day when driving for January and February 2008. ................................................... 13 Figure 3-15. Time of day when charging for January and February 2008.................................................. 13 Figure 4-1. Typical plug-in hybrid electric vehicle charge profile—cell level........................................... 15 Figure 4-2. Typical plug-in hybrid electric vehicle charge profile—pack level. ........................................ 15 Figure 5-1. Example of a Level 1 onboard charger by Delta-Q Technologies. .......................................... 16 Figure 5-2. Level 1 charger installed on an EnergyCS PHEV Prius........................................................... 17 Figure 5-3. Standard National Electrical Manufacturers Association 5-15P 120 VAC inlet...................... 17 Figure 5-4. EnergyCS Level 1 charger plug-in receptacle.......................................................................... 18 Figure 5-5. Level 2 “Conductive”-type electric vehicle service equipment with Avcon connectors. ........ 18 Figure 5-6. Level 2 “Inductive” type charging equipment. ........................................................................ 19 Figure 5-7. Level 3 fast charger (90 kW) for the Chrysler EPIC................................................................ 19 Figure 5-8. Typical signage for an accessible electric vehicle charging location....................................... 21 Figure 5-9. Example of ground striping for an Americans with Disabilities Act-compliant electric
vehicle station. ............................................................................................................................ 22 Figure 5-10. Level 2 public charge station with shelter, lighting, access control, and a customer
service speaker phone incorporated............................................................................................ 22 Figure 5-11. Level 2 public charge station in a mall parking structure with lighting, access control
system, and a customer service speaker phone........................................................................... 23 Figure 5-12. Electric vehicle charge station signage at a Costco store. ...................................................... 24 Figure 5-13. Electric vehicle charge station signage with city ordinance restrictions. ............................... 24
vi
Figure 5-14. Typical Level 2 residential garage charger installation.......................................................... 25 Figure 5-15. Typical apartment electrical distribution point. ..................................................................... 25 Figure 5-16. Typical commercial electrical supply panel. .......................................................................... 26 Figure 5-17. Electric vehicle charging station fed directly from utility transformer. ................................. 26 Figure 5-18. Public charging station with informational graphic panels. ................................................... 27 Figure 5-19. Depiction of a typical Level 1 and Level 2 installation for a residential garage. ................... 28 Figure 5-20. Levels 1 and 2 electric vehicle supply equipment installation flowchart for a
residential garage. ....................................................................................................................... 28 Figure 5-21. Levels 1 and 2 electric vehicle supply equipment installation flowchart for an
apartment complex. .................................................................................................................... 29 Figure 5-22. Levels 1 and 2 electric vehicle supply equipment installation flowchart for a
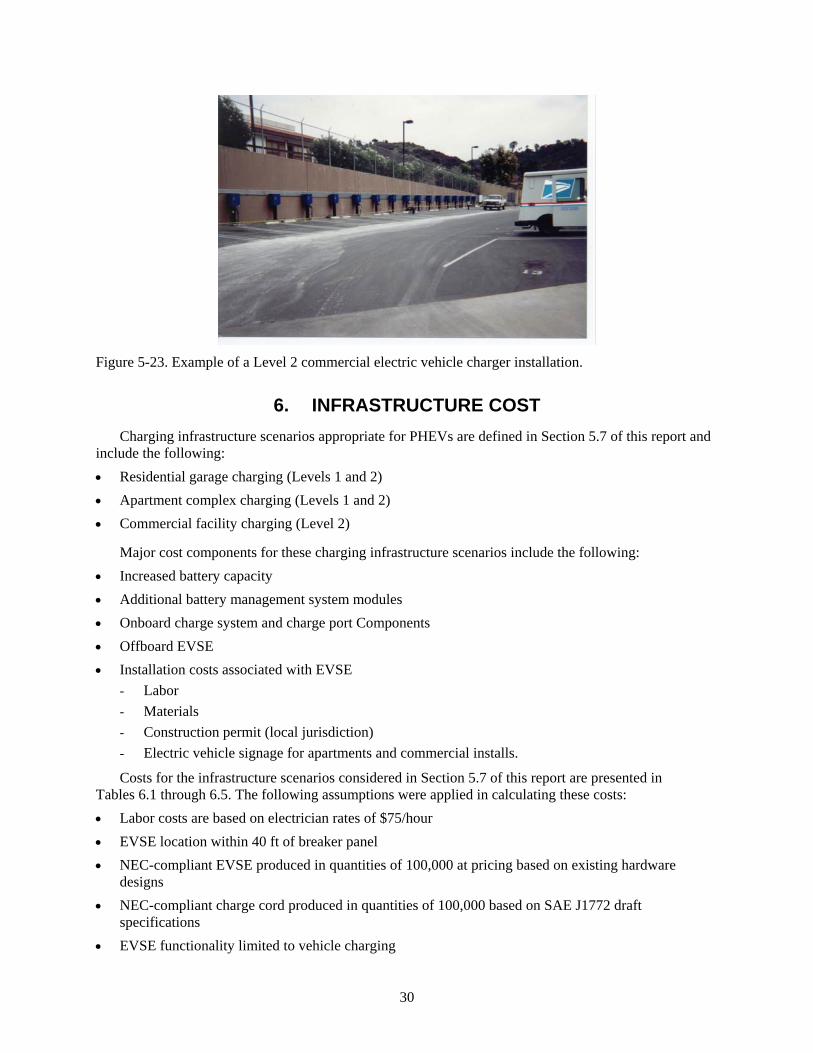
commercial location. .................................................................................................................. 29 Figure 5-23. Example of a Level 2 commercial electric vehicle charger installation................................. 30
TABLES 3-1. Vehicle trips in January and February 2008 ............................................................................... 12 3-2. Charging events for January and February 2008 ........................................................................ 13 6-1. Infrastructure costs for Level 1 residential charging .................................................................. 31 6-2. Infrastructure costs for Level 2 residential charging .................................................................. 31 6-3. Infrastructure costs for Level 1 apartment complex charging .................................................... 31 6-4. Infrastructure costs for Level 2 apartment complex charging .................................................... 31 6-5. Infrastructure costs for Level 2 commercial facility charging.................................................... 32 6-6. Battery sizes and charge times for various plug-in hybrid electric vehicle platforms................ 33 6-7. Power electronics and battery costs for various plug-in hybrid electric vehicle platforms ........ 34
2
ACRONYMS EVSE Electric vehicle supply equipment
HEV Hybrid electric vehicle
INL Idaho National Laboratory
NEC National Electric Code
NHTS National Household Travel Survey
PHEV Plug-in hybrid electric vehicle
SOC State-of-charge
VMT Vehicle miles traveled
3
Plug-in Hybrid Electric Vehicle Charging Infrastructure Review Final Report
1. EXECUTIVE SUMMARY Plug-in hybrid electric vehicles (PHEVs) are under evaluation by various stakeholders to better
understand their capability and potential benefits. The cost associated with providing charging infrastructure for PHEVs, along with additional costs for onboard power electronics and added battery capacities associated with PHEV technology, will be key factors in the success of PHEVs.
PHEV charging parameters, including charge power, charge energy, and charge times, can be established by evaluating typical daily vehicle trips and daily vehicle miles traveled. Actual PHEV driver behavior and an evaluation of charge power requirements (based on experience with charge characteristics of various battery chemistries) bring additional light to charging infrastructure requirements for PHEVs. Upon conducting these evaluations, it was concluded that 40 miles of charge depleting range is necessary for an average PHEV if no infrastructure is available outside of the owner's primary residence. If public charging infrastructure is available, allowing PHEV charging outside of the owner's primary residence, the charge depleting range can be lowered to 13 miles. It is, therefore, considered important to evaluate charging infrastructure in both residential and commercial settings because the availability of a rich charging infrastructure can reduce the onboard energy storage requirement (i.e., battery size) for PHEVs.
Typical charging infrastructure scenarios evaluated include (1) overnight charging at a home garage, (2) overnight charging at an apartment complex, and (3) opportunity charging at a commercial facility. Each scenario was described, the infrastructure and onboard power electronics requirements determined, and the typical cost for the infrastructure and onboard power electronics developed.
Using charge times and estimated costs for onboard power electronics to support various charge levels and charge depleting vehicle ranges, it is shown that Level 2 charge times are significantly shorter than Level 1 and increase as battery size increases. It is further shown that battery size and therefore, charge times can be reduced by providing a rich charging infrastructure that allows charging away from the residence or apartment where the vehicle is housed overnight. When comparing the cost of onboard electronics and a battery to support a larger (PHEV-40) battery versus a smaller (PHEV-10) battery for a mid-size vehicle (using the most favorable battery cost of $300/kWh), it can be seen that the additional range comes at a cost of $8,268 (Page 32). This compares to a cost of $1,852 (Table 6-5) to provide additional Level 2 commercial facility charging infrastructure, allowing the reduced range PHEV-10 to be used as effectively as the longer range PHEV-40. Therefore it can be concluded that overall transportation system cost can be reduced by providing rich charging infrastructure rather than compensating for lean infrastructure with additional battery size and range.
2. INTRODUCTION Hybrid electric vehicles (HEVs) have achieved familiarity and acceptance by private consumers and
fleets in the United States. HEV sales in the United States have grown from 9,367 in 2000 to 324,318 through 2007d . HEV popularity in government fleets has been driven by mandates to reduce fuel
d EDTA web page, courtesy of R. L. Polk and Company, www.electricdrive.org/index.
4
consumption. The public sector’s reasons are somewhat more varied, ranging from environmental concerns, to image, to fuel savingse.
The methodology used to establish PHEV charging parameters, including charge power, charge energy, and charge times, began with an evaluation of typical daily vehicle trips and daily vehicle miles traveled based on data from the 2001 National Household Survey. Additionally, an evaluation of actual PHEV driver behavior and an evaluation of charge power requirements (based on experience with charge characteristics of various battery chemistries) were conducted.
Based on the results of these evaluations, typical charge infrastructure scenarios were developed, including (1) overnight charging at a home garage, (2) overnight charging at an apartment complex, and (3) opportunity charging at a commercial facility. Each scenario was described, the infrastructure and onboard power electronics requirements determined, and the typical cost for the infrastructure and onboard power electronics developed.
Using this information, costs were developed for (1) PHEV charging infrastructure, (2) electrical energy for charging, (3) onboard power electronics required for battery charging, (4) probable vehicle changes to accommodate various charging options, and (5) additional battery capacity to support a charge-depleting operation.
3. PLUG-IN HYBRID ELECTRIC VEHICLE TRIP ANALYSIS To establish PHEV charge parameters, a general understanding of the typical daily trips and total
daily vehicle miles traveled must be obtained. The following two resources were used in order to obtain this trip information:
1. 2001 National Household Travel Survey
2. Actual driving habits of existing PHEV fleet drivers.
Additionally, charge power and time requirements, based on measurement of charge characteristics for various batteries, were obtained to support the determination of charge scenarios.
3.1 2001 National Household Travel Survey The first Nationwide Personal Transportation Survey was conducted by the Federal Highway
Administration in 1969, collecting detailed data on personal travel. Additional surveys were conducted in 1977, 1983, 1990, and 1995. In 2001, the Federal Highway Administration-managed Nationwide Personal Transportation Survey was combined with the Bureau of Transportation Statistics-sponsored American Travel Survey and was designated as the National Household Travel Survey (NHTS) of 2001.f The 2001 NHTS had a total sample size of 69,817 households comprised of a national sample of 26,038 completed households and 43,779 additional households collected by nine add-on areas (i.e., Baltimore; Des Moines; Hawaii; Kentucky; Lancaster, PA; New York State; Oahu (Honolulu); Texas state; and Wisconsin state).
3.1.1 National Household Travel Survey of Historical Trends
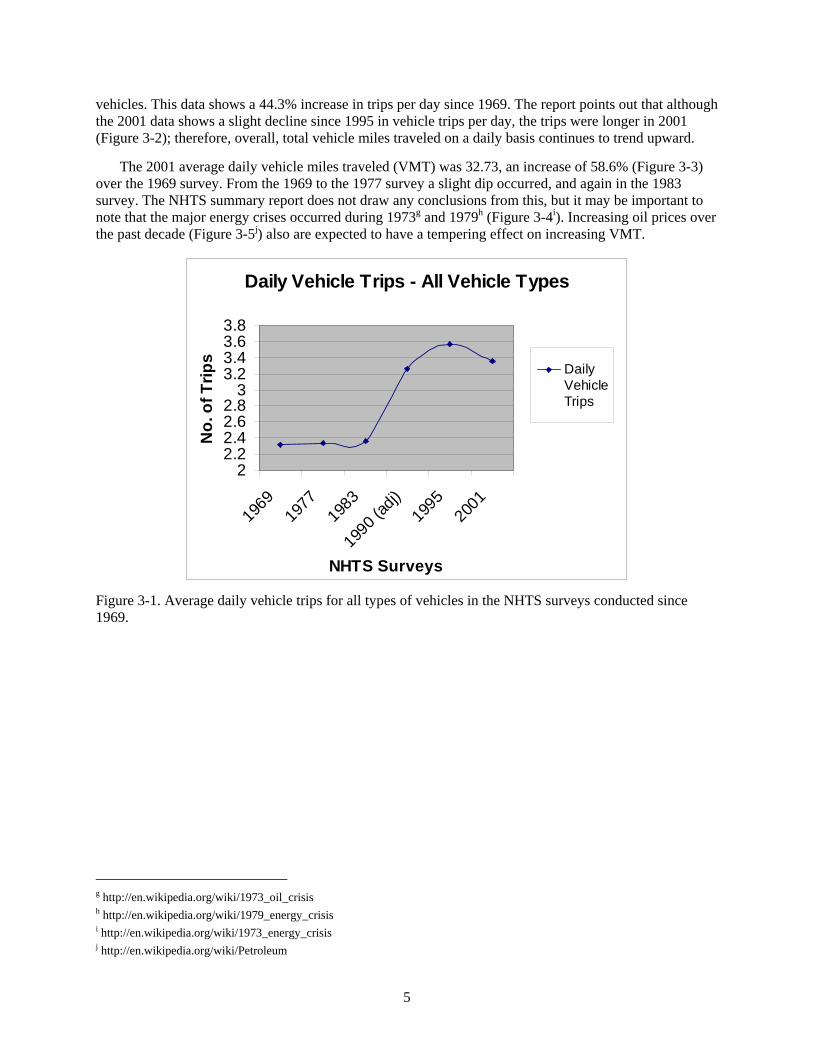
The following figures present data provided in the NHTS 2004 report Summary of Travel Trends, 2001 National Travel Survey. The report includes data from the initial survey in 1969 through the last NHTS survey of 2001. Figure 3-1 shows the average number of daily vehicle trips for all types of e Heffner, R.; Kurani, K.; Turrentine, T. Effects of Vehicle Image in Gasoline-Hybrid Electric Vehicles, Institute of
Transportation Studies, University of California, Davis 2005. f Hu, P, Reuscher, T, (2004), Summary of Travel Trends, 2001 National Household Travel Survey, U.S. Department of Energy
and Federal Highway Administration.
5
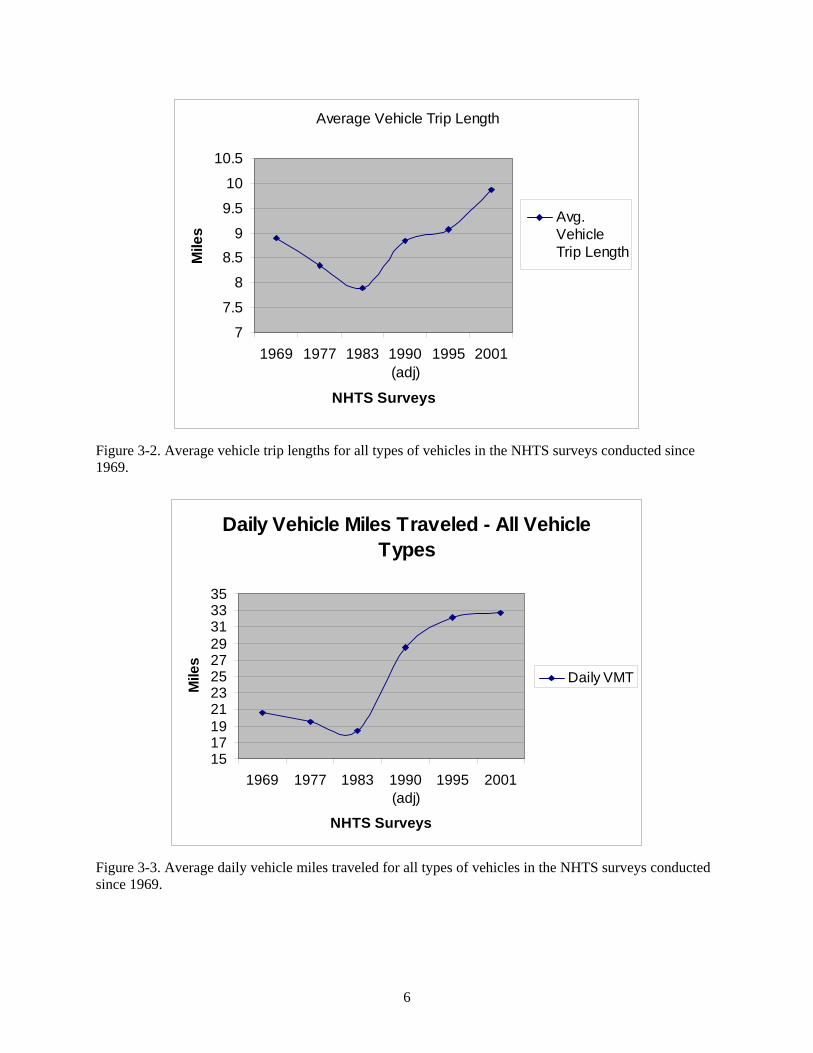
vehicles. This data shows a 44.3% increase in trips per day since 1969. The report points out that although the 2001 data shows a slight decline since 1995 in vehicle trips per day, the trips were longer in 2001 (Figure 3-2); therefore, overall, total vehicle miles traveled on a daily basis continues to trend upward.
The 2001 average daily vehicle miles traveled (VMT) was 32.73, an increase of 58.6% (Figure 3-3) over the 1969 survey. From the 1969 to the 1977 survey a slight dip occurred, and again in the 1983 survey. The NHTS summary report does not draw any conclusions from this, but it may be important to note that the major energy crises occurred during 1973g and 1979h (Figure 3-4i). Increasing oil prices over the past decade (Figure 3-5j) also are expected to have a tempering effect on increasing VMT.
Daily Vehicle Trips - All Vehicle Types
22.22.42.62.8
33.23.43.63.8
1969
1977
1983
1990
(adj)
1995
2001
NHTS Surveys
No.
of T
rips
DailyVehicleTrips
Figure 3-1. Average daily vehicle trips for all types of vehicles in the NHTS surveys conducted since 1969.
g http://en.wikipedia.org/wiki/1973_oil_crisis h http://en.wikipedia.org/wiki/1979_energy_crisis i http://en.wikipedia.org/wiki/1973_energy_crisis j http://en.wikipedia.org/wiki/Petroleum
6
Average Vehicle Trip Length
7
7.5
8
8.59
9.5
10
10.5
1969 1977 1983 1990(adj)
1995 2001
NHTS Surveys
Mile
sAvg.VehicleTrip Length
Figure 3-2. Average vehicle trip lengths for all types of vehicles in the NHTS surveys conducted since 1969.
Daily Vehicle Miles Traveled - All Vehicle Types
1517192123252729313335
1969 1977 1983 1990(adj)
1995 2001
NHTS Surveys
Mile
s
Daily VMT
Figure 3-3. Average daily vehicle miles traveled for all types of vehicles in the NHTS surveys conducted since 1969.

7
Figure 3-4. Oil prices from 1970 to 2003, in nominal values. Numbers refer to world events impacting oil prices. See http://en.wikipedia.org/wiki/Image:Oil_price_chronology-june2007.gif for notes.
Figure 3-5. Oil prices from 1994 through 2006 (NYMEX Light Sweet).
8
3.1.2 Trip Purpose—2001 National Household Travel Survey
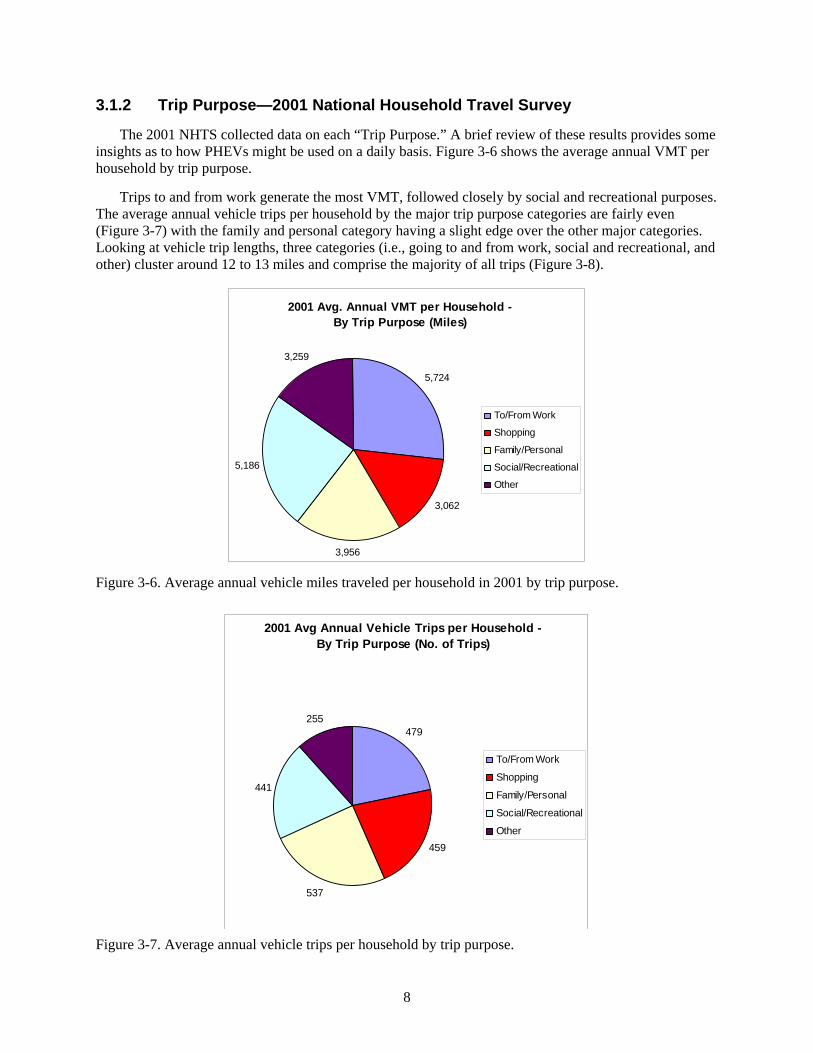
The 2001 NHTS collected data on each “Trip Purpose.” A brief review of these results provides some insights as to how PHEVs might be used on a daily basis. Figure 3-6 shows the average annual VMT per household by trip purpose.
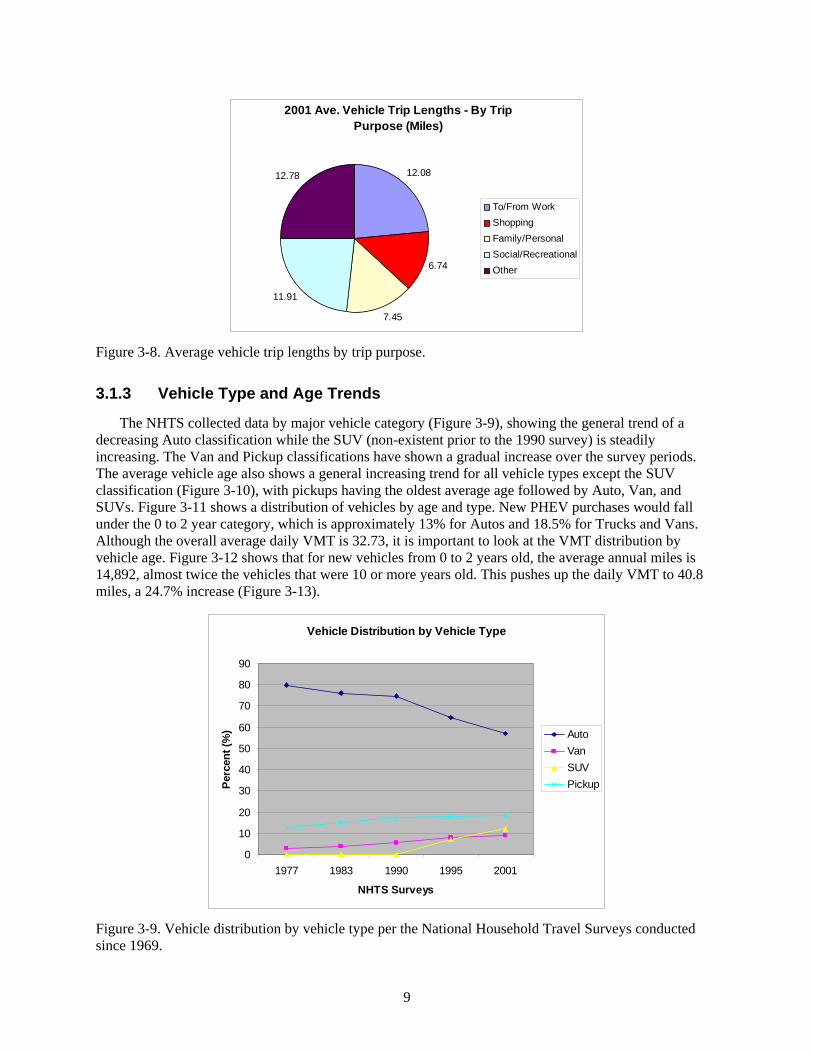
Trips to and from work generate the most VMT, followed closely by social and recreational purposes. The average annual vehicle trips per household by the major trip purpose categories are fairly even (Figure 3-7) with the family and personal category having a slight edge over the other major categories. Looking at vehicle trip lengths, three categories (i.e., going to and from work, social and recreational, and other) cluster around 12 to 13 miles and comprise the majority of all trips (Figure 3-8).
2001 Avg. Annual VMT per Household - By Trip Purpose (Miles)
5,724
3,062
3,956
5,186
3,259
To/From Work
Shopping
Family/Personal
Social/Recreational
Other
Figure 3-6. Average annual vehicle miles traveled per household in 2001 by trip purpose.
2001 Avg Annual Vehicle Trips per Household - By Trip Purpose (No. of Trips)
479
459
537
441
255
To/From Work
Shopping
Family/Personal
Social/Recreational
Other
Figure 3-7. Average annual vehicle trips per household by trip purpose.
9
2001 Ave. Vehicle Trip Lengths - By Trip Purpose (Miles)
12.08
6.74
7.45
11.91
12.78
To/From WorkShoppingFamily/PersonalSocial/RecreationalOther
Figure 3-8. Average vehicle trip lengths by trip purpose.
3.1.3 Vehicle Type and Age Trends
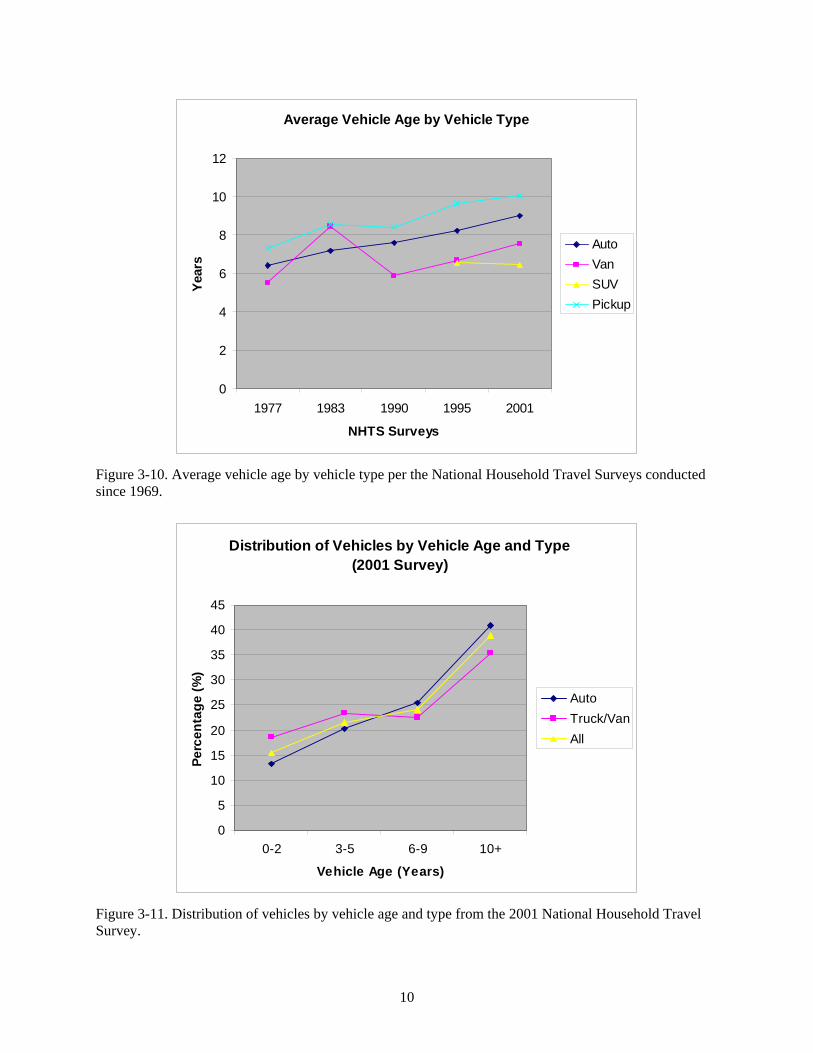
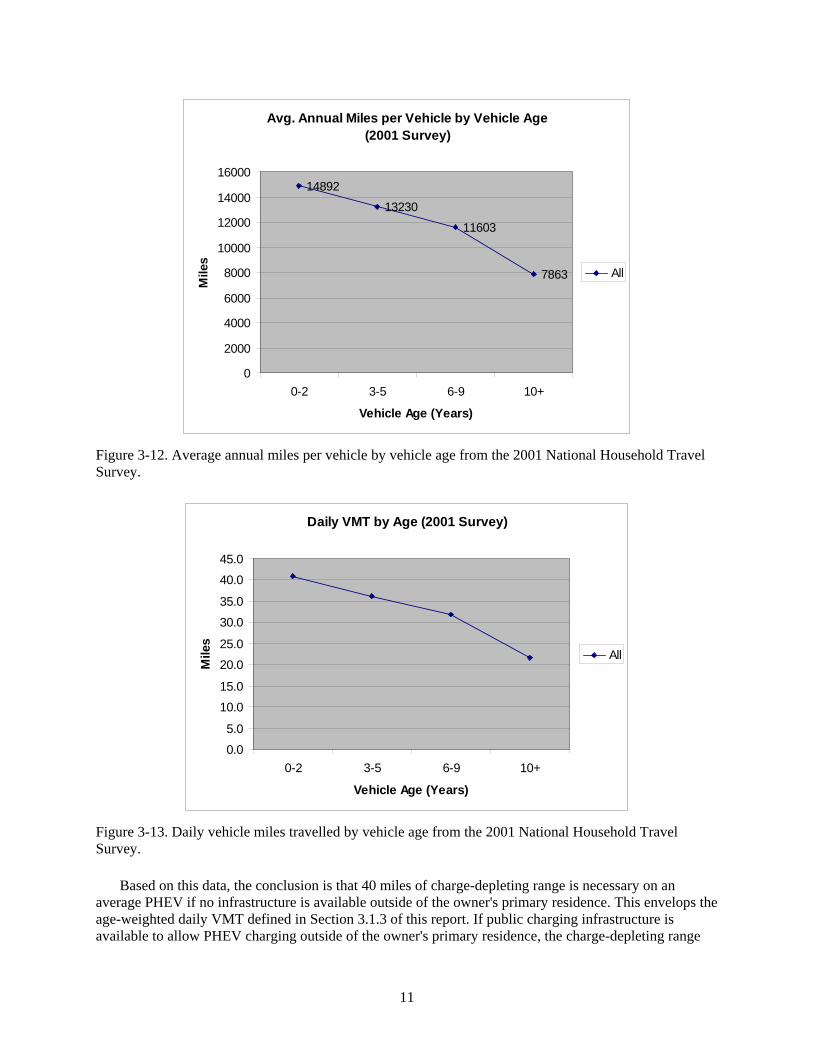
The NHTS collected data by major vehicle category (Figure 3-9), showing the general trend of a decreasing Auto classification while the SUV (non-existent prior to the 1990 survey) is steadily increasing. The Van and Pickup classifications have shown a gradual increase over the survey periods. The average vehicle age also shows a general increasing trend for all vehicle types except the SUV classification (Figure 3-10), with pickups having the oldest average age followed by Auto, Van, and SUVs. Figure 3-11 shows a distribution of vehicles by age and type. New PHEV purchases would fall under the 0 to 2 year category, which is approximately 13% for Autos and 18.5% for Trucks and Vans. Although the overall average daily VMT is 32.73, it is important to look at the VMT distribution by vehicle age. Figure 3-12 shows that for new vehicles from 0 to 2 years old, the average annual miles is 14,892, almost twice the vehicles that were 10 or more years old. This pushes up the daily VMT to 40.8 miles, a 24.7% increase (Figure 3-13).
Vehicle Distribution by Vehicle Type
0
10
20
30
40
50
60
70
80
90
1977 1983 1990 1995 2001
NHTS Surveys
Perc
ent (
%) Auto
VanSUVPickup
Figure 3-9. Vehicle distribution by vehicle type per the National Household Travel Surveys conducted since 1969.
10
Average Vehicle Age by Vehicle Type
0
2
4
6
8
10
12
1977 1983 1990 1995 2001
NHTS Surveys
Year
s
AutoVanSUVPickup
Figure 3-10. Average vehicle age by vehicle type per the National Household Travel Surveys conducted since 1969.
Distribution of Vehicles by Vehicle Age and Type (2001 Survey)
0
5
10
15
20
25
30
35
40
45
0-2 3-5 6-9 10+
Vehicle Age (Years)
Perc
enta
ge (%
)
AutoTruck/VanAll
Figure 3-11. Distribution of vehicles by vehicle age and type from the 2001 National Household Travel Survey.
11
Avg. Annual Miles per Vehicle by Vehicle Age (2001 Survey)
14892
13230
11603
7863
0
2000
4000
6000
8000
10000
12000
14000
16000
0-2 3-5 6-9 10+
Vehicle Age (Years)
Mile
s
All
Figure 3-12. Average annual miles per vehicle by vehicle age from the 2001 National Household Travel Survey.
Daily VMT by Age (2001 Survey)
0.0
5.0
10.015.0
20.0
25.0
30.0
35.0
40.045.0
0-2 3-5 6-9 10+
Vehicle Age (Years)
Mile
s
All
Figure 3-13. Daily vehicle miles travelled by vehicle age from the 2001 National Household Travel Survey.
Based on this data, the conclusion is that 40 miles of charge-depleting range is necessary on an average PHEV if no infrastructure is available outside of the owner's primary residence. This envelops the age-weighted daily VMT defined in Section 3.1.3 of this report. If public charging infrastructure is available to allow PHEV charging outside of the owner's primary residence, the charge-depleting range
12
could be lowered to 13 miles, enveloping trip lengths determined in Section 3.1.2 of this report. Therefore, charging infrastructure in both residential and commercial settings should be considered because the availability of a rich charging infrastructure can reduce the onboard energy storage requirement (battery size) for PHEVs.
3.2 Actual Plug-In Hybrid Electric Vehicle Driving and Charging Trends
The effect of limited charging infrastructure can be seen in the charging trends for PHEVs operated by early adopters in a lean charge infrastructure environment. The Idaho National Laboratory (INL), as part of the Department of Energy Advanced Vehicle Testing Activity, collects data on PHEVs operating in a variety of applications. Data are available from INL for driving and charging trends of PHEVs operated by early adopters. Tables 3-1 and 3-2 and Figures 3-14 and 3-15 present data collected from nine Toyota Prius converted by HyMotion to PHEVs that operated in five different states during the months of January and February 2008, which was very early in the adoption cycle of PHEVs and prior to the development of a rich charging infrastructure to support PHEV charging. These vehicles are designed with a charge depleting range of approximately 30 miles.
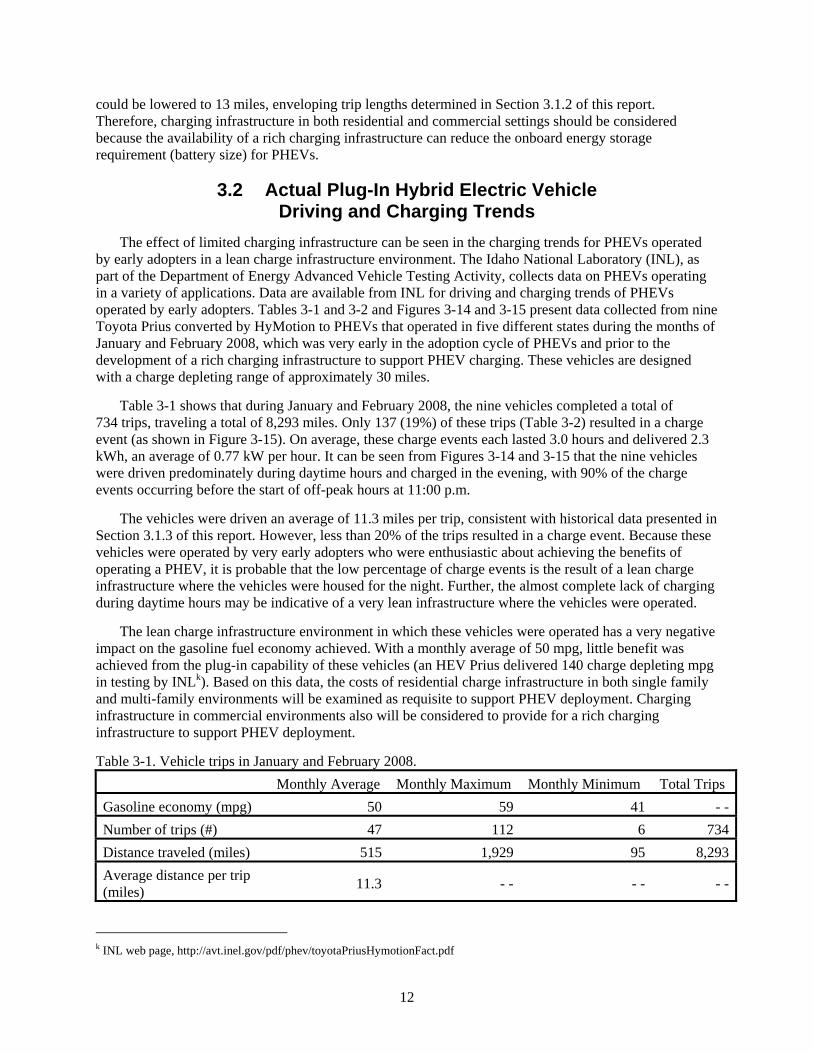
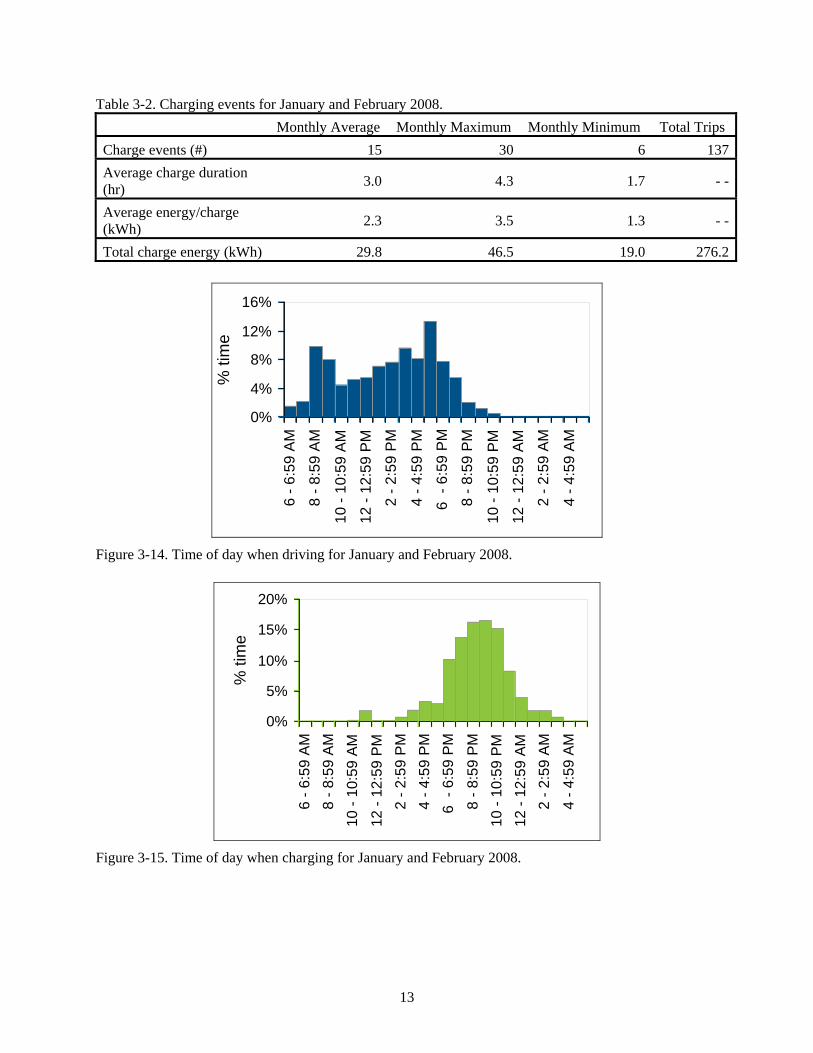
Table 3-1 shows that during January and February 2008, the nine vehicles completed a total of 734 trips, traveling a total of 8,293 miles. Only 137 (19%) of these trips (Table 3-2) resulted in a charge event (as shown in Figure 3-15). On average, these charge events each lasted 3.0 hours and delivered 2.3 kWh, an average of 0.77 kW per hour. It can be seen from Figures 3-14 and 3-15 that the nine vehicles were driven predominately during daytime hours and charged in the evening, with 90% of the charge events occurring before the start of off-peak hours at 11:00 p.m.
The vehicles were driven an average of 11.3 miles per trip, consistent with historical data presented in Section 3.1.3 of this report. However, less than 20% of the trips resulted in a charge event. Because these vehicles were operated by very early adopters who were enthusiastic about achieving the benefits of operating a PHEV, it is probable that the low percentage of charge events is the result of a lean charge infrastructure where the vehicles were housed for the night. Further, the almost complete lack of charging during daytime hours may be indicative of a very lean infrastructure where the vehicles were operated.
The lean charge infrastructure environment in which these vehicles were operated has a very negative impact on the gasoline fuel economy achieved. With a monthly average of 50 mpg, little benefit was achieved from the plug-in capability of these vehicles (an HEV Prius delivered 140 charge depleting mpg in testing by INLk). Based on this data, the costs of residential charge infrastructure in both single family and multi-family environments will be examined as requisite to support PHEV deployment. Charging infrastructure in commercial environments also will be considered to provide for a rich charging infrastructure to support PHEV deployment.
Table 3-1. Vehicle trips in January and February 2008. Monthly Average Monthly Maximum Monthly Minimum Total Trips Gasoline economy (mpg) 50 59 41 - -Number of trips (#) 47 112 6 734Distance traveled (miles) 515 1,929 95 8,293Average distance per trip (miles) 11.3 - - - - - -
k INL web page, http://avt.inel.gov/pdf/phev/toyotaPriusHymotionFact.pdf
13
Table 3-2. Charging events for January and February 2008. Monthly Average Monthly Maximum Monthly Minimum Total Trips Charge events (#) 15 30 6 137Average charge duration (hr) 3.0 4.3 1.7 - -
Average energy/charge (kWh) 2.3 3.5 1.3 - -
Total charge energy (kWh) 29.8 46.5 19.0 276.2
0%
4%
8%
12%
16%6
- 6:5
9 A
M
8 - 8
:59
AM
10 -
10:5
9 A
M
12 -
12:5
9 P
M
2 - 2
:59
PM
4 - 4
:59
PM
6 -
6:59
PM
8 - 8
:59
PM
10 -
10:5
9 P
M
12 -
12:5
9 A
M
2 - 2
:59
AM
4 - 4
:59
AM
% ti
me
Figure 3-14. Time of day when driving for January and February 2008.
0%
5%
10%
15%
20%
6 - 6
:59
AM
8 - 8
:59
AM
10 -
10:5
9 A
M
12 -
12:5
9 P
M2
- 2:5
9 P
M4
- 4:5
9 P
M6
- 6:
59 P
M
8 - 8
:59
PM
10 -
10:5
9 P
M12
- 12
:59
AM
2 - 2
:59
AM
4 - 4
:59
AM
% ti
me
Figure 3-15. Time of day when charging for January and February 2008.
14
4. PLUG-IN HYBRID ELECTRIC VEHICLE CHARGING PARAMETERS Understanding PHEV battery charging parameters is necessary to determine the infrastructure power
and energy requirements for PHEVs. The following tasks were conducted to obtain typical charge characteristics for PHEVs:
1. Determined recommended charge methods provided by battery manufacturers
2. Collected charge data on PHEVs operating in the Advanced Vehicle Testing Activity baseline test program.
Recommended charge methods for three lithium-based battery companies were obtained. All of the companies recommend a constant current, constant voltage charge algorithm. With this method, the bulk of the energy is charged at a constant current. The charge is finished by tapering current at a constant voltage to a cut-off current. The finishing charge varies among manufacturers, but each recommend a specific cut-off current where the cell should be at 100% state-of-charge (SOC). One manufacturer recommended stopping 30 minutes after beginning the constant voltage phase regardless of whether the cell had reached the cut-off current.
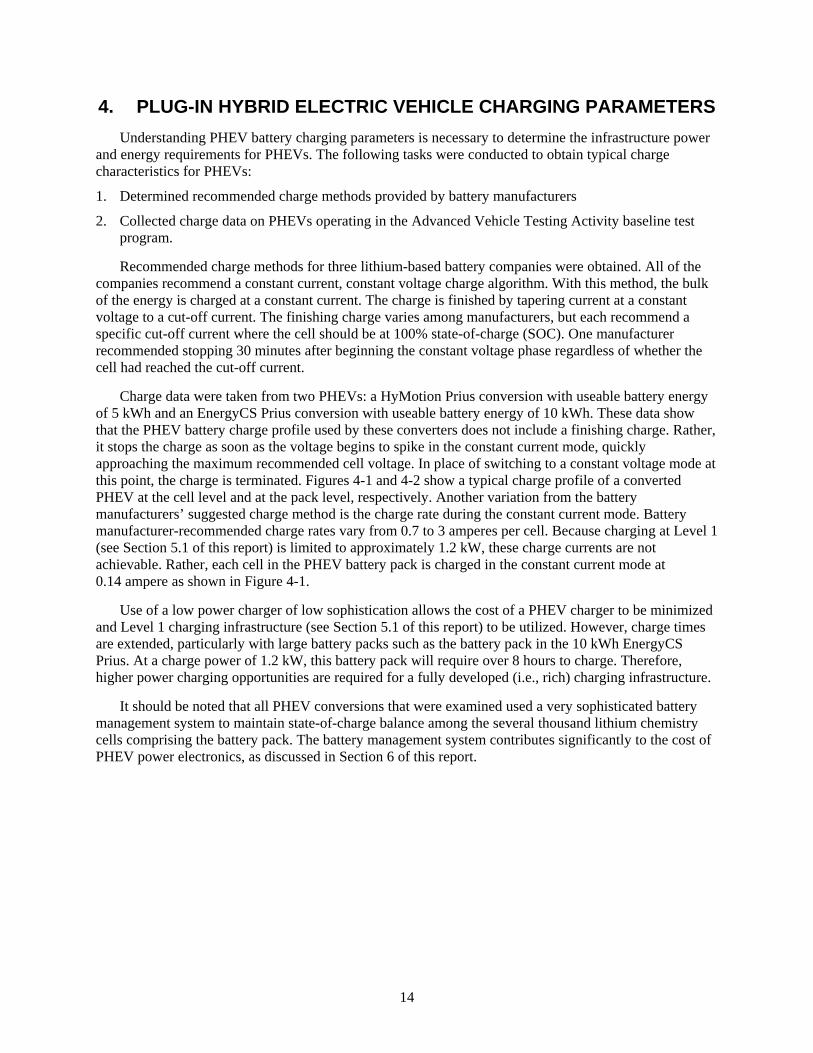
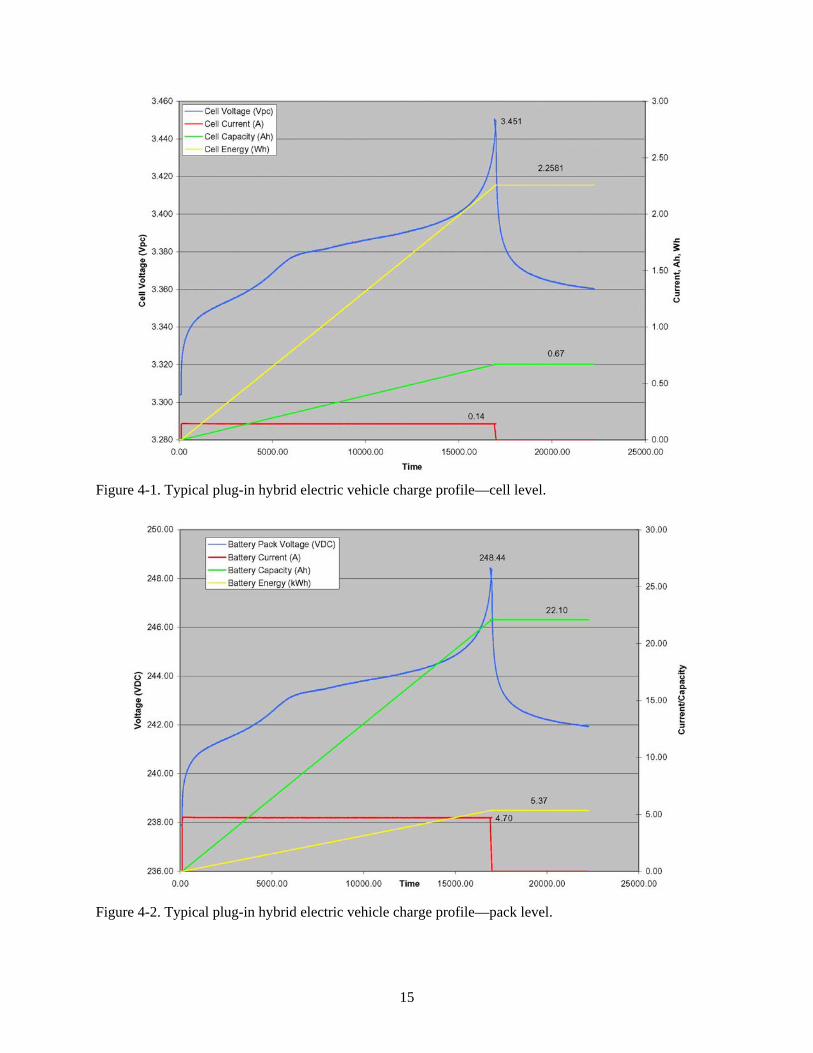
Charge data were taken from two PHEVs: a HyMotion Prius conversion with useable battery energy of 5 kWh and an EnergyCS Prius conversion with useable battery energy of 10 kWh. These data show that the PHEV battery charge profile used by these converters does not include a finishing charge. Rather, it stops the charge as soon as the voltage begins to spike in the constant current mode, quickly approaching the maximum recommended cell voltage. In place of switching to a constant voltage mode at this point, the charge is terminated. Figures 4-1 and 4-2 show a typical charge profile of a converted PHEV at the cell level and at the pack level, respectively. Another variation from the battery manufacturers’ suggested charge method is the charge rate during the constant current mode. Battery manufacturer-recommended charge rates vary from 0.7 to 3 amperes per cell. Because charging at Level 1 (see Section 5.1 of this report) is limited to approximately 1.2 kW, these charge currents are not achievable. Rather, each cell in the PHEV battery pack is charged in the constant current mode at 0.14 ampere as shown in Figure 4-1.
Use of a low power charger of low sophistication allows the cost of a PHEV charger to be minimized and Level 1 charging infrastructure (see Section 5.1 of this report) to be utilized. However, charge times are extended, particularly with large battery packs such as the battery pack in the 10 kWh EnergyCS Prius. At a charge power of 1.2 kW, this battery pack will require over 8 hours to charge. Therefore, higher power charging opportunities are required for a fully developed (i.e., rich) charging infrastructure.
It should be noted that all PHEV conversions that were examined used a very sophisticated battery management system to maintain state-of-charge balance among the several thousand lithium chemistry cells comprising the battery pack. The battery management system contributes significantly to the cost of PHEV power electronics, as discussed in Section 6 of this report.
15
Figure 4-1. Typical plug-in hybrid electric vehicle charge profile—cell level.
Figure 4-2. Typical plug-in hybrid electric vehicle charge profile—pack level.
16
5. INFRASTRUCTURE COST ANALYSIS
5.1 Background In 1991, the Infrastructure Working Council was formed by the Electric Power Research Institute
with the objective of bringing together stakeholders in the electric vehicle industry to establish consensus items regarding the methods and requirements of electric vehicle charging. Stakeholders represented auto companies, electric power companies, component suppliers, equipment manufacturers, and standards and national testing organizations.
Three charging levels were defined by the Electric Power Research Institute and codified in the National Electric Code (NEC) (see Section 5.2 of this report), along with corresponding functionality requirements and safety systems. The Electric Power Research Institute published a document in 1994 that describes the consensus items of the Infrastructure Working Council.l The three basic charge levels are explained in the following subsections.
5.1.1 Level 1
The Level 1 method uses a standard 120 VAC, 15 amp (12 amp useablem) or 20 amp (16 amp useable) branch circuit that is the lowest common voltage level found in both residential and commercial buildings in the United States. Because Level 1 only provides a small amount of power (maximum of 1.44 kW) and can result in prolonged charge times, it was only intended to be an entry level voltage during the introduction of battery electric vehicles and not the ultimate charging solution. The ability to charge at Level 1 was seen as important due to the availability of 120 VAC outlets in an emergency situation, even if it meant waiting several hours to obtain a charge.
When using Level 1 charging, a new, dedicated circuit is recommended because existing 120 VAC branch circuits typically include multiple outlets served by a single circuit breaker that provides overload protection. This can result in other appliances or more than one electric vehicle using the same branch circuit, often resulting in the circuit breaker tripping from an overload condition.
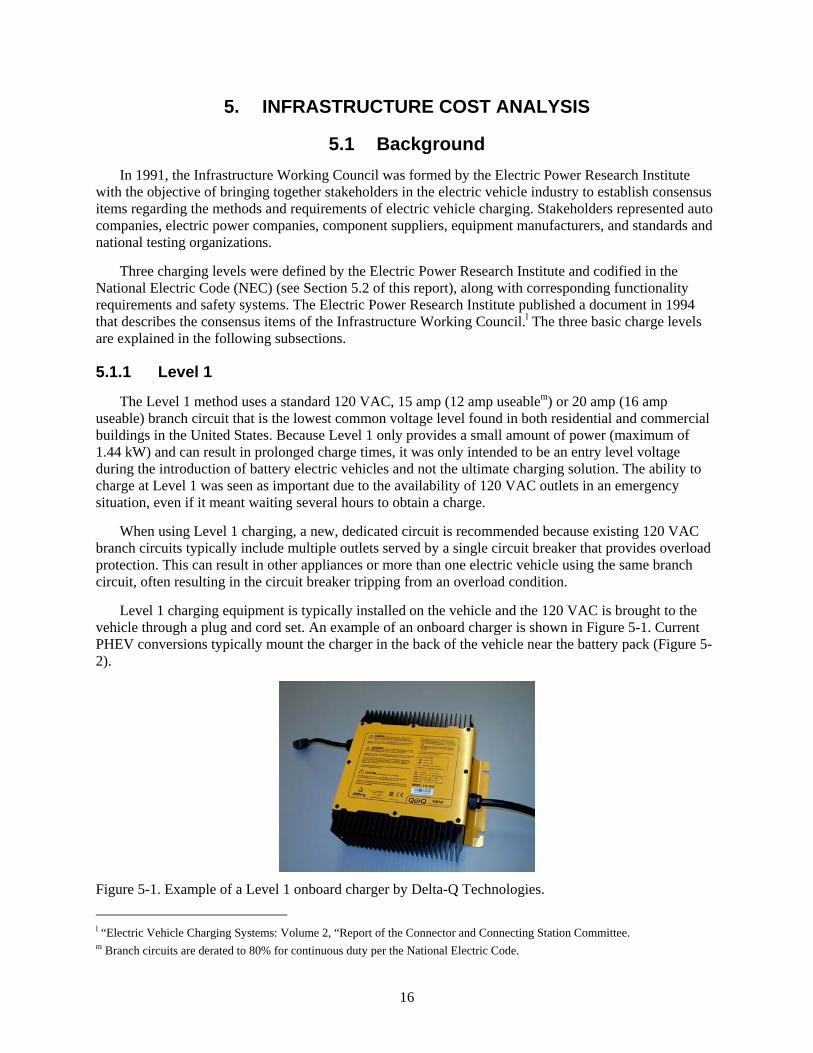
Level 1 charging equipment is typically installed on the vehicle and the 120 VAC is brought to the vehicle through a plug and cord set. An example of an onboard charger is shown in Figure 5-1. Current PHEV conversions typically mount the charger in the back of the vehicle near the battery pack (Figure 5-2).
Figure 5-1. Example of a Level 1 onboard charger by Delta-Q Technologies.
l “Electric Vehicle Charging Systems: Volume 2, “Report of the Connector and Connecting Station Committee. m Branch circuits are derated to 80% for continuous duty per the National Electric Code.
17
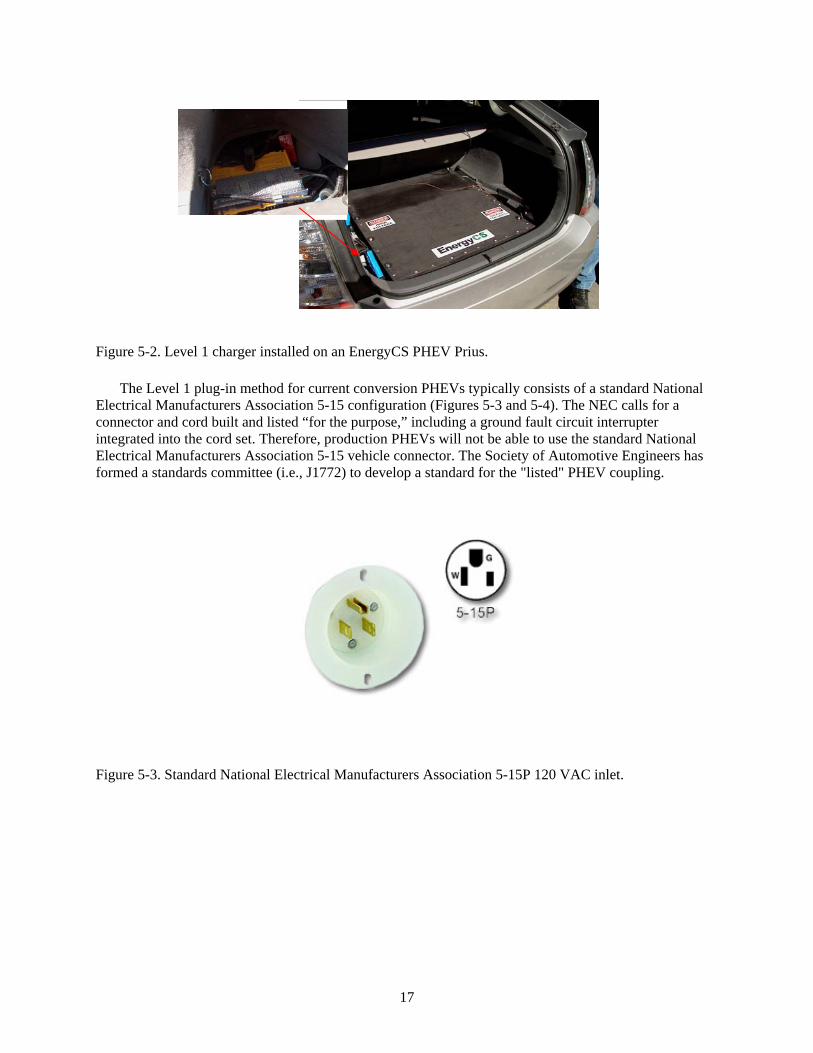
Figure 5-2. Level 1 charger installed on an EnergyCS PHEV Prius.
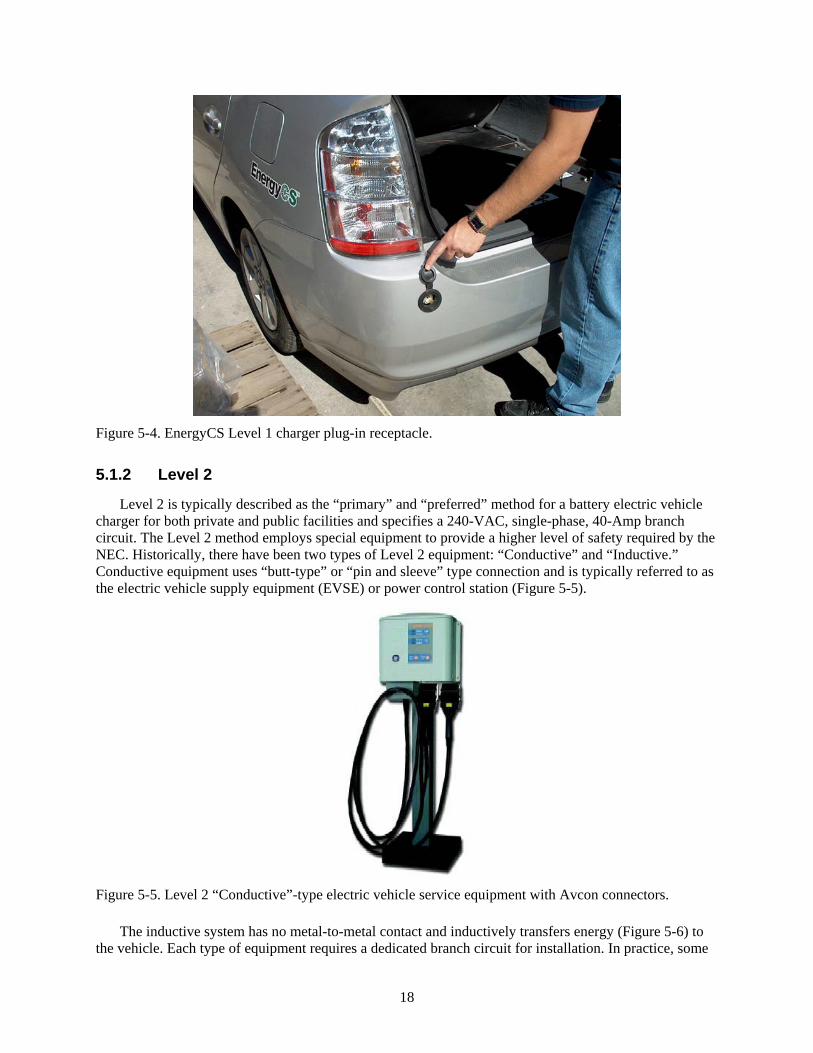
The Level 1 plug-in method for current conversion PHEVs typically consists of a standard National Electrical Manufacturers Association 5-15 configuration (Figures 5-3 and 5-4). The NEC calls for a connector and cord built and listed “for the purpose,” including a ground fault circuit interrupter integrated into the cord set. Therefore, production PHEVs will not be able to use the standard National Electrical Manufacturers Association 5-15 vehicle connector. The Society of Automotive Engineers has formed a standards committee (i.e., J1772) to develop a standard for the "listed" PHEV coupling.
Figure 5-3. Standard National Electrical Manufacturers Association 5-15P 120 VAC inlet.
18
Figure 5-4. EnergyCS Level 1 charger plug-in receptacle.
5.1.2 Level 2
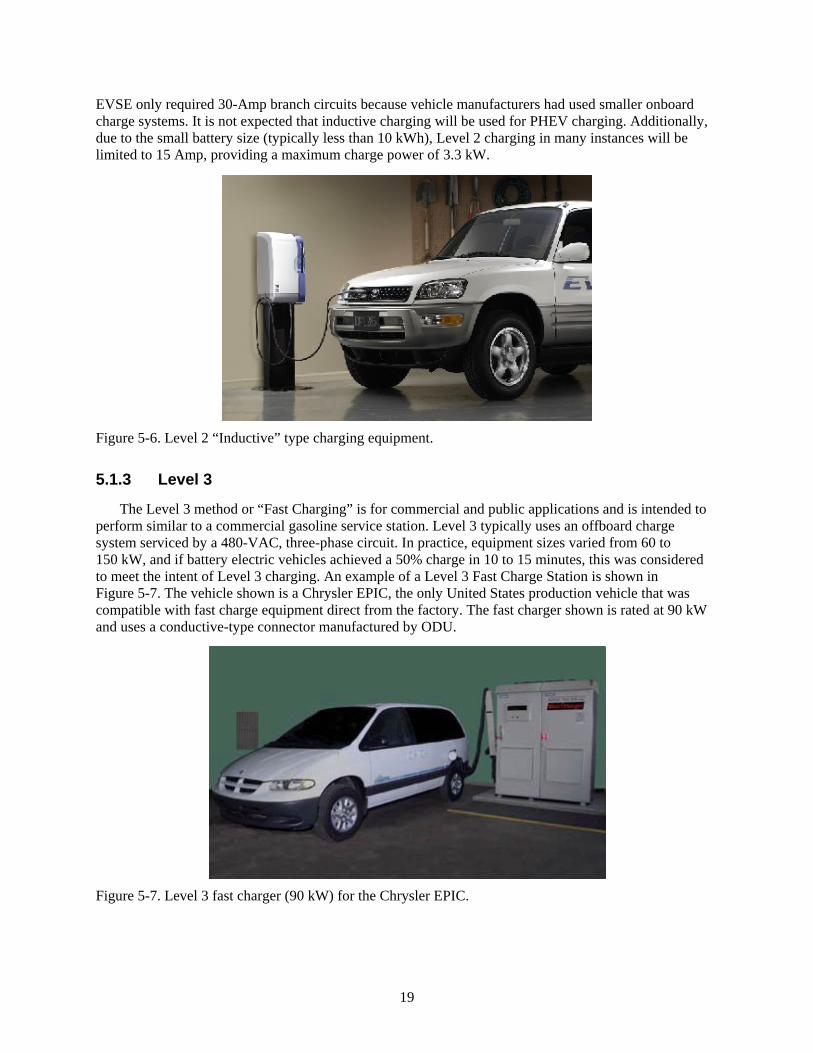
Level 2 is typically described as the “primary” and “preferred” method for a battery electric vehicle charger for both private and public facilities and specifies a 240-VAC, single-phase, 40-Amp branch circuit. The Level 2 method employs special equipment to provide a higher level of safety required by the NEC. Historically, there have been two types of Level 2 equipment: “Conductive” and “Inductive.” Conductive equipment uses “butt-type” or “pin and sleeve” type connection and is typically referred to as the electric vehicle supply equipment (EVSE) or power control station (Figure 5-5).
Figure 5-5. Level 2 “Conductive”-type electric vehicle service equipment with Avcon connectors.
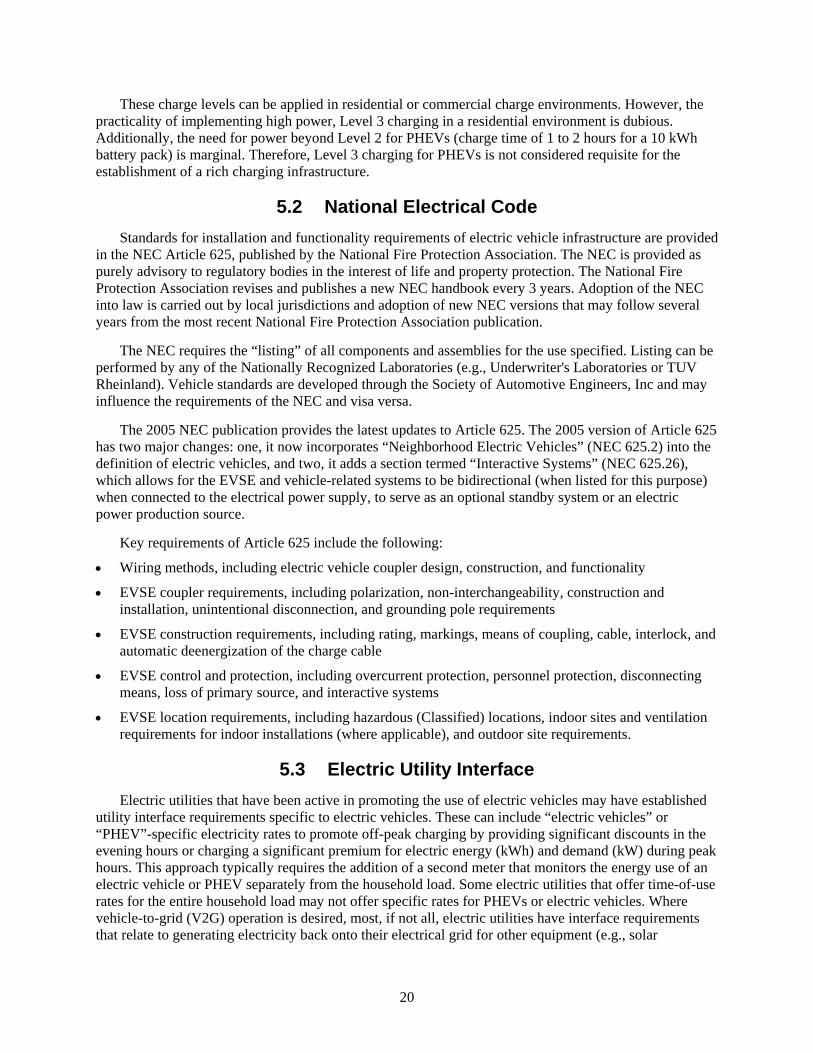
The inductive system has no metal-to-metal contact and inductively transfers energy (Figure 5-6) to the vehicle. Each type of equipment requires a dedicated branch circuit for installation. In practice, some
19
EVSE only required 30-Amp branch circuits because vehicle manufacturers had used smaller onboard charge systems. It is not expected that inductive charging will be used for PHEV charging. Additionally, due to the small battery size (typically less than 10 kWh), Level 2 charging in many instances will be limited to 15 Amp, providing a maximum charge power of 3.3 kW.
Figure 5-6. Level 2 “Inductive” type charging equipment.
5.1.3 Level 3
The Level 3 method or “Fast Charging” is for commercial and public applications and is intended to perform similar to a commercial gasoline service station. Level 3 typically uses an offboard charge system serviced by a 480-VAC, three-phase circuit. In practice, equipment sizes varied from 60 to 150 kW, and if battery electric vehicles achieved a 50% charge in 10 to 15 minutes, this was considered to meet the intent of Level 3 charging. An example of a Level 3 Fast Charge Station is shown in Figure 5-7. The vehicle shown is a Chrysler EPIC, the only United States production vehicle that was compatible with fast charge equipment direct from the factory. The fast charger shown is rated at 90 kW and uses a conductive-type connector manufactured by ODU.
Figure 5-7. Level 3 fast charger (90 kW) for the Chrysler EPIC.
20
These charge levels can be applied in residential or commercial charge environments. However, the practicality of implementing high power, Level 3 charging in a residential environment is dubious. Additionally, the need for power beyond Level 2 for PHEVs (charge time of 1 to 2 hours for a 10 kWh battery pack) is marginal. Therefore, Level 3 charging for PHEVs is not considered requisite for the establishment of a rich charging infrastructure.
5.2 National Electrical Code Standards for installation and functionality requirements of electric vehicle infrastructure are provided
in the NEC Article 625, published by the National Fire Protection Association. The NEC is provided as purely advisory to regulatory bodies in the interest of life and property protection. The National Fire Protection Association revises and publishes a new NEC handbook every 3 years. Adoption of the NEC into law is carried out by local jurisdictions and adoption of new NEC versions that may follow several years from the most recent National Fire Protection Association publication.
The NEC requires the “listing” of all components and assemblies for the use specified. Listing can be performed by any of the Nationally Recognized Laboratories (e.g., Underwriter's Laboratories or TUV Rheinland). Vehicle standards are developed through the Society of Automotive Engineers, Inc and may influence the requirements of the NEC and visa versa.
The 2005 NEC publication provides the latest updates to Article 625. The 2005 version of Article 625 has two major changes: one, it now incorporates “Neighborhood Electric Vehicles” (NEC 625.2) into the definition of electric vehicles, and two, it adds a section termed “Interactive Systems” (NEC 625.26), which allows for the EVSE and vehicle-related systems to be bidirectional (when listed for this purpose) when connected to the electrical power supply, to serve as an optional standby system or an electric power production source.
Key requirements of Article 625 include the following:
• Wiring methods, including electric vehicle coupler design, construction, and functionality
• EVSE coupler requirements, including polarization, non-interchangeability, construction and installation, unintentional disconnection, and grounding pole requirements
• EVSE construction requirements, including rating, markings, means of coupling, cable, interlock, and automatic deenergization of the charge cable
• EVSE control and protection, including overcurrent protection, personnel protection, disconnecting means, loss of primary source, and interactive systems
• EVSE location requirements, including hazardous (Classified) locations, indoor sites and ventilation requirements for indoor installations (where applicable), and outdoor site requirements.
5.3 Electric Utility Interface Electric utilities that have been active in promoting the use of electric vehicles may have established
utility interface requirements specific to electric vehicles. These can include “electric vehicles” or “PHEV”-specific electricity rates to promote off-peak charging by providing significant discounts in the evening hours or charging a significant premium for electric energy (kWh) and demand (kW) during peak hours. This approach typically requires the addition of a second meter that monitors the energy use of an electric vehicle or PHEV separately from the household load. Some electric utilities that offer time-of-use rates for the entire household load may not offer specific rates for PHEVs or electric vehicles. Where vehicle-to-grid (V2G) operation is desired, most, if not all, electric utilities have interface requirements that relate to generating electricity back onto their electrical grid for other equipment (e.g., solar
21
photovoltaic systems or other co-generation equipment). These same requirements would likely apply to PHEV V2G operation. Utility interface requirements will likely not be a requirement for early adoption of PHEVs, due to the low power and energy requirements for PHEVs. Therefore, no impact on PHEV infrastructure costs is expected.
5.4 Commercial Charging Infrastructure Charging infrastructure deployed in commercial environments must conform to codes and practices
not applicable to residential infrastructure. These requirements add to the cost of charging infrastructure and will be considered in this analysis.
5.4.1 Americans with Disabilities Act Requirements
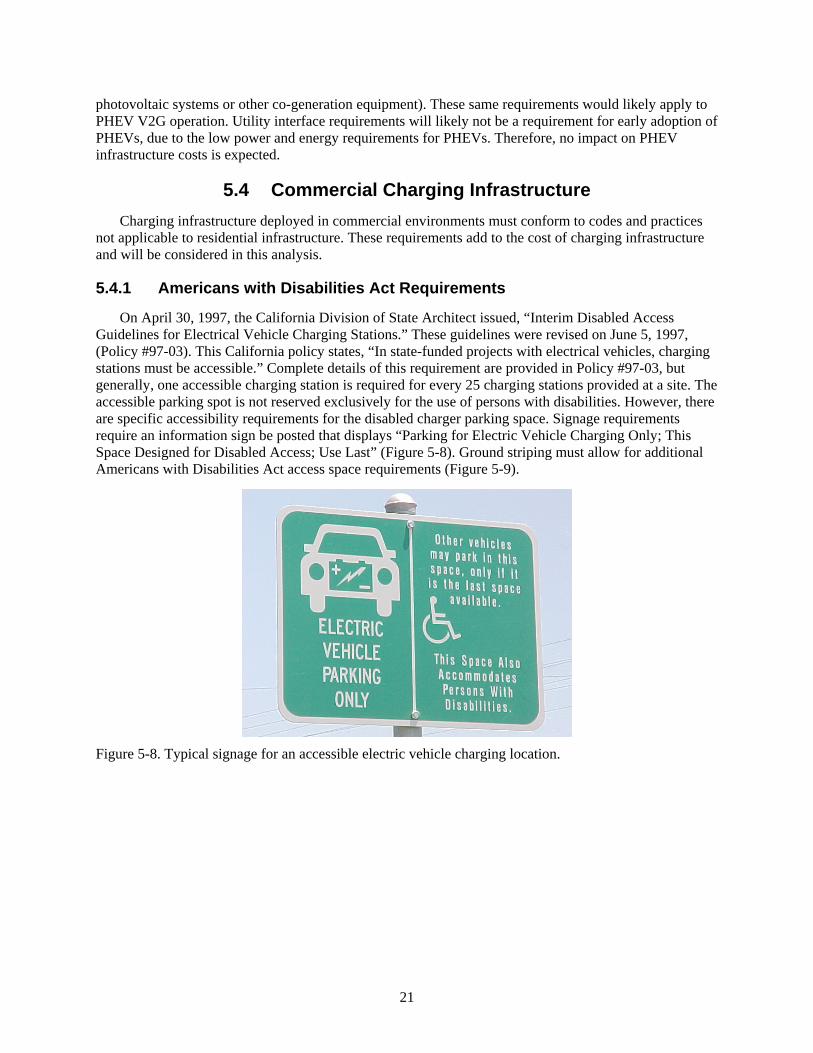
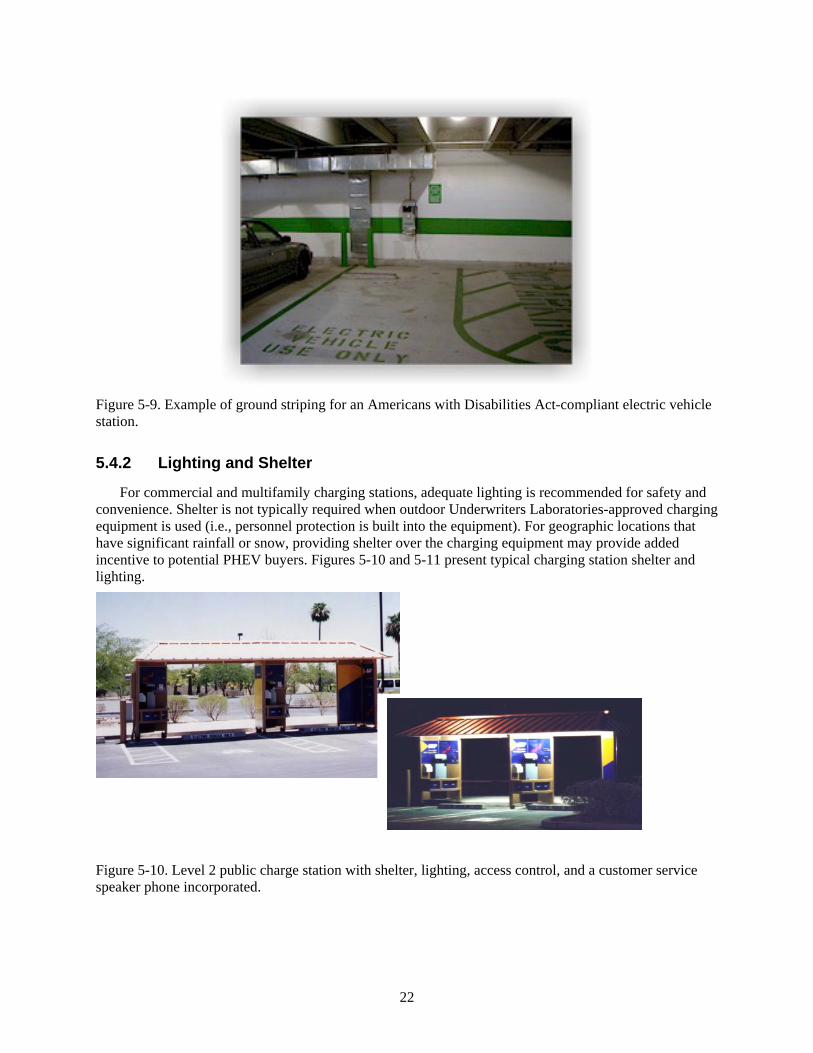
On April 30, 1997, the California Division of State Architect issued, “Interim Disabled Access Guidelines for Electrical Vehicle Charging Stations.” These guidelines were revised on June 5, 1997, (Policy #97-03). This California policy states, “In state-funded projects with electrical vehicles, charging stations must be accessible.” Complete details of this requirement are provided in Policy #97-03, but generally, one accessible charging station is required for every 25 charging stations provided at a site. The accessible parking spot is not reserved exclusively for the use of persons with disabilities. However, there are specific accessibility requirements for the disabled charger parking space. Signage requirements require an information sign be posted that displays “Parking for Electric Vehicle Charging Only; This Space Designed for Disabled Access; Use Last” (Figure 5-8). Ground striping must allow for additional Americans with Disabilities Act access space requirements (Figure 5-9).
Figure 5-8. Typical signage for an accessible electric vehicle charging location.
22
Figure 5-9. Example of ground striping for an Americans with Disabilities Act-compliant electric vehicle station.
5.4.2 Lighting and Shelter
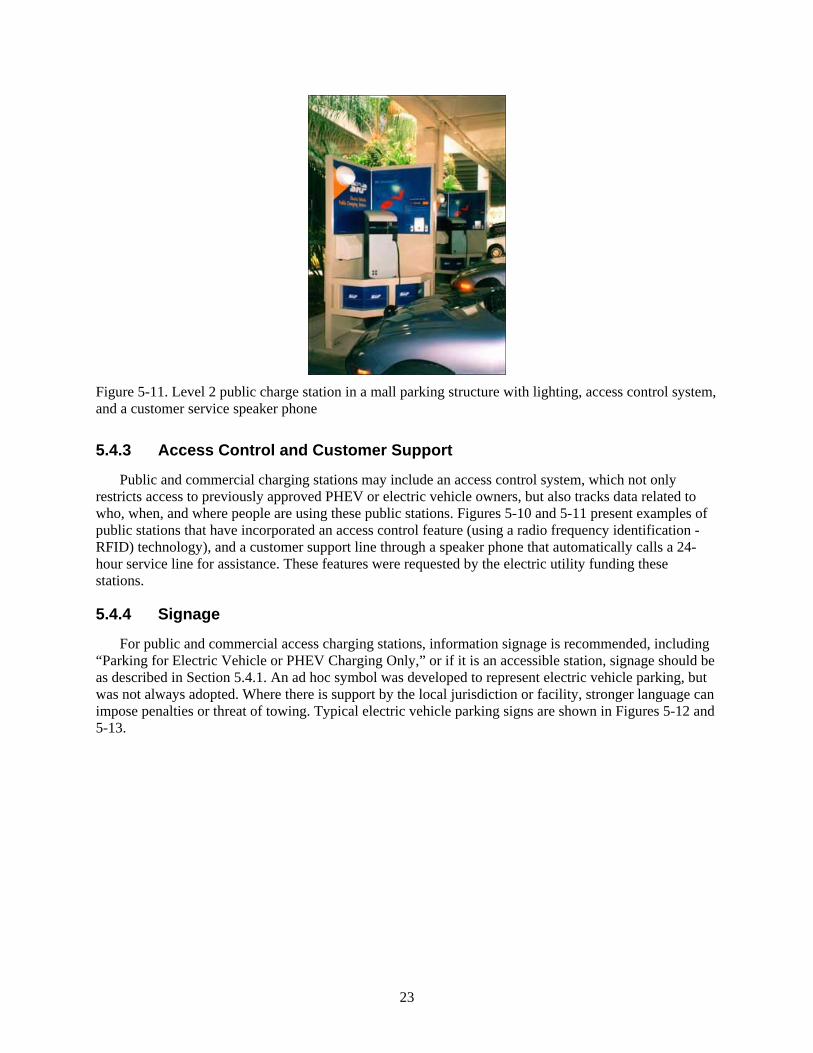
For commercial and multifamily charging stations, adequate lighting is recommended for safety and convenience. Shelter is not typically required when outdoor Underwriters Laboratories-approved charging equipment is used (i.e., personnel protection is built into the equipment). For geographic locations that have significant rainfall or snow, providing shelter over the charging equipment may provide added incentive to potential PHEV buyers. Figures 5-10 and 5-11 present typical charging station shelter and lighting.
Figure 5-10. Level 2 public charge station with shelter, lighting, access control, and a customer service speaker phone incorporated.
23
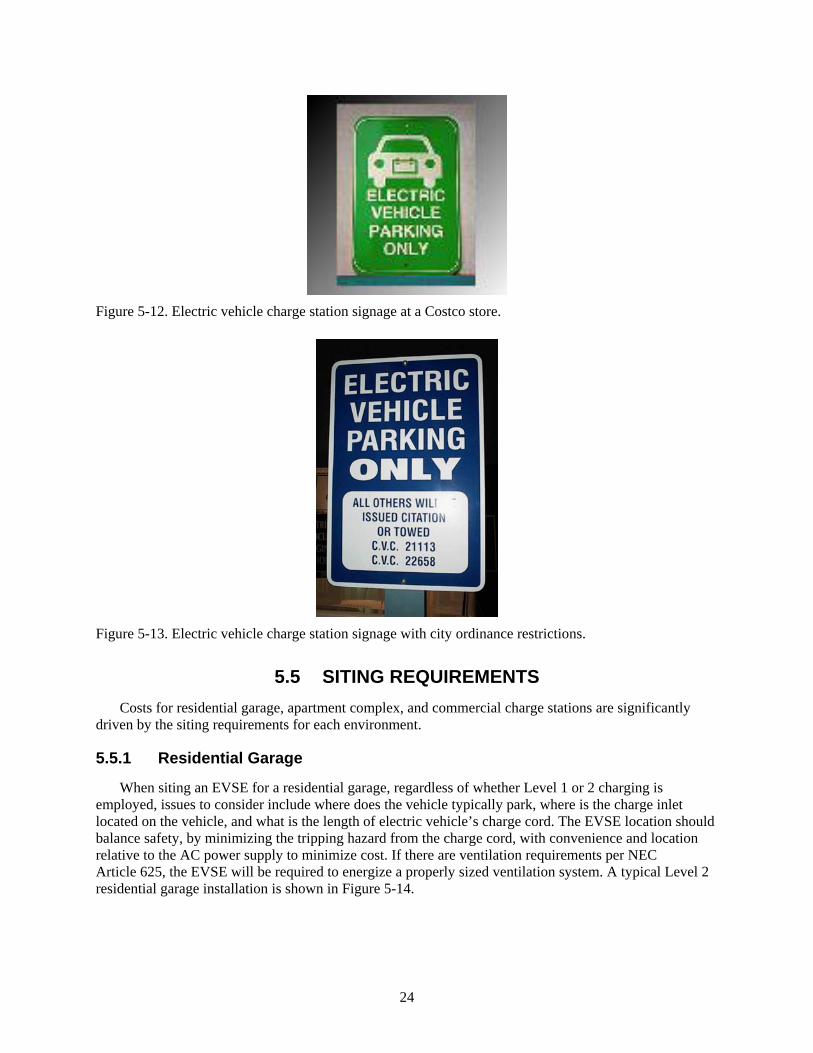
Figure 5-11. Level 2 public charge station in a mall parking structure with lighting, access control system, and a customer service speaker phone
5.4.3 Access Control and Customer Support
Public and commercial charging stations may include an access control system, which not only restricts access to previously approved PHEV or electric vehicle owners, but also tracks data related to who, when, and where people are using these public stations. Figures 5-10 and 5-11 present examples of public stations that have incorporated an access control feature (using a radio frequency identification - RFID) technology), and a customer support line through a speaker phone that automatically calls a 24-hour service line for assistance. These features were requested by the electric utility funding these stations.
5.4.4 Signage
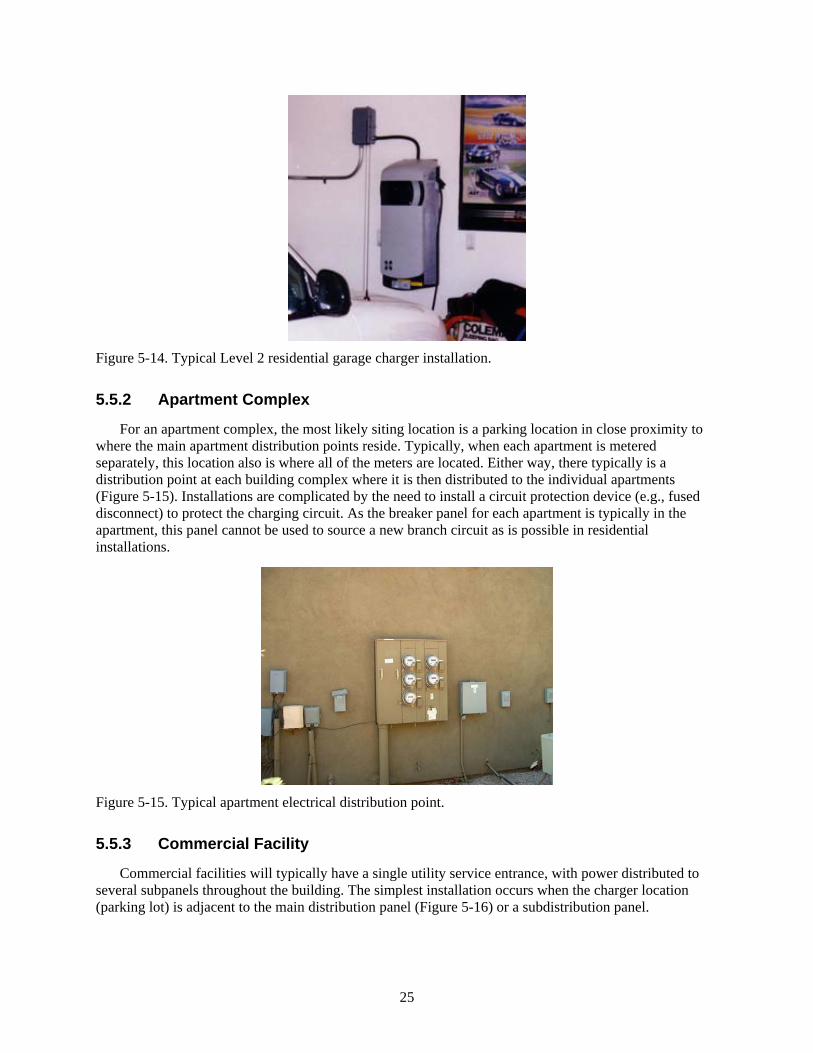
For public and commercial access charging stations, information signage is recommended, including “Parking for Electric Vehicle or PHEV Charging Only,” or if it is an accessible station, signage should be as described in Section 5.4.1. An ad hoc symbol was developed to represent electric vehicle parking, but was not always adopted. Where there is support by the local jurisdiction or facility, stronger language can impose penalties or threat of towing. Typical electric vehicle parking signs are shown in Figures 5-12 and 5-13.
24
Figure 5-12. Electric vehicle charge station signage at a Costco store.
Figure 5-13. Electric vehicle charge station signage with city ordinance restrictions.
5.5 SITING REQUIREMENTS Costs for residential garage, apartment complex, and commercial charge stations are significantly
driven by the siting requirements for each environment.
5.5.1 Residential Garage
When siting an EVSE for a residential garage, regardless of whether Level 1 or 2 charging is employed, issues to consider include where does the vehicle typically park, where is the charge inlet located on the vehicle, and what is the length of electric vehicle’s charge cord. The EVSE location should balance safety, by minimizing the tripping hazard from the charge cord, with convenience and location relative to the AC power supply to minimize cost. If there are ventilation requirements per NEC Article 625, the EVSE will be required to energize a properly sized ventilation system. A typical Level 2 residential garage installation is shown in Figure 5-14.
25
Figure 5-14. Typical Level 2 residential garage charger installation.
5.5.2 Apartment Complex
For an apartment complex, the most likely siting location is a parking location in close proximity to where the main apartment distribution points reside. Typically, when each apartment is metered separately, this location also is where all of the meters are located. Either way, there typically is a distribution point at each building complex where it is then distributed to the individual apartments (Figure 5-15). Installations are complicated by the need to install a circuit protection device (e.g., fused disconnect) to protect the charging circuit. As the breaker panel for each apartment is typically in the apartment, this panel cannot be used to source a new branch circuit as is possible in residential installations.
Figure 5-15. Typical apartment electrical distribution point.
5.5.3 Commercial Facility
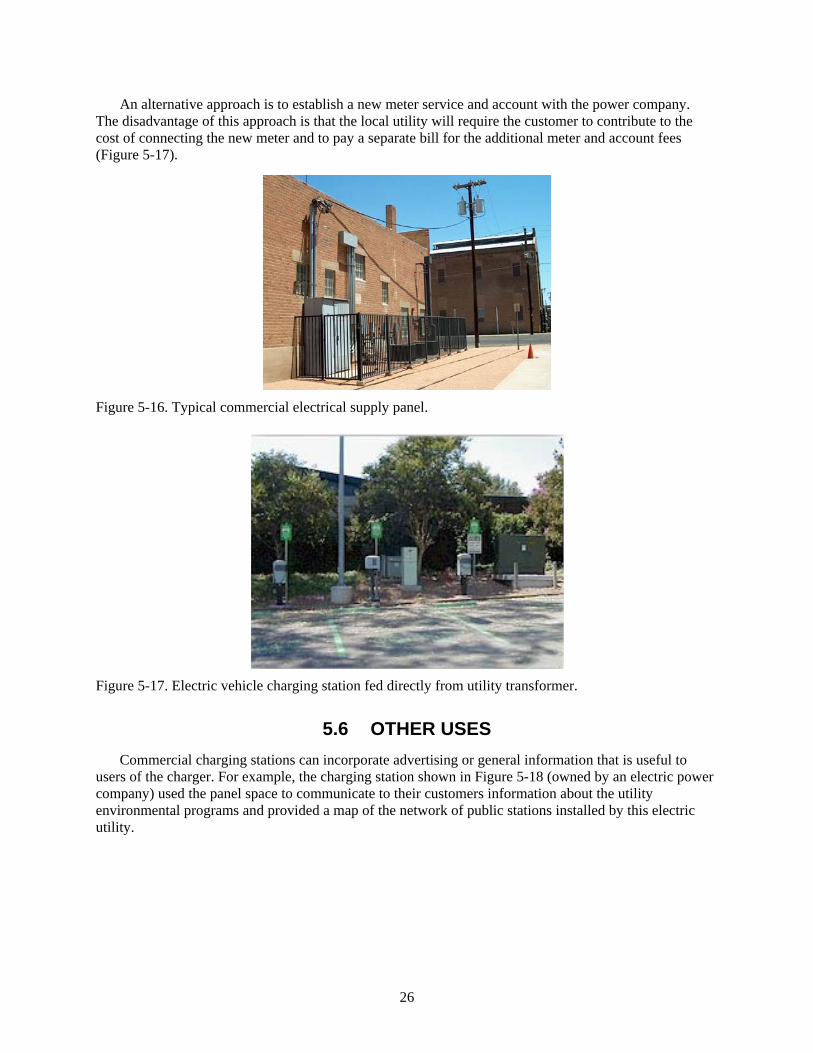
Commercial facilities will typically have a single utility service entrance, with power distributed to several subpanels throughout the building. The simplest installation occurs when the charger location (parking lot) is adjacent to the main distribution panel (Figure 5-16) or a subdistribution panel.
26
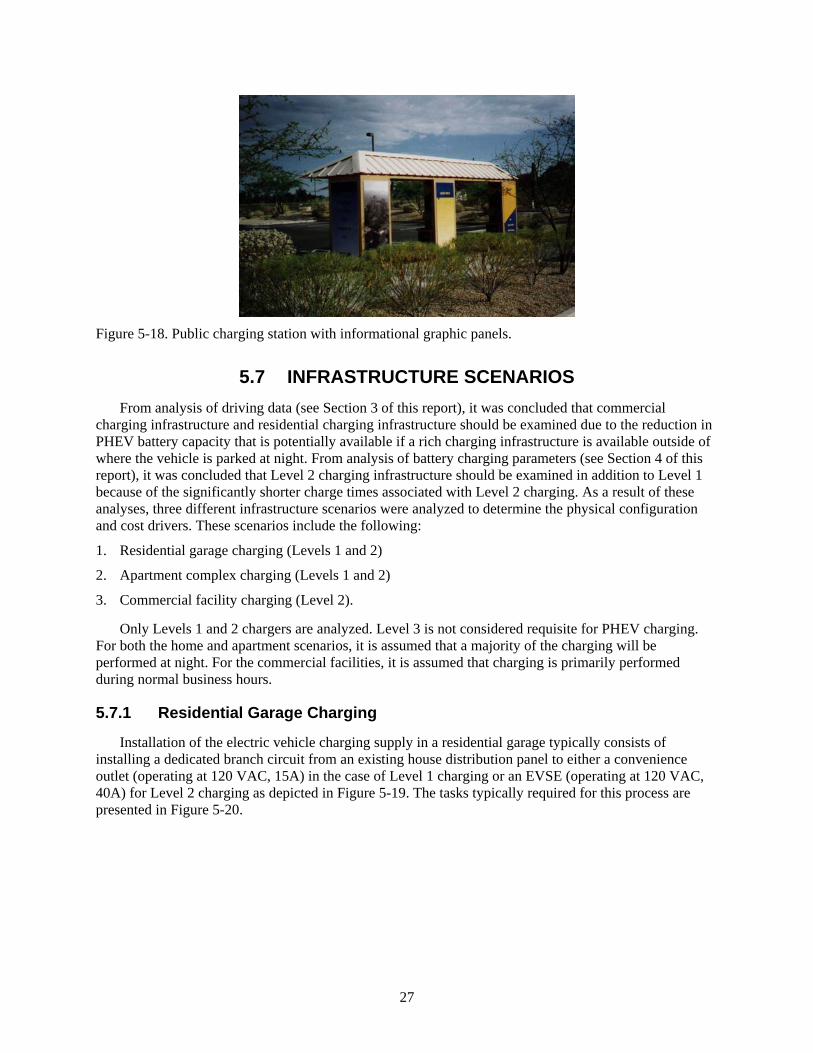
An alternative approach is to establish a new meter service and account with the power company. The disadvantage of this approach is that the local utility will require the customer to contribute to the cost of connecting the new meter and to pay a separate bill for the additional meter and account fees (Figure 5-17).
Figure 5-16. Typical commercial electrical supply panel.
Figure 5-17. Electric vehicle charging station fed directly from utility transformer.
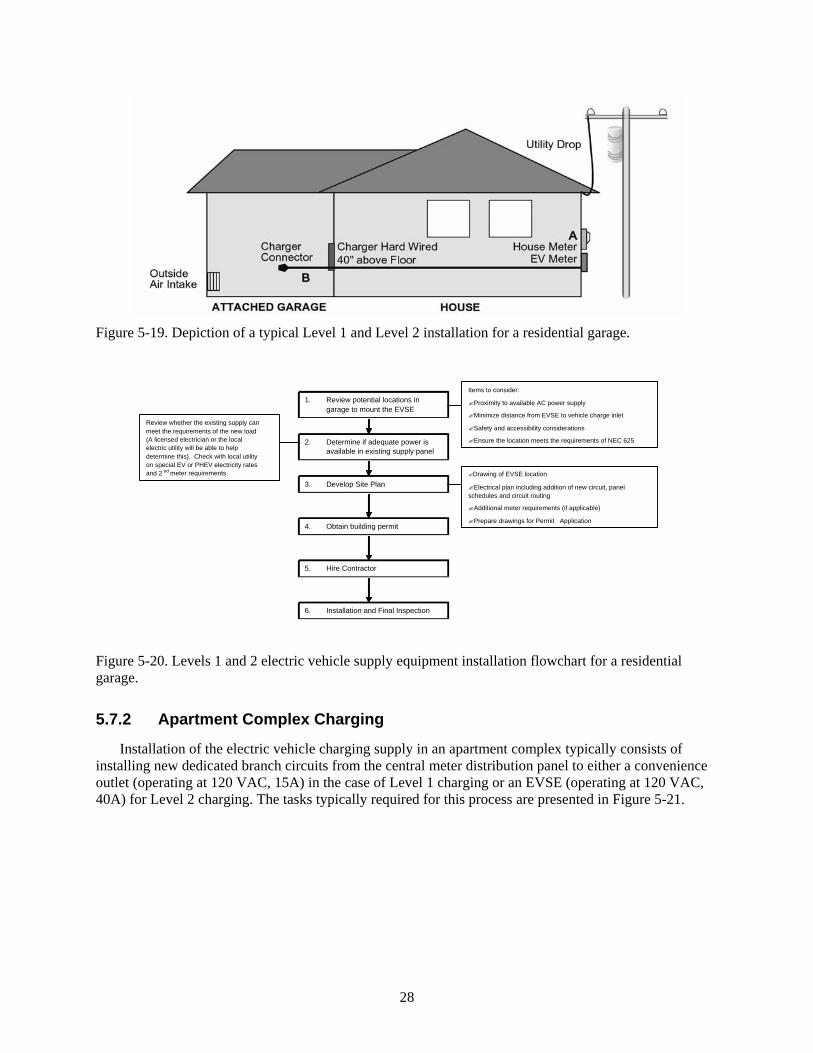
5.6 OTHER USES Commercial charging stations can incorporate advertising or general information that is useful to
users of the charger. For example, the charging station shown in Figure 5-18 (owned by an electric power company) used the panel space to communicate to their customers information about the utility environmental programs and provided a map of the network of public stations installed by this electric utility.
27
Figure 5-18. Public charging station with informational graphic panels.
5.7 INFRASTRUCTURE SCENARIOS From analysis of driving data (see Section 3 of this report), it was concluded that commercial
charging infrastructure and residential charging infrastructure should be examined due to the reduction in PHEV battery capacity that is potentially available if a rich charging infrastructure is available outside of where the vehicle is parked at night. From analysis of battery charging parameters (see Section 4 of this report), it was concluded that Level 2 charging infrastructure should be examined in addition to Level 1 because of the significantly shorter charge times associated with Level 2 charging. As a result of these analyses, three different infrastructure scenarios were analyzed to determine the physical configuration and cost drivers. These scenarios include the following:
1. Residential garage charging (Levels 1 and 2)
2. Apartment complex charging (Levels 1 and 2)
3. Commercial facility charging (Level 2).
Only Levels 1 and 2 chargers are analyzed. Level 3 is not considered requisite for PHEV charging. For both the home and apartment scenarios, it is assumed that a majority of the charging will be performed at night. For the commercial facilities, it is assumed that charging is primarily performed during normal business hours.
5.7.1 Residential Garage Charging
Installation of the electric vehicle charging supply in a residential garage typically consists of installing a dedicated branch circuit from an existing house distribution panel to either a convenience outlet (operating at 120 VAC, 15A) in the case of Level 1 charging or an EVSE (operating at 120 VAC, 40A) for Level 2 charging as depicted in Figure 5-19. The tasks typically required for this process are presented in Figure 5-20.
28
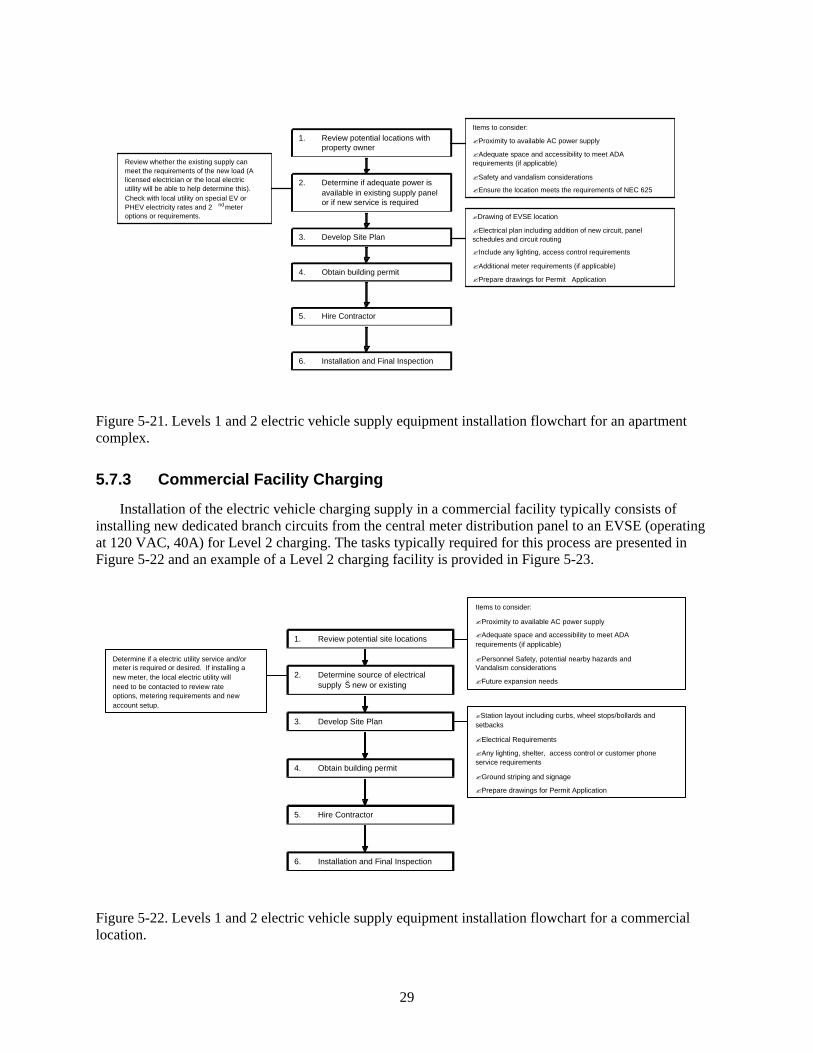
Figure 5-19. Depiction of a typical Level 1 and Level 2 installation for a residential garage.
1. Review potential locations in garage to mount the EVSE
Items to consider:
Proximity to available AC power supply
Minimize distance from EVSE to vehicle charge inlet
Safety and accessibility considerations
Ensure the location meets the requirements of NEC 6252. Determine if adequate power is available in existing supply panel
6. Installation and Final Inspection
3. Develop Site Plan
4. Obtain building permit
5. Hire Contractor
Review whether the existing supply can meet the requirements of the new load (A licensed electrician or the local electric utility will be able to help determine this). Check with local utility on special EV or PHEV electricity rates and 2 nd meter requirements. Drawing of EVSE location
Electrical plan including addition of new circuit, panel schedules and circuit routing
Additional meter requirements (if applicable)
Prepare drawings for Permit Application
Figure 5-20. Levels 1 and 2 electric vehicle supply equipment installation flowchart for a residential garage.
5.7.2 Apartment Complex Charging
Installation of the electric vehicle charging supply in an apartment complex typically consists of installing new dedicated branch circuits from the central meter distribution panel to either a convenience outlet (operating at 120 VAC, 15A) in the case of Level 1 charging or an EVSE (operating at 120 VAC, 40A) for Level 2 charging. The tasks typically required for this process are presented in Figure 5-21.
29
1. Review potential locations with property owner
Items to consider:
Proximity to available AC power supply
Adequate space and accessibility to meet ADA requirements (if applicable)
Safety and vandalism considerations
Ensure the location meets the requirements of NEC 6252. Determine if adequate power is
available in existing supply panel or if new service is required
6. Installation and Final Inspection
3. Develop Site Plan
4. Obtain building permit
5. Hire Contractor
Review whether the existing supply can meet the requirements of the new load (A licensed electrician or the local electric utility will be able to help determine this). Check with local utility on special EV or PHEV electricity rates and 2 nd meter options or requirements. Drawing of EVSE location
Electrical plan including addition of new circuit, panel schedules and circuit routing
Include any lighting, access control requirements
Additional meter requirements (if applicable)
Prepare drawings for Permit Application
Figure 5-21. Levels 1 and 2 electric vehicle supply equipment installation flowchart for an apartment complex.
5.7.3 Commercial Facility Charging
Installation of the electric vehicle charging supply in a commercial facility typically consists of installing new dedicated branch circuits from the central meter distribution panel to an EVSE (operating at 120 VAC, 40A) for Level 2 charging. The tasks typically required for this process are presented in Figure 5-22 and an example of a Level 2 charging facility is provided in Figure 5-23.
1. Review potential site locations
Items to consider:
Proximity to available AC power supply
Adequate space and accessibility to meet ADA requirements (if applicable)
Personnel Safety, potential nearby hazards and Vandalism considerations
Future expansion needs2. Determine source of electrical
supply Š new or existing
6. Installation and Final Inspection
3. Develop Site Plan
4. Obtain building permit
5. Hire Contractor
Determine if a electric utility service and/or meter is required or desired. If installing a new meter, the local electric utility will need to be contacted to review rate options, metering requirements and new account setup.
Station layout including curbs, wheel stops/bollards and setbacks
Electrical Requirements
Any lighting, shelter, access control or customer phone service requirements
Ground striping and signage
Prepare drawings for Permit Application
Figure 5-22. Levels 1 and 2 electric vehicle supply equipment installation flowchart for a commercial location.
30
Figure 5-23. Example of a Level 2 commercial electric vehicle charger installation.
6. INFRASTRUCTURE COST Charging infrastructure scenarios appropriate for PHEVs are defined in Section 5.7 of this report and
include the following: • Residential garage charging (Levels 1 and 2) • Apartment complex charging (Levels 1 and 2) • Commercial facility charging (Level 2)
Major cost components for these charging infrastructure scenarios include the following: • Increased battery capacity • Additional battery management system modules • Onboard charge system and charge port Components • Offboard EVSE • Installation costs associated with EVSE
- Labor - Materials - Construction permit (local jurisdiction) - Electric vehicle signage for apartments and commercial installs.
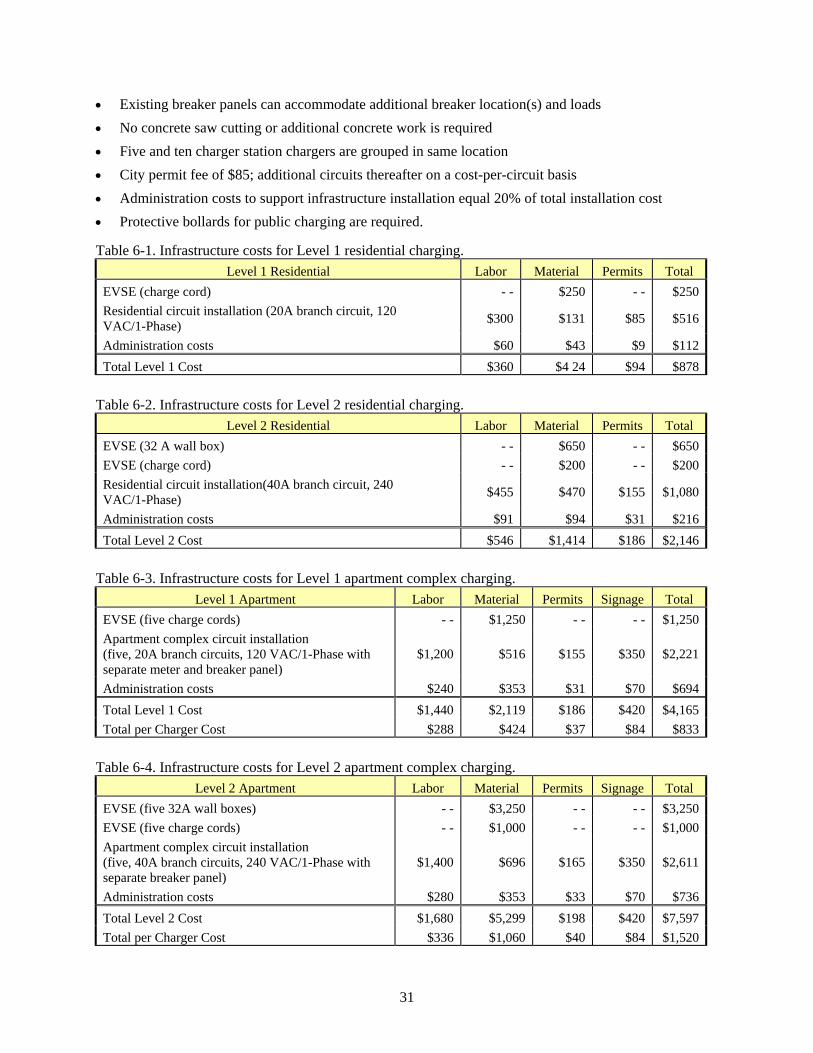
Costs for the infrastructure scenarios considered in Section 5.7 of this report are presented in Tables 6.1 through 6.5. The following assumptions were applied in calculating these costs: • Labor costs are based on electrician rates of $75/hour • EVSE location within 40 ft of breaker panel • NEC-compliant EVSE produced in quantities of 100,000 at pricing based on existing hardware
designs • NEC-compliant charge cord produced in quantities of 100,000 based on SAE J1772 draft
specifications • EVSE functionality limited to vehicle charging
31
• Existing breaker panels can accommodate additional breaker location(s) and loads • No concrete saw cutting or additional concrete work is required • Five and ten charger station chargers are grouped in same location • City permit fee of $85; additional circuits thereafter on a cost-per-circuit basis • Administration costs to support infrastructure installation equal 20% of total installation cost • Protective bollards for public charging are required.
Table 6-1. Infrastructure costs for Level 1 residential charging. Level 1 Residential Labor Material Permits Total
EVSE (charge cord) - - $250 - - $250Residential circuit installation (20A branch circuit, 120 VAC/1-Phase) $300 $131 $85 $516
Administration costs $60 $43 $9 $112Total Level 1 Cost $360 $4 24 $94 $878
Table 6-2. Infrastructure costs for Level 2 residential charging.
Level 2 Residential Labor Material Permits Total EVSE (32 A wall box) - - $650 - - $650EVSE (charge cord) - - $200 - - $200Residential circuit installation(40A branch circuit, 240 VAC/1-Phase) $455 $470 $155 $1,080
Administration costs $91 $94 $31 $216Total Level 2 Cost $546 $1,414 $186 $2,146
Table 6-3. Infrastructure costs for Level 1 apartment complex charging.
Level 1 Apartment Labor Material Permits Signage Total EVSE (five charge cords) - - $1,250 - - - - $1,250Apartment complex circuit installation (five, 20A branch circuits, 120 VAC/1-Phase with separate meter and breaker panel)
$1,200 $516 $155 $350 $2,221
Administration costs $240 $353 $31 $70 $694Total Level 1 Cost $1,440 $2,119 $186 $420 $4,165Total per Charger Cost $288 $424 $37 $84 $833
Table 6-4. Infrastructure costs for Level 2 apartment complex charging.
Level 2 Apartment Labor Material Permits Signage Total EVSE (five 32A wall boxes) - - $3,250 - - - - $3,250EVSE (five charge cords) - - $1,000 - - - - $1,000Apartment complex circuit installation (five, 40A branch circuits, 240 VAC/1-Phase with separate breaker panel)
$1,400 $696 $165 $350 $2,611
Administration costs $280 $353 $33 $70 $736Total Level 2 Cost $1,680 $5,299 $198 $420 $7,597Total per Charger Cost $336 $1,060 $40 $84 $1,520
32
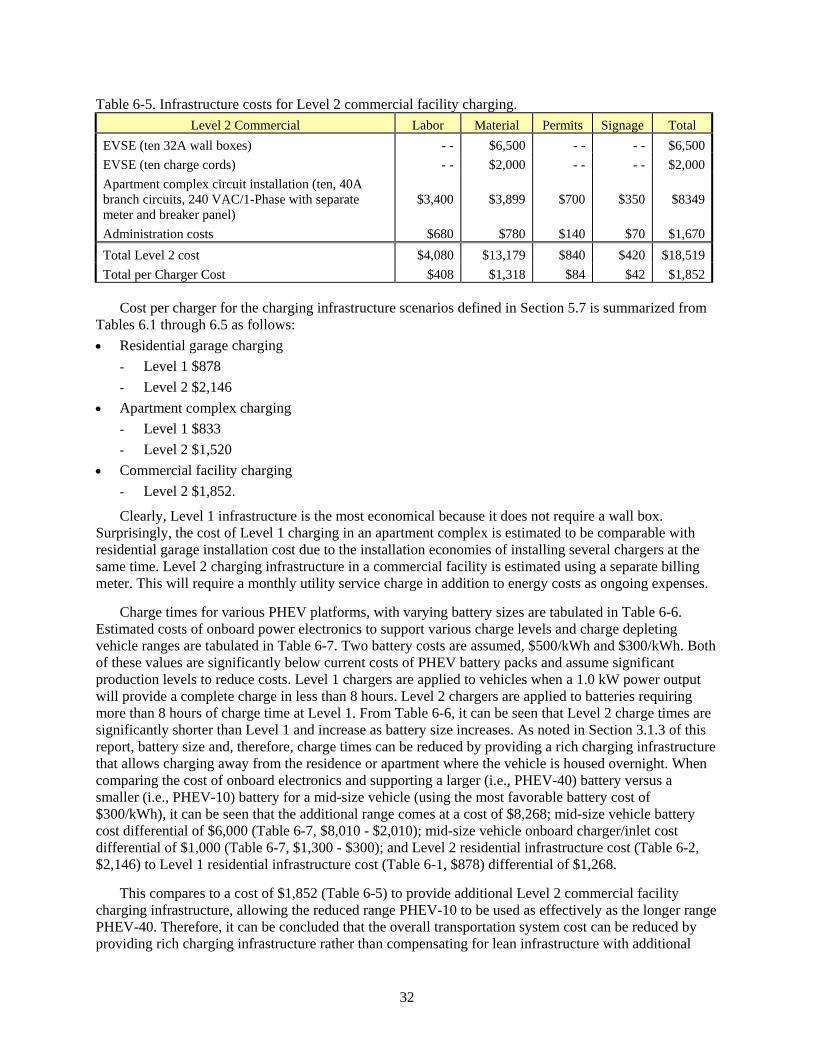
Table 6-5. Infrastructure costs for Level 2 commercial facility charging. Level 2 Commercial Labor Material Permits Signage Total
EVSE (ten 32A wall boxes) - - $6,500 - - - - $6,500EVSE (ten charge cords) - - $2,000 - - - - $2,000Apartment complex circuit installation (ten, 40A branch circuits, 240 VAC/1-Phase with separate meter and breaker panel)
$3,400 $3,899 $700 $350 $8349
Administration costs $680 $780 $140 $70 $1,670Total Level 2 cost $4,080 $13,179 $840 $420 $18,519Total per Charger Cost $408 $1,318 $84 $42 $1,852
Cost per charger for the charging infrastructure scenarios defined in Section 5.7 is summarized from Tables 6.1 through 6.5 as follows: • Residential garage charging
- Level 1 $878 - Level 2 $2,146
• Apartment complex charging - Level 1 $833 - Level 2 $1,520
• Commercial facility charging - Level 2 $1,852.
Clearly, Level 1 infrastructure is the most economical because it does not require a wall box. Surprisingly, the cost of Level 1 charging in an apartment complex is estimated to be comparable with residential garage installation cost due to the installation economies of installing several chargers at the same time. Level 2 charging infrastructure in a commercial facility is estimated using a separate billing meter. This will require a monthly utility service charge in addition to energy costs as ongoing expenses.
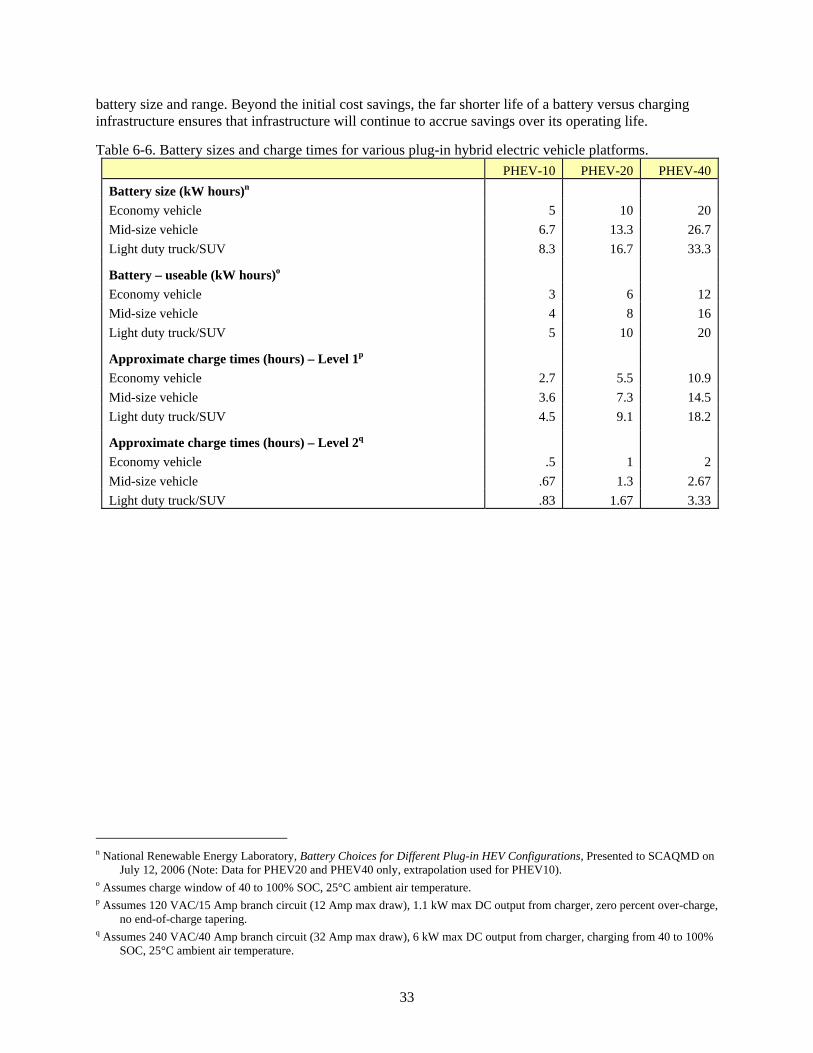
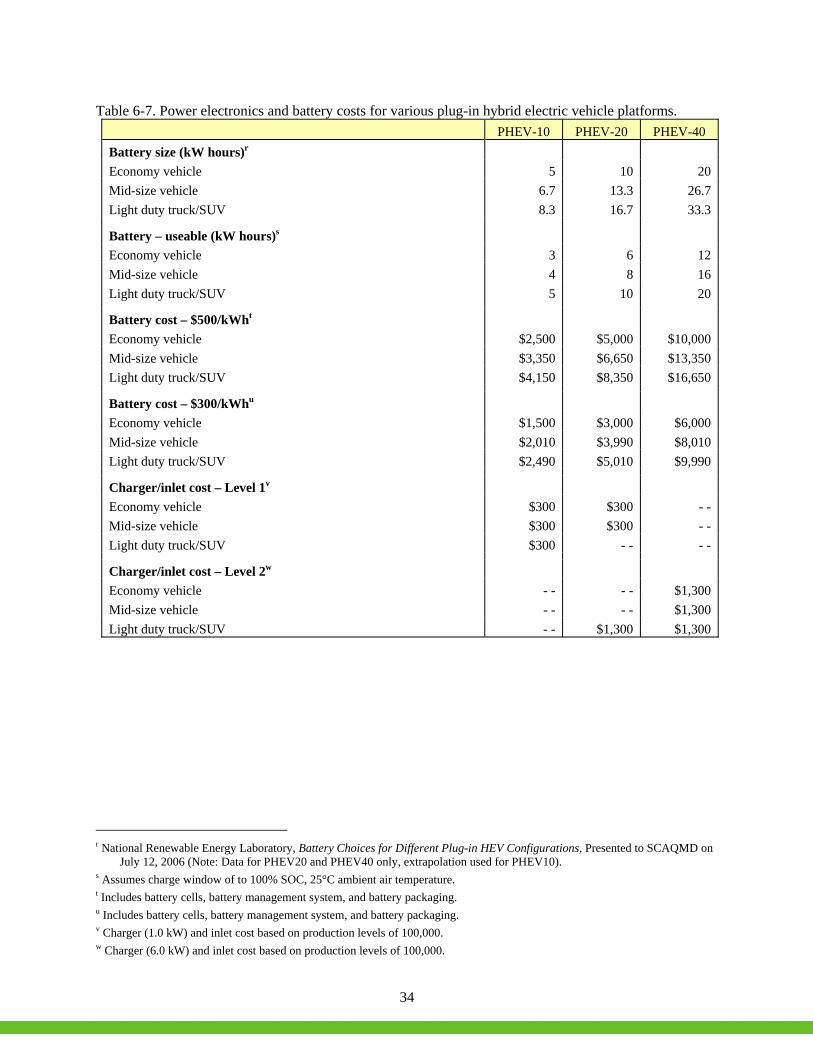
Charge times for various PHEV platforms, with varying battery sizes are tabulated in Table 6-6. Estimated costs of onboard power electronics to support various charge levels and charge depleting vehicle ranges are tabulated in Table 6-7. Two battery costs are assumed, $500/kWh and $300/kWh. Both of these values are significantly below current costs of PHEV battery packs and assume significant production levels to reduce costs. Level 1 chargers are applied to vehicles when a 1.0 kW power output will provide a complete charge in less than 8 hours. Level 2 chargers are applied to batteries requiring more than 8 hours of charge time at Level 1. From Table 6-6, it can be seen that Level 2 charge times are significantly shorter than Level 1 and increase as battery size increases. As noted in Section 3.1.3 of this report, battery size and, therefore, charge times can be reduced by providing a rich charging infrastructure that allows charging away from the residence or apartment where the vehicle is housed overnight. When comparing the cost of onboard electronics and supporting a larger (i.e., PHEV-40) battery versus a smaller (i.e., PHEV-10) battery for a mid-size vehicle (using the most favorable battery cost of $300/kWh), it can be seen that the additional range comes at a cost of $8,268; mid-size vehicle battery cost differential of $6,000 (Table 6-7, $8,010 - $2,010); mid-size vehicle onboard charger/inlet cost differential of $1,000 (Table 6-7, $1,300 - $300); and Level 2 residential infrastructure cost (Table 6-2, $2,146) to Level 1 residential infrastructure cost (Table 6-1, $878) differential of $1,268.
This compares to a cost of $1,852 (Table 6-5) to provide additional Level 2 commercial facility charging infrastructure, allowing the reduced range PHEV-10 to be used as effectively as the longer range PHEV-40. Therefore, it can be concluded that the overall transportation system cost can be reduced by providing rich charging infrastructure rather than compensating for lean infrastructure with additional
33
battery size and range. Beyond the initial cost savings, the far shorter life of a battery versus charging infrastructure ensures that infrastructure will continue to accrue savings over its operating life.
Table 6-6. Battery sizes and charge times for various plug-in hybrid electric vehicle platforms. PHEV-10 PHEV-20 PHEV-40
Battery size (kW hours)n Economy vehicle 5 10 20 Mid-size vehicle 6.7 13.3 26.7 Light duty truck/SUV 8.3 16.7 33.3
Battery – useable (kW hours)o Economy vehicle 3 6 12 Mid-size vehicle 4 8 16 Light duty truck/SUV 5 10 20
Approximate charge times (hours) – Level 1p Economy vehicle 2.7 5.5 10.9 Mid-size vehicle 3.6 7.3 14.5 Light duty truck/SUV 4.5 9.1 18.2
Approximate charge times (hours) – Level 2q Economy vehicle .5 1 2 Mid-size vehicle .67 1.3 2.67 Light duty truck/SUV .83 1.67 3.33
n National Renewable Energy Laboratory, Battery Choices for Different Plug-in HEV Configurations, Presented to SCAQMD on
July 12, 2006 (Note: Data for PHEV20 and PHEV40 only, extrapolation used for PHEV10). o Assumes charge window of 40 to 100% SOC, 25°C ambient air temperature. p Assumes 120 VAC/15 Amp branch circuit (12 Amp max draw), 1.1 kW max DC output from charger, zero percent over-charge,
no end-of-charge tapering. q Assumes 240 VAC/40 Amp branch circuit (32 Amp max draw), 6 kW max DC output from charger, charging from 40 to 100%
SOC, 25°C ambient air temperature.
34
Table 6-7. Power electronics and battery costs for various plug-in hybrid electric vehicle platforms. PHEV-10 PHEV-20 PHEV-40
Battery size (kW hours)r Economy vehicle 5 10 20 Mid-size vehicle 6.7 13.3 26.7 Light duty truck/SUV 8.3 16.7 33.3
Battery – useable (kW hours)s Economy vehicle 3 6 12 Mid-size vehicle 4 8 16 Light duty truck/SUV 5 10 20
Battery cost – $500/kWht Economy vehicle $2,500 $5,000 $10,000 Mid-size vehicle $3,350 $6,650 $13,350 Light duty truck/SUV $4,150 $8,350 $16,650
Battery cost – $300/kWhu Economy vehicle $1,500 $3,000 $6,000 Mid-size vehicle $2,010 $3,990 $8,010 Light duty truck/SUV $2,490 $5,010 $9,990
Charger/inlet cost – Level 1v Economy vehicle $300 $300 - - Mid-size vehicle $300 $300 - - Light duty truck/SUV $300 - - - -
Charger/inlet cost – Level 2w Economy vehicle - - - - $1,300 Mid-size vehicle - - - - $1,300 Light duty truck/SUV - - $1,300 $1,300
r National Renewable Energy Laboratory, Battery Choices for Different Plug-in HEV Configurations, Presented to SCAQMD on
July 12, 2006 (Note: Data for PHEV20 and PHEV40 only, extrapolation used for PHEV10). s Assumes charge window of to 100% SOC, 25°C ambient air temperature. t Includes battery cells, battery management system, and battery packaging. u Includes battery cells, battery management system, and battery packaging. v Charger (1.0 kW) and inlet cost based on production levels of 100,000. w Charger (6.0 kW) and inlet cost based on production levels of 100,000.