plugging in renewable energy - union of concerned scientists
TRANSCRIPT

REPORT CARDHow Your State Ranks
Policies to Increase Renewable Energy:Use of Renewable
Energy Today:Renewable Energy Potential:
Overall Grade:
tied for last (no commitments)#27 (1%)
#6 (over 50 times today's needs)
DComment: Even though renewable resources
Even though renewable resources
could supply more than 50 times the energy your
could supply more than 50 times the energy your
state needs today, your state has done little
state needs today, your state has done little
so far to develop them and has no policies in
so far to develop them and has no policies in
place that commit to making that happen.
place that commit to making that happen.
Plugging In Renewable
EnergyGRADING THE STATES


Plugging In Renewable
EnergyGRADING THE STATES
Union of Concerned ScientistsMay 2003
b y
J E F F D E Y E T T E
S T E V E C L E M M E R
D E B O R A H D O N O V A N

ii l Union of Concerned Scientists l
Copyright © 2003 Union of Concerned ScientistsAll rights reserved
Jeff Deyette is an analyst in the UCS Clean Energy Program. Steve Clemmer is a senior analyst and Deborah Donovan is the program’s research coordinator.
The Union of Concerned Scientists is a nonprofi t part-nership of scientists and citizens combining rigorous scientifi c analysis, innovative policy development, and effective citizen advocacy to achieve practical environ-mental solutions.
The UCS Clean Energy Program examines the benefi ts and costs of the country’s energy use and promotes energy solutions that are sustainable both environmentally and economically.
More information about UCS and the Clean Energy Program is available on the World Wide Web at www.ucsusa.org.
The full text of this report is available on the UCS website or may be obtained from:
UCS PublicationsTwo Brattle SquareCambridge, MA 02238-9105
Or email [email protected] or call (617) [email protected] or call (617) [email protected]
DESIGN: David Gerratt/Nonprofi tDesign.com
COVER CREDITS: Wellesley, MA High School solar photovoltaic array, courtesy
of Schott Applied Power. Klondike Wind Power Facility, Wasco, OR,
courtesy of GE Wind Energy.
Printed on recycled paper

l Plugging In Renewable Energy: Grading the States l iii
Contents
Figures & Tables iv
Acknowledgments vi Executive Summary 1 1. Introduction 6
2. Renewable Energy Potential 9
3. Current Renewable Energy Use 13
4. Renewable Electricity Standards 14
5. Renewable Electricity Funds 20
6. Other Renewable Energy Policies and Voluntary Measures 22 7. State Standards and Funds Summary 24
8. Grading State Renewable Commitments 26
9. Conclusion 30
References 33
Appendices A. Methodology and Assumptions 35 B. Renewable Energy Potential Ranking (as a Percent of Total 2001 Electricity Sales) 38 C. State Ranking of Renewable Energy Generation as a Percent of Total Sales, 2001 40 D. New Renewable Energy from Green Power Customer Choice 41

iv l Union of Concerned Scientists l
Figures & Tables
FiguresES-1. New and Existing Renewable Energy Capacity from State Standards and Funds 2
ES-2. Renewable Energy Report Card Map 3
1. Renewable Energy Potential 10
2. U.S. Electricity Mix, 2001 13
3. State Renewable Electricity Standards 14
4. New Renewable Energy Share of Electricity Sales from Companies Covered by Renewable Electricity Standards in 2017 17
5. New and Existing Renewable Energy Share of Electricity Sales from Companies Covered by Renewable Electricity Standards in 2017 18
6. State Renewable Electricity Funds, Cumulative 1998–2017 20
7. New and Existing Renewable Energy Capacity from State Standards and Funds 24
8. New Renewable Energy Capacity from State Standards and Funds by 2017 25
9. Carbon Emission Reductions from New Renewable Energy Developed as a Result of State Standards and Funds, 2017 25

l Plugging In Renewable Energy: Grading the States l v
Tables 1. U.S. Renewable Energy Potential 9
2. Top 10 States by Overall Technical Potential (as a Percent of Total Sales) 11
3. Top 10 States by Wind Technical Potential (as a Percent of Total Sales) 11
4. Top 10 States by Solar Technical Potential (as a Percent of Total Sales) 11
5. Top 10 States by Bioenergy Technical Potential (as a Percent of Total Sales) 12
6. Top Nine States by Geothermal Technical Potential (as a Percent of Total Sales) 12
7. State Ranking of Renewable Energy Generation as a Percent of Total Sales, 2001 13
8. Renewable Electricity Standard Ramp-up Rates for Covered Companies 15
9. New Renewable Energy Share of Electricity Sales from Renewable Electricity Standards in 2017 17
10. Renewable Energy Report Card 27

lvi l Union of Concerned Scientists
Acknowledgments
The Union of Concerned Scientists gratefully acknowledges the generous support of the following organizations in helping to underwrite the production of this report:
The Energy FoundationThe Joyce FoundationThe J.M. Kaplan FundThe Korein FoundationOak FoundationThe Pew Charitable TrustsV. Kann Rasmussen FoundationWallace Global Fund
The authors gratefully acknowledge the technical assistance and advice of Alan Nogee, Clean Energy Program director; the support of Marchant Wentworth, Kate Abend, and David Gardiner; and the editorial assistance of Bryan Wadsworth and Heather Tuttle. UCS would also like to express its appreciation for the layout and graphics support of David Gerratt. The authors also wish to thank Dick Cameron of GreenInfo Network for his assistance with solar resource potential estimates.
The opinions expressed in this report do not necessarily refl ect the opinions of the foundations that supported the work. Both the opinions and the information contained herein are the sole responsibility of the authors.

Plugging In Renewable Energy: Grading the States l 1 l
Executive Summary
America’s electricity system is dominated by America’s electricity system is dominated by Afossil fuels. The result is a system that lacks Afossil fuels. The result is a system that lacks Adiversity and security, threatens the health of our citizens, jeopardizes the stability of Earth’s climate, and robs future generations of clean air, clean water, and energy independence. This report assigns grades to each of the 50 states based on their commitment to supporting wind, solar, and other renewable energy sources. We measure commitment by the projected results of renewable electricity standards for electric companies and dedicated renewable electricity funds. Current state renewable energy generation is also considered. State renewable energy purchases, voluntary programs, and unenforceable goals are discussed, but not considered in the grading. We also compare the total development realized from state commitments with federal legislative proposals and each state’s renewable energy potential.
Our analysis shows that 19 states have stepped in to fi ll a leadership vacuum at the federal level by taking important fi rst steps toward developing a clean energy system. Among our fi ndings:
• A mere handful of states are responsible for most of the projected gains in renewable energy. California accounts for 44 percent of all pro-jected new development; California and Texas together account for nearly 60 percent; and the top fi ve states account for more than 80 percent.
• Only California and Nevada received A- grades for enacting standards that increase renewable electricity sales by one percentage point per year for at least 10 years, while covering utilities serving more than two-thirds of electricity use in each state.
• Thirty-four states received failing grades of D or F for their lack of commitment to renewable electricity, with six qualifying for our Hall of Shame.
• Most states have only begun to tap their abundant renewable electricity potential.
• Renewable energy generated through state standards and funds will signifi cantly exceed voluntary purchases of renewable (or “green”) electricity, but fall far short of what a fair, cost-effective national standard could produce.
Renewable Energy Potential. Wind, solar, bioenergy, geothermal, and landfi ll gas have the technical poten-tial to provide more than fi ve times the electricity currently needed by the United States. Thirty states have the potential to generate all of their electricity from nonhydroelectric renewable energy and still export clean power to others. While the upper Mid-west and Great Plains states have the greatest poten-tial, every state has the potential to produce more than one-quarter of its current electricity use from renewable energy.
Current Renewable Energy Use. Despite the enormous potential for renewable energy, only a few states are generating renewable electricity from sources other than hydroelectric facilities at mean-ingful levels. Maine ranks the highest, generating nearly 30 percent of its electricity from renewable energy, followed by Hawaii, California, and New Hampshire at approximately 10 percent each. Thirty states are at or below the national level of 1.8 percent, with 23 of those below one percent.

2 l Union of Concerned Scientists l
Renewable Electricity Standards. Thirteen states have adopted renewable electricity standards, which UCS forecasts will lead to the development of 14,230 megawatts (MW) of new renewable capacity by 2017 and support the continued operation of more than 7,000 MW of existing renewable generators (Figure ES-1). Combined, this represents enough clean power to meet the electricity needs of nearly 15 million typical (nonelectric-heating) U.S. homes. California’s standard will create the largest market for renewable energy, supporting more than half of the total capacity for all states. Because of its size, Texas will create the second largest market. Nevada, Massachusetts, and New Jersey complete the top fi ve in this category, each with standards supporting more than 1,000 MW of total capacity.
Renewable Electricity Funds. Fifteen states have adopted renewable electricity funds, which UCS forecasts will invest nearly $4.5 billion over a 20-year
period, thereby supporting an additional 1,000 MW of new renewable capacity by 2017—enough to meet the electricity needs of approximately 580,000 typical U.S. homes. California leads the nation in total dollar commitment to renewable energy, accounting for nearly half of all funding. Illinois, Massachusetts, Connecticut, New Jersey, Arizona, and Minnesota are also making signifi cant commitments, each in excess of $100 million. Nine states have implemented both renewable electricity funds and standards.
Other Renewable Energy Policies and Markets.
Several other policies and voluntary approaches have been adopted at the federal, state, and local levels. For example, 36 states have adopted net metering, which makes it easier and more affordable for custo-mers to generate their own renewable electricity by feeding surplus power back into the grid. Nearly half of the states require electricity providers to disclose their fuel sources and environmental impact on
New York
24,000
20,000
16,000
12,000
8,000
4,000
20002001
20022003
20042005
20062007
20082009
20102011
20122013
20142015
20162017
Other*
California
Nevada
Arizona & New Mexico
Texas
MinnesotaIowa & Wisconsin
New JerseyMassachusettsMaine
Figure ES-1 New and Existing Renewable Energy Capacity from State Standards and Funds
*Includes Connecticut, Delaware, Illinois, Montana, Oregon, Pennsylvania, and Rhode Island.SOURCE: UCS, 2003.
Meg
awat
ts

l Plugging In Renewable Energy: Grading the States l 3
consumers’ bills, and others offer fi nancial incentives such as tax credits, grants, loans, and rebates. In addition, millions of customers in 36 states now have the opportunity to support renewable energy directly through voluntary purchases. Customer choice has resulted in more than 980 MW of new renewable energy capacity to date, with another 430 MW in the planning stages. Four states (Washington, Kansas, Wyoming, and Texas) have installed two-thirds of the total capacity, with Wash-ington leading the way at 321 MW, or one-third of the total. While these policies and voluntary measures will assist renewable energy development, they do not represent fi rm commitments and are therefore not considered in our grading.
Grading State Renewable Commitments. The vari-ables that best refl ect a state’s commitment are the rate at which renewable energy generation is pro-jected to increase, ramp-up duration, and the extent to which a standard applies to all electricity suppliers
in the state. Another indication of a state’s commit-ment is how much renewable energy generation it has previously supported and is still in operation today.
Passing Grades A grades are reserved for states that have standards A grades are reserved for states that have standards A gradesor funds projected to achieve a rate of increase of one percentage point per year, last at least 10 years, and apply to all suppliers. Unfortunately, no state achieved a straight A. UCS assigned A- grades to two states (California and Nevada) that meet the fi rst two criteria, and apply to at least two-thirds of the electricity sales in each state (Figure ES-2). B grades were given to states with standards or B grades were given to states with standards or B gradesfunds that require a rate of increase of at least 0.5 percent per year, last at least fi ve years, and cover suppliers serving most customers. Three states quali-fi ed: Massachusetts, Minnesota, and New Mexico. C grades were given to states with projected increases of at least 0.2 percent per year for at least
GradeA-
B+/B
C+/C
D
F
Figure ES-2 Renewable Energy Report Card Map

4 l Union of Concerned Scientists l
fi ve years, and whose standards cover suppliers serving most customers. States also received a C if they did not meet this minimum ramp-up requirement but have a commitment to make new renewable energy more than one percent of total retail sales by 2017. States whose existing renewable resources provide fi ve percent or more of retail sales also received C grades.
Failing Grades States receiving a grade of D or F do not pass the test of using their available renewable resources today or making commitments to do so in the future. D grades were given to states with a commitment D grades were given to states with a commitment D gradesto new renewable energy below one percent of total retail sales in 2017 or with existing renewable generation between one and fi ve percent today. F grades were given to states with no commitment F grades were given to states with no commitment F gradesto future renewable energy development whatsoever and low levels of existing renewable energy (below one percent of sales). Only 16 states received a passing grade of C or better, with two receiving an A- and another three receiving a B+ or a B. The great majority of states—34—received a D or F. UCS also nomi-nated six of the failing states to its Hall of Shame due to their high renewable energy potential but lack of commitment. We also designated 10 states as “Most Likely to Improve,” because policy efforts to support future renewable energy development have been proposed.
Total Projected Development and the Case for
a National Renewable Electricity Standard. UCS projects the 19 states that have enacted standards or funds will increase their renewable energy capacity 15,215 MW by 2017—a 113 percent increase over 1997 levels. This increase will provide enough elec-tricity for 10.4 million typical U.S. homes and elimi-nate as much carbon dioxide—the main heat-trapping gas causing global warming—as taking
7.4 million cars off the road or planting 11.2 million acres of trees (an area approximately the size of Maryland and New Jersey combined). The overall development resulting from standards and funds should signifi cantly exceed development resulting from voluntary customer choice programs. A recent National Renewable Energy Laboratory (NREL) study found that customer choice programs may only add enough renewable generation to equal 0.1 percent of U.S. electricity sales by 2010. Existing state standards and funds are projected to add 8.3 times as much renewable generation by that date. Even under an optimistic scenario, NREL projects customer choice programs would add 27 percent less renewable generation than UCS projects for existing state standards and funds (not counting additional state and national policies that might be enacted). The tremendous disparity in state programs and failing grades for 34 states speak to the need for a national renewable electricity standard. By setting a minimum requirement on which state standards and voluntary programs could build, a national standard would prove more equitable and lead to much higher and cost-effective levels of renewable energy generation. The U.S. Senate passed a 10 percent by 2020 renewable electricity standard in its comprehensive energy bill in 2002, but the bill died when a House and Senate conference committee could not reconcile their versions. The renewable electricity standard, which was not included in the House bill, was one of the most contentious issues. The House Energy and Commerce Committee subsequently rejected a renewable electricity standard of 20 percent by 2025 earlier this year. The Senate is expected to debate the issue this May. The 10 percent by 2020 national standard passed by the Senate last year would lead to the develop-ment of 3.4 times more new renewable generation

l Plugging In Renewable Energy: Grading the States l 5
than existing state standards and funds. Studies by the U.S. Energy Information Administration (EIA) and UCS also show that such a standard could reduce prices for both electricity and natural gas. A 20 percent by 2020 national standard would lead to the development of 12.8 times as much new renewable generation as existing state standards and funds. EIA found that this standard would reduce natural gas prices enough to offset nearly all of a modest four percent increase in electricity prices, resulting in virtually no net cost increase
to consumers. UCS analysis suggests this standard could actually save consumers money while creat-ing nearly $80 billion in new capital investment and more than $6 billion in revenues for rural communities and landowners. Closing the renewable energy gap is too im-portant a goal to leave to individuals and a hand-ful of states. What America needs is a strong national policy with specifi c goals for plugging renewable energy into the electricity system.

6 l Union of Concerned Scientists l
IntroductionChapter 1
Today, the United States has an electricity system that lacks diversity and security, threatens the
health of our most vulnerable citizens every year, jeopardizes the stability of Earth’s climate, and robs future generations of clean air, clean water, and energy independence. The nation’s electricity generation is dominated by large power plants burning fuels that put public health and safety at risk. In fact, more than 90 percent of our electricity is generat-ed from fossil fuels and nuclear power—energy sources that also endanger the environment through mining, refi ning, waste disposal, and vulnerable delivery systems. Electricity generation using one type of fossil fuel, natural gas, is projected to triple in the next 20 years, reaching 36 percent of the total. Increas-ingly, this natural gas will come from outside North America (EIA, 2001). Recent experiences with natural gas price spikes and the implications of dependence on foreign oil are reminders that this path carries serious economic risks.
The Good NewsFortunately, we can reduce our growing reliance
on fossil fuels and nuclear power with clean renew-able energy sources such as solar, wind, geothermal, landfi ll gas, and bioenergy (fuel from organic materials including wood and agricultural wastes or crops grown specifi cally to produce energy). These safe, homegrown energy sources are available in signifi -cant quantities in most states and are increasingly cost-effective. Several recent studies by government agencies and nonprofi t organizations such as UCS
have shown that increasing the use of renewable technologies in the United States would create an energy system that:
• is more diverse;• is safer;• pollutes less;• reduces the emissions causing global warming;• creates jobs; • saves consumers money; and• stimulates rural economies.1
The Bad News Despite the clear benefi ts renewable energy has over traditional electricity sources, an enormous “clean energy gap” exists in the United States. Renew-able energy sources (not including hydropower) generate approximately two percent of our electricity today (EIA, 2003). Even worse, no national policy has been established to ensure that renewable energy becomes the signifi cant source of electricity it can and should be. In poll after poll, consumers make it resoundingly clear that they want more renewable energy. When asked recently whether we should reduce our depen-dence on fossil fuels by requiring power companies to generate 20 percent of their electricity using alterna-tive sources of energy such as wind and solar, 70 percent of respondents said yes (Mellman Group, 2002). They agreed that these energy sources are cleaner and more secure than oil, gas, coal, and nuclear power. Other polls show 80 to 95 percent support for increased development of renewable energy
1 See Bailie, et al. 2003; Clemmer, et al. 2001; EIA, 2002; EIA, 2001b; IWG, 2000; UCS, 2002; UCS, 2002b.

l Plugging In Renewable Energy: Grading the States l 7
sources (Gallup Organization, 2001; Hochschild and Hochschild, 2001; NRDC, 2003). The higher initial cost of renewable technologies often serves as an excuse for not increasing their use. In reality, the costs of renewable energy have come down signifi cantly in recent years, and studies show that increasing economies of scale and improved performance can continue to decrease the costs. Still, consumers also make it consistently clear through their responses to surveys that most are willing to pay more. A survey conducted by the Mellman Group in February 2002 found that 65 to 72 percent of consumers were willing to pay two or three dollars more on their monthly electricity bills if the increase resulted from utilities being required to obtain 20 percent of their electricity from renewable sources by 2020. In the last chapter of this report, however, we will review studies that show a 20 percent standard can be achieved without increasing overall consumer energy costs.
Closing the Gap The benefi ts of increasing renewable energy are clear, the disadvantages of our current energy path are great, and the public’s desire for more renewable energy is strong. A few states around the country understand this and are setting an example for other states and the nation to follow. Thirteen states, in fact, have adopted renewable electricity standards and 15 have adopted renewable electricity funds (a small charge on energy sold to customers is in-vested in renewable energy development). A number of states have also adopted policies such as net meter-ing, fi nancial incentives, and voluntary measures designed to remove market barriers and encourage renewable energy use.
The Purpose of this ReportIn developing this report, the Union of Con-
cerned Scientists set out to rank and grade all 50
The renewable electricity standard, sometimes called a renewable portfolio standard, is a simple mechanism
to diversify energy resources, stabilize energy prices, stimulate economic development, and reduce air
pollution and other harmful effects of electricity generation. Under a renewable electricity standard, retail
electricity providers covered by the standard supply a growing percentage of electricity from renewable energy
sources (wind, solar, geothermal, and bioenergy).
Some renewable electricity standards allow companies to comply with the standard by purchasing renew-
able energy credits. A government agency issues credits to generators for the amount of renewable energy
produced, which they can sell to electricity suppliers without necessarily transmitting the electricity itself.
Tradable renewable energy credits enable electricity suppliers to achieve compliance with the renewable
standard at the lowest cost, in the same way the Clean Air Act acid rain emission allowance trading system
has reduced the cost of compliance with air pollution targets. This market-based approach is designed to
provide the greatest amount of clean power for the lowest price and create an ongoing incentive to drive
costs down.
What Is a Renewable Electricity Standard?
8 l Union of Concerned Scientists l
states by examining their commitment to close the renewable energy gap. To accomplish this, UCS:
• reviewed the amount of renewable energy resources potentially available to each state,
• examined the current contribution that renewable energy is making to each state;
• ranked and graded states’ commitments to developing renewable resources in the future; and
• compared the total projected results and carbon savings against what could be achieved through proposed national policies.
UCS focused specifi cally on a set of policies that states have adopted to support the development of renewable energy, especially renewable electricity standards and renewable electricity funds. Using this set of measures, UCS developed an overall grade for each state.

l Plugging In Renewable Energy: Grading the States l 9
Renewable Energy PotentialChapter 2
Diverse renewable resources exist throughout the United States, providing the nation with
the technical potential to provide all the electricity we need many times over. The renewable resources with the greatest potential to generate electricity in the United States are solar, wind, and bioenergy. Combined, the technical potential of the major renewable technologies (wind, bioenergy, geothermal, and landfi ll gas) could provide 5.6 times the amount of electricity this country needs (Table 1). Not all of these renewable energy sources’ tech-nical potential will be developed, due to economic, physical, and other limitations. Estimates of technical potential refl ect the availability of a renewable resource (such as strong, steady winds, sunny skies, agricul-tural residues, or energy crops such as switchgrass) at or below a certain cost. Other factors, including land-use confl icts, transmission bottlenecks, and other market barriers, limit how quickly and to what extent we can tap this potential. The primary question is whether these resources are suffi cient to support the gradual transition pro-posed by a growing number of environmental and consumer groups and energy companies—a steady increase in the use of renewable energy of at least one percentage point per year—to at least 20 percent by 2020 or 2025.2 Over the long run, proposals by the Bush administration and others to shift to hydrogen fuel could create the national infrastruc-ture needed to utilize signifi cantly higher levels of
renewable resources to create hydrogen for transpor-tation, electricity, and for direct use in buildings and by industry. Solar, wind, bioenergy, geothermal, and landfi ll gas comprise the major nonhydroelectric renewable energy technologies with signifi cant technical poten-tial.3 Thirty states in the United States have the technical potential to generate all of their electricity from these renewable sources and export renewable energy to others (Figure 1, p.10). The states of the upper Midwest and Great Plains have the most signifi cant potential to develop renewable energy capacity. Table 2 (p.11) presents the top 10 states with the most renewable energy potential (as a percent of annual electricity sales to the state’s consumers). If even a fraction of this potential renewable energy
ResourceGeneration
(Billions of kWh)Percent of 2001 Electricity Sales
Wind 14,244 459%
Solar* 2,203 71%
Bioenergy 742 24%
Geothermal 191 6%
Landfill Gas 40 1%
Total 17,420 561%
Table 1 U.S. Renewable Energy Potential
*Solar potential is a conservative estimate of distributed photovoltaics. See Appendix A for sources and assumptions.
2 See Bailie et al., 2003; Clemmer et al., 2001; UCS, 2002b; and USPIRG, 2003. During the 107th Congress, 20 percent by 2020 RES legislation was included in S. 1333, H. 3037, and H. 2478. In the current 108th Congress, H.1295 includes a 20 percent by 2025 national RES and S. 944 includes 20 percent by 2020 RES legislation.
3 Hydroelectric power is also “renewable,” but opportunities for environmentally sound expansion are limited and thus are not the focus of this report.

10 l Union of Concerned Scientists l
were developed, states with renewable resources and access to adequate transmission lines could becomenet exporters of signifi cant amounts of clean electricity. See Appendix B for a complete listing of renewable energy potential by state.
Wind Wind has the potential to generate more than 4.5 times our nation’s electricity needs. Well over half the states have the potential to generate 50 percent or more of their electricity by using wind to power generating turbines. This potential is based on data regarding windy land area and average annual wind speeds, limited by proximity to transmission lines. The potential estimate also excludes wind development on certain types of land, depending on its current use and environmental sensitivity.
While offshore wind is becoming an increasingly important area for development, a consistent national estimate of offshore wind potential is not yet avail-able and is not included in these estimates. The inclusion of offshore wind would add signifi cantly to the overall potential of several states. As Table 3 shows, the best wind resources are in the Great Plains and upper Midwest states.
Solar Solar photovoltaic (PV) cells convert sunlight directly into electricity. Much of the United States has signifi cant potential for generating electricity from solar energy using this technology. Generally, states across much of the western part of the country, along with states along the southern Atlantic coast (North Carolina, South Carolina, Georgia, and Florida) have either very good or excellent solar
Figure 1 Renewable Energy* Potential
Technical Potential as a Percent of Total 2001 Electricity Sales
> 1,000%
101–1,000%
51–100%
27–50%
* Resources included here are bioenergy, landfill gas, solar photovoltaics, and wind. Hydropower potentials are not included. Data not available for Alaska and Hawaii.
SOURCES: See Appendix A and B.

l Plugging In Renewable Energy: Grading the States l 11
Rank State Percent of 2001 Electricity Sales
1 North Dakota 17,722%
2 South Dakota 15,779%
3 Montana 9,913%
4 Wyoming 7,807%
5 Nebraska 5,863%
6 Kansas 5,073%
7 Iowa 2,438%
8 Oklahoma 2,367%
9 Minnesota 1,785%
10 New Mexico 1,661%
Table 3 Top 10 States by Wind Technical Potential (as a Percent of Total Sales)
SOURCES: See Appendix A and B.
Table 4 Top 10 States by Solar Technical Potential (as a Percent of Total Sales)
SOURCES: See Appendix A and B.
Rank State Percent of 2001 Electricity Sales
1 Montana 967%
2 South Dakota 712%
3 Wyoming 607%
4 New Mexico 581%
5 North Dakota 550%
6 Nevada 357%
7 Utah 324%
8 Idaho 313%
9 Nebraska 250%
10 Colorado 202%
radiation levels. States in the Southwest, particularly Arizona, California, Colorado, Nevada, New Mexico, and Utah, have the highest solar energy potential. Parts of Kansas, Oklahoma, and Texas have similarly high potential. Our estimate of solar power potential is based on the assumption that solar panels and supporting infrastructure would be installed on only 0.5 percent of any state’s total land area. We also accounted for the quality of solar resources in different states and technology performance assumptions. The potential calculated here for generating electricity from solar PV does not include applications such as concen-trating solar, centralized solar thermal systems, or solar direct heat or hot water. In order to make a comparison among states, we also examined states’ solar energy potential as a percent of annual electricity sales. Table 4 presents the 10 states with the highest potential relative to 2001 electricity sales.
Bioenergy The terms bioenergy and biomass refer to a wide range of natural materials including switchgrass, agricultural residues such as corn stover (stalks), forest residues, and even animal wastes. All of these materials contain energy that can be used to generate power. Bioenergy fuels are burned directly or con-verted to a gas or liquid, which is then used to gene-rate electricity. After solar and wind, bioenergy has the potential to provide the greatest amount of electricity. More than half the states could potentially generate 20 percent or more of their electricity from bioenergy. In estimating bioenergy potential, we only look at resources available at a modest cost, and we exclude materials that are contaminated, already being used for other purposes, found in environmentally sensi-tive areas, grown in areas that would require irrigation, or are needed to maintain soil quality and prevent erosion.
Rank State Percent of 2001 Electricity Sales
1 North Dakota 18,611%
2 South Dakota 16,781%
3 Montana 10,977%
4 Wyoming 8,432%
5 Nebraska 6,247%
6 Kansas 5,356%
7 Iowa 2,674%
8 Oklahoma 2,524%
9 New Mexico 2,279%
10 Minnesota 1,940%
SOURCES: See Appendix A and B.
Table 2 Top 10 States by Overall Technical Potential (as a Percent of Total Sales)

12 l Union of Concerned Scientists l
The top 10 bioenergy states, shown in Table 5, include states of the Great Plains and Midwest, plus Mississippi, Arkansas, and Idaho.
GeothermalGeothermal energy (heat from inside the earth) is a source of steam that can be used to power electricity-generating turbines. There are nine states in the United States with this type of geothermal
energy potential; Nevada has by far the greatest potential as a share of electricity sales. Other states with signifi cant potential are all located in the western part of the country: Utah, California, Oregon, Colorado, Idaho, and New Mexico (Table 6). Only identifi ed geothermal sites with temperatures high enough for electricity production are included in these estimates.
Landfill Gas Organic material in landfi lls decomposes and forms a gas that can be captured and used to generate electricity. Seven states (California, Colorado, Rhode Island, Illinois, New York, New Jersey, and New Hampshire) have the potential to generate between two and four percent of their electricity sales from landfi ll gas. Thirty-one states have the potential to generate about one percent of their electricity this way (see Appendix A and B for sources).
Other Resources Other sources of energy including ocean tidal, ocean thermal, hydropower, and municipal solid waste (MSW) are not included in our overall estimate of renewable energy potential. Ocean tidal and thermal are promising but emerging technologies for which reliable data on technical potential are not yet available. Hydropower, while “renewable,” is an established technology and already a signifi cant source of electricity in the United States. Furthermore, there is little potential for envi-ronmentally acceptable expansion of hydropower other than in a few select areas. While some states and the federal government consider MSW to be “renewable”, most environmental groups do not because it is usually mixed with inorganic materials and environmentally preferable recycling policies should lead to a progressively smaller waste stream.
Table 5 Top 10 States by Bioenergy Technical Potential (as a Percent of Total Sales)
Rank State Percent of 2001 Electricity Sales
1 North Dakota 339%
2 South Dakota 289%
3 Nebraska 133%
4 Iowa 128%
5 Montana 96%
6 Kansas 92%
7 Mississippi 64%
8 Idaho 56%
9 Minnesota 55%
10 Arkansas 52%
SOURCES: See Appendix A and B.
Rank State Percent of 2001 Electricity Sales
1 Nevada 80%
2 Idaho 47%
3 Oregon 46%
4 California 46%
5 Utah 43%
6 Colorado 41%
7 New Mexico 27%
8 Arizona 9%
9 Washington 3%
Table 6 Top Nine States by Geothermal Technical Potential (as a Percent of Total Sales)
SOURCES: See Appendix A and B.

l Plugging In Renewable Energy: Grading the States l 13
* Includes oil, municipal solid waste, and other fuels.SOURCE: EIA, 2003.
Nuclear21%
Gas17%
Coal51%
Hydro6%
Renewables2%
Other*3%
Figure 2 U.S. Electricity Mix, 2001
Current Renewable Energy UseChapter 3
Despite the plentiful availability of renewable energy sources and strong interest from con-
sumers, only a few states are using those resources to generate electricity at meaningful levels. Nationally, renewable energy from nonhydroelectric sources provided just 1.8 percent of our electricity in 2001 (EIA, 2003). The United States instead relies on coal, nuclear power, and natural gas (Figure 2). In Table 7 below, we present the top and bottom 10 states according to renewable energy generation as a percent of 2001 electricity sales. Only one state—Maine—currently approaches 30 percent. Renewable energy provides roughly 10 percent in only three other states: Hawaii, California, and New Hampshire. Another three (Nevada, Alabama, and Vermont) get 5 to 10 percent of their electric-ity from renewable sources. The 10 states with the lowest levels of renewable energy development vary by size and location. How-ever, most of these states have signifi cant renewable energy potential (more than 100 percent of their
electricity needs), including Arizona, Missouri, Nebraska, New Mexico, North Dakota, South Dakota, and West Virginia. Overall, 30 states generate renewable energy at or below the national level of 1.8 percent. Twenty-three of those states use renewable energy for less than one percent of their electricity. See Appendix C for details.
Top 10 Bottom 10
Rank StateRenewable
Energy Generation as a % of Sales
Rank StateRenewable
Energy Generation as a % of Sales
1 Maine 28.4% 50 West Virginia 0.00%
2 Hawaii 11.4% 49 Missouri 0.01%
3 California 10.3% 48 North Dakota 0.01%
4 New Hampshire 10.1% 47 Kentucky 0.02%
5 Vermont 7.3% 46 Delaware 0.04%
6 Alabama 5.5% 45 Arizona 0.06%
7 Nevada 5.3% 44 Indiana 0.09%
8 Louisiana 4.2% 43 New Mexico 0.11%
9 Arkansas 4.1% 42 South Dakota 0.11%
10 Mississippi 4.1% 41 Nebraska 0.15%
* Renewable energy resources included here are solar, wind, bioenergy, geothermal, and landfill gas. Hydropower is not included in this estimate.SOURCES: See Appendix A and C.
Table 7 State Ranking of Renewable Energy* Generation as a Percent of Total Sales, 2001

14 l Union of Concerned Scientists l
Renewable Electricity StandardsChapter 4
In the past fi ve years, renewable electricity stan-dards (RES) have emerged as an effective and
popular tool for promoting the development of renewable energy resources. The RES (sometimes called a renewable portfolio standard or RPS) is a market-based policy mechanism that achieves a diverse electricity supply by establishing a minimum commitment to generate electricity from renewable resources. Though the design varies from state to state, an RES essentially requires electricity providers to gradually increase the share of renewable energy in their power supply. State efforts in RES imple-mentation have demonstrated that this policy can
successfully reduce existing market barriers and create new markets for renewable energy. To date, 13 states have established a minimum RES, as shown in Figure 3. Many of the states (Arizona, Connecticut, Maine, Massachusetts, Nevada, New Jersey, New Mexico, and Texas) enacted standards during the process of restructuring their electricity industry to allow retail energy consumers to choose their provider. Pennsylvania included an RES in restructuring settlements with distribution companies. Four states have enacted minimum requirements outside of restructuring. California and Iowa have enacted standards for regulated utilities. Minnesota
CA: 20% by
2017
NV: 15% by 2013; solar 5% of total
annually
AZ: 1.1% by
2007; 60% solar
NM: 10% by
2011
IA: 2.6% by
1999
WI:2.2% by
2011
ME:30%by
2000
PA: varies by utilities
MA: 4% by 2009
CT: 13% by 2009***
NJ: 6.5%by 2012
MN:10.5% by
2006**
TX: 3% by 2009
Figure 3 State Renewable Electricity Standards*
* Standards expressed as total renewable energy generation as a percent of covered companies' retail sales.** MN has a minimum requirement for one utility, Xcel.*** CT requirement is for sales to nonstandard-offer customers only. See text for further discussion.SOURCE: UCS, 2003.

l Plugging In Renewable Energy: Grading the States l 15
established a minimum requirement for only one regulated utility—Xcel Energy—but that utility accounts for more than half of the state’s electricity use. Wisconsin enacted an RES for regulated, muni-cipal, and cooperative utilities as part of reliability legislation. Several states have already revisited and strength-ened their standards. Most recently, Minnesota moved the timeline for Xcel’s minimum renewable energy requirement up six years, from 2012 to 2006. In December 2002, New Mexico joined Nevada as the second state to increase its renewable energy targets signifi cantly. Eight states (California, Connecticut, Massa-chusetts, New Jersey, New Mexico, Nevada, Texas, and Wisconsin) designed their standards to provide ongoing support for existing renewable energy sources while pushing the market to develop new resources. The regulatory rules implementing the Massachu-setts RES, however, do not include a mechanism to guarantee the continued generation of existing
renewable energy, so it is uncertain whether the Massachusetts market will be sustained. Minnesota, Iowa, and Arizona have focused only on encouraging new renewable energy generation. Maine and Pennsylvania do not have specifi c require-ments to develop new renewable sources and, there-fore, may only support the continued operation of some existing facilities. State standards vary in a couple of other impor-tant ways. For example, most standards do not require all electricity providers in the state to comply with renewable energy targets. In every state but Arizona and Wisconsin, publicly owned utilities (“munis”) and rural electric cooperatives are exempt. The Cali-fornia RES applies only to the three largest investor-owned utilities in the state, Iowa’s RES applies to two utilities, and the Minnesota requirement applies to only one. Exempting certain utilities reduces the overall effectiveness of the RES in supporting renew-able energy development and overcoming market barriers. State standards also vary considerably in the rate at which they require electricity providers to increase their use of renewable energy. As shown in Table 8, average annual ramp-up rates range from one percent or above per year in California, Nevada, and New Mexico to as little as 0.2 percent per year in Arizona, Texas, and Wisconsin. The table ranks each state RES fi rst by the average annual rate of increase in new renewable energy development from the start date of the ramp-up to either the end date or 2017, whichever is sooner, and then by the duration of the ramp-up. Strong ramp-up rates are important because they trigger renewable energy development in levels that achieve econo-mies of scale and reduce renewable energy costs more effectively, ensuring gradual but steady mar-ket growth. The economic and environmental benefi ts of a clean, sustainable power supply are also realized sooner.
Rank StateAverage
Annual Rate of Increase
Ramp-up Duration (Years)
1 New Mexico 1.1% 9
2 California 1.0% 15
3 Nevada 1.0% 11
4 Massachusetts 0.8% 15
5 Minnesota 0.8% 12
6 Iowa 0.6% 4
7 New Jersey 0.3% 12
8 Wisconsin 0.2% 9
9 Arizona 0.2% 7
9 Texas 0.2% 7
11 Connecticut NA NA
11 Maine NA NA
11 Pennsylvania NA NA
Table 8 Renewable Electricity Standard Ramp-up Rates for Covered Companies
SOURCE: See Appendix A.

16 l Union of Concerned Scientists l
Voluntary Renewable Energy Goals Three states have adopted voluntary renewable energy goals in an effort to promote clean power sources. In 2001, Hawaii and Illinois established nonbinding targets of nine percent by 2009 and 15 percent by 2020, respectively. That same year, Minnesota set a goal —in addition to its manda-tory requirement for Xcel—suggesting that each utility “make a good-faith effort” to generate or procure at least 10 percent of its electricity from renewable energy sources by 2015. While these goals should be applauded for their intent, they are not regulations and cannot be enforced. Because they provide no mechanism to guarantee new renewable energy development or support existing facilities, we do not include them in our evaluation. Signifi cant new renewable energy markets would emerge, however, should Hawaii, Illinois, or Minnesota opt to change their voluntary goals into binding requirements.
Measuring Renewable Electricity Standards To assess a standard’s impact, we attempted to refl ect state-specifi c conditions by collecting infor-mation from each state’s laws and rules and its experi-ence to date. Since most state standards rely on market-based decisions, however, it is not feasible to determine precise results in advance. In addition, many states are in the initial stages of implementing their standards. It is not generally clear what the mix of technologies will be, or if any adjustments will be made to the policies over time. For this report, all projections are carried out to 2017, which is the latest benchmark year of any state standard. We measure state commitments to renewable energy development in several ways. First, we estimate the expected total (new and existing) renewable energy capacity supported by state standards. This measure provides a sense of the overall market size and in which states the majority of the develop-
ment will occur. However, states with higher electric-ity demand will naturally tend to produce larger markets, and vice versa. So, in order to compare states fairly, we measure renewable energy commit-ments as a share of electricity sales. Since many state standards do not require com-pliance by all electricity providers in the state, we use this measure fi rst to examine new renewable energy generation as a percent of electricity sales for those companies covered under each state standard. We then compare these results to new renewable energy generation as a percent of total electricity sales in each state. Finally, we present the combined new and existing commitments to renewable energy sources by state standards.
Expected Renewable Energy Development UCS estimates that the 13 state standards will result in the development of 14,230 megawatts (MW) of new renewable energy by 2017 (a 105 percent increase from 1997 levels) and support 7,020 MW of existing facilities. When combined, the 21,250 MW of total capacity will generate enough clean power to meet the electricity needs of 14.8 million U.S. homes. Leading the nation in terms of total capacity supported is the Califor-nia RES, which provides a market for more than 11,000 MW of renewable energy—more than half of the total for all states. At 2,880 MW, the Texas RES supports the second largest renewable energy market. Nevada, Massachusetts, and New Jersey complete the top fi ve in this category, each with standards supporting more than 1,000 MW of total capacity.
New Renewable Energy Commitments In terms of new renewable energy as a percent of electricity sales, Nevada and California lead the way at 12.4 percent and 12.2 percent by 2017, respectively (Figure 4). Unless the state energy offi ce elects to terminate new renewable energy

l Plugging In Renewable Energy: Grading the States l 17
growth after 2009, the Massachusetts RES will follow closely behind at 12 percent by 2017.4 Several other states have also made important commitments to new renewable energy, ranging from 4 percent to 8.5 percent of covered electricity sales. Texas makes the second largest commitment to renewable energy capacity, but ranks in the bottom half of state standards in share of electricity use. This is because Texas is the largest electricity consumer in the nation, accounting for more than nine percent of U.S. electricity consumption in 2001. Arizona also ranks near the bottom by this measure, but sits atop the list of states (along with Nevada) by making the largest commitment to solar power development.5 Standards in Maine and Pennsylva-
nia do not have any specifi c requirements to devel-op new renewable energy sources. The Connecti-cut RES also provides no support for new renew-able resources at this time (see discussion below). Table 9 ranks the generation of new renewable energy from state standards as a percent of covered companies’ electricity sales, and compares this measure with new renewable energy’s share of total state electricity sales. In nearly every state, the share of renewable energy is lower as a percent of total electricity sales due to various electricity provider exemptions. By not requiring all providers to meet the RES, a signifi cant amount of renewable energy development is lost in each state, particularly in California, Minnesota, and New Mexico.
Figure 4 New Renewable Energy Share of Electricity Sales from Companies Covered by Renewable Electricity Standards in 2017
Nevada
California
Massachusetts
Minnesota
New Mexico
New Jersey
Texas
Iowa
Wisconsin
Arizona
Connecticut*
Maine*
Pennsylvania*
7.0%
1.7%
1.7%
1.6%
1.1%
0%
0%
0% 5% 10% 15% 20%
0%
12.4%
*As currently implemented, the CT, ME, and PA standards do not support new renewable energy development.
12.2%
12.0%
8.5%
4.0%
SOURCE: UCS, 2003.
Rank State
Percent of Covered Companies’
Electricity Sales
Percent of Total State Electricity
Sales
1 Nevada 12.4% 11.2%
2 California 12.2% 8.3%
3 Massachusetts 12.0% 10.3%
4 Minnesota 8.5% 4.9%
5 New Mexico 7.0% 4.9%
6 New Jersey 4.0% 3.9%
7 Texas 1.7% 1.4%
8 Iowa 1.7% 1.3%
9 Wisconsin 1.6% 1.4%
10 Arizona 1.1% 1.1%
11 Connecticut 0% 0%
11 Maine 0% 0%
11 Pennsylvania 0% 0%
Table 9 New Renewable Energy Share of Electricity Sales from Renewable Electricity Standards in 2017
SOURCE: See Appendix A.
4 The Massachusetts legislation requires that the RES increase to four percent by 2009, and one percent annually thereafter, until a date determined by the state energy offi ce. Though it is not certain, we assume that the standard will continue to increase at this rate through our 2017 benchmark.
5 Arizona requires 60 percent of its target to come from solar power; Nevada requires fi ve percent of each annual requirement to come from solar power.

18 l Union of Concerned Scientists l
Total Renewable Energy Commitments As shown in Figure 5, Maine leads all states in its overall commitment to new and existing renew-able energy (30 percent). However, at the time Maine passed its electricity restructuring bill and RES, approximately 45 percent of the state’s electricity came from bioenergy and hydropower—a mature and fully developed resource eligible to meet the RES. Therefore, the 30 percent standard actually represents something of a step backward. In addition, the vast majority of the RES can be met with existing hydropower from other New England states and Canada, leaving Maine’s important bioenergy industry susceptible to decline. The Maine legislature is pre-sently considering a bill (LD 1312) that would increase renewable energy development in the state. The state Public Utility Commission is expected to study solutions to these problems and recommend options to improve the RES.
California and Nevada’s standards, 20 percent and 15 percent respectively, also support a high percent-age of covered utilities’ electricity sales from both new and existing renewable energy sources. In con-trast to the Maine RES, these standards will gradually increase the contribution of new nonhydro renewable resources while providing ongoing support for existing generation. Minnesota, New Jersey, Texas, and Wisconsin make similar, but smaller, commit-ments in their standards. Like Maine, the Wisconsin RES provides support for existing hydropower tech-nology, but limits its contribution to 0.6 percent of retail sales. The Massachusetts standard ranks third due to its strong support for new development, but state regulations do not currently provide for the continued use of existing generation. The Con-necticut RES currently provides no support for new or existing renewable resources.
Figure 5 New and Existing Renewable Energy Share of Electricity Sales from Companies Covered by Renewable Electricity Standards in 2017
Maine
California
Nevada
Massachusetts
Minnesota
New Mexico
New Jersey
Texas
Pennsylvania
Wisconsin
Iowa
Arizona
Connecticut*
30.0%
15.0%
7.0%
6.5%
2.4%
2.3%
2.2%
1.7%
1.1%
0%
0% 5% 10% 15% 20% 25% 30% 35%
20.0%
12.0%
8.7%
*As currently implemented, the CT RES does not support new or existing renewable energy development.
SOURCE: UCS, 2003.
l Plugging In Renewable Energy: Grading the States l 19
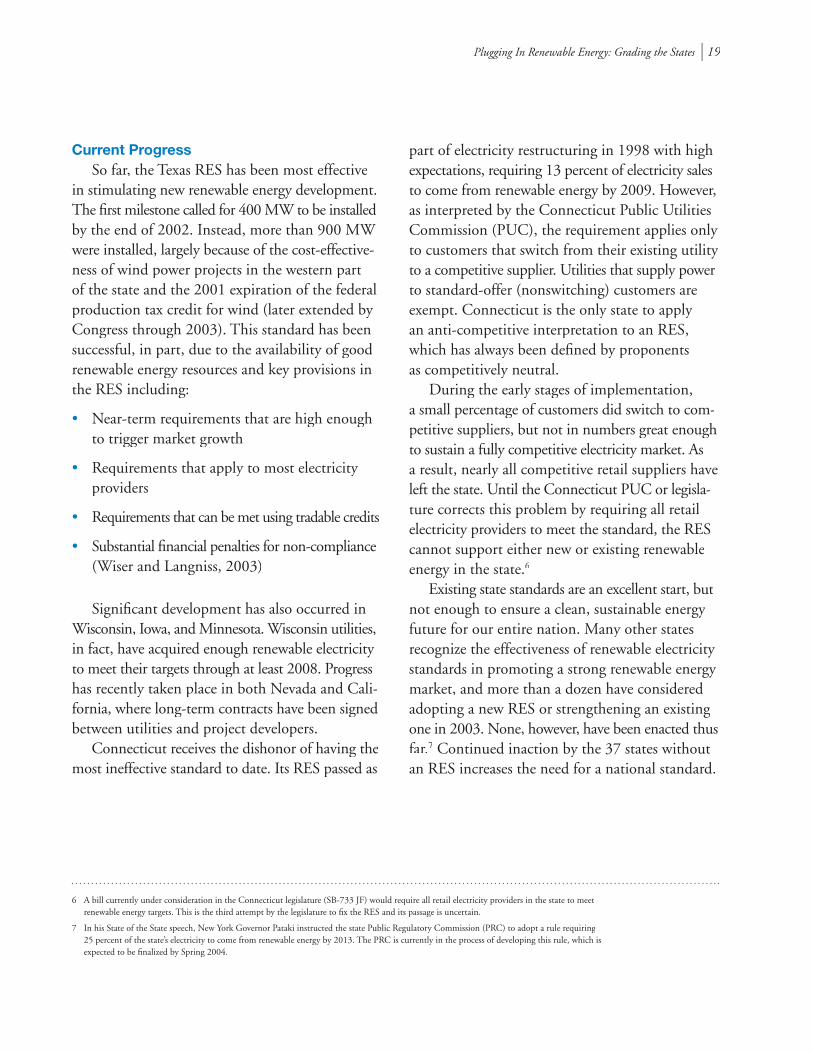
Current ProgressSo far, the Texas RES has been most effective
in stimulating new renewable energy development. The fi rst milestone called for 400 MW to be installed by the end of 2002. Instead, more than 900 MW were installed, largely because of the cost-effective-ness of wind power projects in the western part of the state and the 2001 expiration of the federal production tax credit for wind (later extended by Congress through 2003). This standard has been successful, in part, due to the availability of good renewable energy resources and key provisions in the RES including:
• Near-term requirements that are high enough to trigger market growth
• Requirements that apply to most electricity providers
• Requirements that can be met using tradable credits
• Substantial fi nancial penalties for non-compliance (Wiser and Langniss, 2003)
Signifi cant development has also occurred in Wisconsin, Iowa, and Minnesota. Wisconsin utilities, in fact, have acquired enough renewable electricity to meet their targets through at least 2008. Progress has recently taken place in both Nevada and Cali-fornia, where long-term contracts have been signed between utilities and project developers. Connecticut receives the dishonor of having the most ineffective standard to date. Its RES passed as
part of electricity restructuring in 1998 with high expectations, requiring 13 percent of electricity sales to come from renewable energy by 2009. However, as interpreted by the Connecticut Public Utilities Commission (PUC), the requirement applies only to customers that switch from their existing utility to a competitive supplier. Utilities that supply power to standard-offer (nonswitching) customers are exempt. Connecticut is the only state to apply an anti-competitive interpretation to an RES, which has always been defi ned by proponents as competitively neutral. During the early stages of implementation, a small percentage of customers did switch to com-petitive suppliers, but not in numbers great enough to sustain a fully competitive electricity market. As a result, nearly all competitive retail suppliers have left the state. Until the Connecticut PUC or legisla-ture corrects this problem by requiring all retail electricity providers to meet the standard, the RES cannot support either new or existing renewable energy in the state.6
Existing state standards are an excellent start, but not enough to ensure a clean, sustainable energy future for our entire nation. Many other states recognize the effectiveness of renewable electricity standards in promoting a strong renewable energy market, and more than a dozen have considered adopting a new RES or strengthening an existing one in 2003. None, however, have been enacted thus far.7 Continued inaction by the 37 states without an RES increases the need for a national standard.
6 A bill currently under consideration in the Connecticut legislature (SB-733 JF) would require all retail electricity providers in the state to meet renewable energy targets. This is the third attempt by the legislature to fi x the RES and its passage is uncertain.
7 In his State of the State speech, New York Governor Pataki instructed the state Public Regulatory Commission (PRC) to adopt a rule requiring 25 percent of the state’s electricity to come from renewable energy by 2013. The PRC is currently in the process of developing this rule, which is expected to be fi nalized by Spring 2004.

20 l Union of Concerned Scientists l
Renewable Electricity FundsChapter 5
Renewable electricity funds, also referred to as Renewable electricity funds, also referred to as Rpublic benefi ts funds, emerged as a policy tool Rpublic benefi ts funds, emerged as a policy tool Rfor supporting clean power during restructuring of the electric industry. As competition was introduced into the industry, some states created funds to help sustain the public benefi ts programs that were tradi-tionally administered by regulated electric utilities. In most cases, these funds are generated by placing a small fee on consumers’ monthly electricity bills. The 15 states that have already implemented renew-able electricity funds are projected to collect nearly $4.5 billion to promote clean, sustainable energy between 1998 and 2017 (Figure 6).
California leads the nation in total dollar com-mitment to renewable energy, accounting for nearly half of all state renewable electricity funding. Illinois, Massachusetts, Connecticut, New Jersey, Arizona, and Minnesota are also making signifi cant commit-ments to their funds, each in excess of $100 million. The duration of renewable electricity funds varies among states, ranging from open-ended funds in Delaware, Massachusetts, and Minnesota to fi ve-year funds in Montana and Pennsylvania. Several states, including California, New York, and Rhode Island, have extended the term of their funds. Illinois supplemented its state fund in 2001 with $500 million
CA: $2,048
mil
AZ: $234 mil
OR: $95 mil
MT:$10 mil
NM: $40 mil
IL: $627
mil
WI:$22 mil
PA: $55 mil
NY:$89 mil
MA: $458 mil
RI: $20 milCT: $319 mil
DE: $18 mil
MN:$153
mil
NJ: $273 mil
Figure 6 State Renewable Electricity Funds, Cumulative 1998–2017
SOURCE: UCS, 2003.

l Plugging In Renewable Energy: Grading the States l 21
in state revenue bonds dedicated to building new renewable energy facilities over a period of 10 years. By helping to remove market barriers, lower fi nan-cing costs, develop infrastructure, and educate the public, longer-term funds provide greater stability for renewable energy developers and are therefore more likely to be effective. Nine states (Arizona, California, Connecticut, Massachusetts, Minnesota, New Mexico, New Jersey, Pennsylvania, and Wisconsin) have implemented both funds and renewable electricity standards. These two policies complement each other in stimulating the renewable energy market: Standards “pull” renewable energy technologies into the electricity mix by providing a long-term market and reducing investment risk; funds “push” clean energy techno-logies by lowering market barriers through direct investment incentives or support for the infrastruc-ture needed to develop renewable energy. Together, state standards and funds can also work effectively in supporting high-cost but high-value emerging technologies that would otherwise go undeveloped. The impact of state funds on new and existing renewable energy capacity is diffi cult to calculate. In our analysis, we assume that new projects require an equivalent incentive of two cents per kilowatt-hour (kWh) over their projected 30-year life (except where we had more precise estimates). This estimate is highly uncertain, however, due to the wide variety of approaches states have taken in allocating their funds.8
In addition, development occurring as a result of renewable electricity funds may be used to help meet the RES in several states that have both policies. A provision in the California RES, for example,
authorizes the use of funds to buy down the above-market cost of renewable energy, and exempts utilities from meeting the standard if insuffi cient funds are available. The result is no net increase in renewable energy over what would be achieved by the standard alone. A similar situation exists in Massachusetts and New Jersey. In contrast, laws in Minnesota, New Mexico, and Wisconsin require that their funds be used to support new renewable energy projects above the minimum RES target. With these caveats in mind, UCS projects that state renewable electricity funds could support the development of 1,000 MW of new renewable energy capacity by 2017—enough to meet the electricity needs of approximately 580,000 typical U.S. homes. As explained above, this estimate does not include development resulting from the funds in California, Massachusetts, and New Jersey, which we assume will be used to meet the RES targets in those states. Nearly half of the projected new development (496 MW) comes from the New York renewable electricity fund, much of which is being used to support utility-scale wind projects (Peterson, 2003). Signifi cant development is also expected from the state fund in Illinois. The recent national economic downturn and subsequent state budget shortfalls have put some existing renewable electricity funds at risk and stalled efforts to adopt new funds. The Massachusetts legis-lature recently pulled $17 million from its renewable energy trust fund to help offset budget overruns for fi scal 2003, and has threatened to take more if necessary to balance future budgets. A similar effort to redirect renewable electricity funds is currently under consideration in Wisconsin.
8 See Wiser et al., 2002, for a summary of the types of programs implemented by states with renewable electricity funds, including detailed case studies.

22 l Union of Concerned Scientists l
Other Renewable Energy Policies and Voluntary MeasuresChapter 6
Several other policies and voluntary approaches have been adopted at the federal, state, and local
levels to remove market barriers and encourage renewable energy development.
Other Policies Policies and regulations that have been popular in many states include net metering, generation dis-closure, contractor licensing, equipment certifi cation, solar/wind access laws, construction and design standards, and government green power purchasing requirements. Financial incentives such as tax incen-tives, grants, loans, rebates, industry recruitment, and production incentives have also appealed to states.9
Net metering has been especially popular, with 36 states adopting the policy to date. This strategy allows utility customers to generate their own power with renewable energy generators and use the elec-trical grid as a backup. When the customer generates more power than needed, the excess fl ows into the grid, spinning the customer’s electric meter backward. The customer only pays for the net electricity con-sumed; customers who generate more power than they use are either compensated at the wholesale price of electricity or simply donate their excess power to the utility. Not all net metering policies are the same, how-ever. While most states specify the maximum size of a qualifying system, that size ranges widely from 10 to 1,000 kilowatts (kW). A few states have no size limit, which allows customers to install systems
sized according to their need. Rural schools, factories, and farms in Iowa, for example, have installed larger, more cost-effective wind turbines. California recently raised its maximum size from 10 kW to 1,000 kW. This change, combined with state incentives for customer-owned renewable energy systems and the recent electricity crisis, resulted in record numbers of net-metered solar and wind systems installed in the state in 2000 and 2001. While the technologies eligible for net metering also vary by state, wind and solar systems are eligible in most states. The rules (or lack thereof ) for con-necting renewable energy generators to the electrical grid also vary widely. The lack of interconnection standards has been a key barrier to the success of net metering in many states. Governors from fi ve states (Illinois, Maryland, New Jersey, New York, and Pennsylvania) have implemented minimum purchases to power govern-ment facilities partially with renewable energy. These voluntary purchases send an important message to consumers that state governments recognize the benefi ts of renewable energy and are willing to share directly in the responsibility of supporting their development. We do not, however, factor these goals into our grading criteria.
Customer Choice Millions of customers in 36 states now have the opportunity to support renewable energy directly through voluntary purchases (Wiser et al.,
9 For a comprehensive description of federal, state, and local policies and voluntary measures, see North Carolina Solar Center’s Database of State Incentives for Renewable Energy, online at www.dsireusa.org.
l Plugging In Renewable Energy: Grading the States l 23
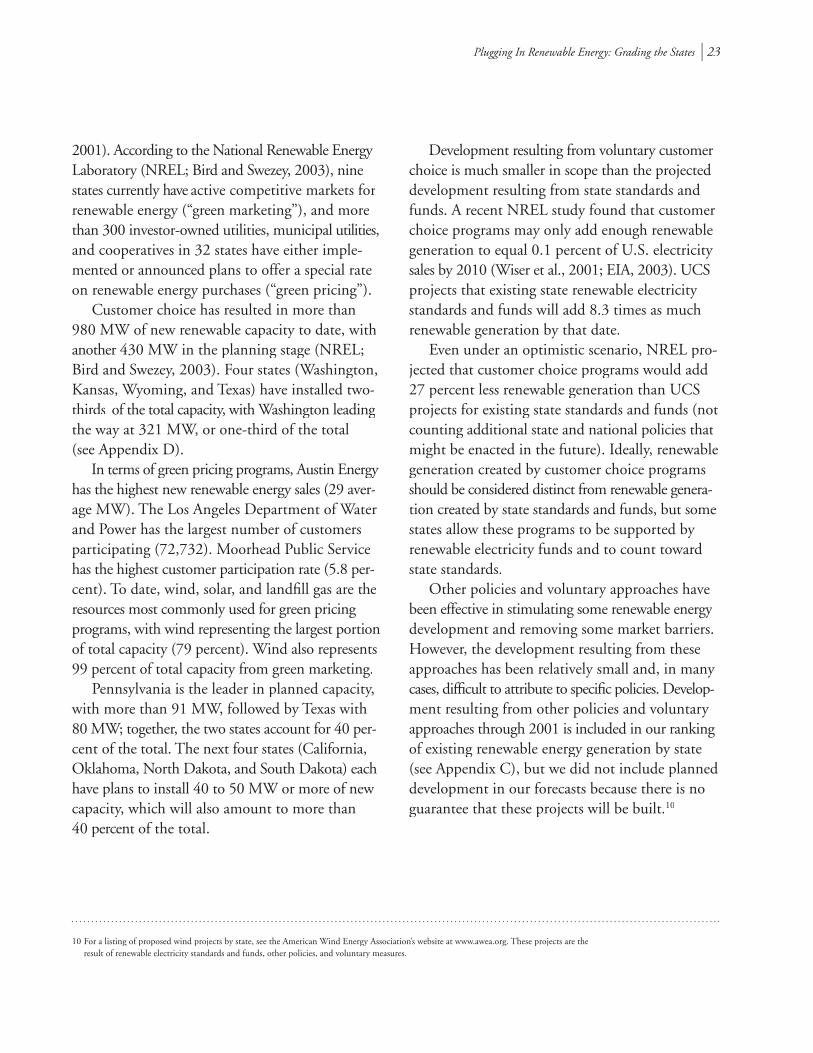
2001). According to the National Renewable Energy Laboratory (NREL; Bird and Swezey, 2003), nine states currently have active competitive markets for renewable energy (“green marketing”), and more than 300 investor-owned utilities, municipal utilities, and cooperatives in 32 states have either imple-mented or announced plans to offer a special rate on renewable energy purchases (“green pricing”). Customer choice has resulted in more than 980 MW of new renewable capacity to date, with another 430 MW in the planning stage (NREL; Bird and Swezey, 2003). Four states (Washington, Kansas, Wyoming, and Texas) have installed two-thirds of the total capacity, with Washington leading the way at 321 MW, or one-third of the total (see Appendix D). In terms of green pricing programs, Austin Energy has the highest new renewable energy sales (29 aver-age MW). The Los Angeles Department of Water and Power has the largest number of customers participating (72,732). Moorhead Public Service has the highest customer participation rate (5.8 per-cent). To date, wind, solar, and landfi ll gas are the resources most commonly used for green pricing programs, with wind representing the largest portion of total capacity (79 percent). Wind also represents 99 percent of total capacity from green marketing. Pennsylvania is the leader in planned capacity, with more than 91 MW, followed by Texas with 80 MW; together, the two states account for 40 per-cent of the total. The next four states (California, Oklahoma, North Dakota, and South Dakota) each have plans to install 40 to 50 MW or more of new capacity, which will also amount to more than 40 percent of the total.
10 For a listing of proposed wind projects by state, see the American Wind Energy Association’s website at www.awea.org. These projects are the result of renewable electricity standards and funds, other policies, and voluntary measures.
Development resulting from voluntary customer choice is much smaller in scope than the projected development resulting from state standards and funds. A recent NREL study found that customer choice programs may only add enough renewable generation to equal 0.1 percent of U.S. electricity sales by 2010 (Wiser et al., 2001; EIA, 2003). UCS projects that existing state renewable electricity standards and funds will add 8.3 times as much renewable generation by that date. Even under an optimistic scenario, NREL pro-jected that customer choice programs would add 27 percent less renewable generation than UCS projects for existing state standards and funds (not counting additional state and national policies that might be enacted in the future). Ideally, renewable generation created by customer choice programs should be considered distinct from renewable genera-tion created by state standards and funds, but some states allow these programs to be supported by renewable electricity funds and to count toward state standards. Other policies and voluntary approaches have been effective in stimulating some renewable energy development and removing some market barriers. However, the development resulting from these approaches has been relatively small and, in many cases, diffi cult to attribute to specifi c policies. Develop-ment resulting from other policies and voluntary approaches through 2001 is included in our ranking of existing renewable energy generation by state (see Appendix C), but we did not include planned development in our forecasts because there is no guarantee that these projects will be built.10
24 l Union of Concerned Scientists l
State Standards and Funds SummaryChapter 7
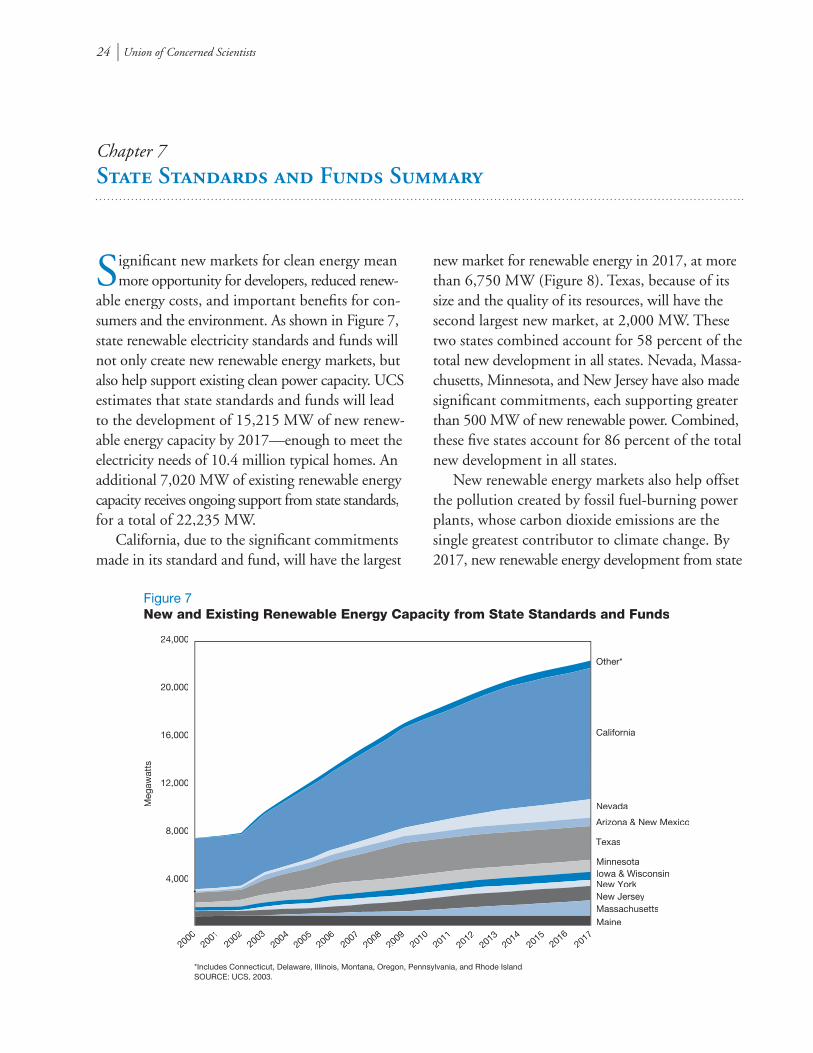
Signifi cant new markets for clean energy mean more opportunity for developers, reduced renew-
able energy costs, and important benefi ts for con-sumers and the environment. As shown in Figure 7, state renewable electricity standards and funds will not only create new renewable energy markets, but also help support existing clean power capacity. UCS estimates that state standards and funds will lead to the development of 15,215 MW of new renew-able energy capacity by 2017—enough to meet the electricity needs of 10.4 million typical homes. An additional 7,020 MW of existing renewable energy capacity receives ongoing support from state standards, for a total of 22,235 MW. California, due to the signifi cant commitments made in its standard and fund, will have the largest
new market for renewable energy in 2017, at more than 6,750 MW (Figure 8). Texas, because of its size and the quality of its resources, will have the second largest new market, at 2,000 MW. These two states combined account for 58 percent of the total new development in all states. Nevada, Massa-chusetts, Minnesota, and New Jersey have also made signifi cant commitments, each supporting greater than 500 MW of new renewable power. Combined, these fi ve states account for 86 percent of the total new development in all states. New renewable energy markets also help offset the pollution created by fossil fuel-burning power plants, whose carbon dioxide emissions are the single greatest contributor to climate change. By 2017, new renewable energy development from state
New York
24,000
20,000
16,000
12,000
8,000
4,000
20002001
20022003
20042005
20062007
20082009
20102011
20122013
20142015
20162017
Other*
California
Nevada
Arizona & New Mexico
Texas
MinnesotaIowa & Wisconsin
New JerseyMassachusettsMaine
Figure 7 New and Existing Renewable Energy Capacity from State Standards and Funds
*Includes Connecticut, Delaware, Illinois, Montana, Oregon, Pennsylvania, and Rhode Island.SOURCE: UCS, 2003.
Meg
awat
ts

l Plugging In Renewable Energy: Grading the States l 25
Figure 8 New Renewable Energy Capacity from State Standards and Funds by 2017
California
Texas
Nevada
Massachusetts
Minnesota
New Jersey
New York
New Mexico
Arizona
Wisconsin
Iowa
Illinois
Connecticut
Oregon
Pennsylvania
Rhode Island
Delaware
Montana
Maine*
2,000
0 1,000 2,000 3,000 4,000 5,000 6,000 7,000 8,000
Megawatts
1,399
1,243
983
496
332
318
295
246
240
99
36
12
8
7
4
SOURCE: UCS, 2003.
0
*As currently implemented, the ME RES does not support new renewable energy development.
742
6,753
standards and funds will reduce annual carbon emis-sions from power plants by an estimated 12.7 million metric tons (MMT). As shown in Figure 9, this is equivalent to taking 7.4 million cars off the road or planting 11.2 million acres of trees—an area approximately the size of Maryland and New Jersey combined. Although these carbon reductions alone are not likely to have a signifi cant impact on slowing climate change, the 19 states whose standards and funds are responsible for these reductions do represent a signifi cant portion of the national economy. Their willingness to support policy solutions to climate change sends an important signal to our nation’s capital and the rest of the world. If the federal government followed state leadership and enacted a national renewable electricity standard of 20 percent by 2020, it would reduce U.S. carbon emissions from power plants by nearly 150 MMT compared with business as usual in 2020 (UCS, 2002b). Implementing a national renewable electricity
fund and other policies to promote renewable energy and energy effi ciency in addition to an RES would reduce U.S. carbon emissions by more than two-thirds compared with business as usual (Clemmer et al., 2001).
14
12
10
8
6
4
2
0
Figure 9 Carbon Emission Reductions from New Renewable Energy Developed as a Result of State Standards and Funds, 2017
SOURCE: UCS, 2003.
12.7Million
Metric Tons of Carbon
11.2Million
Acres of Trees
or7.4
Million Cars

26 l Union of Concerned Scientists l
Grading State Renewable CommitmentsChapter 8
Commitments to renewable energy vary greatly from state to state. For renewable electricity
standards, UCS determined the variables that best reflect a state’s commitment are the rate at which the renewable target increases over time, ramp-up duration, and the extent to which the standard applies to all electricity suppliers in the states. The commit-ment represented by state funds varies according to the amount of funds available and how those funds promote the development and generation of a new renewable resource or support existing renewable facilities. Another indication of a state’s commitment is how much renewable generation it has previously supported and is still in operation today. We grade future commitments more highly, however, for contributing to continued environ-mental improvement and supporting the develop-ment of new, cleaner, and increasingly efficient technologies. RES proponents at state, federal, and international levels have long advocated an increase in renewable electricity sales of at least one percentage point per year. Several states, as well as the European Union, have already committed to this rate of increase, which should ensure the sustained orderly development of a mix of renewable energy technologies sufficient to achieve economies of scale and reduce costs. The goal is a gradual but steady transition to a more sustainable energy economy. The duration of renewable energy commit-ments is key to establishing the growing market that manufacturers and developers of renewable energy technologies and projects need to make long-term investments and obtain long-term financing. Since renewable energy projects generally have large up-
front costs for manufacturing and installation but very low operating costs and often zero fuel costs, the more favorable rates engendered by long-term commitments are critical in determining project costs. A commitment of 10 years or more maximizes opportunities and minimizes costs. Ideally, renewable electricity standards and funds should cover all electricity suppliers and, thereby, all electricity customers. Standards that apply to all companies and customers will lead to the largest increases in renewable energy and the fairest allocation of renewable energy costs and benefits. Unfortu-nately, many states have exempted publicly owned utilities (municipal utilities and rural cooperatives), despite the fact that these companies may have excellent renewable resource opportunities and access to financing at more favorable rates than investor-owned utilities or independent generators. Other states have applied their standards to some com-panies but not to others. While some subjectivity in grading is unavoidable, the criteria of higher rates of increase, longer ramp-up, and maximum customer coverage represent relatively simple, objective measures that can be used to com-pare state commitments on a level playing field. Many other criteria could have been used, such as new renewable generation or total renewable generation achieved by a certain date. Factors such as different start and end dates, however, make interpreting these comparisons difficult. The chosen criteria are likely to produce larger measurable increases in renewable generation over time, but they do not guarantee success. Numerous variables in the implementation of standards and funds will affect actual performance. Some standards

l Plugging In Renewable Energy: Grading the States l 27
State Grade Distinction
California A -
Nevada A -
New Mexico B+
Massachusetts B
Minnesota B
New Jersey C +
Alabama C
Arizona C
Connecticut C Most likely to improve
Hawaii C
Iowa C Most likely to improve
Maine C Most likely to improve
New Hampshire C
Texas C
Vermont C
Wisconsin C Most likely to improve
Arkansas D
Delaware D
Florida D
Georgia D
Idaho D
Illinois D Most likely to improve
Kansas D
Louisiana D
Michigan D
Mississippi D
Montana D
New York D Most likely to improve
North Carolina D
Oregon D
Pennsylvania D
Rhode Island D Most likely to improve
South Carolina D
Tennessee D
Virginia D
Washington D Most likely to improve
Wyoming D
Alaska F
Colorado F Most likely to improve
Indiana F
Kentucky F
Maryland F Most likely to improve
Missouri F Hall of Shame
Nebraska F Hall of Shame
North Dakota F Hall of Shame
Ohio F
Oklahoma F Hall of Shame
South Dakota F Hall of Shame
Utah F Hall of Shame
West Virginia F
Table 10 Renewable Energy Report Card
have relatively simple designs that maximize cost-effective renewable generation; others are designed to achieve multiple objectives and will be more difficult to realize. All involve implementation or enforcement decisions that may preclude or limit a state’s ability to achieve its projected results. We briefly describe some of the primary implementation challenges for each state in the discussion below. Detailed comparison of state implementation, how-ever, is beyond the scope of this report, particularly since many state efforts are in the early stages.11
Passing Grades Grade A. The highest grade, a straight A, was reserved for states that have standards or funds pro-jected to achieve a rate of increase of one percentage point per year, last at least 10 years, and cover all customers. Unfortunately, no state achieved a straight A. UCS assigned A- grades to two states (California and Nevada) that meet the fi rst two criteria, and apply to at least two-thirds of the electricity sales in each state (Table 10). It should be noted that both states face many obstacles to successful implementation. California’s standard has a particularly complex design that requires a high degree of regulatory oversight to determine the proper allocation of renewable energy costs between regulated utilities and the state’s renewable electricity fund. Nevada utilities have been hampered by credit diffi culties. Grade B. UCS assigned B grades to states with standards or funds that achieve a rate of increase of at least 0.5 percent per year, last at least fi ve years, and cover suppliers serving most customers. Three states qualifi ed: New Mexico, Massachusetts, and Minnesota. New Mexico received a B+ because its stan-dard increases at an average rate of 1.1 percent per
11 For a more detailed discussion of implementation issues, see Nogee et al., 1999. For a detailed comparison of early-stage implementation decisions in Texas, see Wiser and Langniss, 2003.

28 l Union of Concerned Scientists l
year for nine years. Because it was implemented through regulation rather than legislation, it does not cover publicly owned utilities or utilities covered by all-requirements contracts, which account for nearly 40 percent of electricity sales in the state. An additional provision penalizes wind power, which could reduce total new development.12
Utility companies and industrial customers are still challenging the standard. The Massachusetts standard ramps up at an average of about 0.6 percent per year for the fi rst seven years (2003–2009), then continues increasing indefi nitely by one percentage point per year until a date determined by the Massachusetts Division of Energy Resources. It therefore averages 0.8 percent per year through 2017. Massachusetts perhaps deserves extra credit for having the only state standard with an indefi nite one percentage point per year increase, but this increase is less certain than other standards. Minnesota, as previously described, has a unique standard that covers only one company but still accounts for more than half of the state’s electricity sales. While its requirement has been specifi ed in terms of megawatts of capacity, the rate of increase amounts to almost 0.8 percent per year of Xcel’s electricity sales for a 12-year period. Grade C. UCS assigned a C grade to states with projected increases of at least 0.2 percent per year for at least fi ve years, and whose standards cover suppliers serving most customers. States also received a C grade if they did not meet this minimum ramp-up requirement but have a commitment to make new renewable energy more than one percent of total retail sales in 2017. States whose existing renewable resources provide fi ve percent or more of retail sales also received C grades.
Under these criteria, one state—New Jersey—received a grade of C+. The New Jersey standard averages a 0.3 percent per year increase over 10 years, ramping up to 0.5 percent per year in the fi nal six years. Though it does not cover publicly owned utilities, these companies represent an insignifi cant fraction of electricity sales in the state. Governor McGreevey also supports the recommendation made recently by a Renewable Energy Task Force he commissioned to double the current standard. Ten states received a straight C. Iowa, Texas, Wis-consin, and Arizona each have qualifying renewable electricity standards. While their ambitions in terms of percentage of sales are relatively low, Texas and Wisconsin have both made excellent starts in imple-menting their standards, and the Texas standard, because of the size of the market, is particularly important to the industry. Both states have reasonable prospects for increasing their standards in the future, with Wisconsin Governor Doyle having proposed raising the minimum target to 10 percent by 2013. In Iowa, MidAmerican Energy recently headed off a bill for a 10 percent standard by 2010 by announcing plans to build a 310 MW wind farm. Connecticut received a C because its strong renewable electricity fund will support new renewable energy generation of more than one percent of total electricity sales by 2017. Alabama, Hawaii, Maine, New Hampshire, and Vermont qualifi ed for C grades based on their level of existing renewable energy generation.
Failing Grades States receiving a grade of D or F do not pass the test of using their available renewable resources today or making commitments to do so in the future. States with a commitment to new renewable energy
12 Under New Mexico’s RES, renewable energy developers receive one credit per kilowatt-hour generated by wind power, three credits for solar, and two credits for all other eligible resources.

l Plugging In Renewable Energy: Grading the States l 29
below one percent of total retail sales in 2017 or with existing renewable generation between one and fi ve percent today received a D grade. States with no commitment to future renewable energy development whatsoever and low levels of existing renewable energy (below one percent of sales) received an F grade.
Special Distinctions Most Likely to Improve. UCS also identifi ed those states likely to receive a higher grade in the future if a renewable standard has been proposed or improvements to an existing standard are under consideration.
Hall of Shame. Many states that received a failing grade have enough renewable energy potential to generate between 2 and 200 times their current electricity use. These states’ lack of commitment to renewable energy through a renewable electricity standard or fund is truly a shame. Overall, only 16 states received a passing grade of C or better. The great majority of states—34—received a D or F. UCS nominated six of the failing states to its Hall of Shame and recognized 10 states where signifi cant improvement can be expected if proposed development or policies bear fruit.
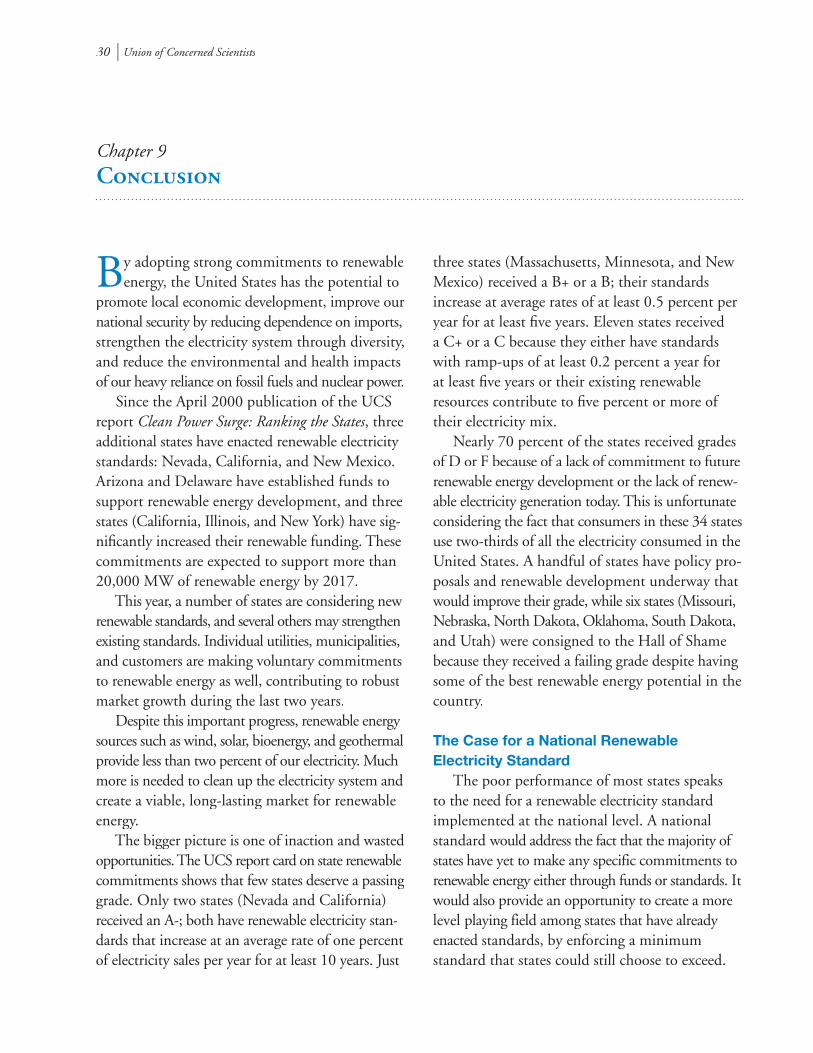
30 l Union of Concerned Scientists l
ConclusionChapter 9
By adopting strong commitments to renewable energy, the United States has the potential to
promote local economic development, improve our national security by reducing dependence on imports, strengthen the electricity system through diversity, and reduce the environmental and health impacts of our heavy reliance on fossil fuels and nuclear power. Since the April 2000 publication of the UCS report Clean Power Surge: Ranking the States, three additional states have enacted renewable electricity standards: Nevada, California, and New Mexico. Arizona and Delaware have established funds to support renewable energy development, and three states (California, Illinois, and New York) have sig-nifi cantly increased their renewable funding. These commitments are expected to support more than 20,000 MW of renewable energy by 2017. This year, a number of states are considering new renewable standards, and several others may strengthen existing standards. Individual utilities, municipalities, and customers are making voluntary commitments to renewable energy as well, contributing to robust market growth during the last two years. Despite this important progress, renewable energy sources such as wind, solar, bioenergy, and geothermal provide less than two percent of our electricity. Much more is needed to clean up the electricity system and create a viable, long-lasting market for renewable energy. The bigger picture is one of inaction and wasted opportunities. The UCS report card on state renewable commitments shows that few states deserve a passing grade. Only two states (Nevada and California) received an A-; both have renewable electricity stan-dards that increase at an average rate of one percent of electricity sales per year for at least 10 years. Just
three states (Massachusetts, Minnesota, and New Mexico) received a B+ or a B; their standards increase at average rates of at least 0.5 percent per year for at least fi ve years. Eleven states received a C+ or a C because they either have standards with ramp-ups of at least 0.2 percent a year for at least fi ve years or their existing renewable resources contribute to fi ve percent or more of their electricity mix. Nearly 70 percent of the states received grades of D or F because of a lack of commitment to future renewable energy development or the lack of renew-able electricity generation today. This is unfortunate considering the fact that consumers in these 34 states use two-thirds of all the electricity consumed in the United States. A handful of states have policy pro-posals and renewable development underway that would improve their grade, while six states (Missouri, Nebraska, North Dakota, Oklahoma, South Dakota, and Utah) were consigned to the Hall of Shame because they received a failing grade despite having some of the best renewable energy potential in the country.
The Case for a National Renewable Electricity Standard The poor performance of most states speaks to the need for a renewable electricity standard implemented at the national level. A national standard would address the fact that the majority of states have yet to make any specific commitments to renewable energy either through funds or standards. It would also provide an opportunity to create a more level playing field among states that have already enacted standards, by enforcing a minimum standard that states could still choose to exceed.

l Plugging In Renewable Energy: Grading the States l 31
Bills proposing a strong national renewable electricity standard were introduced both last year and this year in the U.S. House and Senate. These bills envision a national policy to increase America’s use of renewable energy to 20 percent of electricity supplies by 2020 or 2025. UCS found that by increasing our use of renewable energy one percent a year through 2020, the United States can meet a significant portion of its electricity needs with renew-able energy while generating substantial economic and environmental benefits (UCS, 2002b). Such a standard would increase our total home-grown renewable power to more than 170,000 MW by 2020. America’s strong winds, significant bio-energy resources, and geothermal energy would power the majority of this development.
In terms of economic benefi ts, this standard would produce:
• $80 billion in new capital investment13
• $5 billion in new property tax revenues for local communities
• $1.2 million in wind power-related lease payments to farmers and rural landowners
• More than double our use of homegrown bioenergy fuels, providing billions in income for farmers
UCS also found that a 20 percent standard by 2020 would reduce long-term energy costs to consumers. Increased competition from renewable energy would result in natural gas prices nine percent lower than business as usual in 2020, which more than offsets the slightly higher costs of generating renewable energy. Thus, total annual consumer energy bills (not including transportation) would be $4.8 billion, or one percent lower, in 2020. The
present value of total consumer savings would be $4.5 billion between 2002 and 2020. In addition, the increased use of renewable energy in the United States would help reduce air pollution. Power plant emissions of carbon dioxide, which fuels global warming, would be 19 percent lower nation-wide by 2020 with a national renewable electricity standard. Other pollutants that harm human health would also be reduced, as would the damage to water and land resulting from extraction, transport, and use of fossil fuels.
While neither the Senate nor the House has yet supported a 20 percent standard by 2020, the Senate did pass an energy bill in 2002 that contained the fi rst-ever national renewable electricity standard. This standard would have required major electric companies to increase sales of renewable electricity by an average of 0.6 percent a year starting in 2005 and reaching 10 percent by 2019. UCS analysis found that this standard would have produced the following benefi ts:
• more than 74,000 MW of renewable power;
• $17 billion in new capital investment;14
• $1.2 billion in new property tax revenues for local communities;
• $410 million in wind power-related lease payments to farmers and rural landowners;
• $3.8 billion in annual savings on consumer energy bills in 2020;
• cumulative savings on consumer energy bills of $7.8 billion between 2002 and 2020; and
• reductions of approximately 27 million metric tons of annual carbon emissions by 2020 (UCS, 2002).
13 Results presented are in 1999 dollars. Cumulative results are in net present value using a fi ve percent real discount rate.
14 Results presented are in 2000 dollars. Cumulative results are in net present value using an eight percent real discount rate.

32 l Union of Concerned Scientists l
Our fi ndings are similar to those of the U.S. Energy Information Administration’s analyses of a 20 percent RES by 2020 and a 10 percent RES by 2020. The EIA found that a 10 percent standard without an end date would create cumulative net present value savings for energy consumers of $13.2 billion through 2020. Increasing the stan-dard to 20 percent by 2020 would result in greater diversity as well as environmental and economic benefi ts, and would provide consumers with $5.7 billion in total savings through 2020 (EIA, 2002; EIA 2001b).
Most states are making insuffi cient commit-ments to renewable energy, leaving far too much of the nation’s renewable energy potential un-tapped. Increasing renewable energy development to the level needed to ensure a clean, diverse, secure, and independent electricity system is not a task not a task notbest left to individuals and a handful of states. We need a strong national policy with specifi c goals for making renewable energy a key element of the U.S. electricity system, with the fl exibility for states and individual consumers to contribute more.

l Plugging In Renewable Energy: Grading the States l 33
References
American Wind Energy Association (AWEA). 2003. Wind Projects Database. Online at www.awea.org/projects/index.html.
Bailie, A., S. Bernow, P. Castelli, B. O’Connor, and J. Romm. 2003. The Path to Carbon-Dioxide-Free Power: Switching to Clean Energy in the Utility Sector. Washing-ton, D.C.: World Wildlife Fund. April. Online at www.worldwildlife.org/powerswitch/power_switch.pdf.
Bird, L. and B. Swezey. 2003. “Estimates of Renewable Energy Developed to Serve Green Power Markets in the United States,” National Renewable Energy Laboratory, Green Power Network. February. Online at www.eere. energy.gov/greenpower/new_gp_cap.shtml.
Clemmer, S., D. Donovan, A. Nogee, and J. Deyette. 2001. Clean Energy Blueprint: A Smarter National Energy Policy for Today and the Future. Cambridge, Mass.: Union of Concerned Scientists.
Clemmer, S., B. Paulos, and A. Nogee. 2000. Clean Power Surge: Ranking the States. Cambridge, Mass.: Union of Concerned Scientists.
Doherty, J. 1995. “U.S. Wind Energy Potential: The Effect of the Proximity of Wind Resources to Transmission Lines,” Monthly Energy Review. Washington, D.C.: U.S. Department of Energy, Energy Information Administration.
Electric Power Research Institute and U.S. Department of Energy (EPRI/DOE). 1997. Renewable Energy Technology Characterizations. EPRI TR-109496. Washington, D.C.: U.S. Department of Energy. December.
Elliott, D., L. Wendell, and G. Gower. 1991. An Assessment of the Windy Land Area and Wind Energy Potential in the Contiguous United States. Richland, Wash.: U.S. Department of Energy, Pacific Northwest Laboratory.
Energy Information Administration (EIA). 2003. Annual Energy Outlook 2003. Washington, D.C.: U.S. Department of Energy. January. Online at www.eia.doe. gov/oiaf/aeo/pdf/0383(2003).pdf.
Energy Information Administration (EIA). 2002. Impacts of a 10-Percent Renewable Portfolio Standard. SR/OIAF/ of a 10-Percent Renewable Portfolio Standard. SR/OIAF/ of a 10-Percent Renewable Portfolio Standard2002-03. February. Online at www.eia.doe.gov/oiaf/servicerpt/rps/pdf/sroiaf(2002)03.pdf.
Energy Information Administration (EIA). 2002b. Renewable Energy Annual 2001. Washington, D.C.: U.S. Department of Energy. November. Online at www.eia.doe.gov/cneaf/solar.renewables/page/rea_data/rea.pdf.
Energy Information Administration (EIA). 2002c. National Energy Modeling System 2002. For more information on the National Energy Modeling System, see the EIA website at www.eia.doe.gov/oiaf/aeo.html.
Energy Information Administration (EIA). 2002d. Geothermal Electric Sub-module, Renewable Fuels Module, National Energy Modeling System 2002. Washington, D.C.: U.S. Department of Energy. Online at tonto.eia. doe.gov/FTPROOT/modeldoc/m069(2002).pdf.
Energy Information Administration (EIA). 2001. U.S. Natural Gas Markets: Mid-Term Prospects for Natural Gas Supply. SR/OAIF/2001-06. Washington, D.C.: U.S. Department of Energy.
Energy Information Administration (EIA). 2001b. Analysis of Strategies for Reducing Multiple Emissions from Electric Power Plants: Sulfur Dioxide, Nitrogen Oxides, Carbon Dioxide, and Mercury and a Renewable Portfolio Standard, SR/OIAF/2001-03. June. Online at www.eia. doe.gov/oiaf/servicerpt/epp/pdf/sroiaf(2001)03.pdf.
Gallup Organization. 2001. “Energy Crisis: Americans Lean toward Conservation Over Production.” Princeton, New Jersey: Gallup Organization. May.
George, R., and E. Maxwell. 1999. “High-Resolution Maps of Solar Collector Performance Using Climato-logical Solar Radiation Model,” Proceedings of the 1999 Annual Conference, Portland, Maine: American Solar Energy Society.

34 l Union of Concerned Scientists l
Hochschild, D., and A. Hochschild. 2001. “Hooray for the Red, White, Blue and Green,” Los Angeles Times. Page 2, November 11.
Interlaboratory Working Group (IWG). 2000. Scenarios for a Clean Energy Future (Oak Ridge, Tenn.: Oak for a Clean Energy Future (Oak Ridge, Tenn.: Oak for a Clean Energy FutureRidge National Laboratory and Berkeley, Calif.: Lawrence Berkeley National Laboratory), ORNL/CON-476 and LBNL-44029. November. Online at www.ornl.gov/ORNL/Energy_Eff/CEF.htm.
Land and Water Fund of the Rockies (LWF), North-west Sustainable Energy for Economic Development, and GreenInfo Network. 2002. Renewable Energy Atlas of the West: A Guide to the Region’s Resource Potential. Atlas of the West: A Guide to the Region’s Resource Potential. Atlas of the West: A Guide to the Region’s Resource PotentialBoulder, Colo.: Land and Water Fund of the Rockies. July. Online at www.energyatlas.org.
Maxwell, E., R. George, and S. Wilcox. 1998. “A Clima-tological Solar Radiation Model,” Proceedings of the 1998 Annual Conference, Albuquerque, New Mexico: American Solar Energy Society.
Mellman Group. 2002. “Public Attitudes Toward Energy and the Arctic.” February.
National Renewable Energy Laboratory (NREL). 1997.Customer-Sited Photovoltaics: Focusing on Markets that Really Shine. A Study Highlighting the Best Markets in the United States for Grid-Connected Photovoltaic Systems. DOE/GO-10097-371, DE97000220. Washington, D.C.: U.S. Department of Energy.
Natural Resources Defense Council. 2003. “New Mexico Polling Data on Water and Electricity”. Washington, D.C.: Greenberg Quinlan Rosner Research. February.
Nogee, A., S. Clemmer, B. Paulos, and B. Haddad. 1999. Powerful Solutions: 7 Ways to Switch America to Renewable Electricity. Cambridge, Mass.: Union of Concerned Scientists.
North Carolina Solar Center. 2003. Database of State Incentives for Renewable Energy (DSIRE). Online at www.dsireusa.org.
Peterson, J. 2002. “State Programs Promote Renewable Energy: New York Power Naturally,” Northeast Sun30 (3). Summer.
Union of Concerned Scientists (UCS). 2002. Renewing Where We Live: A National Renewable Energy Standard Will Benefit America’s Economy. Cambridge, Mass.: Union of Concerned Scientists. September. Online at www. ucsusa.org/publication.cfm?publicationID=496.
Union of Concerned Scientists (UCS). 2002b. Renewing Where We Live: A National Renewable Energy Standard Will Benefit America’s Economy. Cambridge, Mass.: Union of Concerned Scientists. February. Online at www.ucsusa. org/publication.cfm?publicationID=349.
U.S. Department of Energy, Office of Energy Efficiency and Renewable Energy (DOE). 2003. Renewable Electric Plant Information System (REPIS) Version 6.0. Online at www.eere.energy.gov/repis.
U.S. Environmental Protection Agency (EPA). 2002. Landfill Methane Outreach Program Database. November. Online at www.epa.gov/lmop/projects/projects.htm.
U.S. Public Interest Research Group (USPIRG). 2003. Generating Solutions: How Clean, Renewable Energy Is Boosting Local Economies and Saving Consumers Money. Washington, D.C.: U.S. Public Interest Research Group. Online at www.uspirg.org/reports/generatingsolutions2003/ fullreport.pdf.
Walsh, M., R. Perlack, A. Turhollow, D. de la Torre Ugarte, D. Becker, R. Graham, S. Slinsky, and D. Ray. 2000. Biomass Feedstock Availability in the United States: 1999 State Level Analysis. Oak Ridge, Tenn.: Oak Ridge National Laboratory. Online at www.bioenergy.ornl.gov/pubs/econ_assess.html.
Wiser, R., M. Bolinger, L. Milford, M. Stoddard, and K. Porter. 2002. Clean Energy Funds: An Overview of State Support for Renewable Energy. LBNL-48189. Berkeley, Calif.: Lawrence Berkeley National Laboratory, U.S. Department of Energy. Online at eetd.lbl.gov/ea/EMS/EMS_pubs.html#RE.
Wiser, R., M. Bolinger, E. Holt, and B. Swezey. 2001. Forecasting the Growth of Green Power Markets in the United States. LBNL-48611. Berkeley, Calif.: Lawrence Berkeley National Laboratory, U.S. Department of Energy.
Wiser, R., and O. Langniss. 2003. “The Renewables Portfolio Standard in Texas: An Early Assessment,” Energy Policy 31:527-535.Energy Policy 31:527-535.Energy Policy

l Plugging In Renewable Energy: Grading the States l 35
Methodology and AssumptionsAppendix A
The methodology and assumptions we used to rank states by renewable energy potential,
existing renewable energy generation, and the impact of renewable energy standards and funds are described below.
Renewable Energy Technical Potential We estimated renewable energy potential by resource and state using data from several existing studies completed by the U.S. Department of Energy (DOE) and the national energy laboratories. In some cases, we made adjustments to these data to incorpor-ate more recent information. The assumptions and data sources used in this report to calculate wind, bio-energy, geothermal, and solar energy potential follow. Solar. We estimated the technical potential for solar power using the same method developed for the Renewable Energy Atlas of the West (LWF, 2002). Renewable Energy Atlas of the West (LWF, 2002). Renewable Energy Atlas of the WestFirst, we obtained data on average solar insolation by state from the Climatological Solar Radiation (CSR) model developed by NREL (George and Maxwell, 1999; Maxwell et al., 1998). Second, we assumed electricity would be generated from distri-buted solar photovoltaic (PV) panels installed on rooftops and open spaces covering 0.5 percent of the total land area of each state. Third, we assumed solar panels would occupy 30 percent of the total area, with the remainder taken up by supporting infrastructure. Fourth, we assumed an average system effi ciency of 10 percent for converting solar energy to electricity. This is conservative considering the fact that crystalline silicon PV modules have demonstrated effi ciencies as high as 22.7 percent under laboratory
conditions. However, commercial systems typically have much lower overall effi ciencies on average (LWF, 2002). We did not include the potential from concen-trating solar PV or centralized solar thermal systems, which have considerably higher effi ciencies than distributed PV and would result in a higher potential. And, like the other renewable resources and techno-logies discussed above, the potential for solar power represents a theoretical potential using fairly simple constraints, and does not consider the economic viability of installing these systems. A 1996 NREL study found that economic factors such as retail electric rates, tax credits and incentives, fi nancing options, net metering, and correlation to peak demand are important in determining the most cost-effective locations for solar power (NREL, 1997). Wind. We used data on windy land area by state that was developed by the Pacifi c Northwest Labora-tory (PNL; Elliot et al., 1991) and subsequently revised by the Energy Information Administration (EIA; Doherty, 1995) and NREL. The data, which include windy land area by state for class 3 and higher wind resources within 20 miles of existing trans-mission lines, are based on PNL’s “environmental and moderate land use” scenario. This excludes all urban and environmentally sensitive areas15, 50 percent of forest land, 30 percent of agricultural land, and 10 percent of range and barren land. We further re-duced the windy land area by approximately 40 percent in mountainous states and 20 percent in other states to account for additional siting and land-use restrictions not included in the original data.
15 Includes parks, monuments, U.S. Forest Service lands, wilderness areas, wildlife refuges, and wetlands.

36 l Union of Concerned Scientists l
We converted windy land area into wind power capacity by assuming a wind density of 6.7 MW per square kilometer based on data from EIA (EIA, 2002c). We converted capacity into generation using capacity factors for different wind classes based on data from the Electric Power Research Institute (EPRI, 1997). Studies by EIA, the Renewable Energy Atlas of the West, and others have only included class 4 and the West, and others have only included class 4 and the Westhigher wind resources. We decided to include class 3 resources in this study because the DOE expects these areas could become economically viable in the next 10 to 20 years, as research and develop-ment—along with growth in the global market—improves performance and lowers the cost of wind power. In fact, class 3 wind areas are already being developed in Wisconsin and Illinois, as well as in countries such as Germany and Denmark. Bioenergy. State bioenergy potential is based on data from Oak Ridge National Laboratory (ORNL; Walsh et al., 2000). Bioenergy resources include mill, forest, crop, and urban wood residues and energy crops such as switchgrass, hybrid poplars, and willows. ORNL only includes resources available for less than $50 per dry ton including transportation costs. For mill residues, ORNL only includes residues not currently being used for energy. For forest residues, ORNL only includes logging residues and dead wood, and excludes roadless areas, steep slopes, and small living trees. More than half of the remaining residues are also excluded to ensure suffi cient residues remain for forest health and sustainability. For urban wood residues, ORNL excludes contaminated wastes. For crop residues, ORNL only includes corn stover and wheat straw, and assumes 60 to 70 percent of the residues are left on the land to maintain soil quality and prevent erosion. Energy crop production assumes recommended management practices and is limited to areas climatically suited for production and do not require irrigation, which excludes all 11 western states. We estimated the amount of energy that could be produced from bioenergy using ORNL’s standard assumptions about the heating value of different
resources. We then calculated the amount of electric capacity and generation using an average heat rate of 10,800 Btu/kWh, assuming bioenergy would be co-fi red with coal in existing plants or used in new biomass gasifi cation plants. Geothermal. State geothermal potential is based on data for 51 specifi c sites in nine western states included in EIA’s National Energy Modeling System (EIA, 2002d). These data only include high-temper-ature geothermal sites suitable for electric power generation. Landfill gas. State landfi ll gas potential is based on data for all landfi lls included in the U.S. Environ-mental Protection Agency’s Landfi ll Methane Out-reach Program database (EPA, 2002). We estimated the potential for producing electricity at sites in which the EPA did not include a capacity estimate by assuming one megawatt of capacity per million tons of waste in place. The government studies we used for wind and geothermal energy, which were completed in the late 1980s and early 1990s, are in need of updating. While progress has been made in updating the potential for these technologies in some states, updates have not been completed for all states. For example, a 2002 study by the Land and Water Fund of the Rockies and other groups estimated the renewable energy potential for 11 western states, including new wind resource assessments for seven of the states (LWF, 2002). These new assessments, which used more sophisticated models and different criteria and assumptions for defi ning potential than the older national assessment, result in a higher potential. The study also used slightly different assumptions for bioenergy and geothermal energy potential, excluding some of the technical potential that the national studies show are available in the West and other states. Since we are ranking the renewable energy potential for all 50 states, we decided to use the comprehensive national assessments identifi ed above so we could apply a consistent methodology across all states.

l Plugging In Renewable Energy: Grading the States l 37
Existing Renewable Energy Generation We used data from EIA to identify existing renewable energy generation and capacity by state for the year 2000 (EIA, 2002b). We then updated these data to the year 2001 by making two adjust-ments. First, we added new wind projects installed in 2001 as reported by the American Wind Energy Association (AWEA, 2003) to account for the record-breaking 66 percent growth in total U.S. installed wind capacity that year. We estimated the generation from these sites by using average capacity factors for different wind classes representative of current projects. Second, we replaced EIA’s data that combine landfi ll gas and municipal solid waste (MSW) incine-ration with data on landfi ll gas capacity installed through 2001 from the DOE’s Renewable Electric Plant Information System (DOE, 2002) and the EPA’s Landfi ll Methane Outreach Program database (EPA, 2002).
The Impact of Renewable Electricity Standards and Funds To estimate the effects of renewable electricity standards and funds in each state, we have attempted to refl ect state-specifi c conditions by collecting information from each state’s laws and rules and its experience to date. Nonetheless, there are several uncertainties in the estimates. Many states, for example, are in the initial stages of implementing their policies, and it is not clear what the mix of technologies will be, how states will spend their funds, and whether any adjustments will be made to the policies over time. Since most of the standards rely on market-based decisions, the results are impossible to know in advance with precision. For renewable electricity standards, we calculated expected growth in electricity sales for companies covered by each state’s standards. This was done by either using the average annual growth rate over the past 10 years based on data from EIA or forecasts
made by state public utility commissions or utilities. To determine ramp-up rates, we calculated the average annual rate of increase in new renewable energy development from the start date of the ramp-up to either the end date or 2017, whichever was sooner. To estimate renewable generation in each state, we applied covered electricity sales by state and year to the scheduled increase in renewable energy targets. To estimate renewable capacity in each state, we used average capacity factors for different technol-ogies where we had information on the actual or expected mix of technologies. For states where we did not have this information, we used an average capacity factor of 50 percent to represent a mix of base load (biomass, landfi ll gas, and geothermal) and variable output (wind and solar) technologies. Finally, we calculated renewable generation and capacity for both existing and new facilities as defi ned in each state’s standard. The effects of renewable electricity funds were more diffi cult to calculate. This is because states may target their funds in different ways, including large-scale auctions, consumer education, green marketing, research and development, venture capital, and emerging technologies. In a few states, where projects have been developed as a result of the funds, we used actual data. In the other states, we assumed that new renewable energy projects would require a long-term above-market payment of two cents per kWh to be competitive. We believe this value is conservative based on actual experience in states such as New York and California that have spent some of their funds. Given the different ways that states may spend their funds, however, we view this value as highly uncertain.

38 l Union of Concerned Scientists l
Renewable Energy* Potential Ranking (as a Percent of Total 2001 Electricity Sales)
Appendix B
Rank StatePercent of Total 2001 Electricity Sales
Total Wind Biomass Solar Geothermal Landfill Gas
1 North Dakota 18,611% 17,722% 339% 550% 0%
2 South Dakota 16,781% 15,779% 289% 712% 0%
3 Montana 10,977% 9,913% 96% 967% 1%
4 Wyoming 8,432% 7,807% 18% 607% 0%
5 Nebraska 6,247% 5,863% 133% 250% 1%
6 Kansas 5,356% 5,073% 92% 190% 1%
7 Iowa 2,674% 2,438% 128% 107% 1%
8 Oklahoma 2,524% 2,367% 39% 117% 1%
9 New Mexico 2,279% 1,661% 9% 581% 27% 1%
10 Minnesota 1,940% 1,785% 55% 100% 1%
11 Colorado 1,542% 1,283% 13% 202% 41% 4%
12 Idaho 743% 327% 56% 313% 47% 0%
13 Texas 650% 568% 10% 72% 1%
14 Nevada 531% 91% 2% 357% 80% 1%
15 Utah 486% 112% 5% 324% 43% 1%
16 Oregon 374% 125% 37% 166% 46% 1%
17 Vermont 302% 159% 30% 112% 0%
18 Maine 288% 82% 30% 176% 0%
19 Wisconsin 244% 149% 36% 58% 1%
20 Missouri 241% 121% 42% 76% 1%
21 Arkansas 209% 58% 52% 99% 0%
22 Arizona 195% 12% 3% 170% 9% 1%
23 New Hampshire 173% 70% 32% 59% 2%
24 Washington 159% 73% 22% 60% 3% 0%
25 Illinois 154% 84% 37% 30% 2%

l Plugging In Renewable Energy: Grading the States l 39
* Renewable energy resources included here are wind, bioenergy, geothermal, landfill gas, and solar photovoltaics. Hydropower resources are not included in this estimate. Data not available for Alaska and Hawaii.
SOURCES: For wind, UCS estimate based on a state breakout of data developed for Doherty, J., “U.S. Wind Energy Potential: The Effect of the Proximity of Wind Resources to Transmission Lines,” Monthly Energy Review, Energy Information Administration, February 1995. For bioenergy, UCS estimates based on data from Walsh, M. et al., Biomass Feedstock Availability in the United States: 1999 State Level Analysis, Oak Ridge National Laboratory (updated 2000), available online at: bioenergy.ornl.gov/pubs/econ_assess. html. For solar, UCS estimate based on solar radiation data from National Renewable Energy Laboratory, 2002, using assumptions in the Renewable Energy Atlas of the West, July 2002, available online at: www.energyatlas.org. For geothermal, Energy Information Administration, National Energy Modeling System, 2002. For landfill gas, UCS estimates based on data from the U.S. Environmental Protection Agency, Landfill Methane Outreach Program database, available online at: www.epa.gov/lmop/projects/projects.htm.
26 California 150% 38% 7% 56% 46% 4%
27 Mississippi 150% 0% 64% 85% 0%
28 Michigan 132% 77% 18% 36% 1%
29 West Virginia 120% 38% 22% 60% 0%
30 New York 110% 76% 10% 22% 2%
31 Massachusetts 88% 73% 5% 10% 1%
32 Alabama 88% 0% 36% 52% 1%
33 Pennsylvania 86% 54% 9% 22% 1%
34 Louisiana 70% 0% 24% 45% 1%
35 Indiana 67% 10% 29% 26% 1%
36 Delaware 65% 45% 6% 13% 1%
37 Georgia 63% 1% 22% 40% 0%
38 Virginia 61% 15% 15% 30% 1%
39 Tennessee 61% 3% 25% 33% 1%
40 Kentucky 61% 1% 22% 37% 1%
41 South Carolina 53% 1% 20% 32% 0%
42 North Carolina 53% 5% 15% 32% 1%
43 Connecticut 52% 36% 5% 11% 1%
44 Ohio 43% 4% 19% 18% 1%
45 New Jersey 34% 23% 2% 7% 2%
46 Florida 31% 0% 8% 22% 1%
47 Rhode Island 28% 12% 3% 9% 4%
48 Maryland 27% 10% 5% 11% 1%
U.S. Total 561% 459% 24% 71% 6% 1%
Rank StatePercent of Total 2001 Electricity Sales
Total Wind Biomass Solar Geothermal Landfill Gas
Appendix B continued

40 l Union of Concerned Scientists l
State Ranking of Renewable Energy* Generation as a Percent of Total Sales, 2001
Appendix C
Rank StateRenewable Energy
Generation as a Percent of Sales
1 Maine 28.4%
2 Hawaii 11.4%
3 California 10.3%
4 New Hampshire 10.1%
5 Vermont 7.3%
6 Alabama 5.5%
7 Nevada 5.3%
8 Louisiana 4.2%
9 Arkansas 4.1%
10 Mississippi 4.1%
11 Wyoming 3.5%
12 Georgia 2.8%
13 Washington 2.8%
14 Minnesota 2.7%
15 Oregon 2.6%
16 Idaho 2.5%
17 Michigan 2.5%
18 Iowa 2.3%
19 Virginia 2.0%
20 South Carolina 1.9%
21 Florida 1.8%
22 Wisconsin 1.8%
23 North Carolina 1.6%
24 Rhode Island 1.6%
25 Texas 1.5%
* Renewable energy resources included here are solar, wind, bioenergy, geothermal, and landfill gas. Hydropower is not included in this estimate.SOURCES: For solar, geothermal, and wood/waste: U.S. Energy Information Administration, Renewable Energy Annual 2001, DOE/EIA-0603(2001), November 2002. Available online at: www.eia.doe.gov/cneaf/solar.renewables/page/rea_data/rea_sum.html. For other bioenergy (energy crops/waste sludge), UCS estimate based on U.S. Department of Energy, Office of Energy Efficiency and Renewable Energy, Renewable Electric Plant Information System (REPIS) Version 6.0, available online at: www.eere.energy.gov/repis. For wind, UCS estimate based on American Wind Energy Association, Wind Project Database, January 2003. Available online at: www.awea.org/projects/index.html.
Rank StateRenewable Energy
Generation as a Percent of Sales
26 Tennessee 1.1%
27 Kansas 1.1%
28 Pennsylvania 0.8%
29 New York 0.8%
30 Utah 0.7%
31 Alaska 0.7%
32 Massachusetts 0.6%
33 Colorado 0.6%
34 Montana 0.5%
35 Ohio 0.5%
36 Illinois 0.4%
37 Maryland 0.4%
38 New Jersey 0.4%
39 Oklahoma 0.3%
40 Connecticut 0.2%
41 Nebraska 0.2%
42 South Dakota 0.1%
43 New Mexico 0.1%
44 Indiana 0.1%
45 Arizona 0.1%
46 Delaware 0.04%
47 Kentucky 0.02%
48 North Dakota 0.01%
49 Missouri 0.01%
50 West Virginia 0%

l Plugging In Renewable Energy: Grading the States l 41
State Installed (kW) Planned (kW)
Arizona 5,416 756
California 42,998 50,002
Colorado 65,735 1,860
Connecticut 19 -
Florida 1,557 3,188
Georgia - 9,000
Hawaii 22 1
Illinois - 8,000
Indiana - 3,200
Iowa 3,900 -
Kansas 111,500 -
Kentucky - 2,400
Massachusetts 1,658 2,400
Michigan 2,455 3,200
Minnesota 13,740 1,900
Nebraska 5,180 -
Nevada 16 -
New Jersey 52 7,500
New Mexico 660 1,320
New York 48,150 -
North Dakota 7,000 40,000
Ohio 28 -
Oklahoma - 50,000
Oregon 6,563 -
Pennsylvania 34,610 91,230
South Carolina 2,200 -
South Dakota - 41,650
Tennessee 8,290 28,340
Texas 99,774 80,236
Vermont - 160
Virginia - 2,000
Washington 321,455 1,066
West Virginia 66,000 -
Wisconsin 25,592 1,967
Wyoming 107,700 -
Total 982,270 431,376
SOURCE: Bird and Swezey, 2003.
New Renewable Energy from Green Power Customer Choice
Appendix D

42 l Union of Concerned Scientists l

l Plugging In Renewable Energy: Grading the States l 43

l
America’s electricity system is dominated by fossil fuels. The result is a system that lacks diversity and security, threatens the health of our citizens, jeopardizes the stability of Earth’s
climate, and robs future generations of clean air, clean water, and energy independence.
We are leaving far too much of the nation’s renewable energy potential untapped. Strong commitments to renewable energy can promote local economic
development while reducing the impact of fossil fuels.
This report assesses the renewable energy performance of all 50 states and assigns grades to each. While a few are setting a positive example for other states and the federal government,
it is clear that we still have a long way to go to reach the level of renewable energy needed to ensure a clean, diverse, secure, and independent electricity system.
Closing the renewable energy gap is too important a goal to leave to individuals and a handful of states. What America needs is a strong national policy with specifi c
goals for plugging renewable energy into the electricity system.
National HeadquartersTwo Brattle SquareCambridge, MA 02238-9105Phone: (617) 547-5552Fax: (617) 864-9405
West Coast Offi ce2397 Shattuck Ave., Ste. 203Berkeley, CA 94704Phone: (510) 843-1872Fax: (510) 843-3785
Washington Offi ce1707 H St. NW, Ste. 600Washington, DC 20006-3962Phone: (202) 223-6133Fax: (202) 223-6162
Website www.ucsusa.org Email [email protected]
Printed on recycled paper using soy-based inks
GradeA-
B+/B
C+/C
D
F
Plugging In Renewable EnergyG R A D I N G T H E S TAT E S