plumestop phase 1 pilot study at old outfall 002
TRANSCRIPT

PLUMESTOP PHASE 1 PILOT STUDY AT OLD OUTFALL 002
CHEMOURS FAYETTEVILLE WORKS RCRA PERMIT NO. NCD047368642-R2-M3
Prepared for:
The Chemours Company FC, LLCCorporate Remediation Group
22828 NC Highway 87 WFayetteville, NC 28306-7332
Prepared by:
PARSONS 4701 Hedgemore Drive
Charlotte, NC 28209
September 30, 2019 Chemours PN 504552 Parsons PN 449338

PLUMESTOP PHASE 1 PILOT STUDY AT OLD OUTFALL 002 TABLE OF CONTENTS
i
TABLE OF CONTENTS
1.0 INTRODUCTION ................................................................................................... 1
1.1 Site Description and Background .................................................................... 1
1.2 Technology Description ................................................................................... 1
2.0 TREATABILITY Testing methods ....................................................................... 2
2.1 Bench Scale Treatability Testing ..................................................................... 2
2.2 Phase 1 Pilot Scale Treatability Testing .......................................................... 2
2.3 Phase 1 Pilot Scale Groundwater Monitoring ................................................. 3
3.0 TREATABILITY TESTING RESULTS .................................................................. 5
3.1 Bench Scale Results ......................................................................................... 5
3.2 Pilot Scale Injection Results ............................................................................ 5
3.3 Groundwater Monitoring Results..................................................................... 7
4.0 CONCLUSIONS .................................................................................................... 8
FIGURES
Figure 1 Site Location Map Figure 2 Site Layout Map Figure 3 Performance Verification Testing Monitoring Wells and Piezometers Figure 4 Potentiometric Surface and Injection Point Layout
TABLES
Table 1 Groundwater Sampling Results
APPENDIX
Appendix A Boring and Well Construction Logs Appendix B Regenesis Bench Scale Test Report Appendix C Regenesis Application Summary Report Appendix D Laboratory Reports Appendix E Sampling Logs
PLUMESTOP PHASE 1 PILOT STUDY AT OLD OUTFALL 002 ACRONYMS
ii
ACRONYMS Acronym Definition / Description Chemours Chemours Company FC, LLC bgs Below ground surface CO Consent Order HFPO-DA Hexafluoropropylene oxide dimer acid (aka GenX) IP Injection Point µg/L Micrograms per liter µm Micrometers NCDEQ North Carolina Department of Environmental Quality PFAS Per - and polyfluoroalkyl substances PFMOAA Perfluoro-2-methoxyacetic acid ROI Radius of influence Site Fayetteville Works Facility VOCs Volatile organic compounds

PLUMESTOP PHASE 1 PILOT STUDY AT OLD OUTFALL 002
INTRODUCTION
1
1.0 INTRODUCTION On February 25, 2019, The Chemours Company FC, LLC (Chemours) entered into a Consent Order (CO) with the State of North Carolina and Cape Fear River Watch to address perfluoroalkyl and polyfluoroalkyl substances (PFAS) at the Fayetteville Works site. As required by paragraph 12.e of the CO, Chemours has completed a 3-month long pilot study to determine the efficacy of using PlumeStop by Regenesis Bioremediation Products (Regenesis) to sequester PFAS in the ground before it enters the Old Outfall 002 Channel. In addition, to the field pilot study, bench scale testing was also completed by Regenesis. This report presents the results of these studies. This pilot study was conducted in accordance with the procedures described in the May 20, 2019 Old Outfall 002 Remedial Options Plan prepared by Parsons.
1.1 Site Description and Background The Site is a 2,777-acre manufacturing facility located near Fayetteville, NC in Bladen County (Figure 1). Since 1996, several stages of environmental investigations have been conducted at the site under North Carolina Department of Environmental Quality (NCDEQ) oversight. Studies conducted at the Site indicate that groundwater containing PFAS constituents from historic PFAS deposition is discharging to a channel on the property referred to as the Old Outfall 002 (Figure 2). The channel historically was utilized to discharge process wastewater but was abandoned by the prior site owner when the current Outfall 002 was constructed in 2012. There is currently no active process wastewater discharge from the Site into this former outfall. Water in this channel ultimately discharges to the Cape Fear River.
1.2 Technology Description As an alternative remediation method required by CO paragraph 12.e, Chemours is evaluating the use of Regenesis PlumeStop Liquid Activated Carbon™ (PlumeStop) to reduce PFAS flowing out Old Outfall 002. PlumeStop is an innovative groundwater remediation technology designed to sequester groundwater contaminants via sorption. It is composed of very fine particles (1 to 2 micrometers [µm]) of activated carbon suspended in water. The material is held in suspension using proprietary organic polymers that allow easy injection and dispersion into the subsurface. As the polymer breaks down, the carbon coats the solid material in the aquifer matrix creating a passive, subsurface carbon adsorption filter. PlumeStop has been successfully applied to remediate other contaminants including larger PFAS molecules; the testing described in this report was intended to determine its effectiveness in treating HFPO-DA and PFMOAA.
Chemours initiated a combination of laboratory (bench scale) and pilot scale studies to assess the efficacy of PlumeStop at the site. A phased approach is being used to facilitate data collection and minimize assumptions. In Phase 1, bench scale testing was conducted alongside a pilot-scale permeable reactive wall installed in the Perched Zone beneath the Site. This report describes the methods used in these studies and summarizes the findings.

PLUMESTOP PHASE 1 PILOT STUDY AT OLD OUTFALL 002
TREATABILITY TESTING METHODS
2
2.0 TREATABILITY TESTING METHODS As previously mentioned, Chemours initiated a combination of laboratory (bench scale) and pilot scale studies to assess the efficacy of PlumeStop at the site. Bench scale testing was conducted alongside a pilot-scale wall installed in the Perched Zone beneath the Site.
2.1 Bench Scale Treatability Testing The purpose of the bench scale testing was to determine if the site-specific PFAS constituents would effectively bind to PlumeStop and that competitive sorption from the site matrix would not reduce the effectiveness of the PlumeStop. The effectiveness of PlumeStop was measured using the indicator constituents hexafluoropropylene oxide dimer acid (HFPO-DA) and perfluoro-2-methoxyacetic acid (PFMOAA) as directed by the CO. Additional PFAS compounds were also monitored in this study.
In order to evaluate the effectiveness, a batch study was conducted using the bulk aquifer components (soil and groundwater) to determine the dose-response of PlumeStop for the target compounds as well as other non-target species within the aquifer matrix. Six loadings of PlumeStop were used in the bench test, ranging from approximately 1,000 mg/L to 25,000 mg/L. Three of the six treated samples were prepared in duplicate for reproducibility verification. In addition to the PlumeStop treated samples, two control samples and one method control blank were also analyzed. The control samples contained site soil and groundwater with no added PlumeStop. The method control blank consisted of deionized water and was analyte-free. They were carried through the entire process and meant to trace any artificial sources of contamination from the procedures.
Aquifer media (soil and groundwater) were collected in April and May 2019 and shipped to Regenesis for bench scale testing. All samples were prepared in 4-liter high density polyethylene bottles for the sorption batch study. Each bottle contained 4,000 milliliters of contaminated groundwater from the site in addition to 0.4 kilograms of site soil. The designated amount of PlumeStop for each treatment level was then added to the reaction vessel, (or de-ionized water for the controls). In addition, a settling agent was added to all samples to destabilize the PlumeStop which allowed for water free of PlumeStop to be sampled and sent for analysis. This settling reagent is a mix of salts formulated and tested to decrease the time needed for PlumeStop to destabilize and settle out of the aqueous phase. Without this procedure, PlumeStop would remain suspended in solution during the sampling event, and any PFAS compounds adsorbed on the PlumeStop would be chemically extracted from the PlumeStop during the analytical sample preparation, leading to biased high results. The reaction vessels were sealed, the contents manually mixed, and the samples stored at room temperature for seven days, which provided enough time for the contaminants to adsorb and the PlumeStop to settle. At this time, PlumeStop-free groundwater samples were removed from the reaction vessels, and the samples were then shipped to a commercial laboratory for PFAS and volatile organic compound (VOC) analyses.
2.2 Phase 1 Pilot Scale Treatability Testing The Phase 1 pilot test is located near the polyvinyl fluoride resin manufacturing unit in the southern portion of the Fayetteville Works manufacturing site. Situated near the upper reaches of the Old Outfall 002 Channel, the area itself is relatively flat and is

PLUMESTOP PHASE 1 PILOT STUDY AT OLD OUTFALL 002
TREATABILITY TESTING METHODS
3
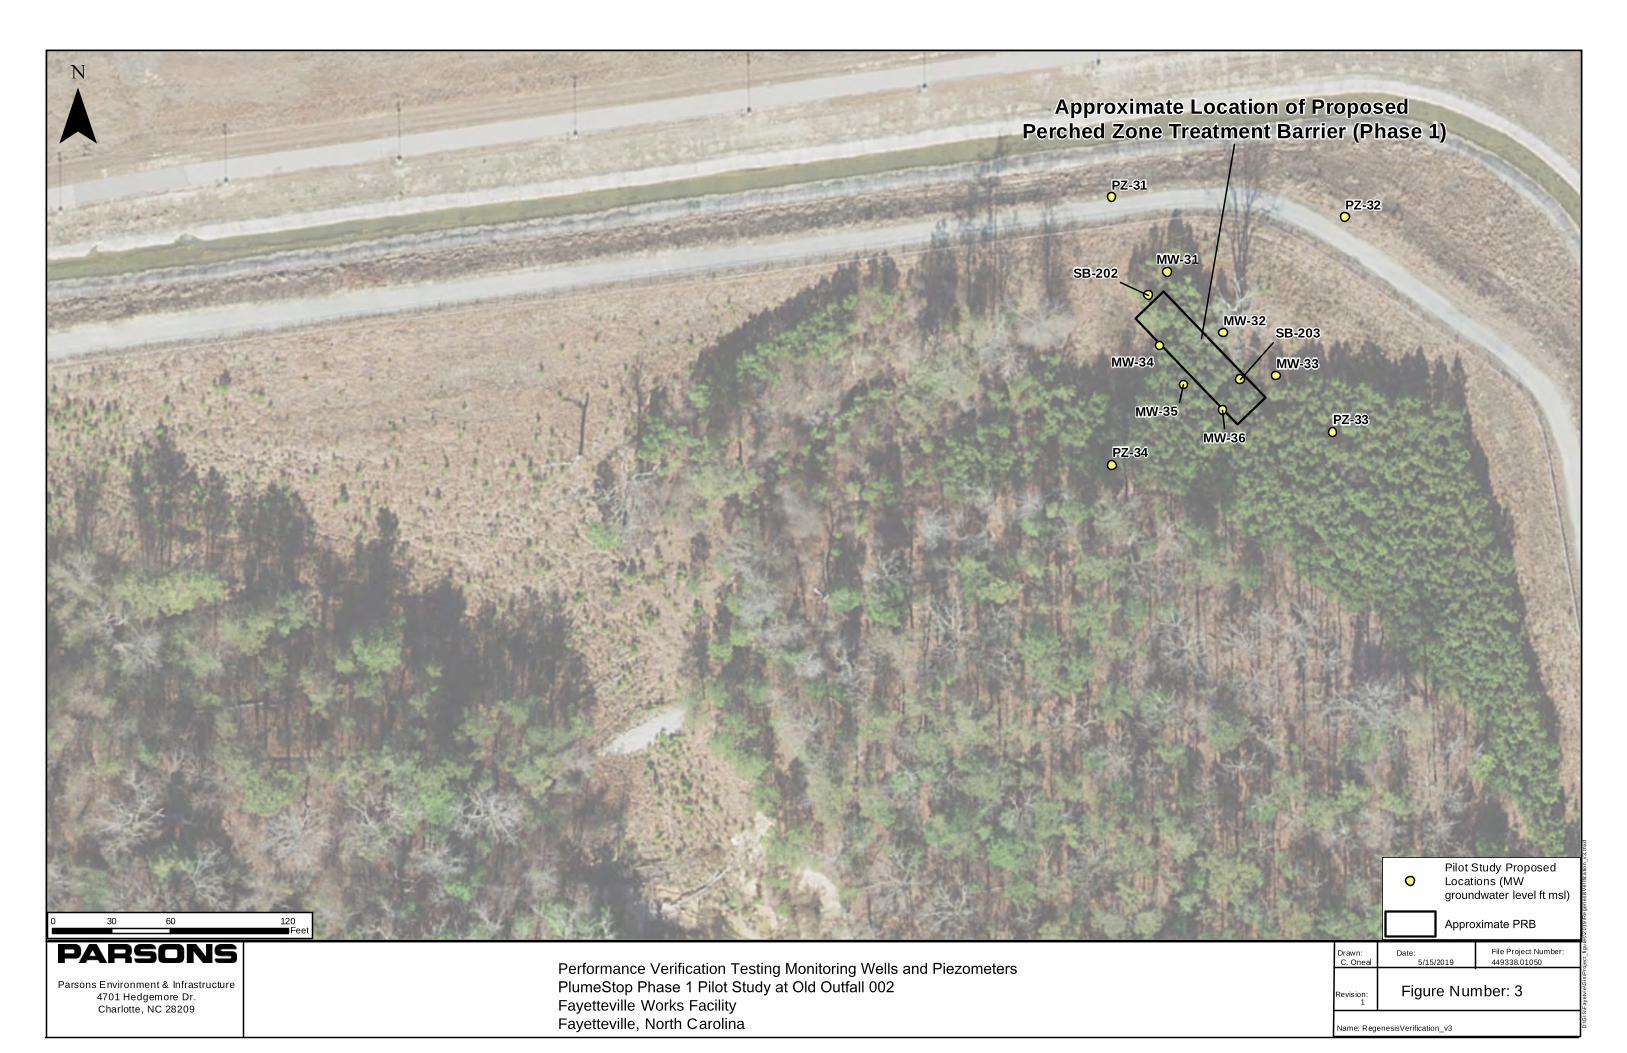
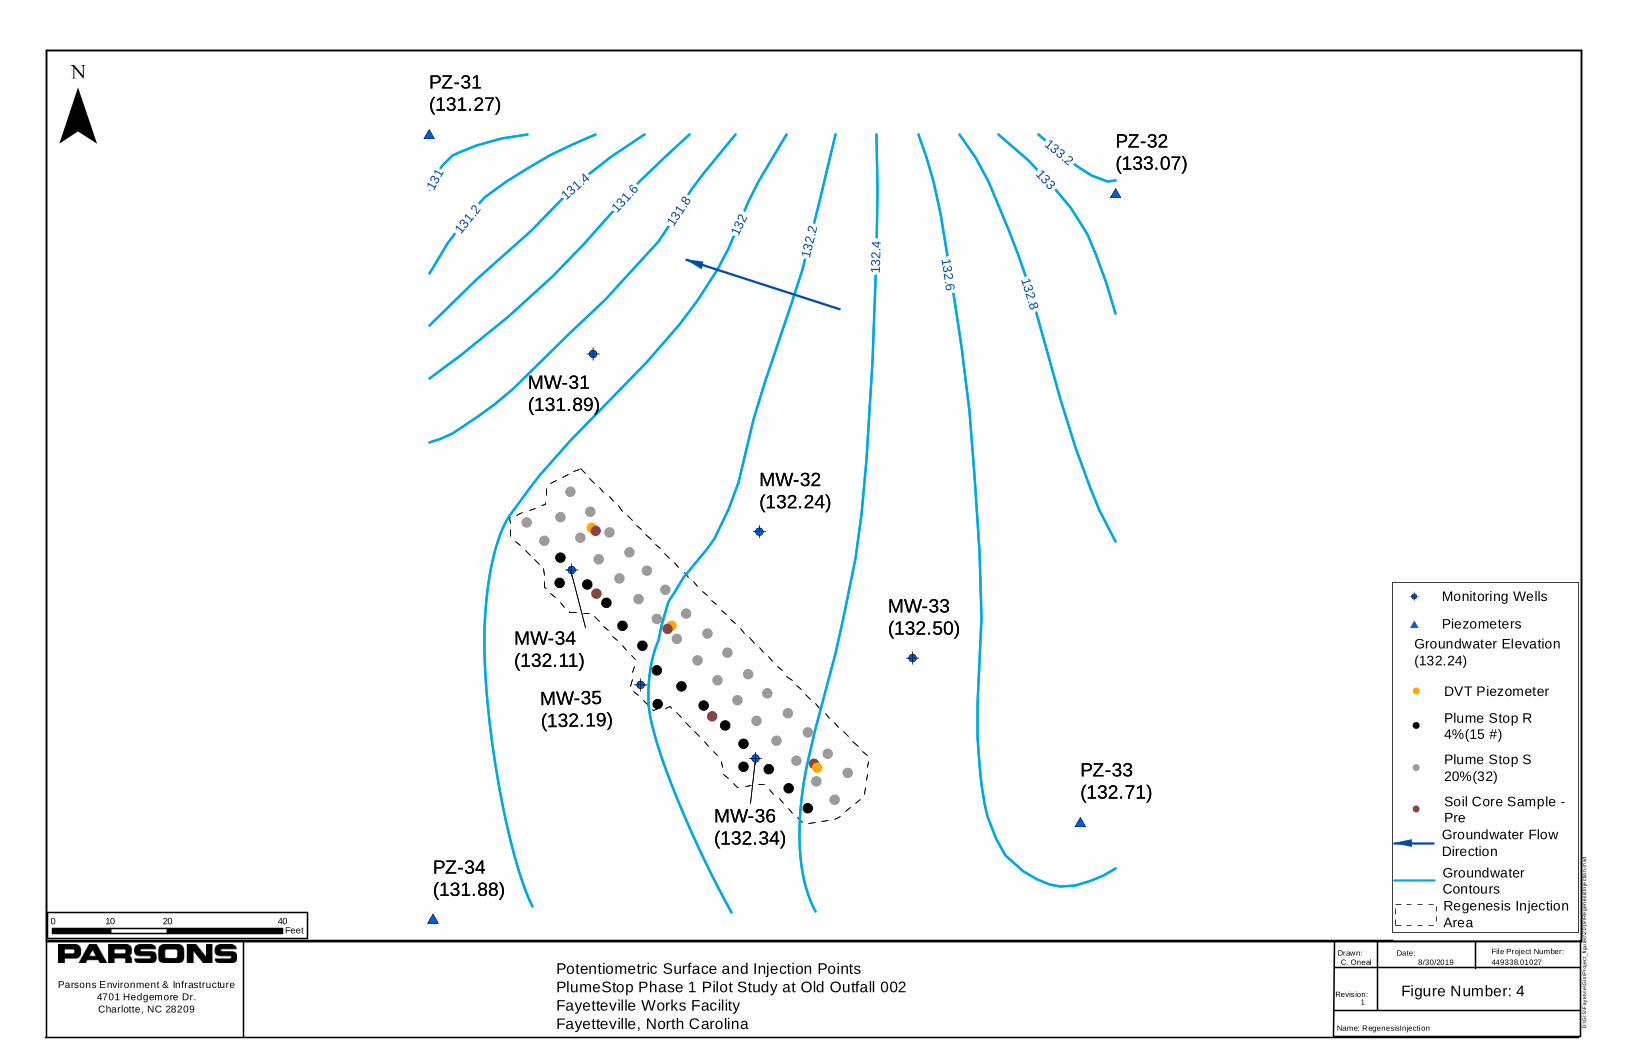
adjacent to a moderately steep ravine to the west‐southwest (the Old Outfall Channel). The Phase I pilot test was conducted to assess PlumeStop treatment near the southwestern extent of the perched zone, which is a relatively thin saturated, sandy zone atop a clay unit starting at approximately 16 to 22 feet below ground surface (bgs). The saturated thickness of the perched zone varies from approximately 5 to 9 feet, in the pilot test area. The area previously contained a stand of coniferous trees, which were cleared prior to initiation of the pilot study. A proposed location for the Phase 1 test was determined based on assumed groundwater flow and the location of the old outfall 002 channel. Prior to mobilization of the injection crew, Parsons completed a hydrogeologic assessment in this area to locate the perched zone. In April 2019 as part of this assessment, Parsons installed two soil borings (to map out the location of the perched zone clay), six monitoring wells, and four piezometers (Figure 3). A round of groundwater samples was collected from the six monitoring wells to assess baseline conditions prior to carbon injection. Boring and well construction logs are provided in Appendix A. Based on groundwater elevations collected by Parsons, Regenesis constructed a groundwater flow map showing the general groundwater flow direction to be rotated approximately 45 degrees from the longest side of the proposed barrier. Following this and taking into consideration the fixed locations of the performance monitoring wells, REGENESIS established an injection pattern as shown in Figure 4. Injection points (IPs) were placed in three rows, with Rows 1 and 2 numbered 1‐32 and in the upgradient portion of the barrier and Row 3 numbered 33‐48 and located in the downgradient side of the barrier.
Prior to and during the pilot‐scale PlumeStop barrier application, a design verification test was conducted to refine the Perched Zone treatment design. A total of 11 soil borings, five pre‐application and six post‐application cores were collected throughout the study. Soil borings were retrieved in 5‐foot sections using a 2.25‐inch dual‐tube sampler and ranged in total collection depths of 20 to 23 feet below ground surface. Cores were logged in detail from eight feet below ground surface to the end of the boring. Special emphasis was placed on measuring the vertical saturated thickness and observing the perched zone sand/cay contact across the length of the barrier, which established the target vertical treatment positionally in the barrier. Soil grain size, which was used to predict hydraulic conductivity and potential radius of influence (ROI) of the treatment, was observed through soil settling analysis, whereby soil samples collected in 1‐foot increments were placed in glass vials with water, mixed, and allowed to settle by particle size into distinct layers.
2.3 Phase 1 Pilot Scale Groundwater Monitoring Baseline groundwater samples were collected on May 2nd and 3rd, 2019 prior to injection of the PlumeStop compound. Injection of the phase 1 pilot barrier was completed in May 2019. Following the injections, monthly groundwater samples were collected from perched zone wells MW-31 through MW-36 for three months to monitor the performance of the barrier. Post-injection groundwater samples were collected from these six wells on June 18-19, July 17-18, and August 9-12, 2019. The samples were submitted for laboratory analysis of VOCs (Method 8260B), total hardness (Method 2340 C-1997), PFAS compounds (Method 537 Modified), and Table 3+ (Chemours SOP). Post-injection groundwater samples collected from wells MW-35 and MW-36 contained unsettled PlumeStop reagent even after properly purging the wells using low flow

PLUMESTOP PHASE 1 PILOT STUDY AT OLD OUTFALL 002
TREATABILITY TESTING METHODS
4
techniques. Due to the presence of PlumeStop in these samples, the June and July samples from wells MW-35 and MW-36 were shipped to Regenesis for centrifuging to remove the PlumeStop material and then shipped to the laboratory for analysis. The presence of PlumeStop in the groundwater sample when it is analyzed can result in higher groundwater results that are not typical of in-situ conditions. The August sample contained less PlumeStop and due to time constraints, these samples were shipped directly to the laboratory for analysis. The July sample from MW-36 was not analyzed for VOCs due to insufficient volume remaining following this procedure.
PLUMESTOP PHASE 1 PILOT STUDY AT OLD OUTFALL 002
TREATABILITY TESTING RESULTS
5
3.0 TREATABILITY TESTING RESULTS
3.1 Bench Scale Results This section briefly describes the results of the bench scale testing. A detailed report prepared by Regenesis and is included in Appendix B.
This treatability study examined the ability of various PlumeStop doses (1,000 mg/L to 25,000 mg/L) to remove HFPO-DA, PFMOAA, and other PFAS compounds from the perched groundwater zone at the subject site via adsorption to colloidal activated carbon particles. The key findings from the proof of concept test are as follows:
• PlumeStop successfully removed HFPO-DA from the groundwater and reduced its concentration to below reporting limits with a dose of only 5,000 mg/L.
• The range of PlumeStop doses tested removed between 93.5% and 99.6% of the total PFAS, indicating that a PlumeStop treatment can significantly remove these compounds from the groundwater matrix, thereby reducing the contaminant flux through the site.
• 24 of the 26 PFAS species were removed to non-detect concentrations. • As much as 95% of PFMOAA was removed from the groundwater in this study. • Successive treatments by two 10,000 mg/L doses of PlumeStop yielded better
results than a single 20,000 mg/L treatment, suggesting that observed field results may be better than the results observed in this study, assuming similar contaminant concentrations.
• The lowest PlumeStop dose tested removed over 90% of the total PFAS compounds, this result suggests an expected design advantage of improved treatment longevity when PlumeStop is used in a barrier formation.
These results confirm the ability of PlumeStop to adsorb the contaminants and demonstrate that no significant interfering species that limits the performance of PlumeStop is present in the soil and groundwater matrix. Therefore, PlumeStop is capable of quickly removing multiple contaminants from the aqueous phase at the site. This information, in combination with other site-specific parameters, can be used to estimate the performance of PlumeStop in various potential treatment areas of the site. Actual field dosing would be developed for each scenario in combination with estimates of the contaminant concentration, flux, and treatment goals.
3.2 Pilot Scale Injection Results This section briefly describes the results of the injections and the design verification testing. A detailed summary of the injections and testing was prepared by Regenesis and is included in Appendix C. Based on the design verification testing the lithology of the perched zone in this area is predominantly sand and silty sand with varying degrees of fines. Two fine‐grained (silt/clay) layers were noted in all soil borings. A thin fine‐grained layer, two to eight inches thick was observed approximately between 11 and 13 ft bgs. The aquiclude of the perched aquifer was determined to begin at between 16 and 21 ft bgs, increasing in depth from the SSE to NNW. Water was detected beginning at 11 to 12 ft bgs and extended into the confining layer. The saturated thickness in the western portion of the barrier was greater than what was expected based on the review of available data including previous boring logs. The increase in the total vertical

PLUMESTOP PHASE 1 PILOT STUDY AT OLD OUTFALL 002
TREATABILITY TESTING RESULTS
6
treatment increased the treatment volume injected by approximately 20 percent from the original design calculations.
Prior to injections, three temporary piezometers (PZs 1‐3) were installed and used as an ROI indicator and to improve the spatial sampling resolution of water level measurements. To observe the effect on water levels in nearby wells, injections began with a single‐point injection test at IP‐1. During the test, wells were observed for changes in depth to water and arrival of the PlumeStop reagent. Additionally, pressures and flowrates were varied to identify any lithological limitations of injections. During the application, soil borings were advanced and soil color observed for the vertical distribution of the PlumeStop reagent.
A total of 48 discrete locations were utilized to deliver the remedial solution of PlumeStop to the subsurface of the treatment area. Using direct‐push technology (DPT), PlumeStop was injected through 2.25‐inch tooling. Injection points were placed in a staggered grid‐like pattern of three rows with an average spacing of five feet between points and rows. Treatment depths and intervals varied based on the saturated thickness of the perched aquifer. For all locations, the bottom of the treatment zone was located at the interface of the perched-water table and the underlying aquiclude. As such, bottom treatment depths increased from 17 to 22 ft bgs along the barrier from the SSE to the NNW while the treatment interval increased from six to nine feet.
Three injection techniques were tested:
1. Initial injections were completed following a bottom‐up approach using 3‐foot retractable screens to deliver the PlumeStop reagent to the subsurface in discrete intervals of 1‐3 feet.
2. Pressure‐activated probes which discharge fluid in a narrow band from four injection ports. These probes were utilized in 6‐inch intervals following bottom‐up and top‐down approaches.
3. Lastly, 3‐foot retractable screens were attempted in small, 1‐foot intervals following top‐down and bottom‐up approaches.
Based on visual inspection of PlumeStop distribution in the post‐application cores, 3‐foot screens following a bottom‐up approach of 3‐foot intervals was determined to be the best delivery method.
To test injection limitations, flowrates were varied from 0.50 to 10.05 gallons per minute (gpm) for an overall median flowrate of 4.31 gpm. Based on the lithology and injection tooling diameter, flowrates appeared to be limited to a maximum of 5.50 gpm, whereby higher rates resulted in surfacing from around the active boring. Surfacing was otherwise uncommon and successfully prevented or mitigated by decreasing flowrates to 4.0 gpm or lower; lower rates were required as the application neared completion.
To assess distribution during injection, PlumeStop concentrations were measured in the three permanent monitoring wells and three piezometers. Concentrations ranged from approximately 3,000 milligrams per liter at PZ-1 to approximately 30,000 milligrams per liter at MW-36. Additionally, PlumeStop staining of soils was noted in all soil cores

PLUMESTOP PHASE 1 PILOT STUDY AT OLD OUTFALL 002
TREATABILITY TESTING RESULTS
7
collected during injection. These results indicate good distribution of PlumeStop throughout the entire treatment zone.
The in-situ application of PlumeStop at a total of 48 locations created a barrier 70 feet in length. A total of 22,000 lbs of PlumeStop was injected via direct‐push technology for a total application volume of 12,218 gallons.
3.3 Groundwater Monitoring Results The pre- and post-injection monitoring results are summarized on Table 1. Laboratory reports are included in Appendix D and groundwater sampling logs are in Appendix E. There were no significant detections of VOCs in any of the monitoring wells. Concentrations of most constituents in upgradient wells MW-31, MW-32, and MW-33 showed no significant changes in concentrations over the test period. PFAS concentrations generally showed significant decreases in samples from downgradient wells MW-34, MW-35 and MW-36. At well MW-34, sample analysis showed HFPO-DA decreased from 4.9 micrograms per liter (µg/L) prior to the injection to 0.036 µg/L three months later (99.3% reduction). Similar reductions were observed at wells MW-35 and MW-36 (99.4% and 99.3%, respectively).
At well MW-34, PFMOAA decreased from 111 J µg/L prior to injection to 26 µg/L within three months (76.6% reduction). Lower reductions of PFMOAA were observed at wells MW-35 and MW-36. The concentration at well MW-35 decreased from 80 µg/L to 26 µg/L in July (67.5% reduction); while the concentration at well MW-36 decreased from 98 J µg/L to 26 µg/L (73.5% reduction). The concentrations of PFMOAA at these wells appeared to rebound somewhat in August 2019; however, it is suspected that the higher concentration may be the result of the change in sample preparation described in Section 2.3 and that the result is not indicative of in-situ groundwater conditions.
Total PFAS concentrations at MW-34 decreased from 159 µg/L prior to injection to 28.5 µg/L in August (82% decrease). Wells MW-35 and MW-36 showed reductions of 76% and 82% based on the July sample results. Similar to PFMOAA, total PFAS concentrations rebounded somewhat in August.

PLUMESTOP PHASE 1 PILOT STUDY AT OLD OUTFALL 002
CONCLUSIONS
8
4.0 CONCLUSIONS Colloidal activated carbon was demonstrated to effectively reduce target PFAS compound (i.e., HFPO DA and PMFMOAA) concentrations in the perched zone aquifer at Old Outfall 002. Both the bench and pilot treatability studies support the in-situ application of the reagent as an economically and technologically feasible option for addressing PFAS impacts in the subsurface at the site, which would mitigate PFAS loading to surface water and reduce the migration of contaminants in groundwater. Significant mass reduction can be achieved for the target compound HFPO-DA (i.e., >99% in both the bench and pilot studies), and the bench-scale treatability study indicates the potential to achieve up to 95% reduction of PFMOAA. Furthermore, significant mass reductions of both target and non-target PFAS compounds in the bulk matrix were achieved in the bench-scale and pilot studies. In the case of the treatability study, >99% mass removal was realized, and 24 of the 26 PFAS species were removed to non-detect concentrations.
The pilot scale injection of PlumeStop demonstrated that the design volumes can be delivered to the subsurface without difficulty while maintaining relatively low injection pressures and adequate delivery rates (up to 5 gallons per minute per point) as desired. Based on the observations of the soil cores and the measured PlumeStop concentrations in groundwater from the monitoring points during injection, distribution throughout the entire treatment volume was confirmed.
The field results from post-treatment pilot study samples resulted in HFPO-DA reductions greater than 99% and PFMOAA being reduced by approximately 40 to 77%, relative to baseline concentrations in the 3 performance monitoring wells. The results indicate that by adjusting the design, PlumeStop is capable of removing PFMOAA to lower levels. The difference in the percent reductions in part is attributable to HFPO-DA being more hydrophobic than PFMOAA. Additionally, the pilot study dosing was based on representative concentrations of the major PFAS and HFPO-DA constituents upgradient or in the vicinity of the perched-zone treatment area prior to the availability of baseline sampling results in the target treatment zone. In some cases, these concentrations varied significantly from the assumed designed concentrations.
Design simulations to establish a proper carbon loading for the pilot study used a <5 ug/L PFMOAA loading for the pilot design based on existing analytical data. When the field data became available, higher concentrations were detected in the pilot study area key performance monitoring wells MW-34, MW-35, and MW-36. The samples taken on May 2, 2019, a week before the injection, showed detections of PFMOAA between 80 and 110 ug/L, which is greater than an order of magnitude than the assumed design concentration. The selected design concentration for the other key constituent, HFPO Dimer Acid, was 5.2 ug/L, which was appropriately representative of the 4.5 ug/L average from the May 2, 2019 baseline samples collected from the three performance wells. Therefore, a revised design would have been utilized had the actual site concentrations of PFMOAA been known, and it would be anticipated that higher percent removals of PFMOAA would have been observed.
The results of the bench scale study and the pilot study indicate that PlumeStop can significantly reduce the concentrations of HFPO-DA, PFMOAA, as well as many other PFAS compounds at the subject site. Over time, these reductions can translate to a reduction in the contaminant mass flux moving across the site. The purpose of the pilot

PLUMESTOP PHASE 1 PILOT STUDY AT OLD OUTFALL 002
CONCLUSIONS
9
and bench scale studies was to determine if PlumeStop is a viable remedial technology at the Site and to gather data required to design a full-scale system if implemented. A full-scale system would be designed for a specific lifespan (e.g., 5 years, 10 years, etc.) and to sustain the removal, additional treatments may be required at regular intervals. The system would be monitored, and injections continued until the effects of source control efforts eliminated the need for further injections. The results of these studies provide guidance for the expected performance and can allow for future design adjustments to be made, including the colloidal activated carbon dose, barrier orientation, and barrier length in order to optimize the approach and success of the treatment.

FIGURES

Site Location MapPlumeStop Phase 1 Pilot Study at Old Outfall 002Chemours Fayetteville WorksFayetteville, North Carolina
Site
Bladen County
North Carolina
0 1 20.5Miles
USGS Topo Quad provided by NC DOT
¯
Property Boundary
PE&I4701 Hedgemore Dr.Charlotte, NC 28209
D:\G
IS\F
ayet
vle\
Gis\
Proj
ect_
figur
es\2
017\
Site
Inve
stig
atio
n\Fa
y_Fi
g_1_
Site
_Loc
.mxd
Drawn: Date:
Revision: Figure Number: 1C. Oneal
1
File Project Number:450768
Name: Fay_Fig_1_Site_Loc
1/29/2018

Old Outfall 002 Channel
Kuraray AmericaLeased Areas
Kuraray AmericaLeased Areas
WastewaterTreatment
Plant
DuPont Leased Area
Former DuPont PMDFProduction Area
ChemoursMonomersIXM AreaChemours
PPA Area
¯
Parsons Environment & Infrastructure4701 Hedgemore Dr.Charlotte, NC 28209
0 0.25 0.50.125Miles
Cape
Fear R
iver
D:\G
IS\F
ayet
vle\
Gis
\Pro
ject
_fig
ures
\201
9\La
yout
_Old
Out
fall0
02R
emO
pt.m
xd
Drawn: Date:
Revision:Figure Number: 2
C. Oneal
1
File Project Number:449338.01050
Name: Layout_OldOutfall002RemOpt
5/20/2019Site Layout MapPlumeStop Phase 1 Pilot Study at Old Outfall 002Fayetteville Works FacilityFayetteville, North Carolina
Drainage Network
Former DuPont PMDF Production Area
Chemours Monomers IXM Area
Chemours PPA Area
DuPont Leased Area
Kuraray America Leased Areas
Wastewater Treatment Plant
Plant Border
SB-202
SB-203
Approximate Location of Proposed Perched Zone Treatment Barrier (Phase 1)
MW-31
MW-32
MW-33MW-34
MW-35MW-36
PZ-31PZ-32
PZ-33
PZ-34
SB-202
SB-203
Approximate Location of Proposed Perched Zone Treatment Barrier (Phase 1)
MW-31
MW-32
MW-33MW-34
MW-35MW-36
PZ-31PZ-32
PZ-33
PZ-34
Parsons Environment & Infrastructure4701 Hedgemore Dr.Charlotte, NC 28209
Performance Verification Testing Monitoring Wells and PiezometersPlumeStop Phase 1 Pilot Study at Old Outfall 002Fayetteville Works FacilityFayetteville, North Carolina
¯
0 60 12030Feet
Pilot Study Proposed Locations (MW groundwater level ft msl)
Approximate PRB
Drawn: Date:
Revis ion: Figure Number: 3
C. Oneal
1
File Project Number:449338.01050
Name: RegenesisVerification_v3
5/15/2019
D:\G
IS\F
ayet
vle\
Gis
\Pro
ject
_fig
ure
s\2
019
\Re
gen
esis
Ver
ifica
tion_
v3.m
xd
!A
!A
!A
!A
!A
!A
#*
#*
#*
#*
MW-31(131.89)
MW-32(132.24)
MW-33(132.50)MW-34
(132.11)
MW-35(132.19)
MW-36(132.34)
PZ-31(131.27)
PZ-32(133.07)
PZ-33(132.71)
PZ-34(131.88)
132.8
132.6
132.
4
132.
213213
1.8131.613
1.4
133.2
133
131.2
131
!A
!A
!A
!A
!A
!A
#*
#*
#*
#*
MW-31(131.89)
MW-32(132.24)
MW-33(132.50)MW-34
(132.11)
MW-35(132.19)
MW-36(132.34)
PZ-31(131.27)
PZ-32(133.07)
PZ-33(132.71)
PZ-34(131.88)
132.8
132.6
132.
4
132.
213213
1.8131.613
1.4
133.2
133
131.2
131
Parsons Environment & Infrastructure4701 Hedgemore Dr.Charlotte, NC 28209
Potentiometric Surface and Injection PointsPlumeStop Phase 1 Pilot Study at Old Outfall 002Fayetteville Works FacilityFayetteville, North Carolina
¯
0 20 4010Feet
Drawn: Date:
Revis ion: Figure Number: 4
C. Oneal
1
File Project Number:449338.01027
Name: RegenesisInjection
8/30/2019
D:\G
IS\F
ayet
vle\
Gis
\Pro
ject
_fig
ure
s\2
019
\Re
gen
esis
Inje
ctio
n.m
xd
!A Monitoring Wells
#* Piezometers
DVT Piezometer
Plume Stop R4%(15 #)
Plume Stop S20%(32)
Soil Core Sample -Pre
GroundwaterContoursRegenesis InjectionArea
Groundwater Elevation(132.24)
Groundwater FlowDirection

TABLE

Table 1Groundwater Sampling Results
PlumeStop Phase 1 Pilot Study at Old Outfall 002Chemours Fayetteville WorksFayetteville, North Carolina
05/03/2019 06/18/2019 07/18/2019 08/12/2019 05/03/2019 06/18/2019 07/18/2019 08/09/2019 05/02/2019 06/18/2019 06/18/2019 07/18/2019 07/18/2019 08/12/2019FS FS FS FS FS FS FS FS FS FS DUP FS DUP FS
Parameter Name Units Result Result Result Result Result Result Result Result Result Result Result Result Result Result
1,1,1,2-Tetrachloroethane UG/L <0.21 <0.21 <0.21 <0.21 <0.21 <0.21 <0.21 <0.21 <0.21 <0.21 <0.21 <0.21 <0.21 <0.211,1,1-Trichloroethane UG/L <0.16 <0.16 <0.16 <0.16 <0.16 <0.16 <0.16 <0.16 <0.16 <0.16 <0.16 <0.16 <0.16 <0.161,1,2,2-Tetrachloroethane UG/L <0.21 <0.21 <0.21 <0.21 <0.21 <0.21 <0.21 <0.21 <0.21 <0.21 <0.21 <0.21 <0.21 <0.211,1,2-Trichloroethane UG/L <0.27 <0.27 <0.27 <0.27 <0.27 <0.27 <0.27 <0.27 <0.27 <0.27 <0.27 <0.27 <0.27 <0.271,1-Dichloroethane UG/L <0.22 <0.22 <0.22 <0.22 <0.22 <0.22 <0.22 <0.22 <0.22 <0.22 <0.22 <0.22 <0.22 <0.221,1-Dichloroethene UG/L <0.23 <0.23 <0.23 <0.23 <0.23 <0.23 <0.23 <0.23 <0.23 <0.23 <0.23 <0.23 <0.23 <0.231,2,3-Trichloropropane UG/L <0.33 <0.33 <0.33 <0.33 <0.33 <0.33 <0.33 <0.33 <0.33 <0.33 <0.33 <0.33 <0.33 <0.331,2-Dibromo-3-Chloropropane UG/L <0.47 <0.47 <0.47 <0.47 <0.47 <0.47 <0.47 <0.47 <0.47 <0.47 <0.47 <0.47 <0.47 <0.471,2-Dibromoethane (EDB) UG/L <0.18 <0.18 <0.18 <0.18 <0.18 <0.18 <0.18 <0.18 <0.18 <0.18 <0.18 <0.18 <0.18 <0.181,2-Dichloroethane UG/L 0.18 J <0.13 <0.13 <0.13 <0.13 <0.13 <0.13 <0.13 <0.13 <0.13 <0.13 <0.13 <0.13 <0.131,2-Dichloropropane UG/L <0.18 <0.18 <0.18 <0.18 <0.18 <0.18 <0.18 <0.18 <0.18 <0.18 <0.18 <0.18 <0.18 <0.181,3-Dichlorobenzene UG/L <0.13 <0.13 <0.13 <0.13 <0.13 <0.13 <0.13 <0.13 <0.13 <0.13 <0.13 <0.13 <0.13 <0.132-Hexanone UG/L <1.7 <1.7 <1.7 <1.7 <1.7 <1.7 <1.7 <1.7 <1.7 <1.7 <1.7 <1.7 <1.7 <1.7Acetone UG/L <1.9 <1.9 <1.9 <1.9 <1.9 <1.9 26 B 5.1 B <1.9 <1.9 <1.9 <1.9 <1.9 <1.9Acetonitrile UG/L <9.6 <9.6 <9.6 <9.6 <9.6 <9.6 <9.6 <9.6 <9.6 <9.6 <9.6 <9.6 <9.6 <9.6Acrolein UG/L <2.8 <2.8 <2.8 <2.8 <2.8 <2.8 <2.8 <2.8 <2.8 <2.8 <2.8 <2.8 <2.8 <2.8Acrylonitrile UG/L <1.4 <1.4 <1.4 <1.4 <1.4 <1.4 <1.4 <1.4 <1.4 <1.4 <1.4 <1.4 <1.4 <1.4Allyl Chloride UG/L <0.17 <0.17 <0.17 <0.17 <0.17 <0.17 <0.17 <0.17 <0.17 <0.17 <0.17 <0.17 <0.17 <0.17Benzene UG/L <0.16 <0.16 <0.16 <0.16 <0.16 <0.16 <0.16 <0.16 <0.16 <0.16 <0.16 <0.16 <0.16 <0.16Bromodichloromethane UG/L <0.17 <0.17 <0.17 <0.17 <0.17 <0.17 <0.17 <0.17 <0.17 <0.17 <0.17 <0.17 <0.17 <0.17Bromoform UG/L <0.46 <0.46 <0.46 <0.46 <0.46 <0.46 <0.46 <0.46 <0.46 <0.46 <0.46 <0.46 <0.46 <0.46Carbon Disulfide UG/L <0.17 <0.17 <0.17 <0.17 <0.17 <0.17 <0.17 <0.17 0.40 B <0.17 <0.17 <0.17 <0.17 <0.17Carbon Tetrachloride UG/L <0.19 <0.19 <0.19 <0.19 <0.19 <0.19 <0.19 <0.19 <0.19 <0.19 <0.19 <0.19 <0.19 <0.19Chlorobenzene UG/L <0.17 <0.17 <0.17 <0.17 <0.17 <0.17 <0.17 <0.17 <0.17 <0.17 <0.17 <0.17 <0.17 <0.17Chlorodibromomethane UG/L <0.17 <0.17 <0.17 <0.17 <0.17 <0.17 <0.17 <0.17 <0.17 <0.17 <0.17 <0.17 <0.17 <0.17Chloroform UG/L 1.6 B 2 1.6 1.9 0.19 B 0.36 J 0.24 J <0.16 1.7 B 1.3 1.3 1.2 1.2 1.4Chloroprene UG/L <0.21 <0.21 <0.21 <0.21 <0.21 <0.21 <0.21 <0.21 <0.21 <0.21 <0.21 <0.21 <0.21 <0.21cis-1,3-Dichloropropene UG/L <0.16 <0.16 <0.16 <0.16 <0.16 <0.16 <0.16 <0.16 <0.16 <0.16 <0.16 <0.16 <0.16 <0.16Dichlorodifluoromethane UG/L <0.31 <0.31 <0.31 <0.31 <0.31 <0.31 <0.31 <0.31 <0.31 <0.31 <0.31 <0.31 <0.31 <0.31Ethyl Chloride UG/L <0.41 <0.41 <0.41 <0.41 <0.41 <0.41 <0.41 <0.41 <0.41 <0.41 <0.41 <0.41 <0.41 <0.41Ethyl Methacrylate UG/L <0.86 <0.86 <0.86 <0.86 <0.86 <0.86 <0.86 <0.86 <0.86 <0.86 <0.86 <0.86 <0.86 <0.86Ethylbenzene UG/L <0.16 <0.16 <0.16 <0.16 <0.16 <0.16 <0.16 <0.16 <0.16 <0.16 <0.16 <0.16 <0.16 <0.16Iodomethane UG/L <0.23 <0.23 <0.23 <0.23 <0.23 <0.23 <0.23 <0.23 <0.23 <0.23 <0.23 <0.23 <0.23 <0.23Isobutyl Alcohol UG/L <37 <37 <37 <37 <37 <37 <37 <37 <37 <37 <37 <37 <37 <37Meta- And Para-Xylene UG/L <0.15 <0.15 <0.15 0.33 B <0.15 <0.15 <0.15 <0.15 <0.15 <0.15 <0.15 <0.15 <0.15 0.31 BMethacrylonitrile UG/L <1.6 <1.6 <1.6 <1.6 <1.6 <1.6 <1.6 <1.6 <1.6 <1.6 <1.6 <1.6 <1.6 <1.6Methyl Bromide UG/L <0.21 <0.21 <0.21 <0.21 <0.21 <0.21 <0.21 <0.21 <0.21 <0.21 <0.21 <0.21 <0.21 <0.21
Volatile Organic Compounds (VOCs)
Location IDDate Sampled
Sample Purpose
MW-31 MW-32 MW-33
Page 1 of 8

Table 1Groundwater Sampling Results
PlumeStop Phase 1 Pilot Study at Old Outfall 002Chemours Fayetteville WorksFayetteville, North Carolina
05/03/2019 06/18/2019 07/18/2019 08/12/2019 05/03/2019 06/18/2019 07/18/2019 08/09/2019 05/02/2019 06/18/2019 06/18/2019 07/18/2019 07/18/2019 08/12/2019FS FS FS FS FS FS FS FS FS FS DUP FS DUP FS
Parameter Name Units Result Result Result Result Result Result Result Result Result Result Result Result Result Result
Location IDDate Sampled
Sample Purpose
MW-31 MW-32 MW-33
Methyl Chloride UG/L <0.30 <0.30 <0.30 <0.30 <0.30 <0.30 <0.30 <0.30 <0.30 <0.30 <0.30 <0.30 <0.30 <0.30Methyl Ethyl Ketone UG/L <2.0 <2.0 <2.0 <2.0 <2.0 <2.0 <2.0 <2.0 <2.0 <2.0 <2.0 <2.0 <2.0 <2.0Methyl Isobutyl Ketone UG/L <0.98 <0.98 <0.98 <0.98 <0.98 <0.98 <0.98 <0.98 <0.98 <0.98 <0.98 <0.98 <0.98 <0.98Methyl Methacrylate UG/L <1.1 <1.1 <1.1 <1.1 <1.1 <1.1 <1.1 <1.1 <1.1 <1.1 <1.1 <1.1 <1.1 <1.1Methylene Bromide UG/L <0.17 <0.17 <0.17 <0.17 <0.17 <0.17 <0.17 <0.17 <0.17 <0.17 <0.17 <0.17 <0.17 <0.17Methylene Chloride UG/L <0.94 <0.94 <0.94 <0.94 <0.94 <0.94 <0.94 <0.94 <0.94 <0.94 <0.94 <0.94 <0.94 <0.94Ortho-Xylene UG/L <0.19 <0.19 <0.19 <0.19 <0.19 <0.19 <0.19 <0.19 <0.19 <0.19 <0.19 <0.19 <0.19 <0.19Propionitrile UG/L <3.7 <3.7 <3.7 <3.7 <3.7 <3.7 <3.7 <3.7 <3.7 <3.7 <3.7 <3.7 <3.7 <3.7Styrene UG/L <0.36 <0.36 <0.36 <0.36 <0.36 <0.36 <0.36 <0.36 <0.36 <0.36 <0.36 <0.36 <0.36 <0.36Tetrachloroethene UG/L <0.20 <0.20 <0.20 <0.20 <0.20 <0.20 <0.20 <0.20 <0.20 <0.20 <0.20 <0.20 <0.20 <0.20Toluene UG/L <0.17 <0.17 <0.17 <0.17 <0.17 <0.17 <0.17 <0.17 <0.17 <0.17 <0.17 <0.17 0.27 B <0.17trans-1,2-Dichloroethene UG/L <0.15 <0.15 <0.15 <0.15 <0.15 <0.15 <0.15 <0.15 <0.15 <0.15 <0.15 <0.15 <0.15 <0.15trans-1,3-Dichloropropene UG/L <0.19 <0.19 <0.19 <0.19 <0.19 <0.19 <0.19 <0.19 <0.19 <0.19 <0.19 <0.19 <0.19 <0.19trans-1,4-Dichlorobutene-2 UG/L <0.80 <0.80 <0.80 <0.80 <0.80 <0.80 <0.80 <0.80 <0.80 <0.80 <0.80 <0.80 <0.80 <0.80Trichloroethene UG/L <0.16 <0.16 <0.16 <0.16 <0.16 <0.16 <0.16 <0.16 <0.16 <0.16 <0.16 <0.16 <0.16 <0.16Trichlorofluoromethane UG/L <0.29 <0.29 <0.29 <0.29 <0.29 <0.29 <0.29 <0.29 <0.29 <0.29 <0.29 <0.29 <0.29 <0.29Vinyl Acetate UG/L <0.94 <0.94 <0.94 <0.94 <0.94 <0.94 <0.94 <0.94 <0.94 <0.94 <0.94 <0.94 <0.94 <0.94Vinyl Chloride UG/L <0.10 <0.10 <0.10 <0.10 <0.10 <0.10 <0.10 <0.10 <0.10 <0.10 <0.10 <0.10 <0.10 <0.10Xylenes UG/L <0.19 <0.19 <0.19 0.33 B <0.19 <0.19 <0.19 <0.19 <0.19 <0.19 <0.19 <0.19 <0.19 0.31 B1,4-Dioxane UG/L <19 <19 <19 <19 <19 <19 <19 <19 <19 <19 <19 <19 <19 <19
Calcium MG/L 3.8 4.3 5 4.9 6 7.3 7.7 7.8 3.9 4.4 4.4 5.1 J 5 4.5Calcium MG/L 3.5 4.2 4.9 4.9 5.7 7 7.2 6.8 3.6 4.4 4.4 5 5 4.7Carbon MG/L 1.4 1.6 1.5 1.8 1.6 1.8 2.8 2 1.3 1.6 1.7 1.5 1.5 1.9Dissolved Organic Carbon UG/L 1500 1800 2200 B 2500 2000 1900 3800 1900 1200 B 1600 1700 2400 B 1700 B 2600Total Hardness As CaCO3 MG/L 13 32 18 22 21 25 34 88 J 11 15 17 14 15 15
Perfluorobutane Sulfonic Acid UG/L <0.002 0.0022 0.0029 0.003 0.0023 0.0023 0.0028 0.0029 <0.0020 0.0022 0.0022 0.0032 0.0031 0.0037Perfluorobutanoic Acid UG/L 0.039 0.028 0.029 0.03 0.041 0.029 0.028 0.023 0.037 0.024 0.023 0.023 0.024 0.022Perfluorodecanoic Acid UG/L 0.0031 0.0023 0.0023 0.0026 0.003 0.002 0.0024 0.0024 0.0032 0.0023 0.0023 0.003 0.0032 0.0023Perfluorododecanoic Acid UG/L <0.0020 <0.0020 <0.0020 <0.0020 <0.0020 <0.0020 <0.0020 <0.0020 <0.0020 <0.0020 <0.0020 <0.0020 <0.0020 <0.0020Perfluoroheptanoic Acid UG/L 0.013 0.0093 0.012 0.012 0.012 0.01 0.011 0.012 0.011 0.009 0.0085 0.011 0.011 0.013Perfluorohexane Sulfonic Acid UG/L 0.003 0.0032 0.0044 0.0046 0.0035 0.0036 0.0043 0.0047 0.003 0.0032 0.0032 0.0048 0.0048 0.0061Perfluorohexanoic Acid UG/L 0.0088 0.0076 0.012 0.013 0.012 0.01 0.013 0.016 0.0078 0.0091 0.0084 0.013 0.013 0.017Perfluorononanoic Acid UG/L 0.0045 0.003 0.0032 0.0034 0.0046 0.0028 0.0028 0.0028 0.0061 0.003 0.0029 0.0032 0.0032 0.0028Perfluoropentanoic Acid UG/L 0.052 0.046 0.047 0.048 0.051 0.042 0.04 0.038 0.045 0.033 0.033 0.033 0.034 0.035Perfluoroundecanoic Acid UG/L <0.0020 <0.0020 <0.0020 <0.0020 <0.0020 <0.0020 <0.0020 <0.0020 <0.0020 <0.0020 <0.0020 <0.0020 <0.0020 <0.0020PFOA UG/L 0.016 0.0098 0.012 0.011 0.013 0.011 0.012 0.02 0.015 0.011 0.011 0.012 0.013 0.011
Miscellaneous
PFAS (537 Method)
Page 2 of 8
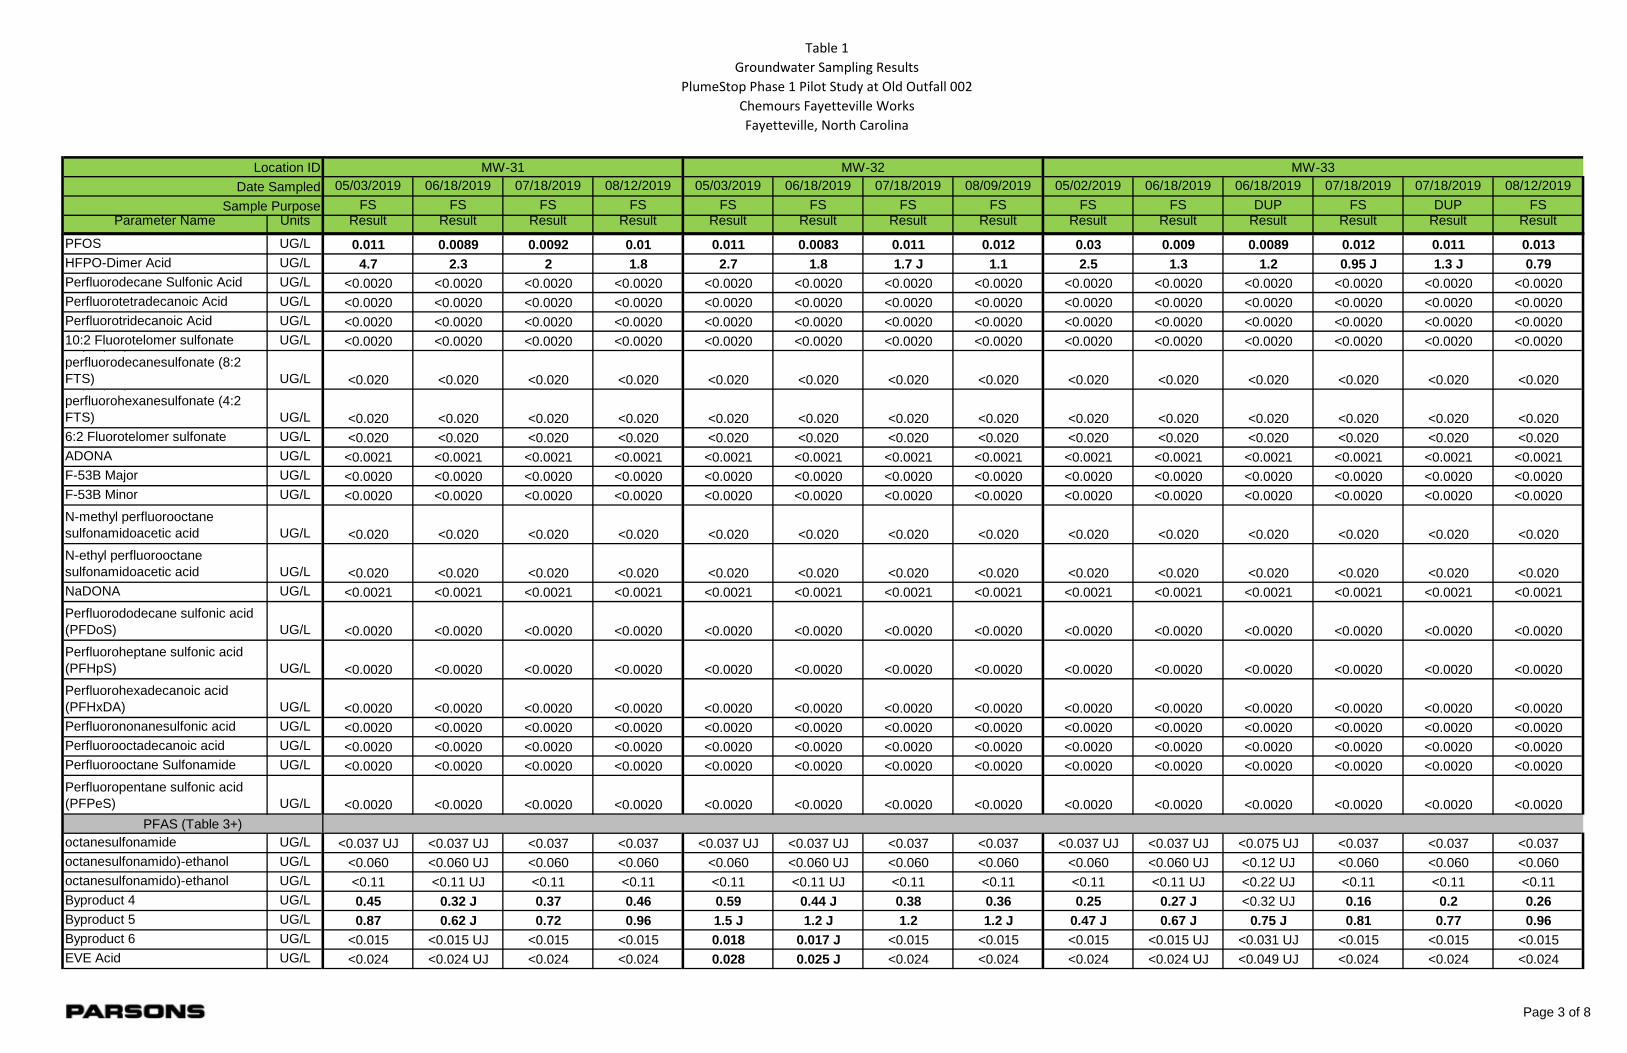
Table 1Groundwater Sampling Results
PlumeStop Phase 1 Pilot Study at Old Outfall 002Chemours Fayetteville WorksFayetteville, North Carolina
05/03/2019 06/18/2019 07/18/2019 08/12/2019 05/03/2019 06/18/2019 07/18/2019 08/09/2019 05/02/2019 06/18/2019 06/18/2019 07/18/2019 07/18/2019 08/12/2019FS FS FS FS FS FS FS FS FS FS DUP FS DUP FS
Parameter Name Units Result Result Result Result Result Result Result Result Result Result Result Result Result Result
Location IDDate Sampled
Sample Purpose
MW-31 MW-32 MW-33
PFOS UG/L 0.011 0.0089 0.0092 0.01 0.011 0.0083 0.011 0.012 0.03 0.009 0.0089 0.012 0.011 0.013HFPO-Dimer Acid UG/L 4.7 2.3 2 1.8 2.7 1.8 1.7 J 1.1 2.5 1.3 1.2 0.95 J 1.3 J 0.79Perfluorodecane Sulfonic Acid UG/L <0.0020 <0.0020 <0.0020 <0.0020 <0.0020 <0.0020 <0.0020 <0.0020 <0.0020 <0.0020 <0.0020 <0.0020 <0.0020 <0.0020Perfluorotetradecanoic Acid UG/L <0.0020 <0.0020 <0.0020 <0.0020 <0.0020 <0.0020 <0.0020 <0.0020 <0.0020 <0.0020 <0.0020 <0.0020 <0.0020 <0.0020Perfluorotridecanoic Acid UG/L <0.0020 <0.0020 <0.0020 <0.0020 <0.0020 <0.0020 <0.0020 <0.0020 <0.0020 <0.0020 <0.0020 <0.0020 <0.0020 <0.002010:2 Fluorotelomer sulfonate UG/L <0.0020 <0.0020 <0.0020 <0.0020 <0.0020 <0.0020 <0.0020 <0.0020 <0.0020 <0.0020 <0.0020 <0.0020 <0.0020 <0.0020, , ,perfluorodecanesulfonate (8:2 FTS) UG/L <0.020 <0.020 <0.020 <0.020 <0.020 <0.020 <0.020 <0.020 <0.020 <0.020 <0.020 <0.020 <0.020 <0.020, , ,perfluorohexanesulfonate (4:2 FTS) UG/L <0.020 <0.020 <0.020 <0.020 <0.020 <0.020 <0.020 <0.020 <0.020 <0.020 <0.020 <0.020 <0.020 <0.0206:2 Fluorotelomer sulfonate UG/L <0.020 <0.020 <0.020 <0.020 <0.020 <0.020 <0.020 <0.020 <0.020 <0.020 <0.020 <0.020 <0.020 <0.020ADONA UG/L <0.0021 <0.0021 <0.0021 <0.0021 <0.0021 <0.0021 <0.0021 <0.0021 <0.0021 <0.0021 <0.0021 <0.0021 <0.0021 <0.0021F-53B Major UG/L <0.0020 <0.0020 <0.0020 <0.0020 <0.0020 <0.0020 <0.0020 <0.0020 <0.0020 <0.0020 <0.0020 <0.0020 <0.0020 <0.0020F-53B Minor UG/L <0.0020 <0.0020 <0.0020 <0.0020 <0.0020 <0.0020 <0.0020 <0.0020 <0.0020 <0.0020 <0.0020 <0.0020 <0.0020 <0.0020N-methyl perfluorooctane sulfonamidoacetic acid UG/L <0.020 <0.020 <0.020 <0.020 <0.020 <0.020 <0.020 <0.020 <0.020 <0.020 <0.020 <0.020 <0.020 <0.020N-ethyl perfluorooctane sulfonamidoacetic acid UG/L <0.020 <0.020 <0.020 <0.020 <0.020 <0.020 <0.020 <0.020 <0.020 <0.020 <0.020 <0.020 <0.020 <0.020NaDONA UG/L <0.0021 <0.0021 <0.0021 <0.0021 <0.0021 <0.0021 <0.0021 <0.0021 <0.0021 <0.0021 <0.0021 <0.0021 <0.0021 <0.0021Perfluorododecane sulfonic acid (PFDoS) UG/L <0.0020 <0.0020 <0.0020 <0.0020 <0.0020 <0.0020 <0.0020 <0.0020 <0.0020 <0.0020 <0.0020 <0.0020 <0.0020 <0.0020Perfluoroheptane sulfonic acid (PFHpS) UG/L <0.0020 <0.0020 <0.0020 <0.0020 <0.0020 <0.0020 <0.0020 <0.0020 <0.0020 <0.0020 <0.0020 <0.0020 <0.0020 <0.0020Perfluorohexadecanoic acid (PFHxDA) UG/L <0.0020 <0.0020 <0.0020 <0.0020 <0.0020 <0.0020 <0.0020 <0.0020 <0.0020 <0.0020 <0.0020 <0.0020 <0.0020 <0.0020Perfluorononanesulfonic acid UG/L <0.0020 <0.0020 <0.0020 <0.0020 <0.0020 <0.0020 <0.0020 <0.0020 <0.0020 <0.0020 <0.0020 <0.0020 <0.0020 <0.0020Perfluorooctadecanoic acid UG/L <0.0020 <0.0020 <0.0020 <0.0020 <0.0020 <0.0020 <0.0020 <0.0020 <0.0020 <0.0020 <0.0020 <0.0020 <0.0020 <0.0020Perfluorooctane Sulfonamide UG/L <0.0020 <0.0020 <0.0020 <0.0020 <0.0020 <0.0020 <0.0020 <0.0020 <0.0020 <0.0020 <0.0020 <0.0020 <0.0020 <0.0020Perfluoropentane sulfonic acid (PFPeS) UG/L <0.0020 <0.0020 <0.0020 <0.0020 <0.0020 <0.0020 <0.0020 <0.0020 <0.0020 <0.0020 <0.0020 <0.0020 <0.0020 <0.0020
octanesulfonamide UG/L <0.037 UJ <0.037 UJ <0.037 <0.037 <0.037 UJ <0.037 UJ <0.037 <0.037 <0.037 UJ <0.037 UJ <0.075 UJ <0.037 <0.037 <0.037 octanesulfonamido)-ethanol UG/L <0.060 <0.060 UJ <0.060 <0.060 <0.060 <0.060 UJ <0.060 <0.060 <0.060 <0.060 UJ <0.12 UJ <0.060 <0.060 <0.060 octanesulfonamido)-ethanol UG/L <0.11 <0.11 UJ <0.11 <0.11 <0.11 <0.11 UJ <0.11 <0.11 <0.11 <0.11 UJ <0.22 UJ <0.11 <0.11 <0.11Byproduct 4 UG/L 0.45 0.32 J 0.37 0.46 0.59 0.44 J 0.38 0.36 0.25 0.27 J <0.32 UJ 0.16 0.2 0.26Byproduct 5 UG/L 0.87 0.62 J 0.72 0.96 1.5 J 1.2 J 1.2 1.2 J 0.47 J 0.67 J 0.75 J 0.81 0.77 0.96Byproduct 6 UG/L <0.015 <0.015 UJ <0.015 <0.015 0.018 0.017 J <0.015 <0.015 <0.015 <0.015 UJ <0.031 UJ <0.015 <0.015 <0.015EVE Acid UG/L <0.024 <0.024 UJ <0.024 <0.024 0.028 0.025 J <0.024 <0.024 <0.024 <0.024 UJ <0.049 UJ <0.024 <0.024 <0.024
PFAS (Table 3+)
Page 3 of 8

Table 1Groundwater Sampling Results
PlumeStop Phase 1 Pilot Study at Old Outfall 002Chemours Fayetteville WorksFayetteville, North Carolina
05/03/2019 06/18/2019 07/18/2019 08/12/2019 05/03/2019 06/18/2019 07/18/2019 08/09/2019 05/02/2019 06/18/2019 06/18/2019 07/18/2019 07/18/2019 08/12/2019FS FS FS FS FS FS FS FS FS FS DUP FS DUP FS
Parameter Name Units Result Result Result Result Result Result Result Result Result Result Result Result Result Result
Location IDDate Sampled
Sample Purpose
MW-31 MW-32 MW-33
Hydro-EVE Acid UG/L 0.08 0.064 J 0.062 0.059 0.08 0.081 J 0.066 0.049 0.047 0.044 J <0.056 UJ 0.037 0.041 0.041N-methyl perfluoro-1-octanesulfonamide UG/L <0.035 <0.035 UJ <0.035 <0.035 <0.035 UJ <0.035 UJ <0.035 <0.035 <0.035 UJ <0.035 UJ <0.069 UJ <0.035 <0.035 <0.035NVHOS UG/L 0.71 0.76 J 0.77 0.82 1.6 1.6 J 1.3 0.9 0.57 0.88 J 0.86 J 0.71 0.67 0.85PEPA UG/L 2.6 1.8 J 1.1 0.91 1.7 0.99 J 0.66 0.45 2.1 0.84 J 0.85 J 0.55 0.57 0.34PES UG/L <0.046 <0.046 UJ <0.046 <0.046 <0.046 <0.046 UJ <0.046 <0.046 <0.046 <0.046 UJ <0.092 UJ <0.046 <0.046 <0.046PFECA B UG/L <0.060 <0.060 UJ <0.060 <0.060 <0.060 <0.060 UJ <0.060 <0.060 <0.060 <0.060 UJ <0.12 UJ <0.060 <0.060 <0.060PFECA-G UG/L <0.041 <0.041 UJ <0.041 <0.041 <0.041 <0.041 UJ <0.041 <0.041 <0.041 <0.041 UJ <0.082 UJ <0.041 <0.041 <0.041PFESA-BP1 UG/L <0.027 0.038 J 0.027 <0.027 0.091 0.084 J 0.077 0.053 <0.027 0.034 J <0.053 UJ 0.033 0.03 0.052PFESA-BP2 UG/L 0.78 0.50 J 0.45 0.51 0.91 0.51 J 0.44 0.38 0.45 0.31 J 0.28 J 0.34 0.33 0.35PFMOAA UG/L 56 70 J 62 69 121 J 146 J 105 79 40 J 75 J 65 J 54 50 63PFO2HxA UG/L 13 15 J 13 14 24 J 27 J 21 15 9.3 14 J 14 J 11 11 12PFO3OA UG/L 3.4 3.4 J 3.4 3.7 6 6.7 J 5.2 3.8 2.1 3.3 J 3.4 J 2.8 2.6 3PFO4DA UG/L 1.1 0.88 J 0.84 0.93 1.5 1.5 J 1.2 0.93 J 0.71 0.75 J 0.84 J 0.68 0.66 0.73PFO5DA UG/L 0.62 0.40 J 0.3 0.28 0.43 0.33 J 0.27 0.23 J 0.57 0.20 J 0.22 J 0.2 0.21 0.16PMPA UG/L 5.7 4.3 J 2.4 2.4 3.9 2.4 J 1.4 1.7 4.5 2.0 J 1.6 J 1.2 1.1 1.2R-EVE UG/L 0.18 0.070 J 0.12 0.18 0.19 0.089 J <0.070 0.084 J 0.1 0.070 J <0.14 UJ 0.092 0.07 0.099
Notes:NS = Not Sampled< = Not detected at the reported detection limitJ = Estimated ValueUJ = Not detected at the estimated detection limitFS = Field SampleDUP = Duplicate Sample
Page 4 of 8

Table 1Groundwater Sampling Results
PlumeStop Phase 1 Pilot Study at Old Outfall 002Chemours Fayetteville WorksFayetteville, North Carolina
Parameter Name Units
1,1,1,2-Tetrachloroethane UG/L1,1,1-Trichloroethane UG/L1,1,2,2-Tetrachloroethane UG/L1,1,2-Trichloroethane UG/L1,1-Dichloroethane UG/L1,1-Dichloroethene UG/L1,2,3-Trichloropropane UG/L1,2-Dibromo-3-Chloropropane UG/L1,2-Dibromoethane (EDB) UG/L1,2-Dichloroethane UG/L1,2-Dichloropropane UG/L1,3-Dichlorobenzene UG/L2-Hexanone UG/LAcetone UG/LAcetonitrile UG/LAcrolein UG/LAcrylonitrile UG/LAllyl Chloride UG/LBenzene UG/LBromodichloromethane UG/LBromoform UG/LCarbon Disulfide UG/LCarbon Tetrachloride UG/LChlorobenzene UG/LChlorodibromomethane UG/LChloroform UG/LChloroprene UG/Lcis-1,3-Dichloropropene UG/LDichlorodifluoromethane UG/LEthyl Chloride UG/LEthyl Methacrylate UG/LEthylbenzene UG/LIodomethane UG/LIsobutyl Alcohol UG/LMeta- And Para-Xylene UG/LMethacrylonitrile UG/LMethyl Bromide UG/L
Volatile Organic Compounds (VOCs)
Location IDDate Sampled
Sample Purpose05/02/2019 06/19/2019 07/18/2019 08/09/2019 08/09/2019 05/02/2019 06/18/2019 07/17/2019 08/09/2019 05/02/2019 05/02/2019 06/18/2019 07/17/2019 08/09/2019
FS FS FS FS DUP FS FS FS FS FS DUP FS FS FSResult Result Result Result Result Result Result Result Result Result Result Result Result Result
<0.21 <0.21 <0.21 <0.21 <0.21 <0.21 <0.21 <0.21 <0.21 <0.21 <0.21 <0.21 NS <0.21<0.16 <0.16 <0.16 <0.16 <0.16 <0.16 <0.16 <0.16 <0.16 <0.16 <0.16 <0.16 NS <0.16<0.21 <0.21 <0.21 <0.21 <0.21 <0.21 <0.21 <0.21 <0.21 <0.21 <0.21 <0.21 NS <0.21<0.27 <0.27 <0.27 <0.27 <0.27 <0.27 <0.27 <0.27 <0.27 <0.27 <0.27 <0.27 NS <0.27<0.22 <0.22 <0.22 <0.22 <0.22 <0.22 <0.22 <0.22 <0.22 <0.22 <0.22 <0.22 NS <0.22<0.23 <0.23 <0.23 <0.23 <0.23 <0.23 <0.23 <0.23 <0.23 <0.23 <0.23 <0.23 NS <0.23<0.33 <0.33 <0.33 <0.33 <0.33 <0.33 <0.33 <0.33 <0.33 <0.33 <0.33 <0.33 NS <0.33<0.47 <0.47 <0.47 <0.47 <0.47 <0.47 <0.47 <0.47 <0.47 <0.47 <0.47 <0.47 NS <0.47<0.18 <0.18 <0.18 <0.18 <0.18 <0.18 <0.18 <0.18 <0.18 <0.18 <0.18 <0.18 NS <0.18<0.13 <0.13 <0.13 <0.13 <0.13 <0.13 <0.13 <0.13 <0.13 <0.13 0.15 J <0.13 NS <0.13<0.18 <0.18 <0.18 <0.18 <0.18 <0.18 <0.18 <0.18 <0.18 <0.18 <0.18 <0.18 NS <0.18<0.13 <0.13 <0.13 <0.13 <0.13 <0.13 <0.13 <0.13 <0.13 <0.13 <0.13 <0.13 NS <0.13<1.7 <1.7 <1.7 <1.7 <1.7 <1.7 <1.7 <1.7 <1.7 <1.7 <1.7 <1.7 NS <1.7<1.9 4.1 B 4.0 J <1.9 <1.9 <1.9 18 5.1 J <1.9 <1.9 <1.9 69 NS 11 B<9.6 <9.6 <9.6 <9.6 <9.6 <9.6 <9.6 <9.6 <9.6 <9.6 <9.6 <9.6 NS <9.6<2.8 <2.8 <2.8 <2.8 <2.8 <2.8 <2.8 <2.8 <2.8 <2.8 <2.8 <2.8 NS <2.8<1.4 <1.4 <1.4 <1.4 <1.4 <1.4 <1.4 <1.4 <1.4 <1.4 <1.4 <1.4 NS <1.4
<0.17 <0.17 <0.17 <0.17 <0.17 <0.17 <0.17 <0.17 <0.17 <0.17 <0.17 <0.17 NS <0.17<0.16 <0.16 <0.16 <0.16 <0.16 <0.16 <0.16 <0.16 <0.16 <0.16 <0.16 <0.16 NS <0.16<0.17 <0.17 <0.17 <0.17 <0.17 <0.17 <0.17 <0.17 <0.17 <0.17 <0.17 <0.17 NS <0.17<0.46 <0.46 <0.46 <0.46 <0.46 <0.46 <0.46 <0.46 <0.46 <0.46 <0.46 <0.46 NS <0.460.64 B <0.17 <0.17 <0.17 <0.17 0.47 B <0.17 <0.17 <0.17 0.38 B <0.17 <0.17 NS <0.17<0.19 <0.19 <0.19 <0.19 <0.19 <0.19 <0.19 <0.19 <0.19 <0.19 <0.19 <0.19 NS <0.19<0.17 <0.17 <0.17 <0.17 <0.17 <0.17 <0.17 <0.17 <0.17 <0.17 <0.17 <0.17 NS <0.17<0.17 <0.17 <0.17 <0.17 <0.17 <0.17 <0.17 <0.17 <0.17 <0.17 <0.17 <0.17 NS <0.171.0 B <0.16 <0.16 <0.16 <0.16 2.0 B <0.16 <0.16 <0.16 1.5 B 1.5 B 0.16 J NS <0.16<0.21 <0.21 <0.21 <0.21 <0.21 <0.21 <0.21 <0.21 <0.21 <0.21 <0.21 <0.21 NS <0.21<0.16 <0.16 <0.16 <0.16 <0.16 <0.16 <0.16 <0.16 <0.16 <0.16 <0.16 <0.16 NS <0.16<0.31 <0.31 <0.31 <0.31 <0.31 <0.31 <0.31 <0.31 <0.31 <0.31 <0.31 <0.31 NS <0.31<0.41 <0.41 <0.41 <0.41 <0.41 <0.41 <0.41 <0.41 <0.41 <0.41 <0.41 <0.41 NS <0.41<0.86 <0.86 <0.86 <0.86 <0.86 <0.86 <0.86 <0.86 <0.86 <0.86 <0.86 <0.86 NS <0.86<0.16 <0.16 <0.16 <0.16 <0.16 <0.16 <0.16 <0.16 <0.16 <0.16 <0.16 <0.16 NS <0.16<0.23 <0.23 <0.23 <0.23 <0.23 <0.23 <0.23 <0.23 <0.23 <0.23 <0.23 <0.23 NS <0.23<37 <37 <37 <37 <37 <37 <37 <37 <37 <37 <37 <37 NS <37
<0.15 <0.15 <0.15 <0.15 <0.15 <0.15 <0.15 <0.15 <0.15 <0.15 <0.15 <0.15 NS <0.15<1.6 <1.6 <1.6 <1.6 <1.6 <1.6 <1.6 <1.6 <1.6 <1.6 <1.6 <1.6 NS <1.6
<0.21 <0.21 <0.21 <0.21 <0.21 <0.21 <0.21 <0.21 <0.21 <0.21 <0.21 <0.21 NS 0.30 J
MW-36MW-34 MW-35
Page 5 of 8

Table 1Groundwater Sampling Results
PlumeStop Phase 1 Pilot Study at Old Outfall 002Chemours Fayetteville WorksFayetteville, North Carolina
Parameter Name Units
Location IDDate Sampled
Sample Purpose
Methyl Chloride UG/LMethyl Ethyl Ketone UG/LMethyl Isobutyl Ketone UG/LMethyl Methacrylate UG/LMethylene Bromide UG/LMethylene Chloride UG/LOrtho-Xylene UG/LPropionitrile UG/LStyrene UG/LTetrachloroethene UG/LToluene UG/Ltrans-1,2-Dichloroethene UG/Ltrans-1,3-Dichloropropene UG/Ltrans-1,4-Dichlorobutene-2 UG/LTrichloroethene UG/LTrichlorofluoromethane UG/LVinyl Acetate UG/LVinyl Chloride UG/LXylenes UG/L1,4-Dioxane UG/L
Calcium MG/LCalcium MG/LCarbon MG/LDissolved Organic Carbon UG/LTotal Hardness As CaCO3 MG/L
Perfluorobutane Sulfonic Acid UG/LPerfluorobutanoic Acid UG/LPerfluorodecanoic Acid UG/LPerfluorododecanoic Acid UG/LPerfluoroheptanoic Acid UG/LPerfluorohexane Sulfonic Acid UG/LPerfluorohexanoic Acid UG/LPerfluorononanoic Acid UG/LPerfluoropentanoic Acid UG/LPerfluoroundecanoic Acid UG/LPFOA UG/L
Miscellaneous
PFAS (537 Method)
05/02/2019 06/19/2019 07/18/2019 08/09/2019 08/09/2019 05/02/2019 06/18/2019 07/17/2019 08/09/2019 05/02/2019 05/02/2019 06/18/2019 07/17/2019 08/09/2019FS FS FS FS DUP FS FS FS FS FS DUP FS FS FS
Result Result Result Result Result Result Result Result Result Result Result Result Result Result
MW-36MW-34 MW-35
<0.30 <0.30 <0.30 <0.30 <0.30 <0.30 <0.30 <0.30 <0.30 <0.30 <0.30 0.41 J NS <0.30<2.0 <2.0 <2.0 <2.0 <2.0 <2.0 <2.0 <2.0 <2.0 <2.0 <2.0 <2.0 NS <2.0
<0.98 <0.98 <0.98 <0.98 <0.98 <0.98 <0.98 <0.98 <0.98 <0.98 <0.98 <0.98 NS <0.98<1.1 <1.1 <1.1 <1.1 <1.1 <1.1 <1.1 <1.1 <1.1 <1.1 <1.1 <1.1 NS <1.1
<0.17 <0.17 <0.17 <0.17 <0.17 <0.17 <0.17 <0.17 <0.17 <0.17 <0.17 <0.17 NS <0.17<0.94 <0.94 <0.94 <0.94 <0.94 <0.94 <0.94 <0.94 <0.94 <0.94 <0.94 <0.94 NS <0.94<0.19 <0.19 <0.19 <0.19 <0.19 <0.19 <0.19 <0.19 <0.19 <0.19 <0.19 <0.19 NS <0.19<3.7 <3.7 <3.7 <3.7 <3.7 <3.7 <3.7 <3.7 <3.7 <3.7 <3.7 <3.7 NS <3.7
<0.36 <0.36 <0.36 <0.36 <0.36 <0.36 <0.36 <0.36 <0.36 <0.36 <0.36 <0.36 NS <0.36<0.20 <0.20 <0.20 <0.20 <0.20 <0.20 <0.20 <0.20 <0.20 <0.20 <0.20 <0.20 NS <0.20<0.17 <0.17 <0.17 <0.17 <0.17 <0.17 <0.17 <0.17 <0.17 <0.17 <0.17 <0.17 NS <0.17<0.15 <0.15 <0.15 <0.15 <0.15 <0.15 <0.15 <0.15 <0.15 <0.15 <0.15 <0.15 NS <0.15<0.19 <0.19 <0.19 <0.19 <0.19 <0.19 <0.19 <0.19 <0.19 <0.19 <0.19 <0.19 NS <0.19<0.80 <0.80 <0.80 <0.80 <0.80 <0.80 <0.80 <0.80 <0.80 <0.80 <0.80 <0.80 NS <0.80<0.16 <0.16 <0.16 <0.16 <0.16 <0.16 <0.16 <0.16 <0.16 <0.16 <0.16 <0.16 NS <0.16<0.29 <0.29 <0.29 <0.29 <0.29 <0.29 <0.29 <0.29 <0.29 <0.29 <0.29 <0.29 NS <0.29<0.94 <0.94 <0.94 <0.94 <0.94 <0.94 <0.94 <0.94 <0.94 <0.94 <0.94 <0.94 NS <0.94<0.10 <0.10 <0.10 <0.10 <0.10 <0.10 <0.10 <0.10 <0.10 <0.10 <0.10 <0.10 NS <0.10<0.19 <0.19 <0.19 <0.19 <0.19 <0.19 <0.19 <0.19 <0.19 <0.19 <0.19 <0.19 NS <0.19<19 <19 <19 <19 <19 <19 <19 <19 <19 <19 <19 <19 NS <19
1.1 B 3.7 3.7 3.9 4 3.3 2.9 3.7 3.6 2.7 2.8 4.4 9.8 5.21 3.4 3.4 3.4 3.3 2.7 2.9 3.6 2.8 2.5 2.6 4.2 8.8 3.9
1.2 5.6 1.6 0.70 J 0.83 J 1.2 7.9 5.6 6.1 1.3 1.3 45 32 291200 B 7900 1600 1400 B 1600 B 1400 20000 5600 7300 1400 1400 28000 16000 13000
4.4 850 13 30 J 18 J 11 1200 29 150 J 7.1 J 13 J 1200 220 <7.5
<0.0020 <0.0020 <0.0020 <0.0020 <0.0020 0.0024 <0.0025 <0.0020 <0.0020 0.0025 0.0025 <0.0020 <0.0020 <0.00200.06 0.0094 0.0047 0.0028 0.0034 0.037 <0.0044 0.0036 0.0034 0.046 0.048 0.017 0.0045 0.0073
0.0025 <0.0020 <0.0020 <0.0020 <0.0020 0.0031 <0.0039 <0.0020 <0.0020 0.0027 0.0025 <0.0020 <0.0020 <0.0020<0.0020 <0.0020 <0.0020 <0.0020 <0.0020 <0.0020 <0.0069 <0.0020 <0.0020 <0.0020 <0.0020 <0.0020 <0.0020 <0.0020
0.015 <0.0020 <0.0020 <0.0020 <0.0020 0.013 <0.0031 <0.0020 <0.0020 0.016 0.016 <0.0020 0.0029 <0.00200.0029 <0.0020 <0.0020 <0.0020 <0.0020 0.0036 0.0032 <0.0020 <0.0020 0.0042 0.0039 <0.0020 <0.0020 <0.00200.0098 <0.0020 <0.0020 <0.0020 <0.0020 0.011 <0.0073 <0.0020 <0.0020 0.012 0.014 <0.0020 <0.0020 <0.00200.0067 <0.0020 <0.0020 <0.0020 <0.0020 0.0045 <0.0034 <0.0020 <0.0020 0.0045 0.0046 <0.0020 <0.0020 <0.00200.095 0.009 0.0028 0.0021 0.0023 0.046 <0.0061 <0.0020 <0.0020 0.061 0.066 <0.0020 <0.0020 0.0037
<0.0020 <0.0020 <0.0020 <0.0020 <0.0020 <0.0020 <0.014 <0.0020 <0.0020 <0.0020 <0.0020 <0.0020 <0.0020 <0.00200.015 <0.0020 <0.0020 <0.0020 <0.0020 0.013 <0.011 <0.0020 <0.0020 0.018 0.019 <0.0020 <0.0020 <0.0020
Page 6 of 8

Table 1Groundwater Sampling Results
PlumeStop Phase 1 Pilot Study at Old Outfall 002Chemours Fayetteville WorksFayetteville, North Carolina
Parameter Name Units
Location IDDate Sampled
Sample Purpose
PFOS UG/LHFPO-Dimer Acid UG/LPerfluorodecane Sulfonic Acid UG/LPerfluorotetradecanoic Acid UG/LPerfluorotridecanoic Acid UG/L10:2 Fluorotelomer sulfonate UG/L, , ,perfluorodecanesulfonate (8:2 FTS) UG/L, , ,perfluorohexanesulfonate (4:2 FTS) UG/L6:2 Fluorotelomer sulfonate UG/LADONA UG/LF-53B Major UG/LF-53B Minor UG/LN-methyl perfluorooctane sulfonamidoacetic acid UG/LN-ethyl perfluorooctane sulfonamidoacetic acid UG/LNaDONA UG/LPerfluorododecane sulfonic acid (PFDoS) UG/LPerfluoroheptane sulfonic acid (PFHpS) UG/LPerfluorohexadecanoic acid (PFHxDA) UG/LPerfluorononanesulfonic acid UG/LPerfluorooctadecanoic acid UG/LPerfluorooctane Sulfonamide UG/LPerfluoropentane sulfonic acid (PFPeS) UG/L
octanesulfonamide UG/L octanesulfonamido)-ethanol UG/L octanesulfonamido)-ethanol UG/LByproduct 4 UG/LByproduct 5 UG/LByproduct 6 UG/LEVE Acid UG/L
PFAS (Table 3+)
05/02/2019 06/19/2019 07/18/2019 08/09/2019 08/09/2019 05/02/2019 06/18/2019 07/17/2019 08/09/2019 05/02/2019 05/02/2019 06/18/2019 07/17/2019 08/09/2019FS FS FS FS DUP FS FS FS FS FS DUP FS FS FS
Result Result Result Result Result Result Result Result Result Result Result Result Result Result
MW-36MW-34 MW-35
0.03 <0.0020 <0.0020 <0.0020 <0.0020 0.014 <0.0068 <0.0020 <0.0020 0.016 0.018 <0.0020 <0.0020 <0.00204.9 0.15 0.054 0.036 0.036 3.2 0.029 0.019 0.018 4.7 J 6.1 J <0.0040 0.0061 0.035
<0.0020 <0.0020 <0.0020 <0.0020 <0.0020 <0.0020 <0.0040 <0.0020 <0.0020 <0.0020 <0.0020 <0.0020 <0.0020 <0.0020<0.0020 <0.0020 <0.0020 <0.0020 <0.0020 <0.0020 <0.0036 <0.0020 <0.0020 <0.0020 <0.0020 <0.0020 <0.0020 <0.0020<0.0020 <0.0020 <0.0020 <0.0020 <0.0020 <0.0020 <0.016 <0.0020 <0.0020 <0.0020 <0.0020 <0.0020 <0.0020 <0.0020<0.0020 <0.0020 <0.0020 <0.0020 <0.0020 <0.0020 <0.0024 <0.0020 <0.0020 <0.0020 <0.0020 <0.0020 <0.0020 <0.0020
<0.020 <0.020 <0.020 <0.020 <0.020 <0.020 <0.025 <0.020 <0.020 <0.020 <0.020 <0.020 <0.020 <0.020
<0.020 <0.020 <0.020 <0.020 <0.020 <0.020 <0.065 <0.020 <0.020 <0.020 <0.020 <0.020 <0.020 <0.020<0.020 <0.020 <0.020 <0.020 <0.020 <0.020 <0.025 <0.020 <0.020 <0.020 <0.020 <0.020 <0.020 <0.020
<0.0021 <0.0021 <0.0021 <0.0021 <0.0021 <0.0021 <0.0024 <0.0021 <0.0021 <0.0021 <0.0021 <0.0021 <0.0021 <0.0021<0.0020 <0.0020 <0.0020 <0.0020 <0.0020 <0.0020 <0.0030 <0.0020 <0.0020 <0.0020 <0.0020 <0.0020 <0.0020 <0.0020<0.0020 <0.0020 <0.0020 <0.0020 <0.0020 <0.0020 <0.0040 <0.0020 <0.0020 <0.0020 <0.0020 <0.0020 <0.0020 <0.0020
<0.020 <0.020 <0.020 <0.020 <0.020 <0.020 <0.039 <0.020 <0.020 <0.020 <0.020 <0.020 <0.020 <0.020
<0.020 <0.020 <0.020 <0.020 <0.020 <0.020 <0.024 <0.020 <0.020 <0.020 <0.020 <0.020 <0.020 <0.020<0.0021 <0.0021 <0.0021 <0.0021 <0.0021 <0.0021 <0.0024 <0.0021 <0.0021 <0.0021 <0.0021 <0.0021 <0.0021 <0.0021
<0.0020 <0.0020 <0.0020 <0.0020 <0.0020 <0.0020 <0.0056 <0.0020 <0.0020 <0.0020 <0.0020 <0.0020 <0.0020 <0.0020
<0.0020 <0.0020 <0.0020 <0.0020 <0.0020 <0.0020 <0.0024 <0.0020 <0.0020 <0.0020 <0.0020 <0.0020 <0.0020 <0.0020
<0.0020 <0.0020 <0.0020 <0.0020 <0.0020 <0.0020 <0.011 <0.0020 <0.0020 UJ <0.0020 <0.0020 <0.0020 UJ <0.0020 <0.0020<0.0020 <0.0020 <0.0020 <0.0020 <0.0020 <0.0020 <0.0020 <0.0020 <0.0020 <0.0020 <0.0020 <0.0020 <0.0020 <0.0020<0.0020 <0.0020 <0.0020 <0.0020 <0.0020 <0.0020 <0.0058 <0.0020 <0.0020 UJ <0.0020 <0.0020 <0.0020 UJ <0.0020 <0.0020<0.0020 <0.0020 <0.0020 <0.0020 <0.0020 UJ <0.0020 <0.0044 UJ <0.0020 0.0034 J <0.0020 <0.0020 <0.0020 <0.0020 <0.0020 UJ
<0.0020 <0.0020 <0.0020 <0.0020 <0.0020 <0.0020 <0.0038 <0.0020 <0.0020 <0.0020 <0.0020 <0.0020 <0.0020 <0.0020
<0.037 UJ <0.037 UJ <0.037 <0.037 <0.037 <0.037 UJ <0.0037 UJ <0.037 <0.037 <0.037 UJ <0.037 UJ <0.0037 UJ <0.037 <0.037<0.060 <0.060 UJ <0.060 <0.060 <0.060 <0.060 <0.0060 UJ <0.060 <0.060 <0.060 <0.060 UJ <0.0060 UJ <0.060 <0.060<0.11 <0.11 UJ <0.11 <0.11 <0.11 <0.11 <0.011 UJ <0.11 <0.11 <0.11 <0.11 UJ <0.011 UJ <0.11 <0.110.52 <0.16 UJ <0.16 <0.16 <0.16 0.37 <0.016 UJ <0.16 <0.16 0.56 J 0.74 J <0.016 UJ <0.16 <0.16
0.92 J 0.16 J 0.091 <0.058 <0.058 1.1 J 0.026 J <0.058 0.058 J 1.4 J 1.5 J <0.0058 UJ <0.058 <0.058<0.015 <0.015 UJ <0.015 <0.015 <0.015 <0.015 <0.0020 UJ <0.015 <0.015 <0.015 0.016 J <0.0020 UJ <0.015 <0.015<0.024 <0.024 UJ <0.024 <0.024 <0.024 <0.024 <0.0024 UJ <0.024 <0.024 <0.024 <0.024 UJ <0.0024 UJ <0.024 <0.024
Page 7 of 8

Table 1Groundwater Sampling Results
PlumeStop Phase 1 Pilot Study at Old Outfall 002Chemours Fayetteville WorksFayetteville, North Carolina
Parameter Name Units
Location IDDate Sampled
Sample Purpose
Hydro-EVE Acid UG/LN-methyl perfluoro-1-octanesulfonamide UG/LNVHOS UG/LPEPA UG/LPES UG/LPFECA B UG/LPFECA-G UG/LPFESA-BP1 UG/LPFESA-BP2 UG/LPFMOAA UG/LPFO2HxA UG/LPFO3OA UG/LPFO4DA UG/LPFO5DA UG/LPMPA UG/LR-EVE UG/L
Notes:NS = Not Sampled< = Not detected at the reported detection limitJ = Estimated ValueUJ = Not detected at the estimated detection limitFS = Field SampleDUP = Duplicate Sample
05/02/2019 06/19/2019 07/18/2019 08/09/2019 08/09/2019 05/02/2019 06/18/2019 07/17/2019 08/09/2019 05/02/2019 05/02/2019 06/18/2019 07/17/2019 08/09/2019FS FS FS FS DUP FS FS FS FS FS DUP FS FS FS
Result Result Result Result Result Result Result Result Result Result Result Result Result Result
MW-36MW-34 MW-35
0.078 <0.028 UJ <0.028 <0.028 <0.028 0.057 <0.0028 UJ <0.028 <0.028 0.068 0.081 J <0.0028 UJ <0.028 <0.028
<0.035 UJ <0.035 UJ <0.035 <0.035 <0.035 <0.035 UJ <0.0035 UJ <0.035 <0.035 <0.035 <0.035 UJ <0.0035 UJ <0.035 <0.0351.3 0.25 J 0.095 <0.054 <0.054 1.2 0.075 J 0.066 <0.054 1.4 1.5 J <0.0054 UJ <0.054 <0.0543 0.14 J <0.047 <0.047 <0.047 1.5 0.038 J <0.047 <0.047 2.3 2.8 J <0.020 UJ <0.047 <0.047
<0.046 <0.046 UJ <0.046 <0.046 <0.046 <0.046 <0.0046 UJ <0.046 <0.046 <0.046 <0.046 UJ <0.0046 UJ <0.046 <0.046<0.060 <0.060 UJ <0.060 <0.060 <0.060 <0.060 <0.0060 UJ <0.060 <0.060 <0.060 <0.060 UJ <0.0060 UJ <0.060 <0.060<0.041 <0.041 UJ <0.041 <0.041 <0.041 <0.041 <0.0041 UJ <0.041 <0.041 <0.041 <0.041 UJ <0.0041 UJ <0.041 <0.0410.052 <0.027 UJ <0.027 <0.027 <0.027 0.04 <0.0027 UJ <0.027 <0.027 0.049 0.041 J <0.0027 UJ <0.027 <0.0270.73 <0.030 UJ <0.030 <0.030 <0.030 0.5 0.0051 J <0.030 <0.030 0.51 0.54 J <0.0030 UJ <0.030 <0.030111 J 68 J 34 26 26 80 16 J 26 49 J 98 J 115 J 4.9 J 26 55
22 7.0 J 2.1 1.7 1.5 17 1.8 J 1.4 1.5 22 27 J 0.013 J 0.16 2.45.4 0.064 J 0.12 <0.058 <0.058 4.4 0.053 J <0.058 <0.058 5.7 6.1 J <0.0058 UJ <0.058 <0.0581.3 <0.079 UJ <0.079 <0.079 <0.079 1.1 0.017 J <0.079 <0.079 1.4 1.5 J <0.0079 UJ <0.079 <0.0790.83 <0.034 UJ <0.034 <0.034 <0.034 0.38 0.0052 J <0.034 <0.034 0.41 0.36 J <0.0034 UJ <0.034 <0.0346.6 <0.57 UJ <0.57 0.78 <0.57 3.4 0.21 J <0.57 1.1 5.1 6.8 J <0.057 UJ <0.57 10.2 <0.070 UJ <0.070 <0.070 <0.070 0.11 0.0070 J <0.070 <0.070 0.16 0.21 J <0.0070 UJ <0.070 <0.070
Page 8 of 8

APPENDIX A BORING AND WELL CONSTRUCTION LOGS


08-1
5-20
19 F
:\Log
s\Fa
yette
ville
\MW
-31.
bor
PARSONS INFRASTRUCTURE4704 Hedgemore Drive
Charlotte, North Carolina 28209
Fayetteville Phase I Pilot Study DrillingThe Chemours Company FC, LLC
Project Number: 449338
LOG OF BORING: MW-31(Page 1 of 1)
Depthin
feet
0
1
2
3
4
5
6
7
8
9
10
11
12
13
14
15
16
17
18
19
20
21
22
23
24
25
26
DESCRIPTION
0-5' SILTY SAND: Moderately yellowish brown, fine grained, damp.
5-8.5' SANDY SILT: Light gray, medium stiff, damp.
8.5-13.5' SAND:Grayish orange, fine grained, well sorted sand, dry.
13.5-16' SAND:Yellowish orange, medium grained, moist.
16-18':Light gray, medium to coarse grained, saturated.
18-20':Light gray, fine grained, well sorted sand, wet.
20-22':Light gray, medium grained, saturated.
Top of clay at 22'.22-23.5' CLAY:Dark gray, soft, trace of mica.
23.5-25' SILTY SAND:Light brown, fine grained, micaceous, moist.End of Boring at 25'.
USC
S
SM
ML
SP
SP
SP
SP
SP
CL
SM
GR
APH
IC Surf.Elev.
145.478
145.48
144.48
143.48
142.48
141.48
140.48
139.48
138.48
137.48
136.48
135.48
134.48
133.48
132.48
131.48
130.48
129.48
128.48
127.48
126.48
125.48
124.48
123.48
122.48
121.48
120.48
Depthin
feet
0
1
2
3
4
5
6
7
8
9
10
11
12
13
14
15
16
17
18
19
20
21
22
23
24
25
26
Well ConstructionInformation
Date Started : 4/17/2019Date Completed : 4/17/2019Drilling Method : Hollow Stem AugerSampling Method : MacrocoreDrilling Firm : CascadeLead Driller : Danny FerrellLead Driller License # : NCWC3221-BGeologist : Marc HarderBoring Log By : Marc Harder
NAD83 1983 : NC SP CoordinatesNorthing : 396390.698Easting : 2049622.615Completed Depth: : 22'Boring Depth : 25'Elevation/TOC : 145.478/147.699
WELL RISERMaterial : PVCDiameter : 2"
WELL SCREENMaterial : Schedule 40 PVCDiameter : 2"Slot Size : 0.010"Length : 5' (17-22')
WELL CONSTRUCTIONBentonite Grout : 0-12'Bentonite Seal : 12-14'Sand Filter Pack : 14-22'
TOC Elev: : 147.699Well: MW-31
BentoniteGrout
BentoniteSeal
SandFiler Pack
PVCCasing
ExpandablePlug
Riser
Screen

08-1
5-20
19 F
:\Log
s\Fa
yette
ville
\MW
-32.
bor
PARSONS INFRASTRUCTURE4704 Hedgemore Drive
Charlotte, North Carolina 28209
Fayetteville Phase I Pilot Study DrillingThe Chemours Company FC, LLC
Project Number: 449338
LOG OF BORING: MW-32(Page 1 of 1)
Depthin
feet
0
1
2
3
4
5
6
7
8
9
10
11
12
13
14
15
16
17
18
19
20
21
22
DESCRIPTION
0-5' SAND: Brown, fine grained.
5-8' SANDY CLAY:Moderate yellow brown, very stiff, damp.
8-10' SAND:Yellowish orange to light brown, fine to medium grained, dry.
10-11': Damp.3" clay layer at 11'.
11-13.5':Yellowish gray, fine to medium grained, wet at 12'.
13.5-15': Light gray medium grained, saturated.
15-18.5': Light gray, medium to coarse grained, loose, saturated.
18.5-20' CLAY:Light brown and light gray, plastic, soft, damp.
End of Boring at 20'.
USC
S
SP
CL
SP
SP
SP
SP
SP
CL
GR
APH
IC Surf.Elev.
144.633
144.63
143.63
142.63
141.63
140.63
139.63
138.63
137.63
136.63
135.63
134.63
133.63
132.63
131.63
130.63
129.63
128.63
127.63
126.63
125.63
124.63
123.63
Depthin
feet
0
1
2
3
4
5
6
7
8
9
10
11
12
13
14
15
16
17
18
19
20
21
22
Well ConstructionInformation
Date Started : 4/16/2019Date Completed : 4/16/2019Drilling Method : Hollow Stem AugerSampling Method : MacrocoreDrilling Firm : CascadeLead Driller : Danny FerrellLead Driller License # : NCWC3221-BGeologist : Marc HarderBoring Log By : Marc Harder
NAD83 1983 : NC SP CoordinatesNorthing : 396359.33Easting : 2049651.86Completed Depth: : 18.5'Boring Depth : 20'Elevation/TOC : 144.633/147.106
WELL RISERMaterial : PVCDiameter : 2"
WELL SCREENMaterial : Schedule 40 PVCDiameter : 2"Slot Size : 0.010"Length : 5.0' (13.5-18.5')
WELL CONSTRUCTIONBentonite Grout : 0-8'Bentonite Seal : 8-10'Sand Filter Pack : 10-18.5'
TOC Elev: : 147.106Well: MW-32
BentoniteGrout
BentoniteSeal
SandFiler Pack
PVCCasing
ExpandablePlug
Riser
Screen

08-1
5-20
19 F
:\Log
s\Fa
yette
ville
\MW
-33.
bor
PARSONS INFRASTRUCTURE4704 Hedgemore Drive
Charlotte, North Carolina 28209
Fayetteville Phase I Pilot Study DrillingThe Chemours Company FC, LLC
Project Number: 449338
LOG OF BORING: MW-33(Page 1 of 1)
Depthin
feet
0
1
2
3
4
5
6
7
8
9
10
11
12
13
14
15
16
17
18
19
20
21
DESCRIPTION
0-5' SANDY CLAY: Light brown, damp.
5-7.5':Medium gray, medium stiff, damp.
7.5-9' SILTY SAND:Light gray, fine grained, well sorted, damp.
9-10' SAND:Yellowish orange, fine to medium grained, damp.10-11':Very light to medium gray, fine grained, well sorted, very moist.
11-15':White to light gray, medium grained with trace of coarse grained, very saturated.
15-17':Light gray, medium to coarse grained, grains are subangular to subrounded, trace of heavy minerals, very wet.Top of clay at 17'.
17-19.5' CLAY:Brown and yellowish orange, plastic, soft, moist.
19.5-20': Dark gray.End of Boring at 20'.
USC
S
CL
CL
SM
SP
SP
SP
SP
CL
CL
GR
APH
IC Surf.Elev.
144.283
144.28
143.28
142.28
141.28
140.28
139.28
138.28
137.28
136.28
135.28
134.28
133.28
132.28
131.28
130.28
129.28
128.28
127.28
126.28
125.28
124.28
Depthin
feet
0
1
2
3
4
5
6
7
8
9
10
11
12
13
14
15
16
17
18
19
20
21
Well ConstructionInformation
TOC Elev: : 146.82Well: MW-33
BentoniteGrout
BentoniteSeal
SandFiler Pack
PVCCasing
ExpandablePlug
Riser
Screen
WELL RISERMaterial : PVCDiameter : 2"
WELL SCREENMaterial : Schedule 40 PVCDiameter : 2"Slot Size : 0.010"Length : 5' (12-17')
WELL CONSTRUCTIONBentonite Grout : 0-8'Bentonite Seal : 8-10'Sand Filter Pack : 10-17'
Date Started : 4/16/2019Date Completed : 4/16/2019Drilling Method : Hollow Stem AugerSampling Method : MacrocoreDrilling Firm : CascadeLead Driller : Danny FerrellLead Driller License # : NCWC3221-BGeologist : Marc HarderBoring Log By : Marc Harder
NAD83 1983 : NC SP CoordinatesNorthing : 396337.57Easting : 2049678.92Completed Depth: : 17'Boring Depth : 20'Elevation/TOC : 144.283/146.82

08-1
5-20
19 F
:\Log
s\Fa
yette
ville
\MW
-34.
bor
PARSONS INFRASTRUCTURE4704 Hedgemore Drive
Charlotte, North Carolina 28209
Fayetteville Phase I Pilot Study DrillingThe Chemours Company FC, LLC
Project Number: 449338
LOG OF BORING: MW-34(Page 1 of 1)
Depthin
feet
0
1
2
3
4
5
6
7
8
9
10
11
12
13
14
15
16
17
18
19
20
21
22
23
24
DESCRIPTION
0-5' SILTY SAND: Brown, fine grained.
5-8' SANDY CLAY:Olive gray, firm, damp.
8-10' SAND:Yellowish orange, fine grained, well sorted, damp.
10-15':Yellowish orange, fine to medium grained, loose, well sorted, moist at 14.5'.
15-20':Light gray, medium to coarse grained, loose, very saturated.
20-22': Saturated.
22-24' CLAY:Dark gray, soft, plastic, damp.
End of Boring at 24'.
USC
S
SM
CL
SP
SP
SP
SP
CL
GR
APH
IC Surf.Elev.
145.17
145.17
144.17
143.17
142.17
141.17
140.17
139.17
138.17
137.17
136.17
135.17
134.17
133.17
132.17
131.17
130.17
129.17
128.17
127.17
126.17
125.17
124.17
123.17
122.17
Depthin
feet
0
1
2
3
4
5
6
7
8
9
10
11
12
13
14
15
16
17
18
19
20
21
22
23
24
Well ConstructionInformation
Date Started : 4/17/2019Date Completed : 4/17/2019Drilling Method : Hollow Stem AugerSampling Method : MacrocoreDrilling Firm : CascadeLead Driller : Danny FerrellLead Driller License # : NCWC3221-BGeologist : Marc HarderBoring Log By : Marc Harder
NAD83 1983 : NC SP CoordinatesNorthing : 396352.67Easting : 2049619.25Completed Depth: : 22'Boring Depth : 24'Elevation/TOC : 145.17/147.972
WELL RISERMaterial : PVCDiameter : 2"
WELL SCREENMaterial : Schedule 40 PVCDiameter : 2"Slot Size : 0.010"Length : 5' (17-22')
WELL CONSTRUCTIONBentonite Grout : 0-12'Bentonite Seal : 12-14'Sand Filter Pack : 14-22'
TOC Elev: : 147.972Well: MW-34
BentoniteGrout
BentoniteSeal
SandFiler Pack
PVCCasing
ExpandablePlug
Riser
Screen

08-1
5-20
19 F
:\Log
s\Fa
yette
ville
\MW
-35.
bor
PARSONS INFRASTRUCTURE4704 Hedgemore Drive
Charlotte, North Carolina 28209
Fayetteville Phase I Pilot Study DrillingThe Chemours Company FC, LLC
Project Number: 449338
LOG OF BORING: MW-35(Page 1 of 1)
Depthin
feet
0
1
2
3
4
5
6
7
8
9
10
11
12
13
14
15
16
17
18
19
20
21
DESCRIPTION
0-5' SILTY SAND: Brown, fine grained.
5-8' SANDY CLAY:Olive gray, firm, trace organics, damp.
8-9.5' SAND:Yellowish orange, fine to medium grained, loose, damp.
9.5-11':Light gray, moist.
11-12.5' SANDY CLAY:Light gray.
12.5-13' SAND: Light gray, very fine to fine grained, wet.13-15':Light gray to grayish orange, fine to medium grained, saturated.
15-16': Wet.
16-19': light gray, medium to coarse grained, very saturated.
19-20' CLAY:Dark gray, soft, damp.
End of Boring at 20'.
USC
S
SM
CL
SP
SP
CL
SP
SP
SP
SP
CL
GR
APH
IC Surf.Elev.
145.025
145.03
144.03
143.03
142.03
141.03
140.03
139.03
138.03
137.03
136.03
135.03
134.03
133.03
132.03
131.03
130.03
129.03
128.03
127.03
126.03
125.03
Depthin
feet
0
1
2
3
4
5
6
7
8
9
10
11
12
13
14
15
16
17
18
19
20
21
Well ConstructionInformation
Date Started : 4/16/2019Date Completed : 4/16/2019Drilling Method : Hollow Stem AugerSampling Method : MacrocoreDrilling Firm : CascadeLead Driller : Danny FerrellLead Driller License # : NCWC3221-BGeologist : Marc HarderBoring Log By : Marc Harder
NAD83 1983 : NC SP CoordinatesNorthing : 396332.97Easting : 2049631.43Completed Depth: : 19'Boring Depth : 20'Elevation/TOC : 145.025/147.541
WELL RISERMaterial : PVCDiameter : 2"
WELL SCREENMaterial : Schedule 40 PVCDiameter : 2"Slot Size : 0.010"Length : 5' (14-19')
WELL CONSTRUCTIONBentonite Grout : 0-10'Bentonite Seal : 10-12'Sand Filter Pack : 12-19'
TOC Elev: : 147.541Well: MW-35
BentoniteGrout
BentoniteSeal
SandFiler Pack
PVCCasing
ExpandablePlug
Riser
Screen

08-1
5-20
19 F
:\Log
s\Fa
yette
ville
\MW
-36.
bor
PARSONS INFRASTRUCTURE4704 Hedgemore Drive
Charlotte, North Carolina 28209
Fayetteville Phase I Pilot Study DrillingThe Chemours Company FC, LLC
Project Number: 449338
LOG OF BORING: MW-36(Page 1 of 1)
Depthin
feet
0
1
2
3
4
5
6
7
8
9
10
11
12
13
14
15
16
17
18
19
20
21
DESCRIPTION
USC
S
GR
APH
IC Surf.Elev.
144.684
144.68
143.68
142.68
141.68
140.68
139.68
138.68
137.68
136.68
135.68
134.68
133.68
132.68
131.68
130.68
129.68
128.68
127.68
126.68
125.68
124.68
Depthin
feet
0
1
2
3
4
5
6
7
8
9
10
11
12
13
14
15
16
17
18
19
20
21
Well ConstructionInformation
Date Started : 4/16/2019Date Completed : 4/16/2019Drilling Method : Hollow Stem AugerSampling Method : MacrocoreDrilling Firm : CascadeLead Driller : Danny FerrellLead Driller License # : NCWC3221-BGeologist : Marc HarderBoring Log By : Marc Harder
NAD83 1983 : NC SP CoordinatesNorthing : 396319.84Easting : 2049651.34Completed Depth: : 17'Boring Depth : 20'Elevation/TOC : 144.684/147.889
WELL RISERMaterial : PVCDiameter : 2"
WELL SCREENMaterial : Schedule 40 PVCDiameter : 2"Slot Size : 0.010"Length : 5' (12-17')
WELL CONSTRUCTIONBentonite Grout : 0-8'Bentonite Seal : 8-10'Sand Filter Pack : 10-17'
TOC Elev: : 147.889Well: MW-36
BentoniteGrout
BentoniteSeal
SandFiler Pack
PVCCasing
ExpandablePlug
Riser
Screen
0-5' SILTY SAND: Brown, fine grained, damp.
7-8' SAND:Brown, medium grained.
8-10.5':Light gray yellowish orange, fine to medium grained, well sorted, trace of mica, very moist at 10'.
10.5-11.5' CLAY:Brown, medium stiff, damp.
11.5-13.5' SAND:Yellowish orange, fine to medium grained, well sorted, very saturated.
13.5-15':Light gray.
15-17':Light gray, medium to coarse grained, grains are subangular to subrounded, very saturated.
17-19' CLAY:Yellowish orange, plastic, soft, damp.
19-20': Dark gray, soft, plastic, damp.
End of Boring at 20'.
SM
SP
SP
CL
SP
SP
SP
CL
CL

08-1
5-20
19 F
:\Log
s\Fa
yette
ville
\PZ-
19R
.bor
PARSONS INFRASTRUCTURE4704 Hedgemore Drive
Charlotte, North Carolina 28209
Well Replacement Around Sediment PondsFayetteville Phase I Pilot Study Drilling
The Chemours Company FC, LLC
Project Number: 449338
Date Started : 4/25/2019Date Completed : 4/25/2019Drilling Method : Hollow Stem AugerSampling Method : MacrocoreDrilling Firm : CascadeLead Driller : Danny FerrellLead Driller License # : NCWC3221-BGeologist : Marc HarderBoring Log By : Brandon Weidner
LOG OF BORING: PZ-19R(Page 1 of 1)
NAD83 1983 : NC SP CoordinatesNorthing : 397998.75Easting : 2049919.29Completed Depth: : 21'Boring Depth : 25'Elevation/TOC : 147.62/150.046
Depthin
feet
0
1
2
3
4
5
6
7
8
9
10
11
12
13
14
15
16
17
18
19
20
21
22
23
24
25
26
DESCRIPTION
0-8.5' SILTY SAND: Light brown, fine grained, damp.
8.5-10': Light gray, fine to medium grained, damp.
10-12' SAND:Light gray, medium grained, damp.
12-13' CLAY SAND:Light gray, clay lens at 13', damp.
13-15' SAND:Light gray, fine grained, heavy minerals present, wet at 14'.15-17':Light gray, fine to medium grained, clay lens at 16.5', subangular grains, wet.
17-20':Light gray, medium grained, wet.
20-21.5':Brown yellowish orange, fine to medium grained, wet.21.5-23' CLAY:Brown and dark gray, stiff, mica present, low plasticity.23-25' CLAY SAND:Dark gray, fine grained, organic rich, trace of mica.
End of Boring at 25'.
USC
S
SM
SM
SP
SC
SP
SP
SP
SP
CL
SC
GR
APH
IC Surf.Elev.
147.62
147.62
146.62
145.62
144.62
143.62
142.62
141.62
140.62
139.62
138.62
137.62
136.62
135.62
134.62
133.62
132.62
131.62
130.62
129.62
128.62
127.62
126.62
125.62
124.62
123.62
122.62
Depthin
feet
0
1
2
3
4
5
6
7
8
9
10
11
12
13
14
15
16
17
18
19
20
21
22
23
24
25
26
TOC Elev: : 150.046Well: PZ-19R
BentoniteGrout
BentoniteSeal
SandFiler Pack
PVCCasing
ExpandablePlug
Riser
Screen
Well ConstructionInformation
WELL RISERMaterial : PVCDiameter : 2"
WELL SCREENMaterial : Schedule 40 PVCDiameter : 2"Slot Size : 0.010"Length : 5' (16-21')
WELL CONSTRUCTIONBentonite Grout : 0-10'Bentonite Seal : 10-14'Sand Filter Pack : 14-21'

08-1
5-20
19 F
:\Log
s\Fa
yette
ville
\PZ-
20R
.bor
PARSONS INFRASTRUCTURE4704 Hedgemore Drive
Charlotte, North Carolina 28209
Well Replacement Around Sediment PondsFayetteville Phase I Pilot Study Drilling
The Chemours Company FC, LLC
Project Number: 449338
Date Started : 4/25/2019Date Completed : 4/25/2019Drilling Method : Hollow Stem AugerSampling Method : MacrocoreDrilling Firm : CascadeLead Driller : Danny FerrellLead Driller License # : NCWC3221-BGeologist : Marc HarderBoring Log By : Brandon Weidner
LOG OF BORING: PZ-20R(Page 1 of 1)
NAD83 1983 : NC SP CoordinatesNorthing : 398186.02Easting : 2049784.84Completed Depth: : 20'Boring Depth : 21'Elevation/TOC : 148.15/151.29
Depthin
feet
0
1
2
3
4
5
6
7
8
9
10
11
12
13
14
15
16
17
18
19
20
21
22
DESCRIPTION
0-7.5' SILTY SAND: Light brown, fine grained, backfill from rebuild of sediment ponds, damp.
7.5-10':Light brown, medium grained, damp.
10-15' SAND:Yellowish orange light brown and light gray, medium to coarse grained, loose sub-angular coarse grains, heavy minerals at 14', wet at 12'.
15-18':Light gray, medium to coarse grained, heavy minerals present, wet.
18-20'Light gray, fine grained, wet.
20-21' CLAY:Light brown, plastic, soft.End of Boring at 21'.
USC
S
SM
SM
SP
SP
SP
CL
GR
APH
IC Surf.Elev.
148.15
148.15
147.15
146.15
145.15
144.15
143.15
142.15
141.15
140.15
139.15
138.15
137.15
136.15
135.15
134.15
133.15
132.15
131.15
130.15
129.15
128.15
127.15
Depthin
feet
0
1
2
3
4
5
6
7
8
9
10
11
12
13
14
15
16
17
18
19
20
21
22
TOC Elev: : 151.29Well: PZ-20R
BentoniteGrout
BentoniteSeal
SandFiler Pack
PVCCasing
ExpandablePlug
Riser
Screen
Well ConstructionInformation
WELL RISERMaterial : PVCDiameter : 2"
WELL SCREENMaterial : Schedule 40 PVCDiameter : 2"Slot Size : 0.010"Length : 5' (15-20')
WELL CONSTRUCTIONBentonite Grout : 0-8.5'Bentonite Seal : 8.5-12'Sand Filter Pack : 12-20'
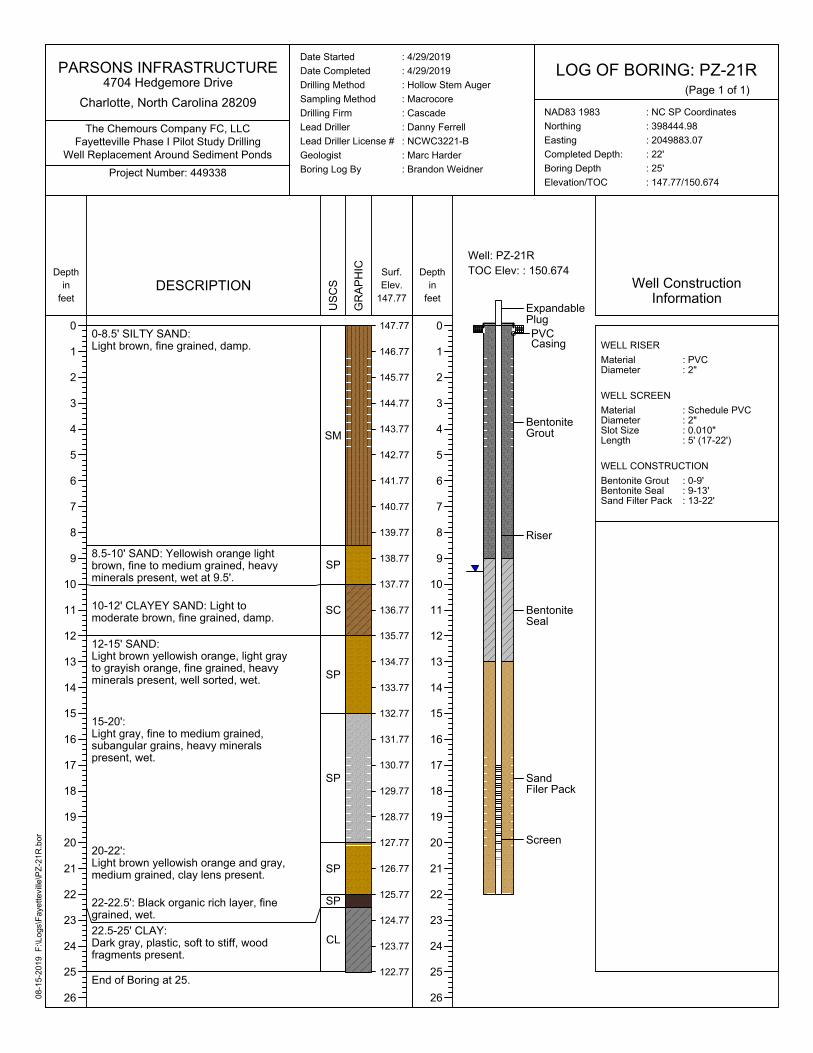
08-1
5-20
19 F
:\Log
s\Fa
yette
ville
\PZ-
21R
.bor
PARSONS INFRASTRUCTURE4704 Hedgemore Drive
Charlotte, North Carolina 28209
Well Replacement Around Sediment PondsFayetteville Phase I Pilot Study Drilling
The Chemours Company FC, LLC
Project Number: 449338
Date Started : 4/29/2019Date Completed : 4/29/2019Drilling Method : Hollow Stem AugerSampling Method : MacrocoreDrilling Firm : CascadeLead Driller : Danny FerrellLead Driller License # : NCWC3221-BGeologist : Marc HarderBoring Log By : Brandon Weidner
LOG OF BORING: PZ-21R(Page 1 of 1)
NAD83 1983 : NC SP CoordinatesNorthing : 398444.98Easting : 2049883.07Completed Depth: : 22'Boring Depth : 25'Elevation/TOC : 147.77/150.674
Depthin
feet
0
1
2
3
4
5
6
7
8
9
10
11
12
13
14
15
16
17
18
19
20
21
22
23
24
25
26
DESCRIPTION
0-8.5' SILTY SAND: Light brown, fine grained, damp.
8.5-10' SAND: Yellowish orange light brown, fine to medium grained, heavy minerals present, wet at 9.5'.
10-12' CLAYEY SAND: Light to moderate brown, fine grained, damp.
12-15' SAND:Light brown yellowish orange, light gray to grayish orange, fine grained, heavy minerals present, well sorted, wet.
15-20':Light gray, fine to medium grained, subangular grains, heavy minerals present, wet.
20-22':Light brown yellowish orange and gray, medium grained, clay lens present.
22-22.5': Black organic rich layer, fine grained, wet.22.5-25' CLAY:Dark gray, plastic, soft to stiff, wood fragments present.
End of Boring at 25.
USC
S
SM
SP
SC
SP
SP
SP
SP
CL
GR
APH
IC Surf.Elev.
147.77
147.77
146.77
145.77
144.77
143.77
142.77
141.77
140.77
139.77
138.77
137.77
136.77
135.77
134.77
133.77
132.77
131.77
130.77
129.77
128.77
127.77
126.77
125.77
124.77
123.77
122.77
Depthin
feet
0
1
2
3
4
5
6
7
8
9
10
11
12
13
14
15
16
17
18
19
20
21
22
23
24
25
26
TOC Elev: : 150.674Well: PZ-21R
BentoniteGrout
BentoniteSeal
SandFiler Pack
PVCCasing
ExpandablePlug
Riser
Screen
Well ConstructionInformation
WELL RISERMaterial : PVCDiameter : 2"
WELL SCREENMaterial : Schedule PVCDiameter : 2"Slot Size : 0.010"Length : 5' (17-22')
WELL CONSTRUCTIONBentonite Grout : 0-9'Bentonite Seal : 9-13'Sand Filter Pack : 13-22'

08-1
5-20
19 F
:\Log
s\Fa
yette
ville
\PZ-
31.b
or
PARSONS INFRASTRUCTURE4704 Hedgemore Drive
Charlotte, North Carolina 28209
Fayetteville Phase I Pilot Study DrillingThe Chemours Company FC, LLC
Project Number: 449338
Date Started : 4/23/2019Date Completed : 4/23/2019Drilling Method : Hollow Stem AugerSampling Method : MacrocoreDrilling Firm : CascadeLead Driller : Danny FerrellLead Driller License # : NCWC3221-BGeologist : Marc HarderBoring Log By : Brandon Weidner
LOG OF BORING: PZ-31(Page 1 of 1)
NAD83 1983 : NC SP CoordinatesNorthing : 396429.034Easting : 2049594.106Completed Depth: : 19'Boring Depth : 20'Elevation/TOC : 144.906/147.999
Depthin
feet
0
1
2
3
4
5
6
7
8
9
10
11
12
13
14
15
16
17
18
19
20
21
DESCRIPTION
0-5' SILTY SAND: Brown, fine grained, damp.
5-9' SANDY CLAY:Light brown and light gray, fine grained, damp.
9-10' SAND:Light gray, fine grained, trace of micas, moist.
10-12.5': No recovery.
12.5-14.5':Brown and light gray, fine grained, layers of loose dry sand (fine to medium grained), moist.
14.5-15':Light brown yellowish orange, medium grained, clay lens, wet at 15'.15-16':Yellowish orange, medium grained, small clay lens, wet.
16-19': Light gray, medium to coarse grained, heavy minerals present, wet.
19-20' CLAY: Light brown to moderate brown, plastic, soft, damp.End of Boring at 20'.
USC
S
SM
CL
SP
NR
SP
SP
SP
SP
CL
GR
APH
IC Surf.Elev.
144.906
144.91
143.91
142.91
141.91
140.91
139.91
138.91
137.91
136.91
135.91
134.91
133.91
132.91
131.91
130.91
129.91
128.91
127.91
126.91
125.91
124.91
Depthin
feet
0
1
2
3
4
5
6
7
8
9
10
11
12
13
14
15
16
17
18
19
20
21
TOC Elev: : 147.999Well: PZ-31
BentoniteGrout
BentoniteSeal
SandFiler Pack
PVCCasing
ExpandablePlug
Riser
Screen
Well ConstructionInformation
WELL RISERMaterial : PVCDiameter : 2"
WELL SCREENMaterial : Schedule 40 PVCDiameter : 2"Slot Size : 0.010"Length : 5' (14-19')
WELL CONSTRUCTIONBentonite Grout : 0-8.5'Bentonite Seal : 8.5-12'Sand Filter Pack : 12-19'

08-1
5-20
19 F
:\Log
s\Fa
yette
ville
\PZ-
32.b
or
PARSONS INFRASTRUCTURE4704 Hedgemore Drive
Charlotte, North Carolina 28209
Fayetteville Phase I Pilot Study DrillingThe Chemours Company FC, LLC
Project Number: 449338
LOG OF BORING: PZ-32(Page 1 of 1)
Depthin
feet
0
1
2
3
4
5
6
7
8
9
10
11
12
13
14
15
16
17
18
19
20
21
DESCRIPTION
0-5' SILTY SAND: Light brown, fine grained, damp.
5-8' SANDY CLAY:Light brown yellowish orange, fine grained, damp.
8-12' SAND:Yellowish gray, fine grained, heavy minerals present, loose, damp.
12-14':Light brown yellowish orange, medium to coarse grained, clay lens, wet at 12'.
14-18':Light gray, medium to coarse grained, wet.
18-20' CLAY:Light brown to moderate brown, plastic, soft, damp.
End of Boring at 20'.
USC
S
SM
CL
SP
SP
SP
CL
GR
APH
IC Surf.Elev.
145.358
145.36
144.36
143.36
142.36
141.36
140.36
139.36
138.36
137.36
136.36
135.36
134.36
133.36
132.36
131.36
130.36
129.36
128.36
127.36
126.36
125.36
Depthin
feet
0
1
2
3
4
5
6
7
8
9
10
11
12
13
14
15
16
17
18
19
20
21
TOC Elev: : 148.471Well: PZ-32
BentoniteGrout
BentoniteSeal
SandFiler Pack
PVCCasing
ExpandablePlug
Riser
Screen
Well ConstructionInformation
Date Started : 4/23/2019Date Completed : 4/23/2019Drilling Method : Hollow Stem AugerSampling Method : MacrocoreDrilling Firm : CascadeLead Driller : Danny FerrellLead Driller License # : NCWC3221-BGeologist : Marc HarderBoring Log By : Marc Harder
NAD83 1983 : NC SP CoordinatesNorthing : 396418.822Easting : 2049713.667Completed Depth: : 18'Boring Depth : 20'Elevation/TOC : 145.358/148.471
WELL RISERMaterial : PVCDiameter : 2"
WELL SCREENMaterial : Schedule 40 PVCDiameter : 2"Slot Size : 0.010"Length : 5' (13-18')
WELL CONSTRUCTIONBentonite Grout : 0-10'Bentonite Seal : 10-12.5'Sand Filter Pack : 12.5-18'

08-1
5-20
19 F
:\Log
s\Fa
yette
ville
\PZ-
33.b
or
PARSONS INFRASTRUCTURE4704 Hedgemore Drive
Charlotte, North Carolina 28209
Fayetteville Phase I Pilot Study DrillingThe Chemours Company FC, LLC
Project Number: 449338
LOG OF BORING: PZ-33(Page 1 of 1)
Depthin
feet
0
1
2
3
4
5
6
7
8
9
10
11
12
13
14
15
16
17
18
19
20
21
DESCRIPTION
0-5' SANDY CLAY: Light brown, damp.
5-7.5':Light gray and yellowish orange, very stiff, trace of organics.
7.5-10' SAND:Light gray and yellowish orange, fine to medium grained, well sorted, damp.
10-11' CLAY:Light gray, soft.
11-13' SAND:Yellowish orange, fine grained, well sorted, wet.
13-15':Light gray, medium grained, saturated.
15-17.5':Light gray, medium to coarse grained, poorly sorted, subangular, very wet.
Top of clay at 17.5'.
17.5-20' CLAY:Dark gray and yellowish orange, plastic, soft, damp.
End of Boring at 20'.
USC
S
CL
CL
SP
CL
SP
SP
SP
CL
GR
APH
IC Surf.Elev.
143.94
143.94
142.94
141.94
140.94
139.94
138.94
137.94
136.94
135.94
134.94
133.94
132.94
131.94
130.94
129.94
128.94
127.94
126.94
125.94
124.94
123.94
Depthin
feet
0
1
2
3
4
5
6
7
8
9
10
11
12
13
14
15
16
17
18
19
20
21
Well ConstructionInformation
Date Started : 4/15/2019Date Completed : 4/15/2019Drilling Method : Hollow Stem AugerSampling Method : MacrocoreDrilling Firm : CascadeLead Driller : Danny FerrellLead Driller License # : NCWC3221-BGeologist : Marc HarderBoring Log By : Marc Harder
NAD83 1983 : NC SP CoordinatesNorthing : 396308.969Easting : 2049707.988Completed Depth: : 17.5'Boring Depth : 20'Elevation/TOC : 143.94/146.715
WELL RISERMaterial : PVCDiameter : 2"
WELL SCREENMaterial : Schedule 40 PVCDiameter : 2"Slot Size : 0.010"Length : 5' (12.5-17.5')
WELL CONSTRUCTIONBentonite Grout : 0-8'Bentonite Seal : 8-10'Sand Filter Pack : 10-17.5'
TOC Elev: : 146.715Well: PZ-33
BentoniteGrout
BentoniteSeal
SandFiler Pack
PVCCasing
ExpandablePlug
Riser
Screen

08-1
5-20
19 F
:\Log
s\Fa
yette
ville
\PZ-
34.b
or
PARSONS INFRASTRUCTURE4704 Hedgemore Drive
Charlotte, North Carolina 28209
Fayetteville Phase I Pilot Study DrillingThe Chemours Company FC, LLC
Project Number: 449338
LOG OF BORING: PZ-34(Page 1 of 1)
Depthin
feet
0
1
2
3
4
5
6
7
8
9
10
11
12
13
14
15
16
17
18
19
20
21
DESCRIPTION
0-5' SAND: Light brown, fine grained, damp.
5-9':Yellowish orange, fine grained, well sorted, dry.
9-10' SANDY CLAY:Light gray, stiff, damp.
10-13' SAND:Very light gray, fine grained, damp.
13-15':Very light gray and light brown, medium to coarse grained, wet.
15-16.5':Light gray, fine grained, wet.
16.5-18.5':Light gray, medium to coarse grained, poorly sorted, trace of pebbles, wet.
Top of clay at 18.5'.18.5-20' CLAY:Dark gray, plastic, soft, damp.
End of Boring at 20'.
USC
S
SP
SP
SC
SP
SP
SP
SP
CL
GR
APH
IC Surf.Elev.
144.942
144.94
143.94
142.94
141.94
140.94
139.94
138.94
137.94
136.94
135.94
134.94
133.94
132.94
131.94
130.94
129.94
128.94
127.94
126.94
125.94
124.94
Depthin
feet
0
1
2
3
4
5
6
7
8
9
10
11
12
13
14
15
16
17
18
19
20
21
Well ConstructionInformation
TOC Elev: : 147.695Well: PZ-34
BentoniteGrout
BentoniteSeal
SandFiler Pack
PVCCasing
ExpandablePlug
Riser
Screen
WELL RISERMaterial : PVCDiameter : 2"
WELL SCREENMaterial : Schedule 40 PVCDiameter : 2"Slot Size : 0.010"Length : 5' (13.5-18.5')
WELL CONSTRUCTIONBentonite Grout : 0-9'Bentonite Seal : 9-11'Sand Filter Pack : 11-18.5'
Date Started : 4/15/2019Date Completed : 4/15/2019Drilling Method : Hollow Stem AugerSampling Method : MacrocoreDrilling Firm : CascadeLead Driller : Danny FerrellLead Driller License # : NCWC3221-BGeologist : Marc HarderBoring Log By : Marc Harder
NAD83 1983 : NC SP CoordinatesNorthing : 396291.786Easting : 2049595.138Completed Depth: : 18.5'Boring Depth : 20'Elevation/TOC : 144.942/147.695
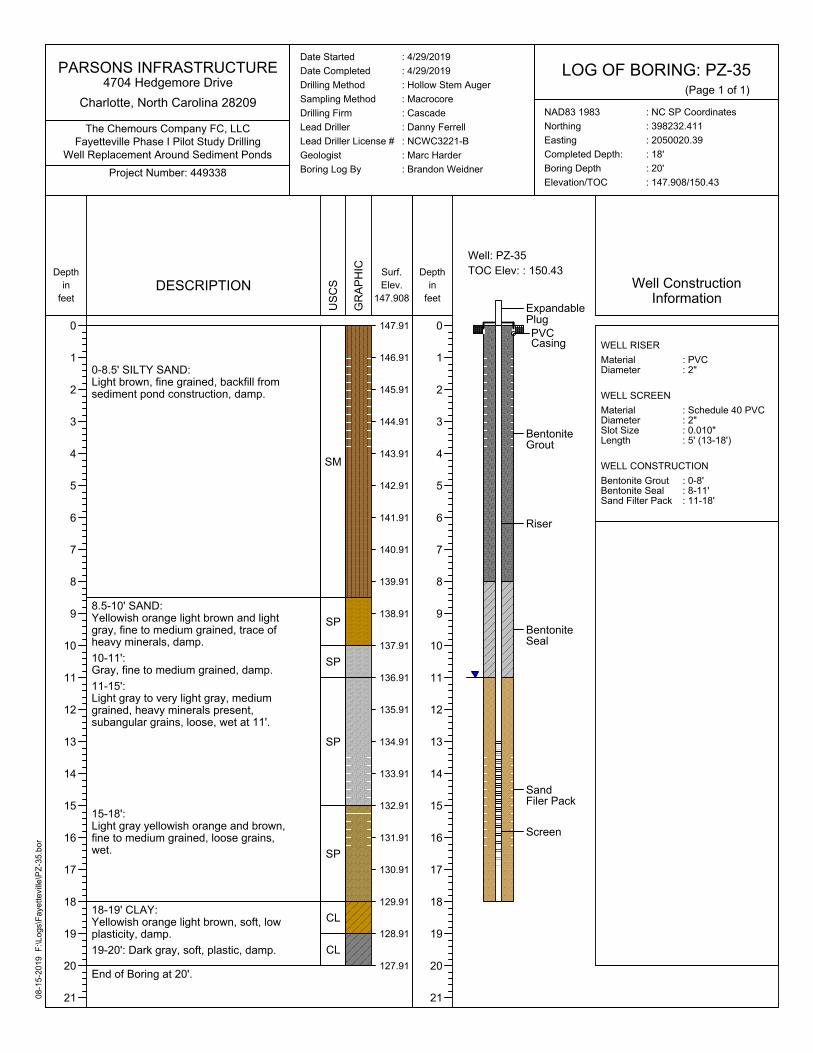
08-1
5-20
19 F
:\Log
s\Fa
yette
ville
\PZ-
35.b
or
PARSONS INFRASTRUCTURE4704 Hedgemore Drive
Charlotte, North Carolina 28209
Well Replacement Around Sediment PondsFayetteville Phase I Pilot Study Drilling
The Chemours Company FC, LLC
Project Number: 449338
Date Started : 4/29/2019Date Completed : 4/29/2019Drilling Method : Hollow Stem AugerSampling Method : MacrocoreDrilling Firm : CascadeLead Driller : Danny FerrellLead Driller License # : NCWC3221-BGeologist : Marc HarderBoring Log By : Brandon Weidner
LOG OF BORING: PZ-35(Page 1 of 1)
NAD83 1983 : NC SP CoordinatesNorthing : 398232.411Easting : 2050020.39Completed Depth: : 18'Boring Depth : 20'Elevation/TOC : 147.908/150.43
Depthin
feet
0
1
2
3
4
5
6
7
8
9
10
11
12
13
14
15
16
17
18
19
20
21
DESCRIPTION
0-8.5' SILTY SAND: Light brown, fine grained, backfill from sediment pond construction, damp.
8.5-10' SAND:Yellowish orange light brown and light gray, fine to medium grained, trace of heavy minerals, damp.10-11':Gray, fine to medium grained, damp.11-15':Light gray to very light gray, medium grained, heavy minerals present, subangular grains, loose, wet at 11'.
15-18':Light gray yellowish orange and brown, fine to medium grained, loose grains, wet.
18-19' CLAY:Yellowish orange light brown, soft, low plasticity, damp.19-20': Dark gray, soft, plastic, damp.
End of Boring at 20'.
USC
S
SM
SP
SP
SP
SP
CL
CL
GR
APH
IC Surf.Elev.
147.908
147.91
146.91
145.91
144.91
143.91
142.91
141.91
140.91
139.91
138.91
137.91
136.91
135.91
134.91
133.91
132.91
131.91
130.91
129.91
128.91
127.91
Depthin
feet
0
1
2
3
4
5
6
7
8
9
10
11
12
13
14
15
16
17
18
19
20
21
TOC Elev: : 150.43Well: PZ-35
BentoniteGrout
BentoniteSeal
SandFiler Pack
PVCCasing
ExpandablePlug
Riser
Screen
Well ConstructionInformation
WELL RISERMaterial : PVCDiameter : 2"
WELL SCREENMaterial : Schedule 40 PVCDiameter : 2"Slot Size : 0.010"Length : 5' (13-18')
WELL CONSTRUCTIONBentonite Grout : 0-8'Bentonite Seal : 8-11'Sand Filter Pack : 11-18'

08-1
5-20
19 F
:\Log
s\Fa
yette
ville
\SB-
200.
bor
PARSONS INFRASTRUCTURE4704 Hedgemore Drive
Charlotte, North Carolina 28209
Fayetteville Phase I Pilot Study DrillingThe Chemours Company FC, LLC
Project Number: 449338
Date Started : 4/10/2019Date Completed : 4/10/2019Drilling Method : Hollow Stem AugerSampling Method : MacrocoreDrilling Firm : CascadeLead Driller : Danny FerrellLead Driller License # : NCWC3221-BGeologist : Marc HarderBoring Log By : Marc Harder
LOG OF BORING: SB-200(Page 1 of 4)
NAD83 1983 : NC SP CoordinatesNorthing : 396326.359Easting : 2049216.611Completed Depth: : 99'Boring Depth : 99'Elevation/TOC :
Depthin
feet
0
1
2
3
4
5
6
7
8
9
10
11
12
13
14
15
16
17
18
19
20
21
22
23
24
25
26
DESCRIPTION
0-5 SAND: Yellowish orange, fine to medium grained, loose, damp.
5-13':Very light gray to light gray, fine to medium grained, moist at 9'.
13-15' SILTY SAND:Light brown, fine to medium grained, well sorted, moist.
15-19' SAND:Very light gray, fine to medium grained, loose, trace of mica and organics, damp to moist.
19-20':Yellowish orange.
20-25':Yellowish orange to light brown with very light gray in places, fine to medium grained, trace amounts of mica and organics, very moist at 24'.
25-30' SILTY SAND:
USC
SSP
SP
SM
SP
SP
SP
SM
GR
APH
IC Depthin
feet
0
1
2
3
4
5
6
7
8
9
10
11
12
13
14
15
16
17
18
19
20
21
22
23
24
25
26
Boring: SB-200
BentoniteGrout
REMARKS

08-1
5-20
19 F
:\Log
s\Fa
yette
ville
\SB-
200.
bor
PARSONS INFRASTRUCTURE4704 Hedgemore Drive
Charlotte, North Carolina 28209
Fayetteville Phase I Pilot Study DrillingThe Chemours Company FC, LLC
Project Number: 449338
Date Started : 4/10/2019Date Completed : 4/10/2019Drilling Method : Hollow Stem AugerSampling Method : MacrocoreDrilling Firm : CascadeLead Driller : Danny FerrellLead Driller License # : NCWC3221-BGeologist : Marc HarderBoring Log By : Marc Harder
LOG OF BORING: SB-200(Page 2 of 4)
NAD83 1983 : NC SP CoordinatesNorthing : 396326.359Easting : 2049216.611Completed Depth: : 99'Boring Depth : 99'Elevation/TOC :
Depthin
feet
26
27
28
29
30
31
32
33
34
35
36
37
38
39
40
41
42
43
44
45
46
47
48
49
50
51
52
DESCRIPTION
25-30' SILTY SAND continued:Yellowish orange to light brown, fine to medium grained, trace amount of mica with black organic lenses, saturated.
30-35' SAND:Moderate red, dusty red, light brown and very light gray, medium to coarse grained, clay lense at 34', wet.
35-40':Very light gray, medium grained, well sorted, subangular grains, trace amount of mica, very wet.
40-50':Grayish orange, trace of organic material from 44-45', very wet.
50-62':Moderate red, yellowish orange and light gray, medium to coarse grained, trace amount of organics at 55', wet.Silty sand at 60-61'.
USC
S
SM
SP
SP
SP
SP
GR
APH
IC Depthin
feet
26
27
28
29
30
31
32
33
34
35
36
37
38
39
40
41
42
43
44
45
46
47
48
49
50
51
52
Boring: SB-200
BentoniteGrout
REMARKS

08-1
5-20
19 F
:\Log
s\Fa
yette
ville
\SB-
200.
bor
PARSONS INFRASTRUCTURE4704 Hedgemore Drive
Charlotte, North Carolina 28209
Fayetteville Phase I Pilot Study DrillingThe Chemours Company FC, LLC
Project Number: 449338
Date Started : 4/10/2019Date Completed : 4/10/2019Drilling Method : Hollow Stem AugerSampling Method : MacrocoreDrilling Firm : CascadeLead Driller : Danny FerrellLead Driller License # : NCWC3221-BGeologist : Marc HarderBoring Log By : Marc Harder
LOG OF BORING: SB-200(Page 3 of 4)
NAD83 1983 : NC SP CoordinatesNorthing : 396326.359Easting : 2049216.611Completed Depth: : 99'Boring Depth : 99'Elevation/TOC :
Depthin
feet
52
53
54
55
56
57
58
59
60
61
62
63
64
65
66
67
68
69
70
71
72
73
74
75
76
77
78
DESCRIPTION
Silty sand at 60'.
62-70':Light gray, medium to coarse grained, loose, trace amount of heavy minerals, subrounded grains, very saturated.
70-75': No recovery. Core stuck in casing.
75-77' SILTY SAND:Dark gray, fine grained, well sorted, micaceous, wet.
77-80': No Recovery.
USC
SSP
SP
SP
NR
SM
NR
GR
APH
IC Depthin
feet
52
53
54
55
56
57
58
59
60
61
62
63
64
65
66
67
68
69
70
71
72
73
74
75
76
77
78
Boring: SB-200
BentoniteGrout
REMARKS
Drill with Sonic rig down to 70' where coring began.

08-1
5-20
19 F
:\Log
s\Fa
yette
ville
\SB-
200.
bor
PARSONS INFRASTRUCTURE4704 Hedgemore Drive
Charlotte, North Carolina 28209
Fayetteville Phase I Pilot Study DrillingThe Chemours Company FC, LLC
Project Number: 449338
Date Started : 4/10/2019Date Completed : 4/10/2019Drilling Method : Hollow Stem AugerSampling Method : MacrocoreDrilling Firm : CascadeLead Driller : Danny FerrellLead Driller License # : NCWC3221-BGeologist : Marc HarderBoring Log By : Marc Harder
LOG OF BORING: SB-200(Page 4 of 4)
NAD83 1983 : NC SP CoordinatesNorthing : 396326.359Easting : 2049216.611Completed Depth: : 99'Boring Depth : 99'Elevation/TOC :
Depthin
feet
78
79
80
81
82
83
84
85
86
87
88
89
90
91
92
93
94
95
96
97
98
99
100
101
102
103
104
DESCRIPTION
80-84' SILTY SAND:Dark gray to black, fine to medium grained, micaceous, organic rich, wet.
84-89' SAND:Light to medium gray, medium to coarse grained, trace amounts of mica and organic material (wood fragments), clay lense at 88', saturated.
89-99' CLAY:Dark gray, hard.
End of Boring at 99'.
USC
S
NR
SM
SP
CL
GR
APH
IC Depthin
feet
78
79
80
81
82
83
84
85
86
87
88
89
90
91
92
93
94
95
96
97
98
99
100
101
102
103
104
Boring: SB-200
BentoniteGrout
REMARKS
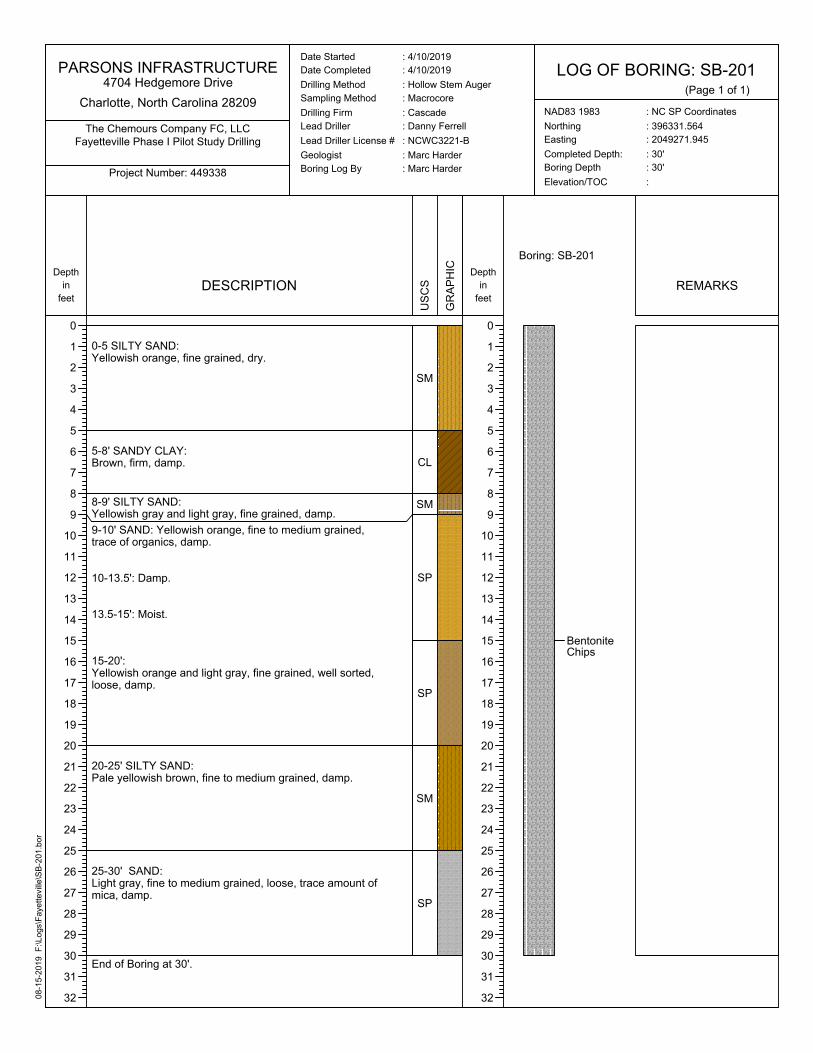
08-1
5-20
19 F
:\Log
s\Fa
yette
ville
\SB-
201.
bor
PARSONS INFRASTRUCTURE4704 Hedgemore Drive
Charlotte, North Carolina 28209
Fayetteville Phase I Pilot Study DrillingThe Chemours Company FC, LLC
Project Number: 449338
LOG OF BORING: SB-201(Page 1 of 1)
Depthin
feet
0
1
2
3
4
5
6
7
8
9
10
11
12
13
14
15
16
17
18
19
20
21
22
23
24
25
26
27
28
29
30
31
32
DESCRIPTION
0-5 SILTY SAND: Yellowish orange, fine grained, dry.
5-8' SANDY CLAY:Brown, firm, damp.
8-9' SILTY SAND:Yellowish gray and light gray, fine grained, damp.9-10' SAND: Yellowish orange, fine to medium grained, trace of organics, damp.
10-13.5': Damp.
13.5-15': Moist.
15-20':Yellowish orange and light gray, fine grained, well sorted, loose, damp.
20-25' SILTY SAND:Pale yellowish brown, fine to medium grained, damp.
25-30' SAND:Light gray, fine to medium grained, loose, trace amount of mica, damp.
End of Boring at 30'.
USC
S
SM
CL
SM
SP
SP
SM
SP
GR
APH
IC Depthin
feet
0
1
2
3
4
5
6
7
8
9
10
11
12
13
14
15
16
17
18
19
20
21
22
23
24
25
26
27
28
29
30
31
32
Boring: SB-201
BentoniteChips
REMARKS
Date Started : 4/10/2019Date Completed : 4/10/2019Drilling Method : Hollow Stem AugerSampling Method : MacrocoreDrilling Firm : CascadeLead Driller : Danny FerrellLead Driller License # : NCWC3221-BGeologist : Marc HarderBoring Log By : Marc Harder
NAD83 1983 : NC SP CoordinatesNorthing : 396331.564Easting : 2049271.945Completed Depth: : 30'Boring Depth : 30'Elevation/TOC :

08-1
5-20
19 F
:\Log
s\Fa
yette
ville
\SB-
202.
bor
PARSONS INFRASTRUCTURE4704 Hedgemore Drive
Charlotte, North Carolina 28209
Fayetteville Phase I Pilot Study DrillingThe Chemours Company FC, LLC
Project Number: 449338
LOG OF BORING: SB-202(Page 1 of 1)
Depthin
feet
0
1
2
3
4
5
6
7
8
9
10
11
12
13
14
15
16
17
18
19
20
21
22
23
24
25
26
27
28
29
30
31
32
DESCRIPTION
0-5 SILTY SAND: Light brown, fine grained, damp.
5-8' SANDY CLAY:Brown, firm, trace amount of organics, damp.
8-10' SAND:Grayish yellow, fine grained, well sorted, dry.
10-13': Moist.
13-15'' SAND:Grayish yellow to light brown, medium to coarse grained, wet at 14'.
15-20':Light gray with tints of light red, medium grained, well sorted, very saturated.
20-22': No Recovery.
22-24' CLAY:Dark gray, soft, plastic, trace amount of organics, damp.
24-25' SILTY SAND: Yellowish orange, light brown and moderate red, micaceous, moist.End of Boring at 25'.
USC
S
SM
CL
SP
SP
SP
NR
CL
SM
GR
APH
IC Depthin
feet
0
1
2
3
4
5
6
7
8
9
10
11
12
13
14
15
16
17
18
19
20
21
22
23
24
25
26
27
28
29
30
31
32
Boring: SB-202
BentoniteChips
REMARKS
Date Started : 4/11/2019Date Completed : 4/11/2019Drilling Method : Hollow Stem AugerSampling Method : MacrocoreDrilling Firm : CascadeLead Driller : Danny FerrellLead Driller License # : NCWC3221-BGeologist : Marc HarderBoring Log By : Marc Harder
NAD83 1983 : NC SP CoordinatesNorthing : 396378.554Easting : 2049613.257Completed Depth: : 25'Boring Depth : 25'Elevation/TOC :

08-1
5-20
19 F
:\Log
s\Fa
yette
ville
\SB-
203.
bor
PARSONS INFRASTRUCTURE4704 Hedgemore Drive
Charlotte, North Carolina 28209
Fayetteville Phase I Pilot Study DrillingThe Chemours Company FC, LLC
Project Number: 449338
LOG OF BORING: SB-203(Page 1 of 1)
Depthin
feet
0
1
2
3
4
5
6
7
8
9
10
11
12
13
14
15
16
17
18
19
20
21
22
23
24
25
26
27
28
29
30
31
32
DESCRIPTION
0-5 SILTY SAND: Brown, fine grained, damp.
5-8' SANDY CLAY:Brown, firm, damp.
8-12' SAND:Yellowish orange, fine to medium grained with trace amounts of coarse grains, loose, dry.
12-12.5' CLAY: Medium gray, soft, damp.12.5-15' SAND:Light gray and yellowish orange, fine to medium grained, well sorted, moist at 13'.
15-19.5':Greenish gray, medium to coarse grained, loose, very saturated.
19.5-20' CLAY: Dark gray, soft, plastic, damp.End of Boring at 20'.
USC
S
SM
CL
SP
CL
SP
SP
CL
GR
APH
IC Depthin
feet
0
1
2
3
4
5
6
7
8
9
10
11
12
13
14
15
16
17
18
19
20
21
22
23
24
25
26
27
28
29
30
31
32
REMARKS
Boring: SB-203
BentoniteChips
Date Started : 4/11/2019Date Completed : 4/11/2019Drilling Method : Hollow Stem AugerSampling Method : MacrocoreDrilling Firm : CascadeLead Driller : Danny FerrellLead Driller License # : NCWC3221-BGeologist : Marc HarderBoring Log By : Marc Harder
NAD83 1983 : NC SP CoordinatesNorthing : 396335.786Easting : 2049660.083Completed Depth: : 20'Boring Depth : 20'Elevation/TOC :


APPENDIX B REGENESIS BENCH SCALE TESTING REPORT


Page 1 of 10
To: Michael Robinson, PARSONS
From: Kristen Thoreson & Chad Northington, REGENESIS
Date: September 6, 2019
Re: Treatability Study: Adsorption measurements using PlumeStop® Liquid Activated Carbon™
INTRODUCTION
REGENESIS has performed laboratory testing to demonstrate the efficacy of PlumeStop® as an in situ technology for the treatment of GenX (HFPO Dimer Acid) and PFMOAA as well as other fluorinated compounds and VOCs present in the perched groundwater zone at the subject site. Specifically, the intent of the testing was to determine if the characteristics of the site matrix were amenable to sorption of the contaminants by PlumeStop at doses that would be encountered in the field. While PlumeStop has been demonstrated to effectively bind different species in a range of conditions, it is possible that the groundwater at the subject site contains other organic molecules that could impact contaminant binding to PlumeStop by creating competition for sorption sites.
PlumeStop® Liquid Activated Carbon is a colloidal activated carbon in situ technology that can distribute widely in groundwater and quickly adsorb contaminants. The goal of this laboratory test was to demonstrate the ability of PlumeStop® to achieve rapid and sustained sorption of contaminants from site groundwater.
EXPERIMENTAL SECTION
Soil Samples
The soil used in this study was sampled from the perched zone at the subject site and shipped by Chemours Fayetteville Works to Regenesis on 4/16/19. The samples were received in good condition by Regenesis Lab on 4/23/19. Approximately 40 lb of site soil was received on ice in one container within a bucket labeled with the following sample name: SB-202 13-19’ Chemours Fay Works 4/15/19. The soil samples were stored in its original sampling container at 5°C prior to use in the study.
Groundwater Samples
The groundwater used in this study was sampled from the site and shipped by Chemours Fayetteville Works to Regenesis. Samples were received by Regenesis Lab on 5/1/19. Approximately 50 L of site groundwater was provided on ice in 13 1-gallon containers. The containers were labeled Chemours Fay Works, NC Phase 1 Study MW-32 4/24/19. The groundwater sample was stored in its original sampling container at 5°C prior to use in the study.

Page 2 of 10
Analytical Methodology
Throughout the treatability study, groundwater samples were sent to EuroFins TestAmerica (Sacramento, CA) for all PFAS-related analysis. Analysis methods included EPA 537 MOD MAX and Table 3+. The full summary of all analytical data can be found under ‘Appendix A.’
A baseline groundwater sample was also analyzed for volatile organic compounds (VOC) and total organic compounds (TOC) to gauge the demand for sorption sites on the activated carbon by other species. Analyses were performed by Advanced Technology Labs (Garden Grove, CA) via EPA 8260 and SM 5310B.
Baseline VOC and TOC
To understand any additional demands on the adsorption capacity of PlumeStop in the soil and groundwater, baseline total VOC and TOC measurements were performed on a sample prepared by mixing site groundwater and soil in a 10:1 by-weight ratio. This ratio is required to provide enough water for analysis while still providing an understanding of any matrix impacts on performance. The sample was allowed to stir for 24 hours, and then the groundwater was sampled and sent for analysis.
Treatability Study Procedure – Phase I
To prepare the samples for this study, groundwater and site soil were chilled to 5°C and then added into the reaction vessels (4L HDPE bottles) at a 10:1 groundwater-to-site soil ratio. To understand the dose-response of a PlumeStop treatment, six different PlumeStop loadings were tested in the study: 1,000 mg/L, 5,000 mg/L, 10,000 mg/L, 15,000 mg/L, 20,000 mg/L, and 25,000 mg/L. These wide-ranging loadings were chosen to encompass the field-scale design dosing (6,000 to 17,000 mg/L), because the baseline concentrations were not known precisely prior to starting the study (no baseline samples were analyzed in order to expedite the study), and because some species were expected to have a low sorption affinity, necessitating higher doses to ensure a response was observed. Additionally, multiple doses were examined to provide the possibility of performing an isotherm analysis on the individual species to further understand the dose-response for individual species within the site-specific matrix. Of the six loadings, duplicate samples were performed on the 5,000 mg/L, 10,000 mg/L, and 20,000 mg/L PlumeStop doses for analytical quality assurance. In order to keep the total volume identical in all samples, PFAS-free, deionized water was added to make up the volume difference from the PlumeStop addition in all samples.
Calcium chloride was added to the samples to destabilize the PlumeStop so that water free of PlumeStop could be sampled and sent for analysis. Without this procedure, PlumeStop would remain suspended in solution during the sampling event, and any PFAS compounds adsorbed on the PlumeStop would be chemically extracted from the PlumeStop during the analytical sample preparation, leading to biased high results. Note that in a field-scale application, PlumeStop will permanently deposit onto soil over time. Calcium chloride was also added to the control samples for consistency.
A blank sample was also prepared and handled in the same manner as the control and treated samples to ensure no PFAS compounds were introduced during the study. The blank sample was prepared in a 4L HDPE bottle and contained only PFAS-free deionized water. A summary of the sample compositions can be found in Table 1.

Page 3 of 10
The reaction vessels were sealed, the contents manually mixed, and the samples stored at room temperature for seven days, which provided enough time for the contaminants to adsorb and the PlumeStop to settle. After seven days, three 250-mL aliquots of the PlumeStop-free groundwater were removed from the reaction vessels and sent to Eurofins TestAmerica for PFAS analysis.
Table 1. Summary of Sample Compositions
Lab Sample ID Sample Treatment ID
PlumeStop Conc (mg/L)
Mass of GW (g)
Mass of soil (g) CaCl2·2H2O (g)
1 FAY-PS2019-posttreat1-05072019 1,000 mg/L PS 1,000 3,750 375 35
2 FAY-PS2019-posttreat2-05072019 5,000-1 mg/L PS 5,000 3,750 375 35
3 FAY-PS2019-posttreat3-05072019 5,000-2 mg/L PS 5,000 3,750 375 35
4 FAY-PS2019-posttreat4-05072019 10,000-1 mg/L PS 10,000 3,750 375 35
5 FAY-PS2019-posttreat5-05072019 10,000-2 mg/L PS 10,000 3,750 375 35
6 FAY-PS2019-posttreat6-05072019 15,000 mg/L PS 15,000 3,750 375 35
7 FAY-PS2019-posttreat7-05072019 20,000-1 mg/L PS 20,000 3,750 375 35
8 FAY-PS2019-posttreat8-05072019 20,000-2 mg/L PS 20,000 3,750 375 35
9 FAY-PS2019-posttreat9-05072019 25,000 mg/L PS 25,000 3,750 375 35
10 FAY-PS2019-pretreat1-05072019 Control-1 0 3,750 375 35
11 FAY-PS2019-pretreat2-05072019 Control-2 0 3,750 375 35
12 FAY-PS2019-blank-05072019 Blank 0 0 0 0
13 FAY-PS2019-posttreat10-05142019
Second dose 10,000 mg/L PS 10,000 2515 0 15
Test Design is Meant as a Proof of Concept
The specific test was set up to discern the ability of varying doses of PlumeStop to bind the entire range of PFAS species simultaneously in the actual site water. While this approach is cost effective (as it is run in a simple batch test), it provides only an estimate of the hypothetical performance of site groundwater upon contact with the very first portion of a PlumeStop-treated aquifer zone. In actual field conditions, as the site water continues to advect through a PlumeStop-treated zone, the more hydrophobic PFAS species are preferentially sorbed and removed from solution, thereby reducing the competition for binding sites and increasing the sorption efficacy of more soluble PFAS species. Thus, the test performed is potentially

Page 4 of 10
conservative and could underestimate the expected field performance of a PlumeStop-treated aquifer zone. Additionally, this test design does not provide insight as to performance over time. In the field, PlumeStop is often used in a barrier configuration where additional contaminant will flux into the zone. This test only examined the initial response expected.
Treatability Study Procedure – Phase II
In addition to the initial study, a second-phase treatment was conducted on a single sample. The purpose of this sample was to lend better insight into the expected performance of a PlumeStop-treated aquifer zone in the field since the batch test is known to have deficiencies, as described in the paragraph above. To accomplish this, two successive 10,000 mg/L treatment doses of PlumeStop were applied to one sample. PlumeStop-free water (approximately 2L) was removed from one of the 10,000 mg/L samples from the first treatment above, transferred to a new container, and treated with a fresh 10,000 mg/L dose of PlumeStop. A summary of the sample compositions is provided under Table 1. The reaction vessel was sealed, the contents manually mixed, and the sample left at room temperature for seven days. After seven days, three 250-mL groundwater samples were then sent to EuroFins TestAmerica for PFAS-related analysis.
RESULTS AND DISCUSSION
Baseline VOC and TOC Analysis
The results from the VOC and TOC baseline groundwater analysis of a sample prepared in a 10:1 groundwater-to-soil ratio are shown in Table 2. The TOC analysis was non-detect (practical quantification limit, PQL = 3 mg/L), and the total VOCs determined by EPA 8260 were 0.57 µg/L. These results indicate that no significant sources of demand on PlumeStop activated carbon from other species were present in the soil and groundwater.
Table 2. Baseline analysis of site groundwater for Total Organic Carbon and Volatile Organic Compounds TOC (SM 5310B), mg/L Total VOCs (EPA 8260), µg/L Baseline Groundwater < 3 0.57
Control and Blank Samples
A summary of all the results from the treatability study can be found in Table A in Appendix A. The results of the blank and control samples were as expected. No PFAS compounds were detected above the reporting limits in the blank sample, indicating that the handling procedures performed during the study returned no source of contamination. The results of the replicate control samples agreed, as no extreme variances were observed in the measured concentration of any PFAS compounds. The average total PFAS concentration in the controls was 60.4 µg/L, with PFO2HxA, PFMOAA, HFPO-DA, PFO3OA, and PMPA having the highest concentrations and accounting for over 80% of the contamination. A summary of the compounds detected above the reporting limit in the control samples is shown in Table 3.

Page 5 of 10
Treatability Study: Phase I
The results from the PlumeStop-treated samples are shown in Table 4 along with the average of the control replicates for reference (only the analytes detected in the control are shown for simplicity).
As stated above, this Phase I study, by design, is a low-cost, proof-of-concept method of providing an initial approximation of the ability of different PlumeStop doses to effectively remove the suite of PFAS compounds from solution. Based on the laboratory study, PlumeStop performed very well, rapidly sorbing PFAS contaminants from solution. The lowest treatment dose of PlumeStop (1,000 mg/L) removed 93.5% of the total PFAS from solution, and incremental improvements were observed as the dose was increased. The highest doses of PlumeStop removed over 99% of the total PFAS, with 23 of the 26 detected species removed to non-detect concentrations.
Over 99.8% of HFPO-DA (GenX) was removed with the lowest dose of PlumeStop, and its concentration was reduced to below the reporting limit (4 ng/L) with a dose of 5,000 mg/L PlumeStop. These results suggest that a field application of PlumeStop can effecively remove HFPO-DA from the groundwater. The more soluble PFAS species present (those with the lowest binding affinity for PlumeStop) also showed very good removal, with PFMOAA reduced by 95% from 9.5 µg/L to 0.4 µg/L, perfluorobutanoic acid (PFBA) reduced by 96% (59 ng/L to 3 ng/L), and perfluoroheptanoic acid (PFHpA) reduced by 87% (19 ng/L to 2.4 ng/L). It is not clear why PFHpA was detected just above the reporting limit in the higher PlumeStop doses when it had been non-detect with the mid-range doses.
Note on the Ability to Perform Isotherm Analysis:
As described in the treatability procedure above, a range of PlumeStop doses was tested with the original goal of determining the dose response of PlumeStop for the individual species within the matrix by conducting an isotherm analysis of the individual species. However, based on the observed results, where over 90% of the total PFAS were removed with the lowest dose and all but three species were removed at the second lowest dose, an isotherm analysis could not be conducted as anticipated. This is because an isotherm analysis requires a measurable concentration to remain in solution in order to calculate the results. While the isotherm analysis could not be conducted, the results still provide REGENESIS with a good understanding of the ability of PlumeStop to remove the target compounds.
Treatability Study: Phase II
As discussed above, the second phase of the study was conducted to better mimic the results that may be expected in a field application of PlumeStop where stratification of the PFAS species will naturally occur as the site water advects through a PlumeStop-treated zone. This stratification will result in the preferential sorption of the more hydrophobic PFAS species and their removal from solution first, resulting in less competition for the more soluble PFAS species as they move downgradient to virgin carbon binding sites. This test was accomplished by splitting the 20,000 mg/L PlumeStop dose into two successive 10,000 mg/L treatments. The results of this phase of the study are summarized in Table 5 and compared to the 20,000 mg/L treatment from Phase I.

Page 6 of 10
As can be seen, the total PFAS removal after the two successive 10,000 mg/L treatments was improved over the single 20,000 mg/L PlumeStop treatment, with 99.6% removed and only two species detected in the successive treatments compared to 99.3% and four species detected when the same net dose was applied all at once. Note that this observed improvement with two successive 10,000 mg/L treatments over the single 20,000 mg/L treatment is conservative because the reporting limits were lower for the 10,000 mg/L PS Second Treatment than for the 20,000 mg/L PS Treatment (due to analysis at different times). This means that the total PFAS concentration measured in the 20,000 mg/L PS Treatment would have been higher if the detection limits were lower. For example, this is exemplified by PMPA where it was not detected in the 20,000 mg/L PS Treatment because the reporting limit was over 10x higher than the value measured in 10,000 mg/L PS Second Treatment. These results confirm the notion that better results can be expected for a barrier-type application of PlumeStop than from the Phase I batch study.
SUMMARY
This treatability study examined the ability of various PlumeStop doses (1,000 mg/L to 25,000 mg/L) to remove HFPO-DA (GenX), PFMOAA, and other PFAS compounds from the perched groundwater zone at the subject site via adsorption to colloidal activated carbon particles. The key findings from the proof of concept test are as follows:
• PlumeStop successfully removed HFPO-DA from the groundwater and reduced its concentration to below reporting limits with a dose of only 5,000 mg/L.
• The range of PlumeStop doses tested removed between 93.5% and 99.6% of the total PFAS, indicating that a PlumeStop treatment can significantly remove these compounds from the groundwater matrix, thereby reducing the contaminant flux through the site.
• 24 of the 26 detected PFAS species were removed to non-detect concentrations. Only the compounds that are known to have lower affinity for activated carbon remained in solution.
• As much as 95% of PFMOAA was removed from the groundwater in this study. • Successive treatments by two 10,000 mg/L doses of PlumeStop yielded better results than a single
20,000 mg/L treatment, suggesting that observed field results may be better than the results observed in this study, assuming similar contaminant concentrations.
• The lowest PlumeStop dose tested removed over 90% of the total PFAS compounds, this result suggests an expected design advantage of improved treatment longevity when PlumeStop is used in a barrier formation.
These results confirm the ability of PlumeStop to adsorb the contaminants and demonstrate that no significant interfering species that limits the performance of PlumeStop is present in the soil and groundwater matrix. Therefore PlumeStop® is capable of quickly removing and retaining multiple contaminants from the aqueous phase at the site. This information, in combination with other site-specific parameters, can be used to estimate the performance of PlumeStop in various potential treatment areas of the site. Actual field dosing should be developed for each scenario in combination with estimates of the contaminant concentration, flux, and treatment goals.

Page 7 of 10
Table 3. Summary of the measured concentrations in the replicate control samples. Only the species detected above the reporting limit are shown for simplicity. All concentrations are in µg/L. For the full results, see Appendix A.
Analyte Control-1 Control- 2
Byproduct 1 0.057 0.074
Byproduct 2 0.69 0.89
Byproduct 4 0.55 0.71
Byproduct 5 1.20 1.40
EVE Acid 0.027 0.026
HFPO-DA 5.50 4.90
Hydro-EVE Acid 0.10 0.11
NVHOS 1.10 1.40
PEPA 2.40 2.50
Perfluorobutanesulfonic acid (PFBS) 0.0025 0.0023
Perfluorobutanoic acid (PFBA) 0.0610 0.0570
Perfluorodecanoic acid (PFDA) <0.0020 0.0020
Perfluoroheptanoic acid (PFHpA) 0.020 0.018
Perfluorohexanesulfonic acid (PFHxS) 0.0035 0.0037
Perfluorohexanoic acid (PFHxA) 0.013 0.012
Perfluorononanoic acid (PFNA) 0.0047 0.0047
Perfluorooctanesulfonic acid (PFOS) 0.012 0.011
Perfluorooctanoic acid (PFOA) 0.019 0.017
Perfluoropentanoic acid (PFPeA) 0.077 0.071
PFMOAA 9.50 9.50
PFO2HxA 24.00 27.00
PFO3OA 5.50 6.40
PFO4DA 1.40 1.70
PFO5DA 0.40 0.44
PMPA 4.50 4.70
R-EVE 0.24 0.24
Total PFAS 57.37 62.20
Control Avg 59.79

Page 8 of 10
Table 4. Summary of Phase I Treatability Results. All concentrations are reported in µg/L.
Analyte ↓ Sample → Treatment ID:
Control Avg 1,000 mg/L PS
5,000-1 mg/L PS
5,000-2 mg/L PS
10,000-1 mg/L PS
10,000-2 mg/L PS
15,000 mg/L PS
20,000-1 mg/L PS
20,000-2 mg/L PS
25,000 mg/L PS
Byproduct 1 0.066 <0.027 <0.027 <0.027 <0.027 <0.027 <0.027 <0.027 <0.027 <0.027
Byproduct 2 0.790 <0.030 <0.030 <0.030 <0.030 <0.030 <0.030 <0.030 <0.030 <0.030
Byproduct 4 0.630 <0.16 <0.16 <0.16 <0.16 <0.16 <0.16 <0.16 <0.16 <0.16
Byproduct 5 1.300 <0.058 <0.058 <0.058 <0.058 <0.058 <0.058 <0.058 <0.058 <0.058
EVE Acid 0.027 <0.024 <0.024 <0.024 <0.024 <0.024 <0.024 <0.024 <0.024 <0.024
HFPO-DA 5.200 0.0073 <0.0040 <0.0040 <0.0040 <0.0040 <0.0040 <0.0040 <0.0040 <0.0040
Hydro-EVE Acid 0.104 <0.028 <0.028 <0.028 <0.028 <0.028 <0.028 <0.028 <0.028 <0.028
NVHOS 1.250 <0.054 <0.054 <0.054 <0.054 <0.054 <0.054 <0.054 <0.054 <0.054
PEPA 2.450 <0.047 <0.047 <0.047 <0.047 <0.047 <0.047 <0.047 <0.047 <0.047
Perfluorobutanesulfonic acid (PFBS) 0.002 <0.0020 <0.0020 <0.0020 <0.0020 <0.0020 <0.0020 <0.0020 <0.0020 <0.0020
Perfluorobutanoic acid (PFBA) 0.059 0.0140 0.0057 0.0055 0.0033 0.0045 0.0029 0.0021 0.0025 0.0026
Perfluorodecanoic acid (PFDA) 0.002 <0.0020 <0.0020 <0.0020 <0.0020 <0.0020 <0.0020 <0.0020 <0.0020 <0.0020
Perfluoroheptanoic acid (PFHpA) 0.019 0.0041 <0.0020 <0.0020 <0.0020 <0.0020 <0.0020 <0.0020 0.0033 0.0024
Perfluorohexanesulfonic acid (PFHxS) 0.004 <0.0020 <0.0020 <0.0020 <0.0020 <0.0020 <0.0020 <0.0020 <0.0020 <0.0020
Perfluorohexanoic acid (PFHxA) 0.013 <0.0020 <0.0020 <0.0020 <0.0020 <0.0020 <0.0020 <0.0020 <0.0020 <0.0020
Perfluorononanoic acid (PFNA) 0.005 <0.0020 <0.0020 <0.0020 <0.0020 <0.0020 <0.0020 <0.0020 <0.0020 <0.0020
Perfluorooctanesulfonic acid (PFOS) 0.012 <0.0020 <0.0020 <0.0020 <0.0020 <0.0020 <0.0020 <0.0020 <0.0020 <0.0020
Perfluorooctanoic acid (PFOA) 0.018 <0.0020 <0.0020 <0.0020 <0.0020 <0.0020 <0.0020 <0.0020 <0.0020 <0.0020
Perfluoropentanoic acid (PFPeA) 0.074 <0.0020 <0.0020 <0.0020 <0.0020 <0.0020 <0.0020 <0.0020 <0.0020 <0.0020
PFMOAA 9.500 2.50 0.92 1.80 0.77 0.77 0.59 0.35 0.45 0.44
PFO2HxA 25.50 0.11 <0.081 <0.081 <0.081 <0.081 <0.081 <0.081 <0.081 <0.081
PFO3OA 5.950 <0.058 <0.058 <0.058 <0.058 <0.058 <0.058 <0.058 <0.058 <0.058
PFO4DA 1.550 <0.079 <0.079 <0.079 <0.079 <0.079 <0.079 <0.079 <0.079 <0.079
PFO5DA 0.420 <0.034 <0.034 <0.034 <0.034 <0.034 <0.034 <0.034 <0.034 <0.034
PMPA 4.600 1.30 0.67 0.70 0.61 <0.57 0.57 <0.57 <0.57 <0.57
R-EVE 0.240 <0.070 <0.070 <0.070 <0.070 <0.070 <0.070 <0.070 <0.070 <0.070 Total PFAS 59.79 3.94 1.60 2.51 1.38 0.77 1.16 0.35 0.46 0.45
Avg of Replicates 3.94 2.05 1.08 1.16 0.40 0.45
% Removal vs control 93.5% 96.6% 98.2% 98.1% 99.3% 99.3%

Page 9 of 10
Table 5. Summary of Phase II Treatability Results. All concentrations are reported in µg/L.
Analyte ↓ Sample → Treatment ID:
Control Avg 10,000 mg/L PS – First Treatment
10,000 mg/L PS – Second Treatment1
20,000 mg/L PS, Avg from Phase I1
Byproduct 1 0.066 <0.027 <0.0020 <0.027
Byproduct 2 0.790 <0.030 <0.0020 <0.030
Byproduct 4 0.630 <0.16 <0.0020 <0.16
Byproduct 5 1.300 <0.058 <0.0020 <0.058
EVE Acid 0.027 <0.024 <0.0020 <0.024
HFPO-DA 5.200 <0.0040 <0.0040 <0.0040
Hydro-EVE Acid 0.104 <0.028 <0.0020 <0.028
NVHOS 1.250 <0.054 <0.0020 <0.054
PEPA 2.450 <0.047 <0.020 <0.047
Perfluorobutanesulfonic acid (PFBS) 0.002 <0.0020 <0.0020 <0.0020
Perfluorobutanoic acid (PFBA) 0.059 0.0033 <0.0020 0.0023
Perfluorodecanoic acid (PFDA) 0.002 <0.0020 <0.0020 <0.0020
Perfluoroheptanoic acid (PFHpA) 0.019 <0.0020 <0.0020 0.0027
Perfluorohexanesulfonic acid (PFHxS) 0.004 <0.0020 <0.0020 <0.0020
Perfluorohexanoic acid (PFHxA) 0.013 <0.0020 <0.0020 <0.0020
Perfluorononanoic acid (PFNA) 0.005 <0.0020 <0.0020 <0.0020
Perfluorooctanesulfonic acid (PFOS) 0.012 <0.0020 <0.0020 <0.0020
Perfluorooctanoic acid (PFOA) 0.018 <0.0020 <0.0020 <0.0020
Perfluoropentanoic acid (PFPeA) 0.074 <0.0020 <0.0020 <0.0020
PFMOAA 9.500 0.77 0.22 0.40
PFO2HxA 25.50 <0.081 <0.0020 <0.081
PFO3OA 5.950 <0.058 <0.0020 <0.058
PFO4DA 1.550 <0.079 <0.0020 <0.079
PFO5DA 0.420 <0.034 <0.0020 <0.034
PMPA 4.600 0.61 0.016 <0.57
R-EVE 0.240 <0.070 <0.0020 <0.070
Total PFAS 59.79 1.38 0.24 0.41
% Removal vs control 97.7% 99.6% 99.3% 1Note: Reporting limits were lower for the 10,000 mg/L PS Second Treatment than for the 20,000 mg/L PS Treatment because they were analyzed at different times. Therefore the observed improvement with two successive 10,000 mg/L treatments over the single 20,000 mg/L treatment is conservative as a higher Total PFAS concentration would have been measured in the 20,000 mg/L PS Treatment if the detection limits were lower. This is best exemplified by PMPA where it was not detected in the 20,000 mg/L PS Treatment because the reporting limit was over 10x higher than the value measured in 10,000 mg/L PS Second Treatment.

Page 10 of 10
Appendix A

Table A. Summary of all analytical data
Analyte Units Blank Control-1 Control-21,000 mg/L
PS5,000-1 mg/L PS
5,000-2 mg/L PS
10,000-1 mg/L PS
10,000-2 mg/L PS
15,000 mg/L PS
20,000-1 mg/L PS
20,000-2 mg/L PS
25,000 mg/L PS
Second dose 10,000 mg/L PS
10:2 FTS ug/L <0.0020 <0.0020 <0.0020 <0.0020 <0.0020 <0.0020 <0.0020 <0.0020 <0.0020 <0.0020 <0.0020 <0.0020 <0.0020
4:2 FTS ug/L <0.020 <0.020 <0.020 <0.020 <0.020 <0.020 <0.020 <0.020 <0.020 <0.020 <0.020 <0.020 <0.020
6:2 FTS ug/L <0.020 <0.020 <0.020 <0.020 <0.020 <0.020 <0.020 <0.020 <0.020 <0.020 <0.020 <0.020 <0.020
8:2 FTS ug/L <0.020 <0.020 <0.020 <0.020 <0.020 <0.020 <0.020 <0.020 <0.020 <0.020 <0.020 <0.020 <0.020
ADONA ug/L <0.0021 <0.0021 <0.0021 <0.0021 <0.0021 <0.0021 <0.0021 <0.0021 <0.0021 <0.0021 <0.0021 <0.0021 <0.0021
Byproduct 1 ug/L <0.027 0.057 0.074 <0.027 <0.027 <0.027 <0.027 <0.027 <0.027 <0.027 <0.027 <0.027 <0.0020
Byproduct 2 ug/L <0.030 0.69 0.89 <0.030 <0.030 <0.030 <0.030 <0.030 <0.030 <0.030 <0.030 <0.030 <0.0020
Byproduct 4 ug/L <0.16 0.55 0.71 <0.16 <0.16 <0.16 <0.16 <0.16 <0.16 <0.16 <0.16 <0.16 <0.0020
Byproduct 5 ug/L <0.058 1.20 1.40 <0.058 <0.058 <0.058 <0.058 <0.058 <0.058 <0.058 <0.058 <0.058 <0.0020
Byproduct 6 ug/L <0.015 <0.015 0.02 <0.015 <0.015 <0.015 <0.015 <0.015 <0.015 <0.015 <0.015 <0.015 <0.015
EVE Acid ug/L <0.024 0.027 0.026 <0.024 <0.024 <0.024 <0.024 <0.024 <0.024 <0.024 <0.024 <0.024 <0.0020
F-53B Major ug/L <0.0020 <0.0020 <0.0020 <0.0020 <0.0020 <0.0020 <0.0020 <0.0020 <0.0020 <0.0020 <0.0020 <0.0020 <0.0020
F-53B Minor ug/L <0.0020 <0.0020 <0.0020 <0.0020 <0.0020 <0.0020 <0.0020 <0.0020 <0.0020 <0.0020 <0.0020 <0.0020 <0.0020
HFPO-DA ug/L <0.0040 5.50 4.90 0.0073 <0.0040 <0.0040 <0.0040 <0.0040 <0.0040 <0.0040 <0.0040 <0.0040 <0.0040
Hydro-EVE Acid ug/L <0.028 0.10 0.11 <0.028 <0.028 <0.028 <0.028 <0.028 <0.028 <0.028 <0.028 <0.028 <0.0020
MeFOSA ug/L <0.035 <0.035 <0.035 <0.035 <0.035 <0.035 <0.035 <0.035 <0.035 <0.035 <0.035 <0.035 <0.0020
M-MeFOSE-M ug/L <0.11 <0.11 <0.11 <0.11 <0.11 <0.11 <0.11 <0.11 <0.11 <0.11 <0.11 <0.11 <0.0020
NaDONA ug/L <0.0021 <0.0021 <0.0021 <0.0021 <0.0021 <0.0021 <0.0021 <0.0021 <0.0021 <0.0021 <0.0021 <0.0021 <0.0021
NEtFOSAM ug/L <0.037 <0.037 <0.037 <0.037 <0.037 <0.037 <0.037 <0.037 <0.037 <0.037 <0.037 <0.037 <0.0020
N-EtFOSE-M ug/L <0.060 <0.060 <0.060 <0.060 <0.060 <0.060 <0.060 <0.060 <0.060 <0.060 <0.060 <0.060 <0.0020
N-ethylperfluorooctanesulfonamidoacetic acid (NEtFOSAA) ug/L <0.020 <0.020 <0.020 <0.020 <0.020 <0.020 <0.020 <0.020 <0.020 <0.020 <0.020 <0.020 <0.020
N-methylperfluorooctanesulfonamidoacetic acid (NMeFOSAA) ug/L <0.020 <0.020 <0.020 <0.020 <0.020 <0.020 <0.020 <0.020 <0.020 <0.020 <0.020 <0.020 <0.020
NVHOS ug/L <0.054 1.10 1.40 <0.054 <0.054 <0.054 <0.054 <0.054 <0.054 <0.054 <0.054 <0.054 <0.0020
PEPA ug/L <0.047 2.40 2.50 <0.047 <0.047 <0.047 <0.047 <0.047 <0.047 <0.047 <0.047 <0.047 <0.020
Perfluorobutanesulfonic acid (PFBS) ug/L <0.0020 0.0025 0.0023 <0.0020 <0.0020 <0.0020 <0.0020 <0.0020 <0.0020 <0.0020 <0.0020 <0.0020 <0.0020
Perfluorobutanoic acid (PFBA) ug/L <0.0020 0.0610 0.0570 0.0140 0.0057 0.0055 0.0033 0.0045 0.0029 0.0021 0.0025 0.0026 <0.0020
Perfluorodecanesulfonic acid (PFDS) ug/L <0.0020 <0.0020 <0.0020 <0.0020 <0.0020 <0.0020 <0.0020 <0.0020 <0.0020 <0.0020 <0.0020 <0.0020 <0.0020
Perfluorodecanoic acid (PFDA) ug/L <0.0020 <0.0020 0.0020 <0.0020 <0.0020 <0.0020 <0.0020 <0.0020 <0.0020 <0.0020 <0.0020 <0.0020 <0.0020
Perfluorododecanesulfonic acid (PFDoS) ug/L <0.0020 <0.0020 <0.0020 <0.0020 <0.0020 <0.0020 <0.0020 <0.0020 <0.0020 <0.0020 <0.0020 <0.0020 <0.0020
Perfluorododecanoic acid (PFDoA) ug/L <0.0020 <0.0020 <0.0020 <0.0020 <0.0020 <0.0020 <0.0020 <0.0020 <0.0020 <0.0020 <0.0020 <0.0020 <0.0020
Perfluoroheptanesulfonic Acid (PFHpS) ug/L <0.0020 <0.0020 <0.0020 <0.0020 <0.0020 <0.0020 <0.0020 <0.0020 <0.0020 <0.0020 <0.0020 <0.0020 <0.0020
Perfluoroheptanoic acid (PFHpA) ug/L <0.0020 0.020 0.018 0.0041 <0.0020 <0.0020 <0.0020 <0.0020 <0.0020 <0.0020 0.0033 0.0024 <0.0020
Perfluorohexanesulfonic acid (PFHxS) ug/L <0.0020 0.0035 0.0037 <0.0020 <0.0020 <0.0020 <0.0020 <0.0020 <0.0020 <0.0020 <0.0020 <0.0020 <0.0020
Perfluorohexanoic acid (PFHxA) ug/L <0.0020 0.013 0.012 <0.0020 <0.0020 <0.0020 <0.0020 <0.0020 <0.0020 <0.0020 <0.0020 <0.0020 <0.0020
Perfluoro-n-hexadecanoic acid (PFHxDA) ug/L <0.0020 <0.0020 <0.0020 <0.0020 <0.0020 <0.0020 <0.0020 <0.0020 <0.0020 <0.0020 <0.0020 <0.0020 <0.0020
Perfluoro-n-octadecanoic acid (PFODA) ug/L <0.0020 <0.0020 <0.0020 <0.0020 <0.0020 <0.0020 <0.0020 <0.0020 <0.0020 <0.0020 <0.0020 <0.0020 <0.0020
Perfluorononanesulfonic acid (PFNS) ug/L <0.0020 <0.0020 <0.0020 <0.0020 <0.0020 <0.0020 <0.0020 <0.0020 <0.0020 <0.0020 <0.0020 <0.0020 <0.0020
Perfluorononanoic acid (PFNA) ug/L <0.0020 0.0047 0.0047 <0.0020 <0.0020 <0.0020 <0.0020 <0.0020 <0.0020 <0.0020 <0.0020 <0.0020 <0.0020
Perfluorooctanesulfonamide (FOSA) ug/L <0.0020 <0.0020 <0.0020 <0.0020 <0.0020 <0.0020 <0.0020 <0.0020 <0.0020 <0.0020 <0.0020 <0.0020 <0.0020
Perfluorooctanesulfonic acid (PFOS) ug/L <0.0020 0.012 0.011 <0.0020 <0.0020 <0.0020 <0.0020 <0.0020 <0.0020 <0.0020 <0.0020 <0.0020 <0.0020
Perfluorooctanoic acid (PFOA) ug/L <0.0020 0.019 0.017 <0.0020 <0.0020 <0.0020 <0.0020 <0.0020 <0.0020 <0.0020 <0.0020 <0.0020 <0.0020
Perfluoropentanesulfonic acid (PFPeS) ug/L <0.0020 <0.0020 <0.0020 <0.0020 <0.0020 <0.0020 <0.0020 <0.0020 <0.0020 <0.0020 <0.0020 <0.0020 <0.0020
Perfluoropentanoic acid (PFPeA) ug/L <0.0020 0.077 0.071 <0.0020 <0.0020 <0.0020 <0.0020 <0.0020 <0.0020 <0.0020 <0.0020 <0.0020 <0.0020
Perfluorotetradecanoic acid (PFTeA) ug/L <0.0020 <0.0020 <0.0020 <0.0020 <0.0020 <0.0020 <0.0020 <0.0020 <0.0020 <0.0020 <0.0020 <0.0020 <0.0020
Perfluorotridecanoic acid (PFTriA) ug/L <0.0020 <0.0020 <0.0020 <0.0020 <0.0020 <0.0020 <0.0020 <0.0020 <0.0020 <0.0020 <0.0020 <0.0020 <0.0020
Perfluoroundecanoic acid (PFUnA) ug/L <0.0020 <0.0020 <0.0020 <0.0020 <0.0020 <0.0020 <0.0020 <0.0020 <0.0020 <0.0020 <0.0020 <0.0020 <0.0020
PES ug/L <0.046 <0.046 <0.046 <0.046 <0.046 <0.046 <0.046 <0.046 <0.046 <0.046 <0.046 <0.046 <0.046
PFECA B ug/L <0.060 <0.060 <0.060 <0.060 <0.060 <0.060 <0.060 <0.060 <0.060 <0.060 <0.060 <0.060 <0.060
PFECA G ug/L <0.041 <0.041 <0.041 <0.041 <0.041 <0.041 <0.041 <0.041 <0.041 <0.041 <0.041 <0.041 <0.041
PFMOAA ug/L <0.21 9.50 9.50 2.50 0.92 1.80 0.77 0.77 0.59 0.35 0.45 0.44 0.22
PFO2HxA ug/L <0.081 24.00 27.00 0.11 <0.081 <0.081 <0.081 <0.081 <0.081 <0.081 <0.081 <0.081 <0.0020
PFO3OA ug/L <0.058 5.50 6.40 <0.058 <0.058 <0.058 <0.058 <0.058 <0.058 <0.058 <0.058 <0.058 <0.0020
PFO4DA ug/L <0.079 1.40 1.70 <0.079 <0.079 <0.079 <0.079 <0.079 <0.079 <0.079 <0.079 <0.079 <0.0020
PFO5DA ug/L <0.034 0.40 0.44 <0.034 <0.034 <0.034 <0.034 <0.034 <0.034 <0.034 <0.034 <0.034 <0.0020
PMPA ug/L <0.57 4.50 4.70 1.30 0.67 0.70 0.61 <0.57 0.57 <0.57 <0.57 <0.57 0.016
R-EVE ug/L <0.070 0.24 0.24 <0.070 <0.070 <0.070 <0.070 <0.070 <0.070 <0.070 <0.070 <0.070 <0.0020
Total PFAS ug/L ND 57.37 62.20 3.94 1.60 2.51 1.38 0.77 1.16 0.35 0.46 0.45 0.24
PlumeStop dose (mg/L)


APPENDIX C REGENESIS APPLICATION SUMMARY REPORT


Global Headquarters
1011 Calle Sombra San Clemente, CA 92673 Ph: (949) 366‐8000 Fax: (949) 366‐8090
June 14, 2019 REGENESIS Proposal No. DaP62230 The Chemours Company FC, LLC ATTN: Sebastian Bahr 1007 Market Street, D‐3084 Wilmington, DE 19899 SUBJECT: Summary Report for the Perched Zone Pilot Study at the Fayetteville Works Site Sebastian,
REGENESIS Remediation Services (RRS) has recently completed the first of two planned pilot studies of in
situ injections utilizing PlumeStop® Liquid Activated Carbon™ (PlumeStop) for the treatment of the
contaminants perfluoro‐2‐methoxyacetic acid (PFMOAA) as well as GenX and its derivatives including
hexafluoropropylene oxide dimer acid (HFPO‐DA) at the Fayetteville Works Site (Site) located at 22828
NC‐87 in Fayetteville, North Carolina. In this Phase 1 pilot study, a “proof of concept” barrier was installed
in a perched aquifer (Perched Zone Area) at the Site. During Phase I, further site‐specific data were
gathered in order to optimize the sorption‐based treatment designs for the perched zone, the surficial
aquifer barrier of Phase II, and future large‐scale applications.
RRS mobilized product, injection equipment, and personnel to the Site to begin work over nine days on
May 7th through May 17th, 2019. RRS staffed the project with experienced personnel who ensured a safe,
successful injection application. General components of the pilot study included the installation of
temporary monitoring wells, collection and analyses of pre‐ and post‐application soil borings, design
verification testing, and application of PlumeStop at a total of 48 discrete injection locations. Throughout
the application, water levels and reagent concentrations in monitoring wells were measured to ascertain
the influence of remedial injections. After the application, RRS flushed the permanent monitoring wells
that were influenced with clean water to minimize particulate buildup resulting from injections.
For complete details of the study, please review the attached application summary page, injection layout,
soil boring logs, photo log, injection logs, and water level monitoring log.
RRS appreciates the opportunity to work at the Site with The Chemours Company. RRS will be available
to interpret the field data as it is collected and answer any questions. If you need additional information
regarding the application process or attached documents, please contact Steve Barnes at 574.349.0650
or Tyler Harris at 404.809.8807.
Sincerely,
Steve Barnes Tyler Harris
RRS Operations Manager Field Project Manager
REGENESIS Remediation Services REGENESIS Remediation Solutions
cc: Chad Northington ([email protected]); Doug Davis ([email protected]); Dave Peterson ([email protected]);
Scott Wilson ([email protected]); Tony Boever ([email protected])

REGENESIS Remediation Services Page 1 of 6
Global Headquarters
1011 Calle Sombra San Clemente, CA 92673 Ph: (949) 366‐8000 Fax: (949) 366‐8090
OVERVIEW
Client: The Chemours Company Site Address: 22828 NC‐87, Fayetteville, NC 28306 Client PM: Sebastian Bahr Project Name: Fayetteville Works Site RRS Project Manager: Steve Barnes Perched Zone Pilot Study RRS Project Supervisor: Tyler Harris Project Dates: 5/7/2019‐5/17/2019
TREATMENT TECHNOLOGY
The treatment approach for the Perched Zone Pilot Study at the Fayetteville Works Site followed in situ sorption using the REGENESIS product PlumeStop to partition PFMOAA and HFPO‐DA contamination in perched groundwater out of the dissolved phase. PlumeStop is a colloid of micro‐milled activated carbon with a particle size of 1‐2 μm suspended in water using unique organic polymer chemistry. After initial injections, the unique chemistry allows for distribution of PlumeStop through soil pore throats and deposition onto soil surfaces. Once deposition of the colloidal activated carbon onto soil occurs, PlumeStop effectively treats contaminated groundwater by providing a high surface area matrix for sorption of contaminants. PlumeStop is effective at removing a wide range of contaminants from groundwater, including refractory compounds such as the fluoroethers at the Site.
RRS conducted design verification testing (DVT) activities as outlined in the proposal dated May 3rd, 2019, with the results supplementing the conceptual design and installation of the Perched Zone Area barrier for Phase 1 of the pilot studies. Design modifications were necessitated from both the DVT work and review of hydrogeologic information submitted by Parsons immediately prior to mobilization.
PHASE I PILOT STUDY AREA
The Perched Zone Area of Phase I is located near the polyvinyl fluoride resin manufacturing unit at the
Fayetteville Works manufacturing site. Situated near an outfall channel, the area itself is relatively flat
and is adjacent to a moderately steep ravine to the west‐southwest. The Phase I pilot test was
conducted to assess PlumeStop treatment near the southwestern extent of the perched zone which is a
relatively thin saturated, sandy zone atop a clay unit starting at approximately 16 to 22 feet below
ground surface (bgs). The saturated thickness of the perched zone varies from 5 to 9 feet,
approximately, in the pilot test area. The area previously contained a stand of coniferous trees, which
was cleared prior to the arrival of RRS. The area also includes a series of permanent monitoring wells
located both within and outside the surficial extent of the injection barrier.
Prior to mobilization, Parsons completed a hydrogeologic assessment in this area to locate the perched
zone. As part of this assessment, a number of monitoring wells were installed to be used as performance
Perched Zone Pilot Study Summary Page
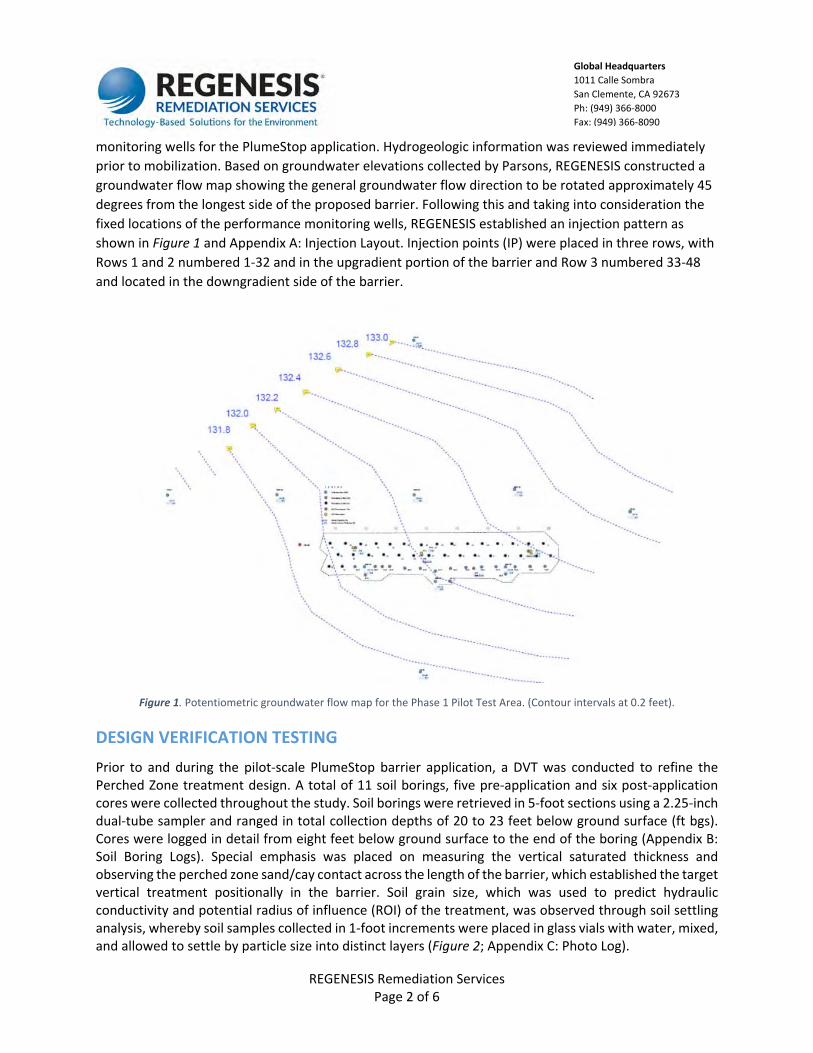
REGENESIS Remediation Services Page 2 of 6
Global Headquarters
1011 Calle Sombra San Clemente, CA 92673 Ph: (949) 366‐8000 Fax: (949) 366‐8090
monitoring wells for the PlumeStop application. Hydrogeologic information was reviewed immediately
prior to mobilization. Based on groundwater elevations collected by Parsons, REGENESIS constructed a
groundwater flow map showing the general groundwater flow direction to be rotated approximately 45
degrees from the longest side of the proposed barrier. Following this and taking into consideration the
fixed locations of the performance monitoring wells, REGENESIS established an injection pattern as
shown in Figure 1 and Appendix A: Injection Layout. Injection points (IP) were placed in three rows, with
Rows 1 and 2 numbered 1‐32 and in the upgradient portion of the barrier and Row 3 numbered 33‐48
and located in the downgradient side of the barrier.
Figure 1. Potentiometric groundwater flow map for the Phase 1 Pilot Test Area. (Contour intervals at 0.2 feet).
DESIGN VERIFICATION TESTING
Prior to and during the pilot‐scale PlumeStop barrier application, a DVT was conducted to refine the Perched Zone treatment design. A total of 11 soil borings, five pre‐application and six post‐application cores were collected throughout the study. Soil borings were retrieved in 5‐foot sections using a 2.25‐inch dual‐tube sampler and ranged in total collection depths of 20 to 23 feet below ground surface (ft bgs). Cores were logged in detail from eight feet below ground surface to the end of the boring (Appendix B: Soil Boring Logs). Special emphasis was placed on measuring the vertical saturated thickness and observing the perched zone sand/cay contact across the length of the barrier, which established the target vertical treatment positionally in the barrier. Soil grain size, which was used to predict hydraulic conductivity and potential radius of influence (ROI) of the treatment, was observed through soil settling analysis, whereby soil samples collected in 1‐foot increments were placed in glass vials with water, mixed, and allowed to settle by particle size into distinct layers (Figure 2; Appendix C: Photo Log).
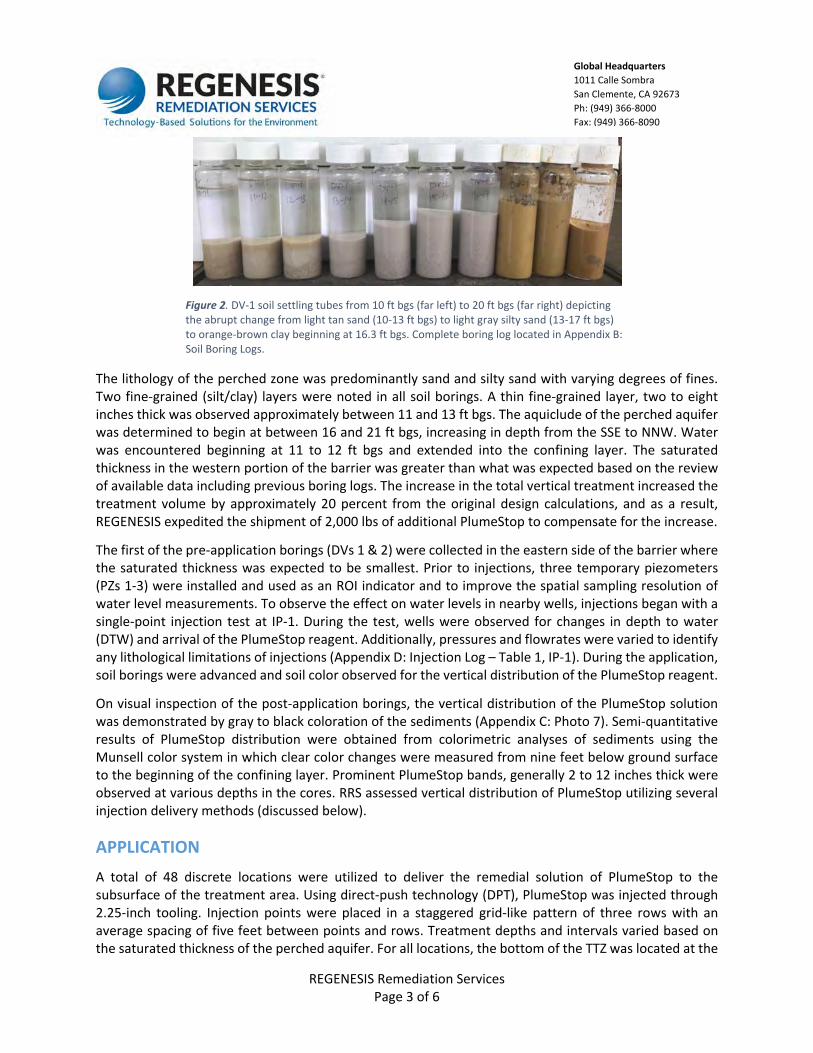
REGENESIS Remediation Services Page 3 of 6
Global Headquarters
1011 Calle Sombra San Clemente, CA 92673 Ph: (949) 366‐8000 Fax: (949) 366‐8090
Figure 2. DV‐1 soil settling tubes from 10 ft bgs (far left) to 20 ft bgs (far right) depicting the abrupt change from light tan sand (10‐13 ft bgs) to light gray silty sand (13‐17 ft bgs) to orange‐brown clay beginning at 16.3 ft bgs. Complete boring log located in Appendix B: Soil Boring Logs.
The lithology of the perched zone was predominantly sand and silty sand with varying degrees of fines. Two fine‐grained (silt/clay) layers were noted in all soil borings. A thin fine‐grained layer, two to eight inches thick was observed approximately between 11 and 13 ft bgs. The aquiclude of the perched aquifer was determined to begin at between 16 and 21 ft bgs, increasing in depth from the SSE to NNW. Water was encountered beginning at 11 to 12 ft bgs and extended into the confining layer. The saturated thickness in the western portion of the barrier was greater than what was expected based on the review of available data including previous boring logs. The increase in the total vertical treatment increased the treatment volume by approximately 20 percent from the original design calculations, and as a result, REGENESIS expedited the shipment of 2,000 lbs of additional PlumeStop to compensate for the increase.
The first of the pre‐application borings (DVs 1 & 2) were collected in the eastern side of the barrier where the saturated thickness was expected to be smallest. Prior to injections, three temporary piezometers (PZs 1‐3) were installed and used as an ROI indicator and to improve the spatial sampling resolution of water level measurements. To observe the effect on water levels in nearby wells, injections began with a single‐point injection test at IP‐1. During the test, wells were observed for changes in depth to water (DTW) and arrival of the PlumeStop reagent. Additionally, pressures and flowrates were varied to identify any lithological limitations of injections (Appendix D: Injection Log – Table 1, IP‐1). During the application, soil borings were advanced and soil color observed for the vertical distribution of the PlumeStop reagent.
On visual inspection of the post‐application borings, the vertical distribution of the PlumeStop solution was demonstrated by gray to black coloration of the sediments (Appendix C: Photo 7). Semi‐quantitative results of PlumeStop distribution were obtained from colorimetric analyses of sediments using the Munsell color system in which clear color changes were measured from nine feet below ground surface to the beginning of the confining layer. Prominent PlumeStop bands, generally 2 to 12 inches thick were observed at various depths in the cores. RRS assessed vertical distribution of PlumeStop utilizing several injection delivery methods (discussed below).
APPLICATION
A total of 48 discrete locations were utilized to deliver the remedial solution of PlumeStop to the subsurface of the treatment area. Using direct‐push technology (DPT), PlumeStop was injected through 2.25‐inch tooling. Injection points were placed in a staggered grid‐like pattern of three rows with an average spacing of five feet between points and rows. Treatment depths and intervals varied based on the saturated thickness of the perched aquifer. For all locations, the bottom of the TTZ was located at the
REGENESIS Remediation Services Page 4 of 6
Global Headquarters
1011 Calle Sombra San Clemente, CA 92673 Ph: (949) 366‐8000 Fax: (949) 366‐8090
perched water table‐aquiclude interface. As such, bottom treatment depths increased from 17 to 22 ft bgs along the barrier from the SSE to the NNW while the treatment interval increased from six to nine feet.
Initial injections were completed following a bottom‐up approach using 3‐foot retractable screens to deliver the PlumeStop reagent to the subsurface in discrete intervals of 1‐3 feet (i.e., an injection from 22‐20 ft bgs was completed before lifting tooling three feet to inject in the 20‐17 ft bgs interval). In addition to retractable screens, injections were attempted using pressure‐activated probes which discharge fluid in a narrow band from four injection ports. These probes were utilized in 6‐inch intervals following bottom‐up and top‐down approaches. Lastly, 3‐foot retractable screens were attempted in small, 1‐foot intervals following top‐down and bottom‐up approaches. Based on visual inspection of PlumeStop distribution in the post‐application cores corresponding to the aforementioned methods, 3‐foot screens following a bottom‐up approach of 3‐foot intervals was determined to be the best delivery method.
With the exception of high‐pressure tooling (e.g., pressure‐activated probes), injection pressures were
relatively low, remaining under 50 pounds per square inch (psi). The median pressure for all points,
regardless of tooling, was 18 psi. Aside from a pressure of 80 psi in the bottom injection interval at IP‐9,
pressures above 50 psi were observed at locations where pressure‐activated probes were used as well as
where retractable screens following a top‐down approach were used, which resulted in clogged screens
caused by back‐pressure. Back‐pressure was noted in some areas and appeared to increase as the
injection volume to a particular area increased.
To test injection limitations, flowrates were varied from 0.50 to 10.05 gallons per minute (gpm) for an
overall median flowrate of 4.31 gpm. Based on the lithology and injection tooling diameter, flowrates
appeared to be limited to a maximum of 5.50 gpm, whereby higher rates resulted in surfacing from around
the active boring. Surfacing was otherwise uncommon and successfully prevented or mitigated by
decreasing flowrates to 4.0 gpm or lower; lower rates were required as the application neared
completion.
REGENESIS’ design for the Perched Zone Area included two primary design types, termed “Rows 1 & 2”
and “Row 3”, with a total of five unique per point target volumes injected at three different concentrations
(Table 1). For Rows 1 & 2 (IPs 1‐32), PlumeStop was injected at 30,000 ppm, whereas IPs 33‐44 of Row 3
received a solution of 13,500 ppm, and IPs 45‐48 of Row 3 was injected at 10,541 ppm. During injections,
all nearby monitoring wells were monitored for water table fluctuations and the presence of PlumeStop
(Table 2; Appendix E: Water Level Measurements). Bailed samples were semi‐quantitatively measured
colorimetrically, with the upper limit of PlumeStop concentrations in MWs 34‐36 and PZs 1‐3 ranging from
3,000 to 30,000 ppm. To prevent particulate buildup in affected wells, MWs 34‐36 were flushed with clean
water after injections were completed. The temporary piezometers were removed and abandoned with
bentonite.

REGENESIS Remediation Services Page 5 of 6
Global Headquarters
1011 Calle Sombra San Clemente, CA 92673 Ph: (949) 366‐8000 Fax: (949) 366‐8090
TREATMENT AREA SUMMARY ROWS 1 & 2
9,200 pounds of PlumeStop were mixed with hydrant water and diluted to a 30,000 ppm solution. A
total of 7,351 gallons of the PlumeStop solution was injected.
Application Method: 2.25‐inch direct‐push tooling following top‐down and bottom‐up approaches.
Injection Tooling: 3‐foot retractable screens and pressure‐activated probes.
Injection Depths: 22‐10 ft bgs – varied by injection point based on saturated thickness; see Appendix D:
Injection Logs, Table 1 for details.
Number of Injection Points: 32
Deviations from Proposal:
1. Injection volume for IP‐12 applied in 18‐15 ft bgs interval due to volume calculation error.
2. Volume of IP‐31 and IP‐32 combined from 22‐16 ft bgs at IP‐32 due to surfacing‐related
abandonment of IP‐31 resulting from alternate delivery method; separate contingency point not
utilized due to the proximity of potential locations to IPs 31 and 32.
Please see Table 1 of Appendix D for details on injection flowrates and pressures observed.
ROW 3
12,800 pounds of PlumeStop were mixed with hydrant water and diluted to 13,500 ppm (IPs 33‐44) and
10,541 ppm (IPs 45‐48) solutions. A total of 4,867 gallons of the PlumeStop solution was injected.
Application Method: Direct‐push injection following bottom‐up approach
Injection Tooling: 3‐foot retractable screens
Injection Depth: 22‐11 ft bgs – varied by injection point based on saturated thickness; see Appendix D:
Injection Logs, Table 2 for details.
Number of Injection Points: 16
Deviations from Proposal: None
Please see Table 2 of Appendix D for details on injection flowrates and pressures observed.
SUMMARY
For this initial phase pilot test, design verification testing and installation of a PlumeStop barrier were
completed in the Perched Zone at the Fayetteville Works Site. The sorption‐based technology of
PlumeStop was implemented in the REGENESIS design to treat the target contaminants PFMOAA and
HFPO‐DA in groundwater of a perched aquifer located adjacent to the southern boundary of the
Fayetteville Works manufacturing site in Fayetteville, North Carolina. The in situ application of
PlumeStop at a total of 48 locations created a barrier 70 feet in length. A total of 22,000 lbs of
PlumeStop was injected via direct‐push technology for a total application volume of 12,218 gallons.

REGENESIS Remediation Services Page 6 of 6
Global Headquarters
1011 Calle Sombra San Clemente, CA 92673 Ph: (949) 366‐8000 Fax: (949) 366‐8090
Table 1: Treatment design details for the Perched Zone Pilot Study Area.
Design Name
Injection Point
Number
TTZ Thickness (vertical feet)
Injection Concentration
(ppm)
Target per Point Volume
(gal)
Actual per Point Volume (gal) ‐ mean
Rows 1 & 2
1‐16 6 30,000 188 183 ± 8
17‐22 8 30,000 250 240 ± 38
23‐32 9 30,000 281 300 ± 26
Row 3
33‐39 6 13,500 284 285 ± 16
40‐44 8 13,500 284 281 ± 22
45‐48 9 10,541 364 366 ± 21
Table 2: Depth to water and PlumeStop concentrationsmeasured at the six primary wells during injections.
Monitoring Well
Well Type │∆ DTW│ (absolute feet)
Max PlumeStop
Concentration (ppm)
MW‐34
Permanent
2.00 9,550
MW‐35 1.35 29,250
MW‐36 5.74 30,050
PZ‐1
Temporary
1.98 3,050
PZ‐2 1.56 21,550
PZ‐3 1.24 21,050

Global Headquarters
1011 Calle Sombra San Clemente, CA 92673 Ph: (949) 366‐8000 Fax: (949) 366‐8090
APPENDIX A – Injection Layout

Injection LayoutPerched Zone Pilot Study Area
Fayetteville Works SiteFayetteville, North Carolina
Date Prepared:May 2019
Prepared By:Tony Boever
2
1
3
45
67
89
1011
1213
1415
1617
1819
2021
2223
2425
2627
28
29
30
3132 3334
35
36
37383940
41
42434445
46
47
48
PZ‐3DV‐5
DV‐4
DV‐8
PZ‐2
DV‐3
DV‐6 DV‐7
DV‐2b
DV‐1b
DV‐1 PZ‐1
DV‐2
MW‐35
MW‐36MW‐34
DV‐9
“Rows 1 & 2” Injection Point
“Row 3” Injection Point
Pre‐application soil boring
Post‐application soil boring
Temporary piezometer
Permanent monitoring well
0 5 10 20
feet
Appendix A: Injection Layout Page 1 of 1 REGENESIS Remediation Services 2019
Global Headquarters
1011 Calle Sombra San Clemente, CA 92673 Ph: (949) 366‐8000 Fax: (949) 366‐8090
APPENDIX B – Soil Boring Logs:
Pre‐application cores: DVs 1, 2, 3, 4, 5
Post‐application cores: DVs 1b, 2b, 6, 7, 8, 9
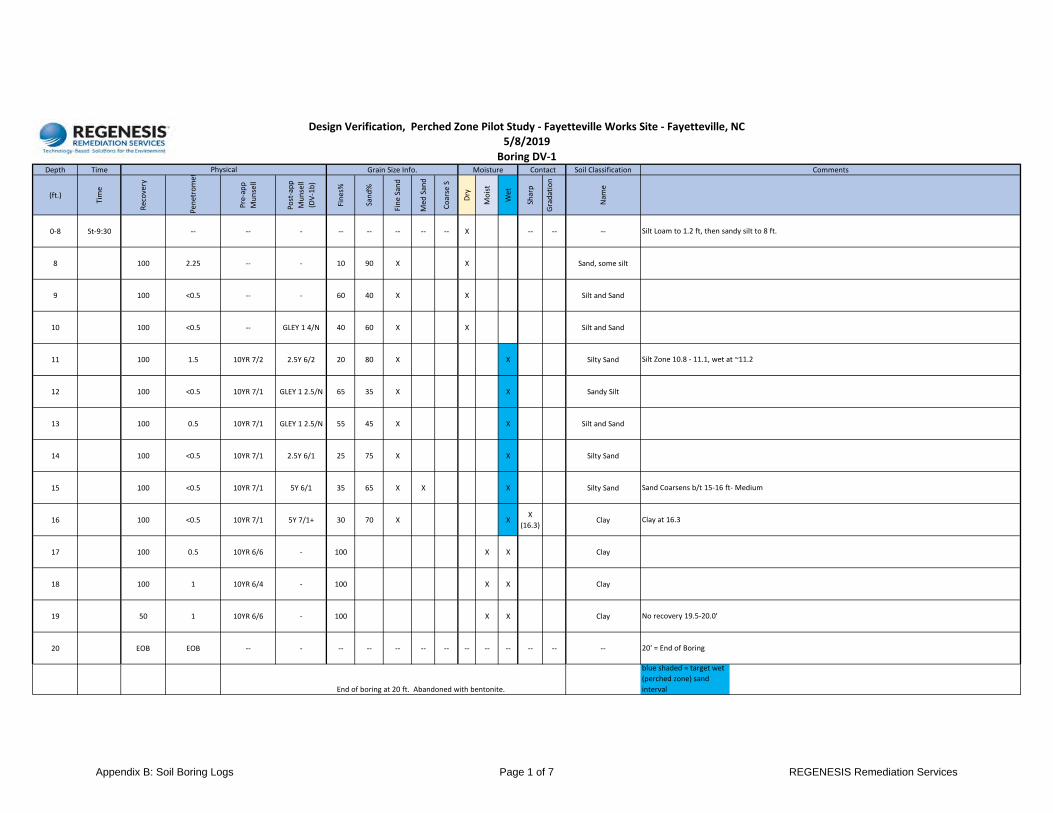
Depth Time Soil Classification
(ft.)
Time
Recovery
Pen
etromet
Pre‐app
Munsell
Post‐app
Munsell
(DV‐1b)
Fines%
Sand%
Fine Sand
Med
San
d
Coarse S
Dry
Moist
Wet
Sharp
Gradation
Nam
e
0‐8 St‐9:30 ‐‐ ‐‐ ‐ ‐‐ ‐‐ ‐‐ ‐‐ ‐‐ X ‐‐ ‐‐ ‐‐
8 100 2.25 ‐‐ ‐ 10 90 X X Sand, some silt
9 100 <0.5 ‐‐ ‐ 60 40 X X Silt and Sand
10 100 <0.5 ‐‐ GLEY 1 4/N 40 60 X X Silt and Sand
11 100 1.5 10YR 7/2 2.5Y 6/2 20 80 X X Silty Sand
12 100 <0.5 10YR 7/1 GLEY 1 2.5/N 65 35 X X Sandy Silt
13 100 0.5 10YR 7/1 GLEY 1 2.5/N 55 45 X X Silt and Sand
14 100 <0.5 10YR 7/1 2.5Y 6/1 25 75 X X Silty Sand
15 100 <0.5 10YR 7/1 5Y 6/1 35 65 X X X Silty Sand
16 100 <0.5 10YR 7/1 5Y 7/1+ 30 70 X XX
(16.3)Clay
17 100 0.5 10YR 6/6 ‐ 100 X X Clay
18 100 1 10YR 6/4 ‐ 100 X X Clay
19 50 1 10YR 6/6 ‐ 100 X X Clay
20 EOB EOB ‐‐ ‐ ‐‐ ‐‐ ‐‐ ‐‐ ‐‐ ‐‐ ‐‐ ‐‐ ‐‐ ‐‐ ‐‐
blue shaded = target wet
(perched zone) sand
intervalEnd of boring at 20 ft. Abandoned with bentonite.
No recovery 19.5‐20.0'
20' = End of Boring
Silt Loam to 1.2 ft, then sandy silt to 8 ft.
Silt Zone 10.8 ‐ 11.1, wet at ~11.2
Sand Coarsens b/t 15‐16 ft‐ Medium
Clay at 16.3
Design Verification, Perched Zone Pilot Study ‐ Fayetteville Works Site ‐ Fayetteville, NC5/8/2019
Boring DV‐1Grain Size Info. Moisture Contact CommentsPhysical
Appendix B: Soil Boring Logs Page 1 of 7 REGENESIS Remediation Services

Depth Time Soil Classification
(ft.)
Time
Recovery
Pen
etrometer
Pre‐app
Munsell
Post‐app
Color (DV‐7)
Fines%
Sand%
Fine Sand
Med
San
d
Coarse S
Dry
Moist
Wet
Sharp
Gradation
Nam
e
0‐8 St‐9:30 ‐‐ ‐‐ ‐ ‐‐ ‐‐ ‐‐ ‐‐ ‐‐ X ‐‐ ‐‐ ‐‐
8 100 2.25 ‐‐ ‐ 10 90 X X Sand, some silt
9 100 <0.5 ‐‐ GLEY 1 4/N 60 40 X X Silt and Sand
10 100 <0.5 ‐‐ 2.5Y 5/2 40 60 X X Silt and Sand
11 100 1.5 10YR 7/2 2.5Y 5/1 20 80 X X Silty Sand
12 100 <0.5 10YR 7/1 2.5Y 7/2 65 35 X X Sandy Silt
13 100 0.5 10YR 7/1 2.5Y 6/1 55 45 X X Silt and Sand
14 100 <0.5 10YR 7/1 GLEY 1 2.5Y/N 25 75 X X Silty Sand
15 100 <0.5 10YR 7/1 GLEY 2 3/5PB 35 65 X X X Silty Sand
16 100 <0.5 10YR 7/1 2.5Y 7/1 30 70 X XX
(16.3)Clay
17 100 0.5 10YR 6/6 GLEY 2 3/5PB 100 X X Clay
18 100 1 10YR 6/4 GLEY 1 5/N 100 X X Clay
19 50 1 10YR 6/6 GLEY 1 2.5/10Y 100 X X Clay
20 EOB EOB ‐‐ ‐ ‐‐ ‐‐ ‐‐ ‐‐ ‐‐ ‐‐ ‐‐ ‐‐ ‐‐ ‐‐ ‐‐
blue shaded = target wet
(perched zone) sand
intervalEnd of boring at 20 ft. Abandoned with bentonite.
Physical
No recovery 19.5‐20.0'
20' = End of Boring
Sand Coarsens b/t 15‐16 ft‐ Medium
Clay at 16.3
Silt Loam to 1.2 ft, then sandy silt to 8 ft.
Silt Zone 10.8 ‐ 11.1, wet at ~11.2
Design Verification, Perched Zone Pilot Study ‐ Fayetteville Works Site ‐ Fayetteville, NC5/8/2019
Boring DV‐1Grain Size Info. Moisture Contact Comments
Appendix B: Soil Boring Logs Page 2 of 7 REGENESIS Remediation Services

Depth Time Soil Classification
(ft.)
Time
Recovery
Penetrometer
Pre‐app
Munsell
Post‐app
Munsell (DV‐
2b)
Fines%
Sand%
Fine San
d
Med San
d
Coarse S
Dry
Moist
Wet
Sharp
Gradation
Nam
e
0‐10 St‐14:00 ‐‐ ‐‐ ‐ ‐‐ ‐‐ ‐‐ ‐‐ ‐‐ X ‐‐ ‐‐ ‐‐
8 50 0.5 ‐‐ ‐ ‐‐ ‐‐ ‐‐ ‐‐ ‐‐ X Sandy Silt
9 0 ‐‐ ‐‐ GLEY 1 4/N ‐‐ ‐‐ ‐‐ ‐‐ ‐‐ ‐‐ No Recovery
10 100 2.75 10YR 6/2 2.5Y 5/1 75 25 X X Sandy Silt
11 100 1.5 10YR 6/1 GLEY 1 5/N 75 25 X X Sandy Silt
12 100 2 10YR 7/1 2.5Y 6/2 80 20 X X X Sandy Silt
13 100 <0.5 10YR 6/3 2.5Y 6/2 5 95 X x Sand
14 0 ‐‐ ‐‐ GLEY 1 2.5Y/N ‐‐ ‐‐ ‐‐ ‐‐ ‐‐ ‐‐ ‐‐ No Recovery
15 100 0.5 10YR 7/1 5YR 4/10 30 70 X X Silty Sand
16 100 <0.5 10YR 7/1 2.5Y 6/6 30 70 X X X Silty Sand
17 100 <0.5 10YR 7/1 10YR 5/4 30 70 X X Silty Sand
18 100 1 10YR 6/6 10YR 6/2 100 X X X (18')
19 100 <0.5 10 YR 6/4 GLEY 2 3/5PB 100 X X
20 EOB EOB ‐‐ ‐ ‐‐ ‐‐ ‐‐ ‐‐ ‐‐ ‐‐ ‐‐ ‐‐ ‐‐ ‐‐ ‐‐
blue shaded = target wet
(perched zone) sand
intervalEnd of boring at 20 ft. Abandoned with bentonite.
Silty Clay (approx 20% silt)
20' = End of Boring
Silt Loam to 1.2 ft, then sandy silt to 10 ft. No Recovery 2.5 ‐ 5' and 9‐10'
Sandy Silt
Becoming moist, then wet starting at ~12 ft
Sand
Silty Sand
Design Verification, Perched Zone Pilot Study ‐ Fayetteville Works Site ‐ Fayetteville, NC5/8/2019
Boring DV‐2Grain Size Info. Moisture Contact CommentsPhysical
Appendix B: Soil Boring Logs Page 3 of 7 REGENESIS Remediation Services

Depth Time Soil Classification
(ft.)
Time
Recovery
Pen
etrometer
Pre‐app
Munsell
Post‐app
Munsell (DV‐
6)
Fines%
Sand%
Fine Sand
Med
San
d
Coarse S
Dry
Moist
Wet
Sharp
Gradation
Nam
e
0‐8 St‐16:00 ‐‐ ‐‐ ‐ ‐‐ ‐‐ ‐‐ ‐‐ ‐‐ X ‐‐ ‐‐ ‐‐
8 100 <0.5 ‐ ‐ ‐‐ ‐‐ ‐‐ ‐‐ ‐‐ X Sand
9 20 <0.5 ‐‐ GLEY 1 3/N ‐‐ ‐‐ ‐‐ ‐‐ ‐‐ X Sand
10 100 <0.5 10YR 7/2 GLEY 1 5+/N 10 90 X X Sand
11 100 1.5 10YR 7/1 2.5Y 6/1 60 40 X X Silt and Sand
12 100 0.5 10YR 7/2 2.5Y 6/2 10 90 X X X Sand
13 100 2.5 10 YR 6/2 GLEY 1 2.5/N+ 5 95 X X Sand
14 ‐‐ 1.5 ‐‐ GLEY 1 2.5/N+ ‐‐ ‐‐ ‐‐ ‐‐ ‐‐ ‐‐ ‐‐ ‐‐ No Recovery
15 100 <0.5 10 YR 7/1 GLEY 1 3/N 30 70 X X Silty Sand
16 100 <0.5 10 YR 7/1 GLEY 2.5/N 40 60 X X Silty Sand
17 100 <0.5 10 YR 7/1 GLEY 1 4/N 30 70 X X Silty Sand
18 100 <0.5 10 YR 7/1 GLEY 1 4/N 5 95 X X Sand
19 100 <0.510 YR 7/1 ‐‐>
5/6 @19.5'GLEY 1 3/N 10 90 X X
X
(19.5')
20 EOB EOB ‐‐ 2.5Y 5/6 ‐‐ ‐‐ ‐‐ ‐‐ ‐‐ ‐‐ ‐‐ ‐‐ ‐‐ ‐‐ ‐‐
blue shaded = target wet
(perched zone) sand
intervalEnd of boring at 20 ft. Abandoned with bentonite.
Becoming moist, then wet starting at ~12 ft
@13‐13.2 and at 13.8‐14 silt, sand and clay, stiff
No recovery 14‐15'
Pronounced sat zone 16.5‐17.2 ft
Pronounced sat zone 18.5‐19.1 ft
20' = End of Boring
Design Verification, Perched Zone Pilot Study ‐ Fayetteville Works Site ‐ Fayetteville, NC5/9/2019
Boring DV‐3Physical Grain Size Info. Moisture Contact Comments
Sand Loam to 1.5 ft, then sandy silt to 7.2 ft (no Recovery 3.2 ‐ 5'), then sand. Top 8 ft is all dry, mostly stiff
No recovery 9.2‐10'
Appendix B: Soil Boring Logs Page 4 of 7 REGENESIS Remediation Services

Depth Time Soil Classification
(ft.)
Time
Recovery
Pen
etrometer
Pre‐app
Munsell
Post‐app
Munsell (DV‐
8)
Fines%
Sand%
Fine Sand
Med
San
d
Coarse S
Dry
Moist
Wet
Sharp
Gradation
Nam
e
0‐8 St‐16:00 ‐‐ ‐‐ ‐ ‐‐ ‐‐ ‐‐ ‐‐ ‐‐ X ‐‐ ‐‐ ‐‐
8 100 <0.5 ‐ ‐ ‐‐ ‐‐ ‐‐ ‐‐ ‐‐ X Sand
9 20 <0.5 ‐‐ ‐ ‐‐ ‐‐ ‐‐ ‐‐ ‐‐ X Sand
10 100 <0.5 10YR 7/2 2.5Y 6/1 10 90 X X Sand
11 100 1.5 10YR 7/1 2.5Y 6/1 60 40 X X Silt and Sand
12 100 0.5 10YR 7/2 2.5Y 6/1 10 90 X X X Sand
13 100 2.5 10 YR 6/2 GLEY 1 2.5+/N 5 95 X X Sand
14 ‐‐ 1.5 ‐‐ 2.5Y 5/1 ‐‐ ‐‐ ‐‐ ‐‐ ‐‐ ‐‐ ‐‐ ‐‐ No Recovery
15 100 <0.5 10 YR 7/1 30 70 X X Silty Sand
16 100 <0.5 10 YR 7/1 40 60 X X Silty Sand
17 100 <0.5 10 YR 7/1 30 70 X X Silty Sand
18 100 <0.5 10 YR 7/1 5 95 X X Sand
19 100 <0.510 YR 7/1 ‐‐>
5/6 @19.5'10 90 X X
X
(19.5')
20 EOB EOB ‐‐ ‐‐ ‐‐ ‐‐ ‐‐ ‐‐ ‐‐ ‐‐ ‐‐ ‐‐ ‐‐ ‐‐
blue shaded = target wet
(perched zone) sand
intervalEnd of boring at 20 ft. Abandoned with bentonite.
Pronounced sat zone 18.5‐19.1 ft
20' = End of Boring
2.5Y 5/1 (20%
recovery 15‐20
ft bgs)
Pronounced sat zone 16.5‐17.2 ft
Sand Loam to 1.5 ft, then sandy silt to 7.2 ft (no Recovery 3.2 ‐ 5'), then sand. Top 8 ft is all dry, mostly stiff
No recovery 9.2‐10'
Becoming moist, then wet starting at ~12 ft
@13‐13.2 and at 13.8‐14 silt, sand and clay, stiff
No recovery 14‐15'
Design Verification, Perched Zone Pilot Study ‐ Fayetteville Works Site ‐ Fayetteville, NC5/9/2019
Boring DV‐3Grain Size Info. Moisture Contact CommentsPhysical
Appendix B: Soil Boring Logs Page 5 of 7 REGENESIS Remediation Services

Depth Time Soil Classification
(ft.)
Time
Recovery
Pen
etrometer
Pre‐app
Munsell
Post‐app
Munsell (DV‐
9)
Fines%
Sand%
Fine Sand
Med
San
d
Coarse S
Dry
Moist
Wet
Sharp
Gradation
Nam
e
0‐8' St‐14:20 ‐‐ ‐‐ ‐‐ ‐‐ ‐‐ ‐‐ ‐‐ X ‐‐ ‐‐ ‐‐
GLEY 1 2.5/N
10 100 0.75 10 YR 6/4 GLEY 1 3/N 30 70 X X Silty Sand
11 100 1 10 YR 6/1 GLEY 1 3/N 10 90 X X Sand
12 100 2.25 10 YR 6/1 10YR 7/1 20 80 X
x
(12.
5')
Silty Sand
13 100 0.75 10 YR 6/4 10YR 6/2 20 80 X X Silty Sand
14 20 <0.5 ‐‐ GLEY 1 2.5/N ‐‐ ‐‐ ‐‐ X ‐‐
15 100 <0.5 10 YR 7/1 10YR 7/1 10 90 X X Sand
16 100 <0.5 10 YR 7/1 GLEY 1 5/N 10 90 X X Sand
17 100 <0.5 10 YR 6/1 10YR 7/1 30 70 X X Silty Sand
18 100 <0.5 10 YR 7/1 GLEY 1 2.5/N 5 95 X X Sand
19 100 <0.5 10 YR 6/1‐>5/4 ‐ 5/100 95/0 X/'‐‐ XX
(19.2')
20 EOB EOB ‐‐ ‐ ‐‐ ‐‐ ‐‐ ‐‐ ‐‐ ‐‐ ‐‐ ‐‐ ‐‐ ‐‐ ‐‐
blue shaded = target wet
(perched zone) sand
intervalEnd of boring at 20 ft. Abandoned with bentonite.
@19.2 ft ‐ Sand to Clay contact, lt gray to gray/brown
20' = End of Boring
Sand Loam to 1.5 ft, then silt and sand. Top 10 ft is all dry, mostly stiff/dense.
No recovery 14.2‐15 ft
Design Verification, Perched Zone Pilot Study ‐ Fayetteville Works Site ‐ Fayetteville, NC5/9/2019
Boring DV‐4Grain Size Info. Moisture Contact CommentsPhysical
Appendix B: Soil Boring Logs Page 6 of 7 REGENESIS Remediation Services

Depth Time Soil Classification
(ft.)
Time
Recovery
Pen
etrometer
Munsell
Fines%
Sand%
Fine San
d
Med San
d
Coarse S
Dry
Moist
Wet
Sharp
Gradation
Nam
e
0‐8 St‐16:00 ‐‐ ‐‐ ‐‐ ‐‐ ‐‐ ‐‐ ‐‐ X ‐‐ ‐‐ ‐‐
8 100 1 ‐‐ ‐‐ ‐‐ ‐‐ ‐‐ ‐‐ X ‐‐ ‐‐ ‐‐
9 50 <0.5 ‐‐ ‐‐ ‐‐ ‐‐ ‐‐ ‐‐ X ‐‐ ‐‐ ‐‐
10 100 <0.5 10 YR 4/2 10 90 X X Sand
11 100 <0.5 10 YR 7/4 0 100 X X Sand
12 100 2 10 YR 6/2 70 30 X X
X
(12.
7')
Silty Sand
13 25 <0.5 10 90 X X X Sand
14 ‐‐ ‐‐ ‐‐ ‐‐ ‐‐ ‐‐ ‐‐ ‐‐ ‐‐ ‐‐ ‐‐ ‐‐
15 100 <0.5 10 YR 7/1 5 95 X X Sand
16 100 <0.5 10 YR 7/1 10 90 X X Sand
17 100 <0.5 10 YR 7/1 30 70 X X Silty Sand
18 100 <0.5 10 YR 7/1 30 70 X X Silty Sand
19 50 <0.5 ‐‐ ‐‐ ‐‐ ‐‐ ‐‐ ‐‐ ‐‐ ‐‐ X ‐‐
20 100 <0.5 10 YR 5/2 5 95 X Sand
21 100 <0.5 10 YR 5/3 100 0 X X Clay, some silt
22 30 <0.5 ‐‐ ‐‐ ‐‐ X X Clay, some silt
23 EOB EOB ‐‐ ‐‐ ‐‐ ‐‐ ‐‐ ‐‐ ‐‐ X X ‐‐ ‐‐ ‐‐
blue shaded = target wet
(perched zone) sand
intervalEnd of boring at 20 ft. Abandoned with bentonite.
@20.8 ‐ contact, sand to clay
23' = End of Boring
Sand Loam to 2.2 ft, then silt and sand to 7 ft, fine sand and silt to 10 ft, top 10 ft is all dry, mostly stiff/dense
Sand
Silt zone, stiff ‐ 12‐12.7, increasing moisture
No recovery 14‐15'
Design Verification, Perched Zone Pilot Study ‐ Fayetteville Works Site ‐ Fayetteville, NC5/9/2019
Boring DV‐5Physical Grain Size Info. Moisture Contact Comments
Appendix B: Soil Boring Logs Page 7 of 7 REGENESIS Remediation Services

Global Headquarters
1011 Calle Sombra San Clemente, CA 92673 Ph: (949) 366‐8000 Fax: (949) 366‐8090
APPENDIX C – Photo Log

Global Headquarters
1011 Calle Sombra San Clemente, CA 92673 Ph: (949) 366‐8000 Fax: (949) 366‐8090
Photo Log: Perched Zone Pilot Study Area at the Fayetteville Works Site
Photo 1: Perched Zone Pilot Study prior to the PlumeStop application. MW‐35 pictured in center.
Photo 2: Staging area for RRS equipment, water, and product.
Photo 3: Product delivery area. Photo 4: Hydrant water source located along the truck delivery route for Fayetteville Works.
Photo 5: Layout of injection locations. MW‐34 pictured in foreground.
Photo 6: Core sections of DV‐1 pre‐application soil boring.
Appendix C: Photo Log Page 1 of 4 REGENESIS Remediation Services

Global Headquarters
1011 Calle Sombra San Clemente, CA 92673 Ph: (949) 366‐8000 Fax: (949) 366‐8090
Photo 7: Post‐application boring DV‐1b showing concentrated PlumeStop in a banding pattern.
Photo 8: DV‐1b sediments mixed with water demonstrating coloration by PlumeStop.
Photo 9: Pre‐application soil boring DV‐2. Photo 10: Post‐application cores of DV‐2b denotingPlumeStop concentration at depth.
Photo 11: Soil settling vials of DV‐2b sediments. Photo 12: Pre‐application boring DV‐3.
Appendix C: Photo Log Page 2 of 4 REGENESIS Remediation Services
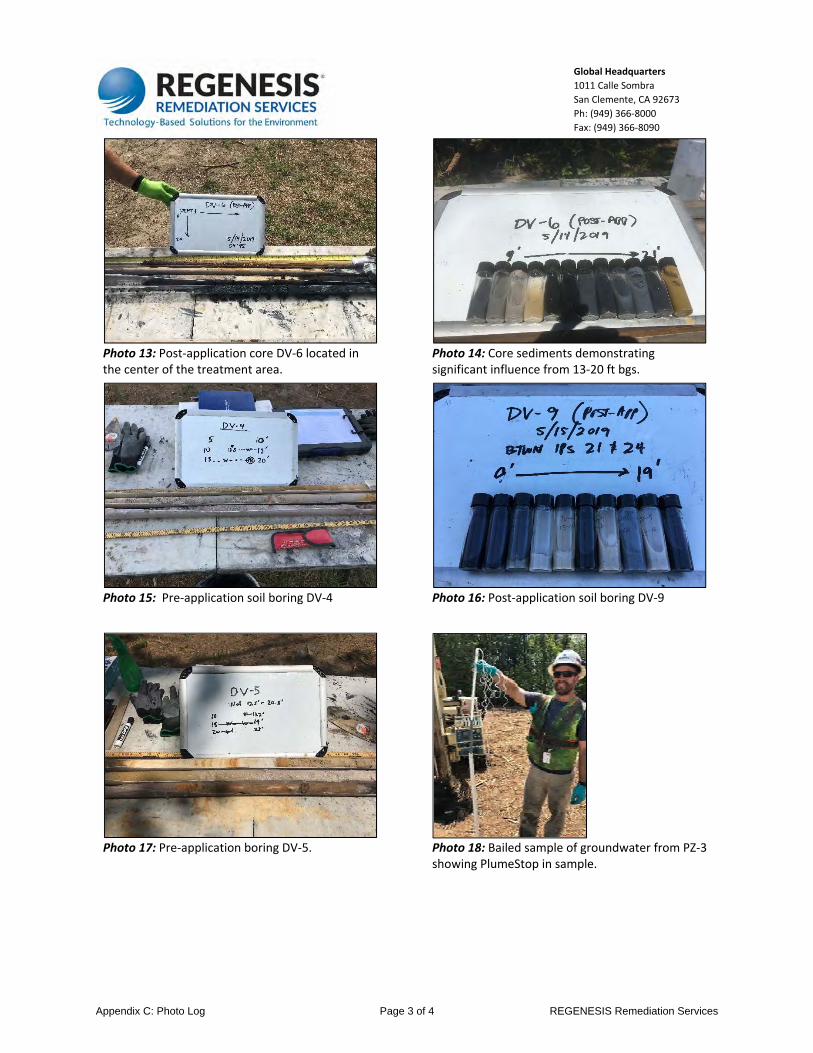
Global Headquarters
1011 Calle Sombra San Clemente, CA 92673 Ph: (949) 366‐8000 Fax: (949) 366‐8090
Photo 13: Post‐application core DV‐6 located in the center of the treatment area.
Photo 14: Core sediments demonstratingsignificant influence from 13‐20 ft bgs.
Photo 15: Pre‐application soil boring DV‐4 Photo 16: Post‐application soil boring DV‐9
Photo 17: Pre‐application boring DV‐5. Photo 18: Bailed sample of groundwater from PZ‐3
showing PlumeStop in sample.
Appendix C: Photo Log Page 3 of 4 REGENESIS Remediation Services

Global Headquarters
1011 Calle Sombra San Clemente, CA 92673 Ph: (949) 366‐8000 Fax: (949) 366‐8090
Photo 19: PlumeStop in bailed sample from one of the permanent monitoring wells in the area.
Photo 20: Injections in progress in the Perched Zone Area.
Photo 21: Perched Zone after completing injections. MWs 34‐36 pictured.
Appendix C: Photo Log Page 4 of 4 REGENESIS Remediation Services

Global Headquarters
1011 Calle Sombra San Clemente, CA 92673 Ph: (949) 366‐8000 Fax: (949) 366‐8090
APPENDIX D – Injection Logs:
Table 1: Rows 1 & 2
Table 2: Row 3

Beginning Flow Meter (gal)
Ending Flow Meter (gal)
Gallons Injected Per Time Point
Gallons Injected Per Interval
5/8/2019 10:30 28 1.23 0.00 5.25 5.25 30,000 6.57 DVT location5/8/2019 10:38 21 1.38 5.25 14.76 9.51 30,000 11.905/8/2019 10:41 23 2.77 14.76 21.15 6.40 30,000 8.015/8/2019 10:48 20 3.37 21.15 39.12 17.96 30,000 22.485/8/2019 10:56 18 9.23 39.12 66.72 27.60 30,000 34.555/8/2019 11:02 18 4.15 66.72 90.19 23.47 30,000 29.385/8/2019 - 36 4.11 90.19 93.24 3.05 30,000 3.825/8/2019 11:10 27 4.11 93.24 126.30 33.05 30,000 41.375/8/2019 11:14 30 4.68 126.30 144.00 17.70 30,000 22.155/8/2019 11:23 30 4.68 144.00 182.97 38.97 30,000 48.785/8/2019 11:46 31 4.68 0.00 3.20 3.20 30,000 4.015/8/2019 11:52 27 4.94 3.20 20.89 17.69 30,000 22.14 Slight surfacing around rod.5/8/2019 12:02 22 3.55 20.89 59.99 39.10 30,000 48.945/8/2019 12:11 23 3.54 59.99 92.94 32.95 30,000 41.255/8/2019 12:17 8 3.99 92.94 100.95 8.01 30,000 10.03 Raised extra foot due to surfacing from rod joint.5/8/2019 12:23 7 3.76 100.95 122.70 21.74 30,000 27.225/8/2019 12:38 6 3.78 122.70 183.15 60.45 30,000 75.675/8/2019 12:43 27 3.91 0.00 6.72 6.72 30,000 8.415/8/2019 12:49 27 4.66 6.72 34.31 27.58 30,000 34.525/8/2019 12:55 24 4.68 34.31 58.18 23.87 30,000 29.885/8/2019 13:03 12 2.37 58.18 91.85 33.67 30,000 42.155/8/2019 13:20 16 4.24 91.85 106.47 14.62 30,000 18.295/8/2019 13:30 16 4.35 106.47 150.57 44.10 30,000 55.205/8/2019 13:38 - - 150.57 186.65 36.09 30,000 45.175/8/2019 14:42 40 5.22 0.00 9.54 9.54 30,000 11.945/8/2019 14:52 28 5.27 9.54 48.54 39.00 30,000 48.825/8/2019 15:00 25 5.25 48.54 93.01 44.47 30,000 55.665/8/2019 15:03 28 5.27 93.01 112.18 19.17 30,000 24.00 Slight surfacing around rod.5/8/2019 15:11 17 3.38 112.18 143.66 31.48 30,000 39.405/8/2019 15:20 - - 143.66 170.13 26.47 30,000 33.145/9/2019 14:14 17-14 21 4.25 0.00 90.67 90.67 91 30,000 113.495/9/2019 14:46 14-11 11 4.50 90.67 183.78 93.11 93 30,000 116.545/9/2019 10:58 10 1.89 0.00 2.25 2.25 30,000 2.825/9/2019 11:02 23 3.92 2.25 9.98 7.73 30,000 9.685/9/2019 11:28 22 7.07 9.98 94.53 84.55 30,000 105.835/9/2019 11:48 14-11 0 4.58 94.53 183.36 88.83 89 30,000 111.185/8/2019 13:15 28 3.65 0.00 9.82 9.82 30,000 12.305/8/2019 13:21 30 4.33 9.82 26.12 16.29 30,000 20.395/8/2019 13:31 32 4.23 26.12 66.05 39.93 30,000 49.985/8/2019 13:37 44 4.11 66.05 91.37 25.32 30,000 31.705/8/2019 13:47 10 4.48 91.37 102.70 11.33 30,000 14.185/8/2019 13:52 6 4.45 102.70 146.40 43.69 30,000 54.695/8/2019 14:00 5 4.48 146.40 183.09 36.70 30,000 45.935/9/2019 15:12 33 1.67 0.00 6.54 6.54 30,000 8.195/9/2019 15:42 - - 6.54 99.82 93.28 30,000 116.765/9/2019 15:55 20 0.57 99.82 129.21 29.39 30,000 36.785/9/2019 16:07 - - 129.21 185.68 56.47 30,000 70.695/9/2019 10:45 80 1.10 0.00 8.54 8.54 30,000 10.685/9/2019 11:02 25 3.63 8.54 40.58 32.05 30,000 40.115/9/2019 11:33 10 4.87 40.58 93.80 53.22 30,000 66.615/9/2019 11:55 14-11 6 1.49 93.80 183.09 89.30 89 30,000 111.77
5/13/2019 11:59 32 3.32 0.00 5.55 5.55 30,000 6.955/13/2019 12:22 29 4.09 5.55 91.65 86.10 30,000 107.775/13/2019 13:13 15-12 10 - 91.65 172.07 80.41 30,000 100.65 Flowmeter stopped.5/13/2019 - - - - 172.07 192.63 20.56 30,000 25.74 Volume estimated.5/9/2019 15:23 27 5.14 0.00 8.00 8.00 30,000 10.015/9/2019 15:39 21 5.81 8.00 88.49 80.49 30,000 100.755/9/2019 15:55 22 4.14 88.49 119.49 31.00 30,000 38.805/9/2019 16:07 - - 119.49 170.09 50.60 30,000 63.33
5/13/2019 14:58 18-15 22 - 0.00 192.63 192.63 193 30,000 241.12 Location volume injected at depth.5/13/2019 12:05 12 - 0.00 4.57 4.57 30,000 5.725/13/2019 12:30 - - 4.57 46.83 42.26 30,000 52.89 Backpressure noted.5/13/2019 13:11 0 - 46.83 95.15 48.32 30,000 60.485/13/2019 - 15-12 - - 95.15 192.63 97.49 97 30,000 122.02 Volume estimated.5/14/2019 8:09 18-15 19 4.59 0.00 96.36 96.36 96 30,000 120.615/14/2019 8:33 15-12 12 4.37 96.36 171.05 74.68 75 30,000 93.485/13/2019 14:32 18-15 18 3.69 0.00 88.39 88.39 88 30,000 110.635/13/2019 - 15-12 - - 88.39 192.63 104.25 104 30,000 130.48 Volume estimated.5/14/2019 8:01 18-15 20 4.81 0.00 76.76 76.76 77 30,000 96.075/14/2019 8:30 15-12 15 4.04 76.76 171.58 94.83 95 30,000 118.69
3-Foot Screen
92
101
88
82
95
241
241
214
17-14
14-11
17-14
14-11
17-14
13-10
17-14
14-11
18-15
18-15
15-12
18-15
17-14
17-14
14-11
17-14
14-11
3-Foot Screen
3-Foot Screen
3-Foot Screen
3-Foot Screen
3-Foot Screen
3-Foot Screen
3-Foot Screen
3-Foot Screen
3-Foot Screen
3-Foot Screen
3-Foot Screen
3-Foot Screen
3-Foot Screen
3-Foot Screen
3-Foot Screen241
Pounds of PlumeStop Stout Injected Per Time
Point
Comments Injection Tooling
213
230
230
229
232
Total Pounds of PlumeStop Injected Per
Location
Total Gallons Per LocationInjection Point Date Time Injection Depth
(feet)Injection Pressure
(psi)Flow Rate
(gpm)
PlumeStop Reagent
Concentration (ppm)
Volume of PlumeStop Reagent Injected
6 183
7 183
8 186
17-14
91
92
100
86
9 183 229
15 193
12 193
13 193
14 171
16 172 215
Parsons - Fayetteville Works SitePlumeStop Injection Summary Log
Perched Zone Rows 1 & 2Table 1
4 170
3 187
229
229
234
5 184
2 183
1 183
10 193
11 170
241
213
94
90
93
93
90
92
95
93
77
95
Appendix D: Injection Logs Page 1 of 4 REGENESIS Remediation Services

Beginning Flow Meter (gal)
Ending Flow Meter (gal)
Gallons Injected Per Time Point
Gallons Injected Per Interval
Pounds of PlumeStop Stout Injected Per Time
Point
Comments Injection Tooling
Total Pounds of PlumeStop Injected Per
Location
Total Gallons Per LocationInjection Point Date Time Injection Depth
(feet)Injection Pressure
(psi)Flow Rate
(gpm)
PlumeStop Reagent
Concentration (ppm)
Volume of PlumeStop Reagent Injected
Parsons - Fayetteville Works SitePlumeStop Injection Summary Log
Perched Zone Rows 1 & 2Table 1
5/13/2019 11:33 23 6.22 0.00 9.18 9.18 30,000 11.495/13/2019 12:13 14 4.37 9.18 68.86 59.68 30,000 74.695/13/2019 12:53 18-15 8 2.97 68.86 163.08 94.23 30,000 117.945/13/2019 13:27 15-12 4 4.53 163.08 244.83 81.75 30,000 102.325/14/2019 10:40 20-19 125 1.62 0.00 15.13 15.13 15 30,000 18.935/14/2019 10:44 19-18.5 21 3.36 15.13 29.89 14.76 15 30,000 18.485/14/2019 10:49 18.5-18 19 3.74 29.89 46.04 16.15 16 30,000 20.215/14/2019 10:53 18-17.5 19 4.22 46.04 60.26 14.23 14 30,000 17.815/14/2019 10:56 17.5-17 18 4.27 60.26 80.22 19.96 20 30,000 24.985/14/2019 11:00 17-16.5 18 4.29 80.22 91.05 10.83 11 30,000 13.555/14/2019 11:03 16.5-16 18 4.31 91.05 106.35 15.30 15 30,000 19.155/14/2019 11:07 16-15.5 17 4.32 106.35 121.19 14.83 15 30,000 18.575/14/2019 11:09 15.5-15 17 4.33 121.19 131.25 10.06 10 30,000 12.595/14/2019 11:15 15-14.5 14 4.21 131.25 146.21 14.96 15 30,000 18.735/14/2019 11:19 14.5-14 15 4.35 146.21 164.01 17.80 18 30,000 22.285/14/2019 11:22 14-13.5 16 4.39 164.01 177.05 13.04 13 30,000 16.335/14/2019 11:25 13.5-13 16 4.43 177.05 192.18 15.13 15 30,000 18.935/14/2019 11:30 13-12.5 15 4.43 192.18 235.43 43.26 43 30,000 54.145/14/2019 7:55 20-18 10 4.95 0.00 61.74 61.74 62 30,000 77.285/14/2019 8:13 18-15 0 2.67 61.74 158.49 96.75 97 30,000 121.105/14/2019 8:32 15-12 0 4.13 158.49 240.86 82.38 82 30,000 103.115/13/2019 14:05 20-18 13 2.95 0.00 60.95 60.95 61 30,000 76.295/13/2019 14:37 18-15 13 4.18 60.95 155.48 94.53 95 30,000 118.335/13/2019 - 15-12 - - 155.48 192.63 37.15 37 30,000 46.50 Volume estimated.5/14/2019 14:29 12-13 6 1.76 0.00 30.17 30.17 30 30,000 37.77 Top-down approach.5/14/2019 15:06 13-14 13 3.68 30.17 60.29 30.12 30 30,000 37.705/14/2019 15:22 14-15 84 3.38 60.29 92.84 32.55 33 30,000 40.745/14/2019 15:44 15-16 13 2.50 92.84 121.35 28.50 29 30,000 35.685/14/2019 16:04 16-17 46 0.91 121.35 149.43 28.08 28 30,000 35.155/14/2019 16:34 17-18 110 1.29 149.43 176.04 26.61 27 30,000 33.315/15/2019 8:45 18-20 125 0.50 0.00 43.95 43.95 44 30,000 55.02 Clogged screen.5/15/2019 14:33 12 3.54 0.00 10.20 10.20 30,000 12.775/15/2019 14:52 6 4.43 10.20 94.56 84.36 30,000 105.595/15/2019 14:54 4 4.47 94.56 102.68 8.12 30,000 10.175/15/2019 15:09 - - 102.68 122.31 19.63 30,000 24.575/16/2019 6:58 6 5.20 120.52 196.57 76.05 30,000 95.195/16/2019 7:20 15-12 - - 0.00 109.04 109.04 109 30,000 136.485/16/2019 9:28 32 5.71 0.00 13.42 13.42 30,000 16.805/16/2019 9:43 25 5.65 13.42 77.24 63.82 30,000 79.885/16/2019 10:00 18-15 22 5.98 77.24 176.63 99.39 99 30,000 124.415/16/2019 10:22 15-12 - - 176.63 246.55 69.92 70 30,000 87.525/14/2019 14:35 13-14 120 1.75 0.00 29.88 29.88 30 30,000 37.40 Top-down approach.5/14/2019 15:04 14-15 0 3.40 29.88 60.98 31.10 31 30,000 38.935/14/2019 15:20 15-16 120 4.65 60.98 90.50 29.52 30 30,000 36.945/14/2019 15:42 16-17 75 1.93 90.50 121.19 30.69 31 30,000 38.415/14/2019 15:57 17-18 32 4.04 121.19 151.41 30.22 30 30,000 37.835/14/2019 16:11 18-19 52 2.19 151.41 182.83 31.43 31 30,000 39.345/15/2019 7:59 19-20 10 1.97 0.00 31.08 31.08 31 30,000 38.905/15/2019 8:18 20-21 78 1.75 31.08 65.89 34.81 35 30,000 43.575/15/2019 11:16 21-22 47 1.83 65.89 115.81 49.93 50 30,000 62.495/16/2019 7:58 28 4.80 0.00 32.18 32.18 30,000 40.285/16/2019 8:15 20 4.78 32.18 121.52 89.34 30,000 111.835/16/2019 8:22 14 2.92 121.52 147.09 25.56 30,000 32.005/16/2019 8:42 17 3.37 147.09 207.41 60.32 30,000 75.505/16/2019 9:11 16-13 11 5.08 207.41 324.27 116.86 117 30,000 146.275/15/2019 14:15 21-18 32 5.08 0.00 5.80 5.80 6 30,000 7.265/15/2019 14:40 17 4.72 5.80 99.49 93.69 30,000 117.275/15/2019 14:41 19 3.63 99.49 101.36 1.87 30,000 2.345/15/2019 15:10 - - 101.36 177.62 76.26 30,000 95.455/16/2019 6:38 23 4.81 175.02 194.15 19.13 30,000 23.955/16/2019 7:04 15-12 11 9.91 0.00 124.41 124.41 124 30,000 155.725/16/2019 8:24 9 3.89 0.00 42.38 42.38 30,000 53.055/16/2019 8:39 9 3.97 42.38 103.12 60.74 30,000 76.025/16/2019 9:04 0 2.29 103.12 187.24 84.13 30,000 105.305/16/2019 9:39 0 3.99 187.24 304.79 117.54 30,000 147.135/16/2019 7:42 26 5.61 0.00 49.68 49.68 30,000 62.185/16/2019 7:54 19 4.50 49.68 116.55 66.87 30,000 83.705/16/2019 7:58 19 4.86 116.55 132.79 16.24 30,000 20.325/16/2019 8:14 17 4.72 132.79 217.86 85.07 30,000 106.485/16/2019 8:23 16 3.79 217.86 234.84 16.98 30,000 21.255/16/2019 8:44 19 4.44 234.84 323.55 88.71 30,000 111.04
28 324 3-Foot Screen405
69
176
95
104
3-Foot Screen
3-Foot Screen
3-Foot Screen
3-Foot Screen
3-Foot Screen
3-Foot Screen
3-Foot Screen
3-Foot Screen
Pressure Activated Probe
3-Foot Screen
3-Foot Screen
17 245 30620-18
18 235
19 241
295
301
20 193
21 220
241
275
22 307
23 247
385
30921-18
20-18
18-15
77
24 299
25 324
374
406
22-19
19-16
122
86
26 321
27 305
402
38121-18
18-15
18-15 191
103
202
22-19
19-16
16-13
117
101
106
Appendix D: Injection Logs Page 2 of 4 REGENESIS Remediation Services

Beginning Flow Meter (gal)
Ending Flow Meter (gal)
Gallons Injected Per Time Point
Gallons Injected Per Interval
Pounds of PlumeStop Stout Injected Per Time
Point
Comments Injection Tooling
Total Pounds of PlumeStop Injected Per
Location
Total Gallons Per LocationInjection Point Date Time Injection Depth
(feet)Injection Pressure
(psi)Flow Rate
(gpm)
PlumeStop Reagent
Concentration (ppm)
Volume of PlumeStop Reagent Injected
Parsons - Fayetteville Works SitePlumeStop Injection Summary Log
Perched Zone Rows 1 & 2Table 1
5/15/2019 10:20 13-13.5 5 4.47 0.00 16.10 16.10 16 30,000 20.15 Top-down approach.5/15/2019 10:42 13.5-14 90 3.38 16.10 31.82 15.72 16 30,000 19.68 Surfacing noted.5/15/2019 10:55 14-14.5 32 5.37 31.82 47.28 15.46 15 30,000 19.355/15/2019 11:13 14.5-15 30 5.69 47.28 62.77 15.49 15 30,000 19.39 Surfacing noted.5/15/2019 11:22 15-15.5 18 3.69 62.77 78.76 15.98 16 30,000 20.015/15/2019 11:31 15.5-16 25 3.95 78.76 94.52 15.76 16 30,000 19.735/15/2019 11:46 16-16.5 65 1.99 94.52 110.12 15.60 16 30,000 19.525/15/2019 11:54 16.5-17 90 2.81 110.12 126.04 15.92 16 30,000 19.935/15/2019 12:00 17-17.5 21 5.44 126.04 142.36 16.32 16 30,000 20.435/15/2019 12:15 17.5-18 30 3.99 142.36 158.07 15.71 16 30,000 19.675/15/2019 13:06 22-18 25 3.67 0.00 8.14 8.14 8 30,000 10.19 Bottom-up5/15/2019 13:17 18-15 19 5.16 8.14 58.21 50.06 50 30,000 62.665/15/2019 13:34 15-12 17 4.72 58.21 157.68 99.47 99 30,000 124.515/15/2019 9:57 14 4.76 0.00 8.06 8.06 30,000 10.095/15/2019 10:02 8 4.92 8.06 31.18 23.12 30,000 28.945/15/2019 10:29 20-19 5 4.45 31.18 62.48 31.30 31 30,000 39.175/15/2019 10:37 19-18 8 4.85 62.48 95.59 33.11 33 30,000 41.455/15/2019 10:54 18-17 28 5.47 95.59 126.02 30.43 30 30,000 38.085/15/2019 11:06 17-16 25 10.05 126.02 157.44 31.42 31 30,000 39.335/15/2019 11:23 16-15 18 8.31 157.44 188.19 30.75 31 30,000 38.495/15/2019 11:33 15-14 0 3.57 188.19 224.53 36.34 36 30,000 45.495/15/2019 11:42 14-13 0 4.70 224.53 253.10 28.57 29 30,000 35.765/15/2019 11:47 13-12 0 4.55 253.10 283.56 30.46 30 30,000 38.125/15/2019 10:02 13-13.5 90 6.23 0.00 17.76 17.76 18 30,000 22.23 Top-down approach.5/15/2019 10:45 13.5-14 87 2.46 17.76 21.22 3.46 3 30,000 4.345/15/2019 11:03 14-14.5 86 4.14 21.22 47.07 25.85 26 30,000 32.365/15/2019 11:11 14.5-15 46 4.39 47.07 62.98 15.91 16 30,000 19.92 Surfacing.5/15/2019 11:25 15-15.5 46 5.79 62.98 74.79 11.81 12 30,000 14.78 Abandoned. Remaining volume injected at adjacent IP-32.5/15/2019 13:45 9 4.53 0.00 126.36 126.36 30,000 158.16 IP-31 15-22' interval volume injected at IP-32.5/15/2019 14:06 - - 126.36 203.65 77.29 30,000 96.745/15/2019 14:19 34 3.19 203.65 205.61 1.96 30,000 2.465/15/2019 14:36 20 4.69 205.61 281.98 76.37 30,000 95.595/15/2019 14:58 17 4.83 281.98 375.57 93.59 30,000 117.145/15/2019 15:11 - - 375.57 376.21 0.64 30,000 0.805/16/2019 6:55 0 4.65 370.70 485.79 115.09 30,000 144.06
7,351 9,201
3-Foot Screen
Pressure Activated Probe
3-Foot Screen
Pressure Activated Probe
3-Foot Screen
29 316 395
30 284
31 75
355
94
21-20 31
32 491 615
22-19
19-16
16-13
204
172
116
Total Pounds Injected:Total Gallons:
Appendix D: Injection Logs Page 3 of 4 REGENESIS Remediation Services

Beginning Flow Meter (gal)
Ending Flow Meter (gal)
Gallons Injected Per Time Point
Gallons Injected Per Interval
5/10/2019 8:41 17-14 24 3.54 0.00 6.36 6.36 6 13,500 17.905/10/2019 9:33 18 - 6.36 133.68 127.33 13,500 358.485/10/2019 10:02 - - 133.68 282.11 148.42 13,500 417.88 Volume estimated.5/9/2019 7:54 20 1.79 0.00 10.47 10.47 13,500 29.495/9/2019 8:17 29 5.03 10.47 44.03 33.56 13,500 94.485/9/2019 8:46 - - 44.03 198.10 154.07 13,500 433.775/9/2019 8:52 20 5.45 198.10 201.68 3.59 13,500 10.105/9/2019 9:10 0 5.00 201.68 304.40 102.72 13,500 289.20 Surfacing from abandoned boring.5/9/2019 9:18 - - 304.40 311.10 6.70 13,500 18.86
5/10/2019 8:11 27 3.50 0.00 9.75 9.75 13,500 27.465/10/2019 8:49 24 4.11 9.75 142.62 132.87 13,500 374.095/10/2019 8:51 21 4.25 142.62 150.97 8.34 13,500 23.495/10/2019 9:39 - - 150.97 282.11 131.14 13,500 369.22 Volume estimated.5/10/2019 10:47 26 7.90 0.00 2.90 2.90 13,500 8.175/10/2019 11:35 10 2.47 2.90 79.67 76.76 13,500 216.13 Slight surfacing from around rod; decreased flow rate to mitigate.5/10/2019 11:54 9 4.30 79.67 130.66 51.00 13,500 143.585/10/2019 12:55 14-11 10 3.08 130.66 258.35 127.68 128 13,500 359.495/9/2019 8:13 10 - 0.00 4.49 4.49 13,500 12.655/9/2019 8:16 26 5.16 4.49 18.68 14.18 13,500 39.935/9/2019 8:46 - - 18.68 152.80 134.13 13,500 377.635/9/2019 8:56 12 4.64 152.80 171.86 19.06 13,500 53.665/9/2019 9:18 10 6.37 171.86 272.95 101.09 13,500 284.635/9/2019 9:25 - - 272.95 296.90 23.95 13,500 67.42
5/10/2019 10:51 36 4.73 0.00 4.77 4.77 13,500 13.425/10/2019 11:34 24 5.00 4.77 112.31 107.54 13,500 302.775/10/2019 11:45 24 4.99 112.31 157.54 45.24 13,500 127.365/10/2019 12:36 15-12 12 3.79 157.54 281.43 123.89 124 13,500 348.805/13/2019 10:28 32 4.60 0.00 32.42 32.42 13,500 91.285/13/2019 10:53 25 4.64 32.42 158.00 125.58 13,500 353.57 Slight backpressure noted.5/13/2019 11:07 20 3.90 158.00 178.00 20.00 13,500 56.315/13/2019 11:27 20 4.26 178.00 284.00 106.00 13,500 298.445/16/2019 10:41 20 5.06 0.00 4.35 4.35 13,500 12.245/16/2019 11:21 12 5.97 4.35 132.43 128.09 13,500 360.625/16/2019 11:23 10 4.85 132.43 138.00 5.57 13,500 15.675/16/2019 11:56 0 4.54 138.00 263.48 125.48 13,500 353.295/10/2019 9:08 28 5.39 0.00 13.33 13.33 13,500 37.535/10/2019 10:02 - - 13.33 141.05 127.72 13,500 359.60 Volume estimated.5/10/2019 10:41 15-12 - - 141.05 282.11 141.05 141 13,500 397.13 Volume estimated.5/16/2019 11:25 19 4.71 0.00 40.71 40.71 13,500 114.615/16/2019 11:35 19 4.92 40.71 85.51 44.80 13,500 126.145/16/2019 12:18 19-16 12 6.07 85.51 262.74 177.23 177 13,500 498.985/16/2019 10:38 28 5.16 0.00 18.13 18.13 13,500 51.045/16/2019 10:58 18 3.81 18.13 80.14 62.02 13,500 174.615/16/2019 10:59 12 3.36 80.14 83.14 2.99 13,500 8.435/16/2019 11:37 8 2.31 83.14 181.86 98.72 13,500 277.955/16/2019 12:06 15-12 - 4.85 181.86 280.16 98.30 98 13,500 276.775/10/2019 12:21 20-18 19 4.63 0.00 66.83 66.83 67 13,500 188.165/10/2019 12:49 18-15 15 4.31 66.83 176.58 109.75 110 13,500 309.015/10/2019 13:31 15-12 16 5.46 176.58 317.91 141.32 141 13,500 397.895/16/2019 12:56 25 5.67 0.00 11.97 11.97 10,541 26.325/16/2019 13:27 8 4.14 11.97 134.29 122.32 10,541 268.915/16/2019 13:46 12 4.32 134.29 213.26 78.97 10,541 173.605/16/2019 14:04 11 3.30 213.26 277.18 63.92 10,541 140.51 Surfacing.5/16/2019 14:48 16-13 11 3.14 277.18 384.93 107.75 108 10,541 236.885/17/2019 6:53 12 2.88 0.00 18.20 18.20 10,541 40.015/17/2019 7:25 12 4.24 18.20 144.22 126.02 10,541 277.035/17/2019 8:00 19-16 12 4.87 144.22 272.86 128.64 129 10,541 282.795/17/2019 8:21 16-13 11 4.82 272.86 346.22 73.36 73 10,541 161.28 End of project volume.5/16/2019 13:05 14 4.26 0.00 18.86 18.86 10,541 41.475/16/2019 13:40 4 3.89 18.86 137.49 118.62 10,541 260.785/16/2019 13:47 18 3.70 0.00 35.61 35.61 10,541 78.29 Surfacing.5/16/2019 14:15 6 3.42 35.61 132.39 96.78 10,541 212.76 Surfacing.5/16/2019 14:50 16-13 6 3.54 132.39 212.48 80.09 80 10,541 176.075/17/2019 6:54 8 2.68 0.00 13.61 13.61 10,541 29.935/17/2019 7:24 5 4.22 13.61 108.43 94.82 10,541 208.455/17/2019 7:54 19-16 4 6.34 108.43 277.96 169.53 170 10,541 372.695/17/2019 8:21 16-13 0 4.58 277.96 383.38 105.42 105 10,541 231.74 End of project volume.
4,867 12,799
Comments Injection Tooling
Total Pounds of PlumeStop Injected Per
Location
Total Gallons Per LocationInjection Point Date Time Injection Depth
(feet)Injection Pressure
(psi)Flow Rate
(gpm)
PlumeStop Reagent
Concentration (ppm)
Pounds of PlumeStop
Injected Per Time Point
Volume of PlumeStop Reagent Injected
33 282 794276
34 311
35 282
876
794
198
113
143
139
36 258
37 297
727
836
131
153
144
38 281
39 284
792
800
158
158
126
40 263
41 282
742
794
132
131
141
42 263
43 280
740
789
86
80
102
44 318
45 385
895
846
134
143
46 346
47 350
761
769
144
137
132
48 383 843108
Total Pounds Injected:
Parsons - Fayetteville Works SitePlumeStop Injection Summary Log
Perched Zone Row 3Table 2
Total Gallons:
3-Foot Screen14-11
3-Foot Screen
17-14
14-11
3-Foot Screen17-14
14-11
3-Foot Screen17-14
3-Foot Screen
17-14
14-11
3-Foot Screen18-15
3-Foot Screen19-16
16-13
3-Foot Screen19-16
16-13
3-Foot Screen22-19
3-Foot Screen
22-19
19-16
3-Foot Screen22-19
3-Foot Screen18-15
3-Foot Screen21-19
3-Foot Screen
20-18
18-15
3-Foot Screen
3-Foot Screen
22-19
19-16
Appendix D: Injection Logs Page 4 of 4 REGENESIS Remediation Services
Global Headquarters
1011 Calle Sombra San Clemente, CA 92673 Ph: (949) 366‐8000 Fax: (949) 366‐8090
APPENDIX E – Water Level Measurements

Location Date Time DTW (ft from TOC) DTW (ft bgs)
Concentration PlumeStop
(ppm)Comments
5/10/19 - 15.81 13.61 Baseline.5/15/19 12:51 15.70 13.505/16/19 7:28 15.61 13.415/17/19 10:00 15.61 13.415/10/19 - 14.87 12.32 Baseline.5/17/19 9:58 14.69 12.14 05/10/19 - 14.32 11.82 Baseline.5/15/19 12:56 14.33 11.835/16/19 7:14 14.28 11.785/17/19 9:35 14.33 11.835/10/19 - 15.86 13.41 Baseline.5/13/19 9:29 15.89 13.445/14/19 8:57 15.66 13.215/14/19 12:02 16.71 14.26 6,5505/14/19 16:40 15.85 13.405/15/19 8:37 15.27 12.825/15/19 12:33 15.55 13.105/16/19 7:25 15.54 13.095/17/19 7:19 14.71 12.265/17/19 8:36 14.71 12.26 9,5505/10/19 - 15.35 12.90 Baseline.5/13/19 9:37 14.00 11.55 29,250 Pressure noted.5/13/19 15:16 14.56 12.115/14/19 8:53 14.80 12.355/14/19 11:55 14.84 12.395/14/19 16:40 15.14 12.695/15/19 8:43 15.19 12.745/16/19 7:21 15.07 12.625/17/19 7:27 15.05 12.605/17/19 9:05 15.11 12.66 16,0505/8/19 10:33 15.62 12.62 Baseline.5/8/19 10:51 15.41 12.415/8/19 11:19 15.32 12.325/8/19 12:10 15.30 12.305/8/19 12:41 15.25 12.255/8/19 13:34 14.61 11.61 26,550 Sample bailed at 13:17.5/8/19 15:39 15.18 12.185/9/19 9:08 9.94 6.945/9/19 11:07 9.88 6.885/9/19 16:47 14.95 11.955/10/19 - 15.55 12.555/13/19 9:40 15.58 12.58 19,2505/13/19 15:11 14.15 11.155/15/19 12:54 15.52 12.525/16/19 7:17 15.43 12.435/17/19 9:17 15.46 12.46 30,0505/8/19 10:30 15.78 11.91 Baseline; first bailed sample very cloudy.5/8/19 10:54 15.39 11.525/8/19 11:21 15.25 11.385/8/19 12:08 14.98 11.11 Well water clear.5/8/19 12:44 15.16 11.29 No PlumeStop in well.5/8/19 13:35 14.37 10.505/8/19 15:40 15.19 11.32 1505/9/19 9:10 14.78 10.915/9/19 11:09 13.80 9.935/9/19 16:49 15.46 11.595/10/19 - 15.75 11.885/13/19 9:42 14.79 10.92 2,3505/13/19 15:09 15.42 11.555/15/19 12:40 15.76 11.895/16/19 7:15 15.66 11.795/17/19 9:20 15.67 11.80 3,050
Parsons ‐ Fayetteville Works Site
Depth to Water (DTW) and PlumeStop Measurements
Perched Zone Pilot Study Area
MW-31
MW-32
MW-33
MW-34
MW-35
MW-36
PZ-1
Appendix E: Water Level Measurements Page 1 of 2 REGENESIS Remediation Services
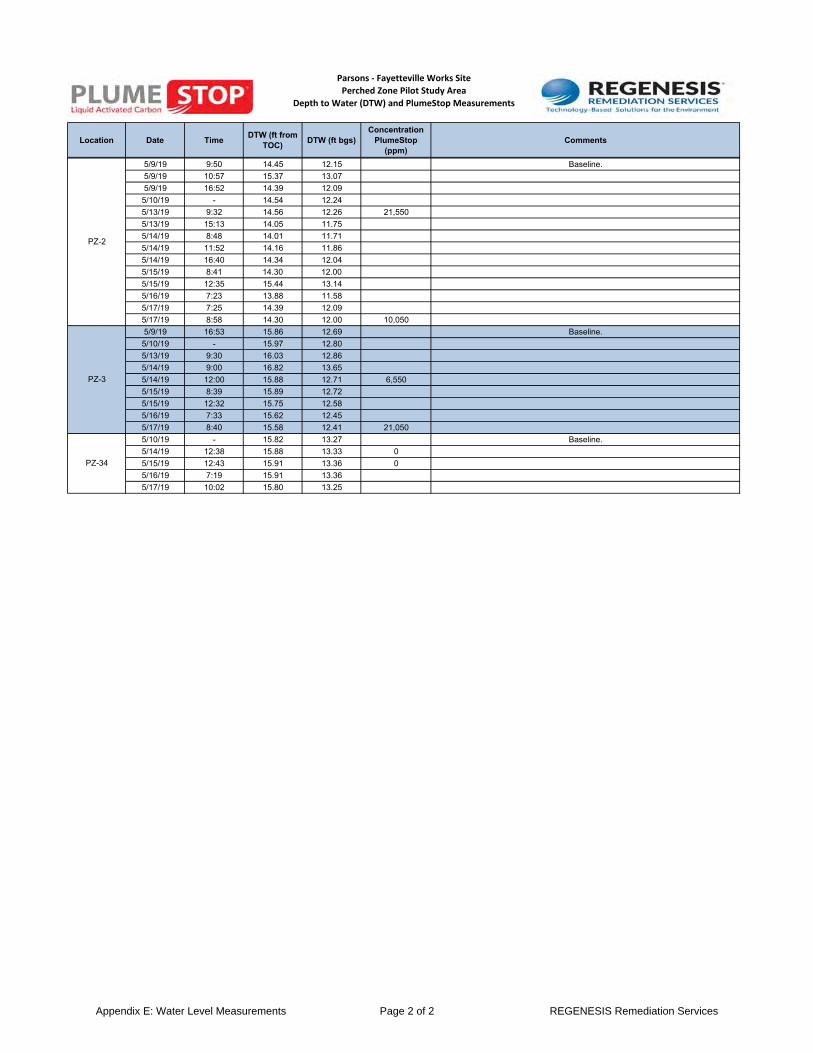
Location Date Time DTW (ft from TOC) DTW (ft bgs)
Concentration PlumeStop
(ppm)Comments
Parsons ‐ Fayetteville Works Site
Depth to Water (DTW) and PlumeStop Measurements
Perched Zone Pilot Study Area
5/9/19 9:50 14.45 12.15 Baseline.5/9/19 10:57 15.37 13.075/9/19 16:52 14.39 12.095/10/19 - 14.54 12.245/13/19 9:32 14.56 12.26 21,5505/13/19 15:13 14.05 11.755/14/19 8:48 14.01 11.715/14/19 11:52 14.16 11.865/14/19 16:40 14.34 12.045/15/19 8:41 14.30 12.005/15/19 12:35 15.44 13.145/16/19 7:23 13.88 11.585/17/19 7:25 14.39 12.095/17/19 8:58 14.30 12.00 10,0505/9/19 16:53 15.86 12.69 Baseline.5/10/19 - 15.97 12.805/13/19 9:30 16.03 12.865/14/19 9:00 16.82 13.655/14/19 12:00 15.88 12.71 6,5505/15/19 8:39 15.89 12.725/15/19 12:32 15.75 12.585/16/19 7:33 15.62 12.455/17/19 8:40 15.58 12.41 21,0505/10/19 - 15.82 13.27 Baseline.5/14/19 12:38 15.88 13.33 05/15/19 12:43 15.91 13.36 05/16/19 7:19 15.91 13.365/17/19 10:02 15.80 13.25
PZ-34
PZ-2
PZ-3
Appendix E: Water Level Measurements Page 2 of 2 REGENESIS Remediation Services

Global Headquarters
1011 Calle Sombra San Clemente, CA 92673 Ph: (949) 366‐8000 Fax: (949) 366‐8090
End of document.

APPENDIX D LABORATORY REPORTS


ADQM Data Review Narrative - FAY Regenesis Ph I Pilot Study.doc 1 of 3
ADQM DATA REVIEW NARRATIVE
Site Chemours FAY – Fayetteville Project Regenesis Phase 1 Pilot Study Project Reviewer Michael Aucoin, AECOM as a Chemours contractor Sampling Dates May 2, 2019 May 3, 2019
May 6, 2019 May 9, 2019 May 14, 2019 Analytical Protocol
Laboratory Analytical Method Parameter(s) TestAmerica - Sacramento 537 Modified PFAS1 TestAmerica - Sacramento Cl. Spec. Table 3
Compound SOP Table 3+ compounds
TestAmerica - Denver 8260B Volatile Organics TestAmerica - Denver 6010D Calcium, total and dissolved TestAmerica - Denver 2340 C-1997 Total Hardness as CaCO3 TestAmerica - Denver 9060 Total Organic Carbon TestAmerica - Denver 9060 Dissolved Organic Carbon
1 Perfluoroalkylsubstances, a list of 33 compounds including HFPO-DA. Sample Receipt The following items are noted for this data set:
• All samples were received in satisfactory condition and within EPA temperature guidelines on: May 7, 2019 May 9. 2019 May 10, 2019 May 16, 2019 July 26, 2019
The July sample receipt reflects additional volume of a May sample that was renamed as FAY-PS2019-Posttreat10-07252019 and provided to the laboratory to allow Table 3+ analysis to be completed.
Data Review

ADQM Data Review Narrative - FAY Regenesis Ph I Pilot Study.doc 2 of 3
The project results reflect analysis of DFSA, MMF, MTP, and PPF Acid by the Table 3+ method for samples collected and analyzed during May. DFSA, MMF, MTP, and PPF Acid were subsequently dropped from the Table 3+ method due to overall poor performance in the presence of matrix effects, including inconsistent sample results, and were not reported from the July analysis of the May sample. The electronic data submitted for this project was reviewed via the Data Verification Module (DVM) process. Overall the data is acceptable for use without qualification, except as noted below:
• Non-detect results for MMF in two samples were qualified R and should be considered to be unusable due to very poor matrix spike recoveries.
• Results for total calcium, carbon disulfide, chloroform, and dissolved organic carbon (DOC) in one or more samples were qualified B and the reported results may be biased high, or false positives, due to a comparable concentration found in the associated equipment blank or lab method blank.
• Several analytical results have been qualified J as estimated, and non-detect results qualified UJ indicating an estimated reporting limit, due to a poor matrix spike recovery; sample analysis which exceeded the laboratory established hold time; and poor field duplicate or lab replicate precision. TOC and volatile organic results reported between the method detection limit (MDL) and practical quantitation limit (PQL) were qualified J as estimated. See the Data Verification Module (DVM) Narrative Report for which samples were qualified, the specific reasons for qualification, and potential bias in reported results.
Attachments The DVM Narrative report is attached. The lab reports due to a large page count are stored on an AECOM network shared drive and are available to be posted on external shared drives, or on a flash drive.

ADQM Data Review Narrative - FAY Regenesis Ph I Pilot Study.doc 3 of 3
Data Verification Module (DVM) The DVM is an internal review process used by the ADQM group to assist with the determination of data usability. The electronic data deliverables received from the laboratory are loaded into the Locus EIM™ database and processed through a series of data quality checks, which are a combination of software (Locus EIM™ database Data Verification Module (DVM)) and manual reviewer evaluations. The data is evaluated against the following data usability checks:
• Field and laboratory blank contamination • US EPA hold time criteria • Missing Quality Control (QC) samples • Matrix spike(MS)/matrix spike duplicate (MSD) recoveries and the relative percent differences
(RPDs) between these spikes • Laboratory control sample(LCS)/control sample duplicate (LCSD) recoveries and the RPD
between these spikes • Surrogate spike recoveries for organic analyses • RPD between field duplicate sample pairs • RPD between laboratory replicates for inorganic analyses • Difference / percent difference between total and dissolved sample pairs.
There are two qualifier fields in EIM:
Lab Qualifier is the qualifier assigned by the lab and may not reflect the usability of the data. This qualifier may have many different meanings and can vary between labs and over time within the same lab. Please refer to the laboratory report for a description of the lab qualifiers. As they are lab descriptors they are not to be used when evaluating the data. Validation Qualifier is the 3rd party formal validation qualifier if this was performed. Otherwise this field contains the qualifier resulting from the ADQM DVM review process. This qualifier assesses the usability of the data and may not equal the lab qualifier. The DVM applies the following data evaluation qualifiers to analysis results, as warranted:
Qualifier Definition B Not detected substantially above the level reported in the laboratory
or field blanks. R Unusable result. Analyte may or may not be present in the sample.
J Analyte present. Reported value may not be accurate or precise. UJ Not detected. Reporting limit may not be accurate or precise.
The Validation Status Code field is set to “DVM” if the ADQM DVM process has been performed. If the DVM has not been run, the field will be blank. If the DVM has been run (Validation Status Code equals “DVM”), use the Validation Qualifier.

DVM Narrative Report
Associated MS and/or MSD analysis had relative percent recovery (RPR) values less than the data rejection level. The reported non-detect result isunusable.
LABSTATSValidation Options:
Validation Reason
FayettevilleSite: Sampling Program: Regenesis Phase 1 Pilot Study
AnalyticalMethodAnalyte
DateSampled PQL
ValidationQualifierLab Sample ID Pre-prepMDLResult TypeField Sample ID PrepUnits
FAY-PS2019-Pretreat1-05072019
05/09/2019 320-50147-11 MMF 3.6 UG/L Cl. Spec. Table 3Compound SOP
R PFAS_DI_Prep3.6PQL
FAY-PS2019-Pretreat1-05072019
05/09/2019 320-50147-11 MMF 3.6 UG/L Cl. Spec. Table 3Compound SOP
R PFAS_DI_Prep3.6PQL
FAY-PS2019-Pretreat2-05072019
05/09/2019 320-50147-12 MMF 3.6 UG/L Cl. Spec. Table 3Compound SOP
R PFAS_DI_Prep3.6PQL
FAY-PS2019-Pretreat2-05072019
05/09/2019 320-50147-12 MMF 3.6 UG/L Cl. Spec. Table 3Compound SOP
R PFAS_DI_Prep3.6PQL
Page 1 of 29

Contamination detected in equipment blank(s). Sample result does not differ significantly from the analyte concentration detected in the associatedequipment blank(s).
LABSTATSValidation Options:
Validation Reason
FayettevilleSite: Sampling Program: Regenesis Phase 1 Pilot Study
AnalyticalMethodAnalyte
DateSampled PQL
ValidationQualifierLab Sample ID Pre-prepMDLResult TypeField Sample ID PrepUnits
GW0519-MW-31 05/03/2019 280-123591-20 Chloroform 1.6 UG/L 0.16 8260BB 5030B1.0MDL
GW0519-MW-33 05/02/2019 280-123591-18 Chloroform 1.7 UG/L 0.16 8260BB 5030B1.0MDL
GW0519-MW-33-Z 05/02/2019 280-123591-19 Dissolved OrganicCarbon
1200 UG/L 160 9060B1000MDL
GW0519-MW-34 05/02/2019 280-123591-1 Calcium 1.1 MG/L 0.078 6010DB 3005A0.2MDL
GW0519-MW-34 05/02/2019 280-123591-1 Chloroform 1.0 UG/L 0.16 8260BB 5030B1.0MDL
GW0519-MW-34-Z 05/02/2019 280-123591-2 Dissolved OrganicCarbon
1200 UG/L 160 9060B1000MDL
GW0519-MW-35 05/02/2019 280-123591-3 Chloroform 2.0 UG/L 0.16 8260BB 5030B1.0MDL
GW0519-MW-36 05/02/2019 280-123591-5 Chloroform 1.5 UG/L 0.16 8260BB 5030B1.0MDL
GW0519-MW-36-D 05/02/2019 280-123591-7 Chloroform 1.5 UG/L 0.16 8260BB 5030B1.0MDL
GW0519-PZ-32 05/03/2019 280-123591-14 Chloroform 2.0 UG/L 0.16 8260BB 5030B1.0MDL
GW0519-EQBLK-1-Z 05/02/2019 280-123591-10 Dissolved OrganicCarbon
260 UG/L 160 9060B1000MDL
GW0519-MW-32 05/03/2019 280-123591-16 Chloroform 0.19 UG/L 0.16 8260BB 5030B1.0MDL
Page 2 of 29

Contamination detected in Method Blank(s). Sample result does not differ significantly from the analyte concentration detected in the associated methodblank(s).
LABSTATSValidation Options:
Validation Reason
FayettevilleSite: Sampling Program: Regenesis Phase 1 Pilot Study
AnalyticalMethodAnalyte
DateSampled PQL
ValidationQualifierLab Sample ID Pre-prepMDLResult TypeField Sample ID PrepUnits
GW0519-MW-35 05/02/2019 280-123591-3 Carbon Disulfide 0.47 UG/L 0.17 8260BB 5030B2.0MDL
GW0519-MW-36 05/02/2019 280-123591-5 Carbon Disulfide 0.38 UG/L 0.17 8260BB 5030B2.0MDL
GW0519-MW-34 05/02/2019 280-123591-1 Carbon Disulfide 0.64 UG/L 0.17 8260BB 5030B2.0MDL
GW0519-MW-33 05/02/2019 280-123591-18 Carbon Disulfide 0.40 UG/L 0.17 8260BB 5030B2.0MDL
Page 3 of 29

The analysis hold time for this sample was exceeded. The reporting limit may be biased low.
LABSTATSValidation Options:
Validation Reason
FayettevilleSite: Sampling Program: Regenesis Phase 1 Pilot Study
AnalyticalMethodAnalyte
DateSampled PQL
ValidationQualifierLab Sample ID Pre-prepMDLResult TypeField Sample ID PrepUnits
GW0519-MW-36-D 05/02/2019 320-49940-7 PFECA B 0.060 UG/L Cl. Spec. Table 3Compound SOP
UJ PFAS_DI_Prep0.060PQL
GW0519-MW-36-D 05/02/2019 320-49940-7 PFECA B 0.060 UG/L Cl. Spec. Table 3Compound SOP
UJ PFAS_DI_Prep0.060PQL
GW0519-MW-36-D 05/02/2019 320-49940-7 2-(N-ethyl perfluoro-1-octanesulfonamido)-ethanol
0.060 ug/L Cl. Spec. Table 3Compound SOP
UJ PFAS_DI_Prep0.060PQL
GW0519-MW-36-D 05/02/2019 320-49940-7 2-(N-ethyl perfluoro-1-octanesulfonamido)-ethanol
0.060 ug/L Cl. Spec. Table 3Compound SOP
UJ PFAS_DI_Prep0.060PQL
GW0519-MW-36-D 05/02/2019 320-49940-7 2-(N-methyl perfluoro-1-octanesulfonamido)-ethanol
0.11 ug/L Cl. Spec. Table 3Compound SOP
UJ PFAS_DI_Prep0.11PQL
GW0519-MW-36-D 05/02/2019 320-49940-7 2-(N-methyl perfluoro-1-octanesulfonamido)-ethanol
0.11 ug/L Cl. Spec. Table 3Compound SOP
UJ PFAS_DI_Prep0.11PQL
GW0519-MW-36-D 05/02/2019 320-49940-7 N-methyl perfluoro-1-octanesulfonamide
0.035 ug/L Cl. Spec. Table 3Compound SOP
UJ PFAS_DI_Prep0.035PQL
GW0519-MW-36-D 05/02/2019 320-49940-7 N-methyl perfluoro-1-octanesulfonamide
0.035 ug/L Cl. Spec. Table 3Compound SOP
UJ PFAS_DI_Prep0.035PQL
GW0519-MW-36-D 05/02/2019 320-49940-7 PES 0.046 UG/L Cl. Spec. Table 3Compound SOP
UJ PFAS_DI_Prep0.046PQL
GW0519-MW-36-D 05/02/2019 320-49940-7 PES 0.046 UG/L Cl. Spec. Table 3Compound SOP
UJ PFAS_DI_Prep0.046PQL
GW0519-MW-36-D 05/02/2019 320-49940-7 N-ethylperfluoro-1-octanesulfonamide
0.037 UG/L Cl. Spec. Table 3Compound SOP
UJ PFAS_DI_Prep0.037PQL
GW0519-MW-36-D 05/02/2019 320-49940-7 N-ethylperfluoro-1-octanesulfonamide
0.037 UG/L Cl. Spec. Table 3Compound SOP
UJ PFAS_DI_Prep0.037PQL
GW0519-MW-36-D 05/02/2019 320-49940-7 PFECA-G 0.041 UG/L Cl. Spec. Table 3Compound SOP
UJ PFAS_DI_Prep0.041PQL
GW0519-MW-36-D 05/02/2019 320-49940-7 PFECA-G 0.041 UG/L Cl. Spec. Table 3Compound SOP
UJ PFAS_DI_Prep0.041PQL
GW0519-MW-36-D 05/02/2019 320-49940-7 EVE Acid 0.024 UG/L Cl. Spec. Table 3Compound SOP
UJ PFAS_DI_Prep0.024PQL
Page 4 of 29

The analysis hold time for this sample was exceeded. The reporting limit may be biased low.
LABSTATSValidation Options:
Validation Reason
FayettevilleSite: Sampling Program: Regenesis Phase 1 Pilot Study
AnalyticalMethodAnalyte
DateSampled PQL
ValidationQualifierLab Sample ID Pre-prepMDLResult TypeField Sample ID PrepUnits
GW0519-MW-36-D 05/02/2019 320-49940-7 EVE Acid 0.024 UG/L Cl. Spec. Table 3Compound SOP
UJ PFAS_DI_Prep0.024PQL
Page 5 of 29

Associated MS and/or MSD analysis had relative percent recovery (RPR) values less than the lower control limit. The actual detection limits may behigher than reported.
LABSTATSValidation Options:
Validation Reason
FayettevilleSite: Sampling Program: Regenesis Phase 1 Pilot Study
AnalyticalMethodAnalyte
DateSampled PQL
ValidationQualifierLab Sample ID Pre-prepMDLResult TypeField Sample ID PrepUnits
GW0519-MW-31 05/03/2019 320-49945-1 N-ethylperfluoro-1-octanesulfonamide
0.037 UG/L Cl. Spec. Table 3Compound SOP
UJ PFAS_DI_Prep0.037PQL
GW0519-MW-31 05/03/2019 320-49945-1 N-ethylperfluoro-1-octanesulfonamide
0.037 UG/L Cl. Spec. Table 3Compound SOP
UJ PFAS_DI_Prep0.037PQL
GW0519-MW-32 05/03/2019 320-49940-2 N-methyl perfluoro-1-octanesulfonamide
0.035 ug/L Cl. Spec. Table 3Compound SOP
UJ PFAS_DI_Prep0.035PQL
GW0519-MW-32 05/03/2019 320-49940-2 N-methyl perfluoro-1-octanesulfonamide
0.035 ug/L Cl. Spec. Table 3Compound SOP
UJ PFAS_DI_Prep0.035PQL
GW0519-EQBLK-1 05/02/2019 320-49940-8 N-ethylperfluoro-1-octanesulfonamide
0.037 UG/L Cl. Spec. Table 3Compound SOP
UJ PFAS_DI_Prep0.037PQL
GW0519-EQBLK-1 05/02/2019 320-49940-8 N-ethylperfluoro-1-octanesulfonamide
0.037 UG/L Cl. Spec. Table 3Compound SOP
UJ PFAS_DI_Prep0.037PQL
FAY-PS2019-Pretreat2-05072019
05/09/2019 320-50147-12 DFSA 3.1 UG/L Cl. Spec. Table 3Compound SOP
UJ PFAS_DI_Prep3.1PQL
FAY-PS2019-Pretreat2-05072019
05/09/2019 320-50147-12 DFSA 3.1 UG/L Cl. Spec. Table 3Compound SOP
UJ PFAS_DI_Prep3.1PQL
GW0519-MW-32 05/03/2019 320-49940-2 N-ethylperfluoro-1-octanesulfonamide
0.037 UG/L Cl. Spec. Table 3Compound SOP
UJ PFAS_DI_Prep0.037PQL
GW0519-MW-32 05/03/2019 320-49940-2 N-ethylperfluoro-1-octanesulfonamide
0.037 UG/L Cl. Spec. Table 3Compound SOP
UJ PFAS_DI_Prep0.037PQL
GW0519-MW-33 05/02/2019 320-49940-3 N-methyl perfluoro-1-octanesulfonamide
0.035 ug/L Cl. Spec. Table 3Compound SOP
UJ PFAS_DI_Prep0.035PQL
GW0519-MW-33 05/02/2019 320-49940-3 N-methyl perfluoro-1-octanesulfonamide
0.035 ug/L Cl. Spec. Table 3Compound SOP
UJ PFAS_DI_Prep0.035PQL
GW0519-MW-33 05/02/2019 320-49940-3 N-ethylperfluoro-1-octanesulfonamide
0.037 UG/L Cl. Spec. Table 3Compound SOP
UJ PFAS_DI_Prep0.037PQL
GW0519-MW-33 05/02/2019 320-49940-3 N-ethylperfluoro-1-octanesulfonamide
0.037 UG/L Cl. Spec. Table 3Compound SOP
UJ PFAS_DI_Prep0.037PQL
GW0519-MW-34 05/02/2019 320-49940-4 N-methyl perfluoro-1-octanesulfonamide
0.035 ug/L Cl. Spec. Table 3Compound SOP
UJ PFAS_DI_Prep0.035PQL
GW0519-MW-34 05/02/2019 320-49940-4 N-methyl perfluoro-1-octanesulfonamide
0.035 ug/L Cl. Spec. Table 3Compound SOP
UJ PFAS_DI_Prep0.035PQL
Page 6 of 29

Associated MS and/or MSD analysis had relative percent recovery (RPR) values less than the lower control limit. The actual detection limits may behigher than reported.
LABSTATSValidation Options:
Validation Reason
FayettevilleSite: Sampling Program: Regenesis Phase 1 Pilot Study
AnalyticalMethodAnalyte
DateSampled PQL
ValidationQualifierLab Sample ID Pre-prepMDLResult TypeField Sample ID PrepUnits
GW0519-MW-34 05/02/2019 320-49940-4 N-ethylperfluoro-1-octanesulfonamide
0.037 UG/L Cl. Spec. Table 3Compound SOP
UJ PFAS_DI_Prep0.037PQL
GW0519-MW-34 05/02/2019 320-49940-4 N-ethylperfluoro-1-octanesulfonamide
0.037 UG/L Cl. Spec. Table 3Compound SOP
UJ PFAS_DI_Prep0.037PQL
GW0519-MW-35 05/02/2019 320-49940-5 N-methyl perfluoro-1-octanesulfonamide
0.035 ug/L Cl. Spec. Table 3Compound SOP
UJ PFAS_DI_Prep0.035PQL
GW0519-MW-35 05/02/2019 320-49940-5 N-methyl perfluoro-1-octanesulfonamide
0.035 ug/L Cl. Spec. Table 3Compound SOP
UJ PFAS_DI_Prep0.035PQL
GW0519-MW-35 05/02/2019 320-49940-5 N-ethylperfluoro-1-octanesulfonamide
0.037 UG/L Cl. Spec. Table 3Compound SOP
UJ PFAS_DI_Prep0.037PQL
GW0519-MW-35 05/02/2019 320-49940-5 N-ethylperfluoro-1-octanesulfonamide
0.037 UG/L Cl. Spec. Table 3Compound SOP
UJ PFAS_DI_Prep0.037PQL
GW0519-MW-36 05/02/2019 320-49940-6 N-ethylperfluoro-1-octanesulfonamide
0.037 UG/L Cl. Spec. Table 3Compound SOP
UJ PFAS_DI_Prep0.037PQL
GW0519-MW-36 05/02/2019 320-49940-6 N-ethylperfluoro-1-octanesulfonamide
0.037 UG/L Cl. Spec. Table 3Compound SOP
UJ PFAS_DI_Prep0.037PQL
GW0519-PZ-32 05/03/2019 320-49940-1 N-methyl perfluoro-1-octanesulfonamide
0.035 ug/L Cl. Spec. Table 3Compound SOP
UJ PFAS_DI_Prep0.035PQL
GW0519-PZ-32 05/03/2019 320-49940-1 N-methyl perfluoro-1-octanesulfonamide
0.035 ug/L Cl. Spec. Table 3Compound SOP
UJ PFAS_DI_Prep0.035PQL
GW0519-PZ-32 05/03/2019 320-49940-1 N-ethylperfluoro-1-octanesulfonamide
0.037 UG/L Cl. Spec. Table 3Compound SOP
UJ PFAS_DI_Prep0.037PQL
GW0519-PZ-32 05/03/2019 320-49940-1 N-ethylperfluoro-1-octanesulfonamide
0.037 UG/L Cl. Spec. Table 3Compound SOP
UJ PFAS_DI_Prep0.037PQL
FAY-PS2019-Pretreat1-05072019
05/09/2019 320-50147-11 DFSA 3.1 UG/L Cl. Spec. Table 3Compound SOP
UJ PFAS_DI_Prep3.1PQL
FAY-PS2019-Pretreat1-05072019
05/09/2019 320-50147-11 DFSA 3.1 UG/L Cl. Spec. Table 3Compound SOP
UJ PFAS_DI_Prep3.1PQL
FAY-PS2019-Posttreat9-05072019
05/09/2019 320-50147-10 PMPA 0.57 UG/L Cl. Spec. Table 3Compound SOP
UJ PFAS_DI_Prep0.57PQL
FAY-PS2019-Posttreat9-05072019
05/09/2019 320-50147-10 PMPA 0.57 UG/L Cl. Spec. Table 3Compound SOP
UJ PFAS_DI_Prep0.57PQL
FAY-PS2019-Posttreat9-05072019
05/09/2019 320-50147-10 MMF 3.6 UG/L Cl. Spec. Table 3Compound
UJ PFAS_DI_Prep3.6PQL
Page 7 of 29

Associated MS and/or MSD analysis had relative percent recovery (RPR) values less than the lower control limit. The actual detection limits may behigher than reported.
LABSTATSValidation Options:
Validation Reason
FayettevilleSite: Sampling Program: Regenesis Phase 1 Pilot Study
AnalyticalMethodAnalyte
DateSampled PQL
ValidationQualifierLab Sample ID Pre-prepMDLResult TypeField Sample ID PrepUnits
SOP
FAY-PS2019-Posttreat9-05072019
05/09/2019 320-50147-10 MMF 3.6 UG/L Cl. Spec. Table 3Compound SOP
UJ PFAS_DI_Prep3.6PQL
FAY-PS2019-Posttreat5-05072019
05/09/2019 320-50147-6 MMF 3.6 UG/L Cl. Spec. Table 3Compound SOP
UJ PFAS_DI_Prep3.6PQL
FAY-PS2019-Posttreat5-05072019
05/09/2019 320-50147-6 MMF 3.6 UG/L Cl. Spec. Table 3Compound SOP
UJ PFAS_DI_Prep3.6PQL
FAY-PS2019-Posttreat6-05072019
05/09/2019 320-50147-7 MMF 3.6 UG/L Cl. Spec. Table 3Compound SOP
UJ PFAS_DI_Prep3.6PQL
FAY-PS2019-Posttreat6-05072019
05/09/2019 320-50147-7 MMF 3.6 UG/L Cl. Spec. Table 3Compound SOP
UJ PFAS_DI_Prep3.6PQL
FAY-PS2019-Posttreat7-05072019
05/09/2019 320-50147-8 MMF 3.6 UG/L Cl. Spec. Table 3Compound SOP
UJ PFAS_DI_Prep3.6PQL
FAY-PS2019-Posttreat7-05072019
05/09/2019 320-50147-8 MMF 3.6 UG/L Cl. Spec. Table 3Compound SOP
UJ PFAS_DI_Prep3.6PQL
FAY-PS2019-Posttreat8-05072019
05/09/2019 320-50147-9 MMF 3.6 UG/L Cl. Spec. Table 3Compound SOP
UJ PFAS_DI_Prep3.6PQL
FAY-PS2019-Posttreat8-05072019
05/09/2019 320-50147-9 MMF 3.6 UG/L Cl. Spec. Table 3Compound SOP
UJ PFAS_DI_Prep3.6PQL
FAY-PS2019-Posttreat1-05072019
05/09/2019 320-50147-2 MMF 3.6 UG/L Cl. Spec. Table 3Compound SOP
UJ PFAS_DI_Prep3.6PQL
FAY-PS2019-Posttreat1-05072019
05/09/2019 320-50147-2 MMF 3.6 UG/L Cl. Spec. Table 3Compound SOP
UJ PFAS_DI_Prep3.6PQL
FAY-PS2019-Posttreat1-05072019
05/09/2019 320-50147-2 DFSA 3.1 UG/L Cl. Spec. Table 3Compound SOP
UJ PFAS_DI_Prep3.1PQL
FAY-PS2019-Posttreat1-05072019
05/09/2019 320-50147-2 DFSA 3.1 UG/L Cl. Spec. Table 3Compound SOP
UJ PFAS_DI_Prep3.1PQL
FAY-PS2019-Posttreat10-0725201
05/14/2019 320-52699-1 R-EVE 0.0020 UG/L Cl. Spec. Table 3Compound SOP
UJ PFAS_DI_Prep0.0020PQL
FAY-PS2019-Posttreat2-05072019
05/09/2019 320-50147-3 MMF 3.6 UG/L Cl. Spec. Table 3Compound SOP
UJ PFAS_DI_Prep3.6PQL
FAY-PS2019-Posttreat2-05072019
05/09/2019 320-50147-3 MMF 3.6 UG/L Cl. Spec. Table 3Compound SOP
UJ PFAS_DI_Prep3.6PQL
Page 8 of 29

Associated MS and/or MSD analysis had relative percent recovery (RPR) values less than the lower control limit. The actual detection limits may behigher than reported.
LABSTATSValidation Options:
Validation Reason
FayettevilleSite: Sampling Program: Regenesis Phase 1 Pilot Study
AnalyticalMethodAnalyte
DateSampled PQL
ValidationQualifierLab Sample ID Pre-prepMDLResult TypeField Sample ID PrepUnits
FAY-PS2019-Posttreat3-05072019
05/09/2019 320-50147-4 MMF 3.6 UG/L Cl. Spec. Table 3Compound SOP
UJ PFAS_DI_Prep3.6PQL
FAY-PS2019-Posttreat3-05072019
05/09/2019 320-50147-4 MMF 3.6 UG/L Cl. Spec. Table 3Compound SOP
UJ PFAS_DI_Prep3.6PQL
FAY-PS2019-Posttreat4-05072019
05/09/2019 320-50147-5 MMF 3.6 UG/L Cl. Spec. Table 3Compound SOP
UJ PFAS_DI_Prep3.6PQL
FAY-PS2019-Posttreat4-05072019
05/09/2019 320-50147-5 MMF 3.6 UG/L Cl. Spec. Table 3Compound SOP
UJ PFAS_DI_Prep3.6PQL
Page 9 of 29

The analysis hold time for this sample was exceeded by a factor of 2. The reported non-detect result is consid-ered to be an estimated value.
LABSTATSValidation Options:
Validation Reason
FayettevilleSite: Sampling Program: Regenesis Phase 1 Pilot Study
AnalyticalMethodAnalyte
DateSampled PQL
ValidationQualifierLab Sample ID Pre-prepMDLResult TypeField Sample ID PrepUnits
FAY-PS2019-Posttreat10-0725201
05/14/2019 320-52699-1 NVHOS 0.0020 UG/L Cl. Spec. Table 3Compound SOP
UJ PFAS_DI_Prep0.0020PQL
FAY-PS2019-Posttreat10-0725201
05/14/2019 320-52699-1 NVHOS 0.0020 UG/L Cl. Spec. Table 3Compound SOP
UJ PFAS_DI_Prep0.0020PQL
FAY-PS2019-Posttreat10-0725201
05/14/2019 320-52699-1 PES 0.0020 UG/L Cl. Spec. Table 3Compound SOP
UJ PFAS_DI_Prep0.0020PQL
FAY-PS2019-Posttreat10-0725201
05/14/2019 320-52699-1 PES 0.0020 UG/L Cl. Spec. Table 3Compound SOP
UJ PFAS_DI_Prep0.0020PQL
FAY-PS2019-Posttreat10-0725201
05/14/2019 320-52699-1 PFECA B 0.0020 UG/L Cl. Spec. Table 3Compound SOP
UJ PFAS_DI_Prep0.0020PQL
FAY-PS2019-Posttreat10-0725201
05/14/2019 320-52699-1 PFECA B 0.0020 UG/L Cl. Spec. Table 3Compound SOP
UJ PFAS_DI_Prep0.0020PQL
FAY-PS2019-Posttreat10-0725201
05/14/2019 320-52699-1 2-(N-ethyl perfluoro-1-octanesulfonamido)-ethanol
0.0020 ug/L Cl. Spec. Table 3Compound SOP
UJ PFAS_DI_Prep0.0020PQL
FAY-PS2019-Posttreat10-0725201
05/14/2019 320-52699-1 2-(N-ethyl perfluoro-1-octanesulfonamido)-ethanol
0.0020 ug/L Cl. Spec. Table 3Compound SOP
UJ PFAS_DI_Prep0.0020PQL
FAY-PS2019-Posttreat10-0725201
05/14/2019 320-52699-1 2-(N-methyl perfluoro-1-octanesulfonamido)-ethanol
0.0020 ug/L Cl. Spec. Table 3Compound SOP
UJ PFAS_DI_Prep0.0020PQL
FAY-PS2019-Posttreat10-0725201
05/14/2019 320-52699-1 2-(N-methyl perfluoro-1-octanesulfonamido)-ethanol
0.0020 ug/L Cl. Spec. Table 3Compound SOP
UJ PFAS_DI_Prep0.0020PQL
FAY-PS2019-Posttreat10-0725201
05/14/2019 320-52699-1 PEPA 0.020 UG/L Cl. Spec. Table 3Compound SOP
UJ PFAS_DI_Prep0.020PQL
FAY-PS2019-Posttreat10-0725201
05/14/2019 320-52699-1 PEPA 0.020 UG/L Cl. Spec. Table 3Compound SOP
UJ PFAS_DI_Prep0.020PQL
FAY-PS2019-Posttreat10-0725201
05/14/2019 320-52699-1 PFESA-BP1 0.0020 UG/L Cl. Spec. Table 3Compound SOP
UJ PFAS_DI_Prep0.0020PQL
FAY-PS2019-Posttreat10-0725201
05/14/2019 320-52699-1 PFESA-BP1 0.0020 UG/L Cl. Spec. Table 3Compound SOP
UJ PFAS_DI_Prep0.0020PQL
FAY-PS2019-Posttreat10-0725201
05/14/2019 320-52699-1 N-methyl perfluoro-1-octanesulfonamide
0.0020 ug/L Cl. Spec. Table 3Compound SOP
UJ PFAS_DI_Prep0.0020PQL
Page 10 of 29

The analysis hold time for this sample was exceeded by a factor of 2. The reported non-detect result is consid-ered to be an estimated value.
LABSTATSValidation Options:
Validation Reason
FayettevilleSite: Sampling Program: Regenesis Phase 1 Pilot Study
AnalyticalMethodAnalyte
DateSampled PQL
ValidationQualifierLab Sample ID Pre-prepMDLResult TypeField Sample ID PrepUnits
FAY-PS2019-Posttreat10-0725201
05/14/2019 320-52699-1 N-methyl perfluoro-1-octanesulfonamide
0.0020 ug/L Cl. Spec. Table 3Compound SOP
UJ PFAS_DI_Prep0.0020PQL
FAY-PS2019-Posttreat10-0725201
05/14/2019 320-52699-1 PFO2HxA 0.0020 ug/L Cl. Spec. Table 3Compound SOP
UJ PFAS_DI_Prep0.0020PQL
FAY-PS2019-Posttreat10-0725201
05/14/2019 320-52699-1 PFO2HxA 0.0020 ug/L Cl. Spec. Table 3Compound SOP
UJ PFAS_DI_Prep0.0020PQL
FAY-PS2019-Posttreat10-0725201
05/14/2019 320-52699-1 PFO3OA 0.0020 ug/L Cl. Spec. Table 3Compound SOP
UJ PFAS_DI_Prep0.0020PQL
FAY-PS2019-Posttreat10-0725201
05/14/2019 320-52699-1 PFO3OA 0.0020 ug/L Cl. Spec. Table 3Compound SOP
UJ PFAS_DI_Prep0.0020PQL
FAY-PS2019-Posttreat10-0725201
05/14/2019 320-52699-1 PFO4DA 0.0020 ug/L Cl. Spec. Table 3Compound SOP
UJ PFAS_DI_Prep0.0020PQL
FAY-PS2019-Posttreat10-0725201
05/14/2019 320-52699-1 PFO4DA 0.0020 ug/L Cl. Spec. Table 3Compound SOP
UJ PFAS_DI_Prep0.0020PQL
FAY-PS2019-Posttreat10-0725201
05/14/2019 320-52699-1 PFO5DA 0.0020 ug/L Cl. Spec. Table 3Compound SOP
UJ PFAS_DI_Prep0.0020PQL
FAY-PS2019-Posttreat10-0725201
05/14/2019 320-52699-1 PFO5DA 0.0020 ug/L Cl. Spec. Table 3Compound SOP
UJ PFAS_DI_Prep0.0020PQL
FAY-PS2019-Posttreat10-0725201
05/14/2019 320-52699-1 N-ethylperfluoro-1-octanesulfonamide
0.0020 UG/L Cl. Spec. Table 3Compound SOP
UJ PFAS_DI_Prep0.0020PQL
FAY-PS2019-Posttreat10-0725201
05/14/2019 320-52699-1 N-ethylperfluoro-1-octanesulfonamide
0.0020 UG/L Cl. Spec. Table 3Compound SOP
UJ PFAS_DI_Prep0.0020PQL
FAY-PS2019-Posttreat10-0725201
05/14/2019 320-52699-1 EVE Acid 0.0020 UG/L Cl. Spec. Table 3Compound SOP
UJ PFAS_DI_Prep0.0020PQL
FAY-PS2019-Posttreat10-0725201
05/14/2019 320-52699-1 EVE Acid 0.0020 UG/L Cl. Spec. Table 3Compound SOP
UJ PFAS_DI_Prep0.0020PQL
FAY-PS2019-Posttreat10-0725201
05/14/2019 320-52699-1 PFESA-BP2 0.0020 ug/L Cl. Spec. Table 3Compound SOP
UJ PFAS_DI_Prep0.0020PQL
FAY-PS2019-Posttreat10-0725201
05/14/2019 320-52699-1 PFESA-BP2 0.0020 ug/L Cl. Spec. Table 3Compound SOP
UJ PFAS_DI_Prep0.0020PQL
FAY-PS2019-Posttreat10-0725201
05/14/2019 320-52699-1 Hydro-EVE Acid 0.0020 UG/L Cl. Spec. Table 3Compound SOP
UJ PFAS_DI_Prep0.0020PQL
FAY-PS2019-Posttreat10-0725201
05/14/2019 320-52699-1 Hydro-EVE Acid 0.0020 UG/L Cl. Spec. Table 3Compound SOP
UJ PFAS_DI_Prep0.0020PQL
Page 11 of 29

The analysis hold time for this sample was exceeded by a factor of 2. The reported non-detect result is consid-ered to be an estimated value.
LABSTATSValidation Options:
Validation Reason
FayettevilleSite: Sampling Program: Regenesis Phase 1 Pilot Study
AnalyticalMethodAnalyte
DateSampled PQL
ValidationQualifierLab Sample ID Pre-prepMDLResult TypeField Sample ID PrepUnits
FAY-PS2019-Posttreat10-0725201
05/14/2019 320-52699-1 PFECA-G 0.0020 UG/L Cl. Spec. Table 3Compound SOP
UJ PFAS_DI_Prep0.0020PQL
FAY-PS2019-Posttreat10-0725201
05/14/2019 320-52699-1 PFECA-G 0.0020 UG/L Cl. Spec. Table 3Compound SOP
UJ PFAS_DI_Prep0.0020PQL
FAY-PS2019-Posttreat10-0725201
05/14/2019 320-52699-1 R-EVE 0.0020 UG/L Cl. Spec. Table 3Compound SOP
UJ PFAS_DI_Prep0.0020PQL
FAY-PS2019-Posttreat10-0725201
05/14/2019 320-52699-1 Byproduct 4 0.0020 UG/L Cl. Spec. Table 3Compound SOP
UJ PFAS_DI_Prep0.0020PQL
FAY-PS2019-Posttreat10-0725201
05/14/2019 320-52699-1 Byproduct 4 0.0020 UG/L Cl. Spec. Table 3Compound SOP
UJ PFAS_DI_Prep0.0020PQL
FAY-PS2019-Posttreat10-0725201
05/14/2019 320-52699-1 Byproduct 5 0.0020 UG/L Cl. Spec. Table 3Compound SOP
UJ PFAS_DI_Prep0.0020PQL
FAY-PS2019-Posttreat10-0725201
05/14/2019 320-52699-1 Byproduct 5 0.0020 UG/L Cl. Spec. Table 3Compound SOP
UJ PFAS_DI_Prep0.0020PQL
FAY-PS2019-Posttreat10-0725201
05/14/2019 320-52699-1 Byproduct 6 0.0020 UG/L Cl. Spec. Table 3Compound SOP
UJ PFAS_DI_Prep0.0020PQL
FAY-PS2019-Posttreat10-0725201
05/14/2019 320-52699-1 Byproduct 6 0.0020 UG/L Cl. Spec. Table 3Compound SOP
UJ PFAS_DI_Prep0.0020PQL
Page 12 of 29

Associated MS and/or MSD analysis had relative percent recovery (RPR) values less than the data rejection level. The reported non-detect result is considered to be an estimated value.
LABSTATSValidation Options:
Validation Reason
FayettevilleSite: Sampling Program: Regenesis Phase 1 Pilot Study
AnalyticalMethodAnalyte
DateSampled PQL
ValidationQualifierLab Sample ID Pre-prepMDLResult TypeField Sample ID PrepUnits
FAY-PS2019-Posttreat9-05072019
05/09/2019 320-50147-10 MTP 0.12 UG/L Cl. Spec. Table 3Compound SOP
UJ PFAS_DI_Prep0.12PQL
FAY-PS2019-Posttreat9-05072019
05/09/2019 320-50147-10 MTP 0.12 UG/L Cl. Spec. Table 3Compound SOP
UJ PFAS_DI_Prep0.12PQL
FAY-PS2019-Pretreat2-05072019
05/09/2019 320-50147-12 MTP 0.12 UG/L Cl. Spec. Table 3Compound SOP
UJ PFAS_DI_Prep0.12PQL
FAY-PS2019-Pretreat2-05072019
05/09/2019 320-50147-12 MTP 0.12 UG/L Cl. Spec. Table 3Compound SOP
UJ PFAS_DI_Prep0.12PQL
FAY-PS2019-Pretreat1-05072019
05/09/2019 320-50147-11 MTP 0.12 UG/L Cl. Spec. Table 3Compound SOP
UJ PFAS_DI_Prep0.12PQL
FAY-PS2019-Pretreat1-05072019
05/09/2019 320-50147-11 MTP 0.12 UG/L Cl. Spec. Table 3Compound SOP
UJ PFAS_DI_Prep0.12PQL
FAY-PS2019-Posttreat8-05072019
05/09/2019 320-50147-9 MTP 0.12 UG/L Cl. Spec. Table 3Compound SOP
UJ PFAS_DI_Prep0.12PQL
FAY-PS2019-Posttreat8-05072019
05/09/2019 320-50147-9 MTP 0.12 UG/L Cl. Spec. Table 3Compound SOP
UJ PFAS_DI_Prep0.12PQL
FAY-PS2019-Posttreat9-05072019
05/09/2019 320-50147-10 PPF Acid 0.38 UG/L Cl. Spec. Table 3Compound SOP
UJ PFAS_DI_Prep0.38PQL
FAY-PS2019-Posttreat9-05072019
05/09/2019 320-50147-10 PPF Acid 0.38 UG/L Cl. Spec. Table 3Compound SOP
UJ PFAS_DI_Prep0.38PQL
FAY-PS2019-Posttreat4-05072019
05/09/2019 320-50147-5 MTP 0.12 UG/L Cl. Spec. Table 3Compound SOP
UJ PFAS_DI_Prep0.12PQL
FAY-PS2019-Posttreat4-05072019
05/09/2019 320-50147-5 MTP 0.12 UG/L Cl. Spec. Table 3Compound SOP
UJ PFAS_DI_Prep0.12PQL
FAY-PS2019-Posttreat5-05072019
05/09/2019 320-50147-6 PPF Acid 0.38 UG/L Cl. Spec. Table 3Compound SOP
UJ PFAS_DI_Prep0.38PQL
FAY-PS2019-Posttreat5-05072019
05/09/2019 320-50147-6 PPF Acid 0.38 UG/L Cl. Spec. Table 3Compound SOP
UJ PFAS_DI_Prep0.38PQL
FAY-PS2019-Posttreat5-05072019
05/09/2019 320-50147-6 MTP 0.12 UG/L Cl. Spec. Table 3Compound SOP
UJ PFAS_DI_Prep0.12PQL
FAY-PS2019-Posttreat5-05072019
05/09/2019 320-50147-6 MTP 0.12 UG/L Cl. Spec. Table 3Compound SOP
UJ PFAS_DI_Prep0.12PQL
Page 13 of 29

Associated MS and/or MSD analysis had relative percent recovery (RPR) values less than the data rejection level. The reported non-detect result is considered to be an estimated value.
LABSTATSValidation Options:
Validation Reason
FayettevilleSite: Sampling Program: Regenesis Phase 1 Pilot Study
AnalyticalMethodAnalyte
DateSampled PQL
ValidationQualifierLab Sample ID Pre-prepMDLResult TypeField Sample ID PrepUnits
FAY-PS2019-Posttreat6-05072019
05/09/2019 320-50147-7 PPF Acid 0.38 UG/L Cl. Spec. Table 3Compound SOP
UJ PFAS_DI_Prep0.38PQL
FAY-PS2019-Posttreat6-05072019
05/09/2019 320-50147-7 PPF Acid 0.38 UG/L Cl. Spec. Table 3Compound SOP
UJ PFAS_DI_Prep0.38PQL
FAY-PS2019-Posttreat6-05072019
05/09/2019 320-50147-7 MTP 0.12 UG/L Cl. Spec. Table 3Compound SOP
UJ PFAS_DI_Prep0.12PQL
FAY-PS2019-Posttreat6-05072019
05/09/2019 320-50147-7 MTP 0.12 UG/L Cl. Spec. Table 3Compound SOP
UJ PFAS_DI_Prep0.12PQL
FAY-PS2019-Posttreat7-05072019
05/09/2019 320-50147-8 PPF Acid 0.38 UG/L Cl. Spec. Table 3Compound SOP
UJ PFAS_DI_Prep0.38PQL
FAY-PS2019-Posttreat7-05072019
05/09/2019 320-50147-8 PPF Acid 0.38 UG/L Cl. Spec. Table 3Compound SOP
UJ PFAS_DI_Prep0.38PQL
FAY-PS2019-Posttreat7-05072019
05/09/2019 320-50147-8 MTP 0.12 UG/L Cl. Spec. Table 3Compound SOP
UJ PFAS_DI_Prep0.12PQL
FAY-PS2019-Posttreat7-05072019
05/09/2019 320-50147-8 MTP 0.12 UG/L Cl. Spec. Table 3Compound SOP
UJ PFAS_DI_Prep0.12PQL
FAY-PS2019-Posttreat8-05072019
05/09/2019 320-50147-9 PPF Acid 0.38 UG/L Cl. Spec. Table 3Compound SOP
UJ PFAS_DI_Prep0.38PQL
FAY-PS2019-Posttreat8-05072019
05/09/2019 320-50147-9 PPF Acid 0.38 UG/L Cl. Spec. Table 3Compound SOP
UJ PFAS_DI_Prep0.38PQL
FAY-PS2019-Posttreat1-05072019
05/09/2019 320-50147-2 PPF Acid 0.38 UG/L Cl. Spec. Table 3Compound SOP
UJ PFAS_DI_Prep0.38PQL
FAY-PS2019-Posttreat1-05072019
05/09/2019 320-50147-2 PPF Acid 0.38 UG/L Cl. Spec. Table 3Compound SOP
UJ PFAS_DI_Prep0.38PQL
FAY-PS2019-Posttreat1-05072019
05/09/2019 320-50147-2 MTP 0.12 UG/L Cl. Spec. Table 3Compound SOP
UJ PFAS_DI_Prep0.12PQL
FAY-PS2019-Posttreat1-05072019
05/09/2019 320-50147-2 MTP 0.12 UG/L Cl. Spec. Table 3Compound SOP
UJ PFAS_DI_Prep0.12PQL
FAY-PS2019-Posttreat2-05072019
05/09/2019 320-50147-3 PPF Acid 0.38 UG/L Cl. Spec. Table 3Compound SOP
UJ PFAS_DI_Prep0.38PQL
FAY-PS2019-Posttreat2-05072019
05/09/2019 320-50147-3 PPF Acid 0.38 UG/L Cl. Spec. Table 3Compound SOP
UJ PFAS_DI_Prep0.38PQL
FAY-PS2019-Posttreat2-05072019
05/09/2019 320-50147-3 MTP 0.12 UG/L Cl. Spec. Table 3Compound
UJ PFAS_DI_Prep0.12PQL
Page 14 of 29

Associated MS and/or MSD analysis had relative percent recovery (RPR) values less than the data rejection level. The reported non-detect result is considered to be an estimated value.
LABSTATSValidation Options:
Validation Reason
FayettevilleSite: Sampling Program: Regenesis Phase 1 Pilot Study
AnalyticalMethodAnalyte
DateSampled PQL
ValidationQualifierLab Sample ID Pre-prepMDLResult TypeField Sample ID PrepUnits
SOP
FAY-PS2019-Posttreat2-05072019
05/09/2019 320-50147-3 MTP 0.12 UG/L Cl. Spec. Table 3Compound SOP
UJ PFAS_DI_Prep0.12PQL
FAY-PS2019-Posttreat3-05072019
05/09/2019 320-50147-4 PPF Acid 0.38 UG/L Cl. Spec. Table 3Compound SOP
UJ PFAS_DI_Prep0.38PQL
FAY-PS2019-Posttreat3-05072019
05/09/2019 320-50147-4 PPF Acid 0.38 UG/L Cl. Spec. Table 3Compound SOP
UJ PFAS_DI_Prep0.38PQL
FAY-PS2019-Posttreat3-05072019
05/09/2019 320-50147-4 MTP 0.12 UG/L Cl. Spec. Table 3Compound SOP
UJ PFAS_DI_Prep0.12PQL
FAY-PS2019-Posttreat3-05072019
05/09/2019 320-50147-4 MTP 0.12 UG/L Cl. Spec. Table 3Compound SOP
UJ PFAS_DI_Prep0.12PQL
FAY-PS2019-Posttreat4-05072019
05/09/2019 320-50147-5 PPF Acid 0.38 UG/L Cl. Spec. Table 3Compound SOP
UJ PFAS_DI_Prep0.38PQL
FAY-PS2019-Posttreat4-05072019
05/09/2019 320-50147-5 PPF Acid 0.38 UG/L Cl. Spec. Table 3Compound SOP
UJ PFAS_DI_Prep0.38PQL
Page 15 of 29

Associated MS and/or MSD analysis had relative percent recovery (RPR) values higher than the upper control limit. The reported result may be biasedhigh.
LABSTATSValidation Options:
Validation Reason
FayettevilleSite: Sampling Program: Regenesis Phase 1 Pilot Study
AnalyticalMethodAnalyte
DateSampled PQL
ValidationQualifierLab Sample ID Pre-prepMDLResult TypeField Sample ID PrepUnits
FAY-PS2019-Pretreat1-05072019
05/09/2019 320-50147-11 Byproduct 5 1.4 UG/L Cl. Spec. Table 3Compound SOP
J PFAS_DI_Prep0.058PQL
FAY-PS2019-Pretreat1-05072019
05/09/2019 320-50147-11 Byproduct 5 1.2 UG/L Cl. Spec. Table 3Compound SOP
J PFAS_DI_Prep0.058PQL
GW0519-MW-36-D 05/02/2019 320-49940-7 MMF 3.6 UG/L Cl. Spec. Table 3Compound SOP
J PFAS_DI_Prep3.6PQL
GW0519-MW-36-D 05/02/2019 320-49940-7 MMF 7.6 UG/L Cl. Spec. Table 3Compound SOP
J PFAS_DI_Prep3.6PQL
GW0519-MW-36 05/02/2019 320-49940-6 DFSA 91 UG/L Cl. Spec. Table 3Compound SOP
J PFAS_DI_Prep3.1PQL
GW0519-MW-36 05/02/2019 320-49940-6 Byproduct 5 1.4 UG/L Cl. Spec. Table 3Compound SOP
J PFAS_DI_Prep0.058PQL
GW0519-MW-36 05/02/2019 320-49940-6 Byproduct 5 1.3 UG/L Cl. Spec. Table 3Compound SOP
J PFAS_DI_Prep0.058PQL
GW0519-MW-35 05/02/2019 320-49940-5 Byproduct 5 1.1 UG/L Cl. Spec. Table 3Compound SOP
J PFAS_DI_Prep0.058PQL
GW0519-MW-35 05/02/2019 320-49940-5 Byproduct 5 1.1 UG/L Cl. Spec. Table 3Compound SOP
J PFAS_DI_Prep0.058PQL
GW0519-MW-36 05/02/2019 320-49940-6 MMF 3.6 UG/L Cl. Spec. Table 3Compound SOP
J PFAS_DI_Prep3.6PQL
GW0519-MW-36 05/02/2019 320-49940-6 MMF 5.8 UG/L Cl. Spec. Table 3Compound SOP
J PFAS_DI_Prep3.6PQL
GW0519-MW-35 05/02/2019 320-49940-5 MMF 3.6 UG/L Cl. Spec. Table 3Compound SOP
J PFAS_DI_Prep3.6PQL
GW0519-MW-34 05/02/2019 320-49940-4 Byproduct 5 0.92 UG/L Cl. Spec. Table 3Compound SOP
J PFAS_DI_Prep0.058PQL
GW0519-MW-34 05/02/2019 320-49940-4 Byproduct 5 0.95 UG/L Cl. Spec. Table 3Compound SOP
J PFAS_DI_Prep0.058PQL
GW0519-MW-33 05/02/2019 320-49940-3 Byproduct 5 0.47 UG/L Cl. Spec. Table 3Compound SOP
J PFAS_DI_Prep0.058PQL
GW0519-MW-33 05/02/2019 320-49940-3 Byproduct 5 0.51 UG/L Cl. Spec. Table 3Compound SOP
J PFAS_DI_Prep0.058PQL
Page 16 of 29

Associated MS and/or MSD analysis had relative percent recovery (RPR) values higher than the upper control limit. The reported result may be biasedhigh.
LABSTATSValidation Options:
Validation Reason
FayettevilleSite: Sampling Program: Regenesis Phase 1 Pilot Study
AnalyticalMethodAnalyte
DateSampled PQL
ValidationQualifierLab Sample ID Pre-prepMDLResult TypeField Sample ID PrepUnits
GW0519-MW-32 05/03/2019 320-49940-2 MMF 3.6 UG/L Cl. Spec. Table 3Compound SOP
J PFAS_DI_Prep3.6PQL
FAY-PS2019-Pretreat2-05072019
05/09/2019 320-50147-12 Byproduct 5 1.4 UG/L Cl. Spec. Table 3Compound SOP
J PFAS_DI_Prep0.058PQL
FAY-PS2019-Pretreat2-05072019
05/09/2019 320-50147-12 Byproduct 5 1.4 UG/L Cl. Spec. Table 3Compound SOP
J PFAS_DI_Prep0.058PQL
GW0519-MW-32 05/03/2019 320-49940-2 Byproduct 5 1.5 UG/L Cl. Spec. Table 3Compound SOP
J PFAS_DI_Prep0.058PQL
GW0519-MW-32 05/03/2019 320-49940-2 Byproduct 5 1.6 UG/L Cl. Spec. Table 3Compound SOP
J PFAS_DI_Prep0.058PQL
GW0519-MW-33 05/02/2019 320-49940-3 MMF 3.6 UG/L Cl. Spec. Table 3Compound SOP
J PFAS_DI_Prep3.6PQL
GW0519-PZ-32 05/03/2019 320-49940-1 Byproduct 5 0.14 UG/L Cl. Spec. Table 3Compound SOP
J PFAS_DI_Prep0.058PQL
GW0519-PZ-32 05/03/2019 320-49940-1 Byproduct 5 0.13 UG/L Cl. Spec. Table 3Compound SOP
J PFAS_DI_Prep0.058PQL
GW0519-MW-36-D 05/02/2019 320-49940-7 PFMOAA 115 ug/L Cl. Spec. Table 3Compound SOP
J PFAS_DI_Prep0.21PQL
GW0519-MW-36-D 05/02/2019 320-49940-7 PFMOAA 110.0 ug/L Cl. Spec. Table 3Compound SOP
J PFAS_DI_Prep0.21PQL
Page 17 of 29

High relative percent difference (RPD) observed between field duplicate and parent sample. The reported result may be imprecise.
LABSTATSValidation Options:
Validation Reason
FayettevilleSite: Sampling Program: Regenesis Phase 1 Pilot Study
AnalyticalMethodAnalyte
DateSampled PQL
ValidationQualifierLab Sample ID Pre-prepMDLResult TypeField Sample ID PrepUnits
GW0519-MW-36-D 05/02/2019 320-49940-7 MTP 0.58 UG/L Cl. Spec. Table 3Compound SOP
J PFAS_DI_Prep0.12PQL
GW0519-MW-36-D 05/02/2019 320-49940-7 MTP 0.59 UG/L Cl. Spec. Table 3Compound SOP
J PFAS_DI_Prep0.12PQL
GW0519-MW-36-D 05/02/2019 320-49940-7 Byproduct 4 0.74 UG/L Cl. Spec. Table 3Compound SOP
J PFAS_DI_Prep0.16PQL
GW0519-MW-36-D 05/02/2019 320-49940-7 Byproduct 4 0.78 UG/L Cl. Spec. Table 3Compound SOP
J PFAS_DI_Prep0.16PQL
GW0519-MW-36-D 05/02/2019 320-49940-7 DFSA 110 UG/L Cl. Spec. Table 3Compound SOP
J PFAS_DI_Prep3.1PQL
GW0519-MW-36-D 05/02/2019 320-49940-7 DFSA 110.0 UG/L Cl. Spec. Table 3Compound SOP
J PFAS_DI_Prep3.1PQL
GW0519-MW-36-D 05/02/2019 280-123591-7 Total Hardness AsCaCO3
13 MG/L 0.30 2340 C-1997J3.0MDL
GW0519-MW-36-D 05/02/2019 320-49940-7 Hfpo Dimer Acid 6.1 UG/L 537 ModifiedJ 3535_PFC0.064PQL
GW0519-MW-36 05/02/2019 320-49940-6 DFSA 75.0 UG/L Cl. Spec. Table 3Compound SOP
J PFAS_DI_Prep3.1PQL
GW0519-MW-36 05/02/2019 280-123591-5 Total Hardness AsCaCO3
7.1 MG/L 0.30 2340 C-1997J3.0MDL
GW0519-MW-36 05/02/2019 320-49940-6 MTP 0.47 UG/L Cl. Spec. Table 3Compound SOP
J PFAS_DI_Prep0.12PQL
GW0519-MW-36 05/02/2019 320-49940-6 MTP 0.39 UG/L Cl. Spec. Table 3Compound SOP
J PFAS_DI_Prep0.12PQL
GW0519-MW-36 05/02/2019 320-49940-6 Byproduct 4 0.56 UG/L Cl. Spec. Table 3Compound SOP
J PFAS_DI_Prep0.16PQL
GW0519-MW-36 05/02/2019 320-49940-6 Byproduct 4 0.56 UG/L Cl. Spec. Table 3Compound SOP
J PFAS_DI_Prep0.16PQL
GW0519-MW-36 05/02/2019 320-49940-6 Hfpo Dimer Acid 4.7 UG/L 537 ModifiedJ 3535_PFC0.066PQL
Page 18 of 29

Quality review criteria exceeded between the REP (laboratory replicate) and parent sample. The reported result may be imprecise.
LABSTATSValidation Options:
Validation Reason
FayettevilleSite: Sampling Program: Regenesis Phase 1 Pilot Study
AnalyticalMethodAnalyte
DateSampled PQL
ValidationQualifierLab Sample ID Pre-prepMDLResult TypeField Sample ID PrepUnits
FAY-PS2019-Posttreat3-05072019
05/09/2019 320-50147-4 PFMOAA 1.8 ug/L Cl. Spec. Table 3Compound SOP
J PFAS_DI_Prep0.21PQL
FAY-PS2019-Posttreat5-05072019
05/09/2019 320-50147-6 PFMOAA 0.77 ug/L Cl. Spec. Table 3Compound SOP
J PFAS_DI_Prep0.21PQL
FAY-PS2019-Pretreat1-05072019
05/09/2019 320-50147-11 PFO3OA 6.4 ug/L Cl. Spec. Table 3Compound SOP
J PFAS_DI_Prep0.058PQL
FAY-PS2019-Pretreat1-05072019
05/09/2019 320-50147-11 PFO3OA 5.5 ug/L Cl. Spec. Table 3Compound SOP
J PFAS_DI_Prep0.058PQL
FAY-PS2019-Pretreat1-05072019
05/09/2019 320-50147-11 PFO4DA 1.7 ug/L Cl. Spec. Table 3Compound SOP
J PFAS_DI_Prep0.079PQL
FAY-PS2019-Pretreat1-05072019
05/09/2019 320-50147-11 PFO4DA 1.4 ug/L Cl. Spec. Table 3Compound SOP
J PFAS_DI_Prep0.079PQL
FAY-PS2019-Pretreat1-05072019
05/09/2019 320-50147-11 PFO5DA 0.50 ug/L Cl. Spec. Table 3Compound SOP
J PFAS_DI_Prep0.034PQL
FAY-PS2019-Pretreat1-05072019
05/09/2019 320-50147-11 PFO5DA 0.4 ug/L Cl. Spec. Table 3Compound SOP
J PFAS_DI_Prep0.034PQL
FAY-PS2019-Pretreat1-05072019
05/09/2019 320-50147-11 PFESA-BP2 0.90 ug/L Cl. Spec. Table 3Compound SOP
J PFAS_DI_Prep0.030PQL
FAY-PS2019-Pretreat1-05072019
05/09/2019 320-50147-11 PFESA-BP2 0.69 ug/L Cl. Spec. Table 3Compound SOP
J PFAS_DI_Prep0.030PQL
FAY-PS2019-Pretreat1-05072019
05/09/2019 320-50147-11 Hydro-EVE Acid 0.12 UG/L Cl. Spec. Table 3Compound SOP
J PFAS_DI_Prep0.028PQL
FAY-PS2019-Pretreat1-05072019
05/09/2019 320-50147-11 Hydro-EVE Acid 0.098 UG/L Cl. Spec. Table 3Compound SOP
J PFAS_DI_Prep0.028PQL
FAY-PS2019-Pretreat1-05072019
05/09/2019 320-50147-11 Byproduct 4 0.64 UG/L Cl. Spec. Table 3Compound SOP
J PFAS_DI_Prep0.16PQL
FAY-PS2019-Pretreat1-05072019
05/09/2019 320-50147-11 Byproduct 4 0.55 UG/L Cl. Spec. Table 3Compound SOP
J PFAS_DI_Prep0.16PQL
GW0519-MW-35 05/02/2019 320-49940-5 DFSA 29.0 UG/L Cl. Spec. Table 3Compound SOP
J PFAS_DI_Prep3.1PQL
GW0519-MW-35 05/02/2019 320-49940-5 MMF 9.0 UG/L Cl. Spec. Table 3Compound SOP
J PFAS_DI_Prep3.6PQL
GW0519-MW-33 05/02/2019 320-49940-3 DFSA 20.0 UG/L Cl. Spec. Table 3Compound SOP
J PFAS_DI_Prep3.1PQL
Page 19 of 29

Quality review criteria exceeded between the REP (laboratory replicate) and parent sample. The reported result may be imprecise.
LABSTATSValidation Options:
Validation Reason
FayettevilleSite: Sampling Program: Regenesis Phase 1 Pilot Study
AnalyticalMethodAnalyte
DateSampled PQL
ValidationQualifierLab Sample ID Pre-prepMDLResult TypeField Sample ID PrepUnits
GW0519-MW-32 05/03/2019 320-49940-2 DFSA 42.0 UG/L Cl. Spec. Table 3Compound SOP
J PFAS_DI_Prep3.1PQL
GW0519-MW-32 05/03/2019 320-49940-2 MMF 12.0 UG/L Cl. Spec. Table 3Compound SOP
J PFAS_DI_Prep3.6PQL
GW0519-MW-31 05/03/2019 320-49945-1 DFSA 15.0 UG/L Cl. Spec. Table 3Compound SOP
J PFAS_DI_Prep3.1PQL
GW0519-MW-33 05/02/2019 320-49940-3 MMF 8.0 UG/L Cl. Spec. Table 3Compound SOP
J PFAS_DI_Prep3.6PQL
Page 20 of 29

The analysis hold time for this sample was exceeded by a factor of 2. The reported result may be biased low.
LABSTATSValidation Options:
Validation Reason
FayettevilleSite: Sampling Program: Regenesis Phase 1 Pilot Study
AnalyticalMethodAnalyte
DateSampled PQL
ValidationQualifierLab Sample ID Pre-prepMDLResult TypeField Sample ID PrepUnits
FAY-PS2019-Posttreat10-0725201
05/14/2019 320-52699-1 PMPA 0.016 UG/L Cl. Spec. Table 3Compound SOP
J PFAS_DI_Prep0.010PQL
FAY-PS2019-Posttreat10-0725201
05/14/2019 320-52699-1 PMPA 0.017 UG/L Cl. Spec. Table 3Compound SOP
J PFAS_DI_Prep0.010PQL
Page 21 of 29

The analysis hold time for this sample was exceeded. The reported result may be biased low.
LABSTATSValidation Options:
Validation Reason
FayettevilleSite: Sampling Program: Regenesis Phase 1 Pilot Study
AnalyticalMethodAnalyte
DateSampled PQL
ValidationQualifierLab Sample ID Pre-prepMDLResult TypeField Sample ID PrepUnits
GW0519-MW-36-D 05/02/2019 320-49940-7 PFESA-BP2 0.54 ug/L Cl. Spec. Table 3Compound SOP
J PFAS_DI_Prep0.030PQL
GW0519-MW-36-D 05/02/2019 320-49940-7 PFESA-BP2 0.56 ug/L Cl. Spec. Table 3Compound SOP
J PFAS_DI_Prep0.030PQL
GW0519-MW-36-D 05/02/2019 320-49940-7 Hydro-EVE Acid 0.081 UG/L Cl. Spec. Table 3Compound SOP
J PFAS_DI_Prep0.028PQL
GW0519-MW-36-D 05/02/2019 320-49940-7 Hydro-EVE Acid 0.08 UG/L Cl. Spec. Table 3Compound SOP
J PFAS_DI_Prep0.028PQL
GW0519-MW-36-D 05/02/2019 320-49940-7 R-EVE 0.21 UG/L Cl. Spec. Table 3Compound SOP
J PFAS_DI_Prep0.070PQL
GW0519-MW-36-D 05/02/2019 320-49940-7 R-EVE 0.21 UG/L Cl. Spec. Table 3Compound SOP
J PFAS_DI_Prep0.070PQL
GW0519-MW-36-D 05/02/2019 320-49940-7 Byproduct 5 1.5 UG/L Cl. Spec. Table 3Compound SOP
J PFAS_DI_Prep0.058PQL
GW0519-MW-36-D 05/02/2019 320-49940-7 Byproduct 5 1.5 UG/L Cl. Spec. Table 3Compound SOP
J PFAS_DI_Prep0.058PQL
GW0519-MW-36-D 05/02/2019 320-49940-7 Byproduct 6 0.016 UG/L Cl. Spec. Table 3Compound SOP
J PFAS_DI_Prep0.015PQL
GW0519-MW-36-D 05/02/2019 320-49940-7 Byproduct 6 0.016 UG/L Cl. Spec. Table 3Compound SOP
J PFAS_DI_Prep0.015PQL
GW0519-MW-36-D 05/02/2019 320-49940-7 PPF Acid 24 UG/L Cl. Spec. Table 3Compound SOP
J PFAS_DI_Prep0.38PQL
GW0519-MW-36-D 05/02/2019 320-49940-7 PPF Acid 23.0 UG/L Cl. Spec. Table 3Compound SOP
J PFAS_DI_Prep0.38PQL
GW0519-MW-36-D 05/02/2019 320-49940-7 PMPA 6.8 UG/L Cl. Spec. Table 3Compound SOP
J PFAS_DI_Prep0.57PQL
GW0519-MW-36-D 05/02/2019 320-49940-7 PMPA 6.7 UG/L Cl. Spec. Table 3Compound SOP
J PFAS_DI_Prep0.57PQL
GW0519-MW-36-D 05/02/2019 320-49940-7 PFO2HxA 27 ug/L Cl. Spec. Table 3Compound SOP
J PFAS_DI_Prep0.081PQL
GW0519-MW-36-D 05/02/2019 320-49940-7 PFO2HxA 27.0 ug/L Cl. Spec. Table 3Compound SOP
J PFAS_DI_Prep0.081PQL
GW0519-MW-36-D 05/02/2019 320-49940-7 PFO3OA 6.1 ug/L Cl. Spec. Table 3Compound SOP
J PFAS_DI_Prep0.058PQL
Page 22 of 29

The analysis hold time for this sample was exceeded. The reported result may be biased low.
LABSTATSValidation Options:
Validation Reason
FayettevilleSite: Sampling Program: Regenesis Phase 1 Pilot Study
AnalyticalMethodAnalyte
DateSampled PQL
ValidationQualifierLab Sample ID Pre-prepMDLResult TypeField Sample ID PrepUnits
GW0519-MW-36-D 05/02/2019 320-49940-7 PFO3OA 6.2 ug/L Cl. Spec. Table 3Compound SOP
J PFAS_DI_Prep0.058PQL
GW0519-MW-36-D 05/02/2019 320-49940-7 PFO4DA 1.5 ug/L Cl. Spec. Table 3Compound SOP
J PFAS_DI_Prep0.079PQL
GW0519-MW-36-D 05/02/2019 320-49940-7 PFO4DA 1.4 ug/L Cl. Spec. Table 3Compound SOP
J PFAS_DI_Prep0.079PQL
GW0519-MW-36-D 05/02/2019 320-49940-7 PFO5DA 0.36 ug/L Cl. Spec. Table 3Compound SOP
J PFAS_DI_Prep0.034PQL
GW0519-MW-36-D 05/02/2019 320-49940-7 PFO5DA 0.37 ug/L Cl. Spec. Table 3Compound SOP
J PFAS_DI_Prep0.034PQL
GW0519-MW-36-D 05/02/2019 320-49940-7 PEPA 2.8 UG/L Cl. Spec. Table 3Compound SOP
J PFAS_DI_Prep0.047PQL
GW0519-MW-36-D 05/02/2019 320-49940-7 PEPA 2.7 UG/L Cl. Spec. Table 3Compound SOP
J PFAS_DI_Prep0.047PQL
GW0519-MW-36-D 05/02/2019 320-49940-7 PFESA-BP1 0.041 UG/L Cl. Spec. Table 3Compound SOP
J PFAS_DI_Prep0.027PQL
GW0519-MW-36-D 05/02/2019 320-49940-7 PFESA-BP1 0.041 UG/L Cl. Spec. Table 3Compound SOP
J PFAS_DI_Prep0.027PQL
GW0519-MW-36-D 05/02/2019 320-49940-7 NVHOS 1.5 UG/L Cl. Spec. Table 3Compound SOP
J PFAS_DI_Prep0.054PQL
GW0519-MW-36-D 05/02/2019 320-49940-7 NVHOS 1.5 UG/L Cl. Spec. Table 3Compound SOP
J PFAS_DI_Prep0.054PQL
Page 23 of 29

Associated MS and/or MSD analysis had relative percent recovery (RPR) values less than the lower control limit but above the rejection limit. Thereported result may be biased low.
LABSTATSValidation Options:
Validation Reason
FayettevilleSite: Sampling Program: Regenesis Phase 1 Pilot Study
AnalyticalMethodAnalyte
DateSampled PQL
ValidationQualifierLab Sample ID Pre-prepMDLResult TypeField Sample ID PrepUnits
FAY-PS2019-Posttreat4-05072019
05/09/2019 320-50147-5 DFSA 4.8 UG/L Cl. Spec. Table 3Compound SOP
J PFAS_DI_Prep3.1PQL
FAY-PS2019-Posttreat4-05072019
05/09/2019 320-50147-5 DFSA 4.6 UG/L Cl. Spec. Table 3Compound SOP
J PFAS_DI_Prep3.1PQL
FAY-PS2019-Posttreat4-05072019
05/09/2019 320-50147-5 PFMOAA 0.73 ug/L Cl. Spec. Table 3Compound SOP
J PFAS_DI_Prep0.21PQL
FAY-PS2019-Posttreat4-05072019
05/09/2019 320-50147-5 PFMOAA 0.77 ug/L Cl. Spec. Table 3Compound SOP
J PFAS_DI_Prep0.21PQL
FAY-PS2019-Posttreat3-05072019
05/09/2019 320-50147-4 DFSA 3.8 UG/L Cl. Spec. Table 3Compound SOP
J PFAS_DI_Prep3.1PQL
FAY-PS2019-Posttreat3-05072019
05/09/2019 320-50147-4 DFSA 3.4 UG/L Cl. Spec. Table 3Compound SOP
J PFAS_DI_Prep3.1PQL
FAY-PS2019-Posttreat2-05072019
05/09/2019 320-50147-3 DFSA 3.9 UG/L Cl. Spec. Table 3Compound SOP
J PFAS_DI_Prep3.1PQL
FAY-PS2019-Posttreat2-05072019
05/09/2019 320-50147-3 DFSA 3.8 UG/L Cl. Spec. Table 3Compound SOP
J PFAS_DI_Prep3.1PQL
FAY-PS2019-Posttreat2-05072019
05/09/2019 320-50147-3 PFMOAA 1.00 ug/L Cl. Spec. Table 3Compound SOP
J PFAS_DI_Prep0.21PQL
FAY-PS2019-Posttreat2-05072019
05/09/2019 320-50147-3 PFMOAA 0.92 ug/L Cl. Spec. Table 3Compound SOP
J PFAS_DI_Prep0.21PQL
FAY-PS2019-Posttreat10-0725201
05/14/2019 320-52699-1 PFMOAA 0.22 ug/L Cl. Spec. Table 3Compound SOP
J PFAS_DI_Prep0.0050PQL
FAY-PS2019-Posttreat10-0725201
05/14/2019 320-52699-1 PFMOAA 0.24 ug/L Cl. Spec. Table 3Compound SOP
J PFAS_DI_Prep0.0050PQL
FAY-PS2019-Posttreat1-05072019
05/09/2019 320-50147-2 PFMOAA 2.8 ug/L Cl. Spec. Table 3Compound SOP
J PFAS_DI_Prep0.21PQL
FAY-PS2019-Posttreat1-05072019
05/09/2019 320-50147-2 PFMOAA 2.5 ug/L Cl. Spec. Table 3Compound SOP
J PFAS_DI_Prep0.21PQL
FAY-PS2019-Posttreat8-05072019
05/09/2019 320-50147-9 DFSA 6.8 UG/L Cl. Spec. Table 3Compound SOP
J PFAS_DI_Prep3.1PQL
FAY-PS2019-Posttreat8-05072019
05/09/2019 320-50147-9 DFSA 6.9 UG/L Cl. Spec. Table 3Compound SOP
J PFAS_DI_Prep3.1PQL
Page 24 of 29
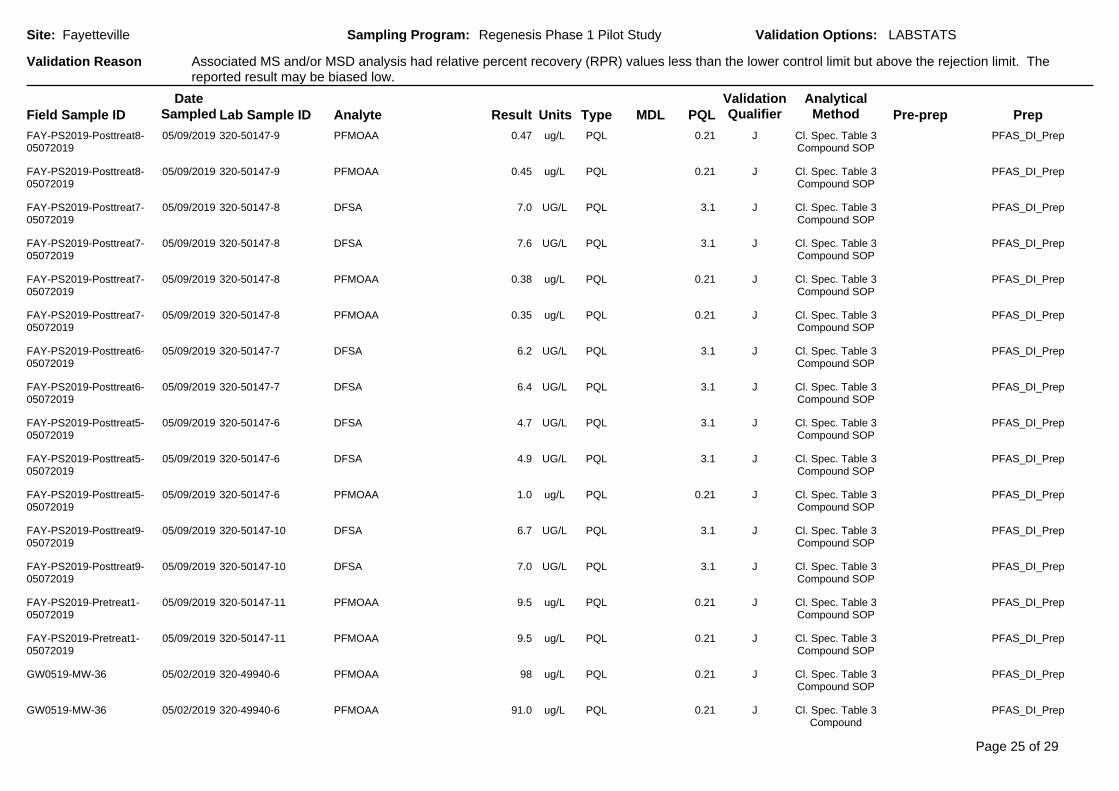
Associated MS and/or MSD analysis had relative percent recovery (RPR) values less than the lower control limit but above the rejection limit. Thereported result may be biased low.
LABSTATSValidation Options:
Validation Reason
FayettevilleSite: Sampling Program: Regenesis Phase 1 Pilot Study
AnalyticalMethodAnalyte
DateSampled PQL
ValidationQualifierLab Sample ID Pre-prepMDLResult TypeField Sample ID PrepUnits
FAY-PS2019-Posttreat8-05072019
05/09/2019 320-50147-9 PFMOAA 0.47 ug/L Cl. Spec. Table 3Compound SOP
J PFAS_DI_Prep0.21PQL
FAY-PS2019-Posttreat8-05072019
05/09/2019 320-50147-9 PFMOAA 0.45 ug/L Cl. Spec. Table 3Compound SOP
J PFAS_DI_Prep0.21PQL
FAY-PS2019-Posttreat7-05072019
05/09/2019 320-50147-8 DFSA 7.0 UG/L Cl. Spec. Table 3Compound SOP
J PFAS_DI_Prep3.1PQL
FAY-PS2019-Posttreat7-05072019
05/09/2019 320-50147-8 DFSA 7.6 UG/L Cl. Spec. Table 3Compound SOP
J PFAS_DI_Prep3.1PQL
FAY-PS2019-Posttreat7-05072019
05/09/2019 320-50147-8 PFMOAA 0.38 ug/L Cl. Spec. Table 3Compound SOP
J PFAS_DI_Prep0.21PQL
FAY-PS2019-Posttreat7-05072019
05/09/2019 320-50147-8 PFMOAA 0.35 ug/L Cl. Spec. Table 3Compound SOP
J PFAS_DI_Prep0.21PQL
FAY-PS2019-Posttreat6-05072019
05/09/2019 320-50147-7 DFSA 6.2 UG/L Cl. Spec. Table 3Compound SOP
J PFAS_DI_Prep3.1PQL
FAY-PS2019-Posttreat6-05072019
05/09/2019 320-50147-7 DFSA 6.4 UG/L Cl. Spec. Table 3Compound SOP
J PFAS_DI_Prep3.1PQL
FAY-PS2019-Posttreat5-05072019
05/09/2019 320-50147-6 DFSA 4.7 UG/L Cl. Spec. Table 3Compound SOP
J PFAS_DI_Prep3.1PQL
FAY-PS2019-Posttreat5-05072019
05/09/2019 320-50147-6 DFSA 4.9 UG/L Cl. Spec. Table 3Compound SOP
J PFAS_DI_Prep3.1PQL
FAY-PS2019-Posttreat5-05072019
05/09/2019 320-50147-6 PFMOAA 1.0 ug/L Cl. Spec. Table 3Compound SOP
J PFAS_DI_Prep0.21PQL
FAY-PS2019-Posttreat9-05072019
05/09/2019 320-50147-10 DFSA 6.7 UG/L Cl. Spec. Table 3Compound SOP
J PFAS_DI_Prep3.1PQL
FAY-PS2019-Posttreat9-05072019
05/09/2019 320-50147-10 DFSA 7.0 UG/L Cl. Spec. Table 3Compound SOP
J PFAS_DI_Prep3.1PQL
FAY-PS2019-Pretreat1-05072019
05/09/2019 320-50147-11 PFMOAA 9.5 ug/L Cl. Spec. Table 3Compound SOP
J PFAS_DI_Prep0.21PQL
FAY-PS2019-Pretreat1-05072019
05/09/2019 320-50147-11 PFMOAA 9.5 ug/L Cl. Spec. Table 3Compound SOP
J PFAS_DI_Prep0.21PQL
GW0519-MW-36 05/02/2019 320-49940-6 PFMOAA 98 ug/L Cl. Spec. Table 3Compound SOP
J PFAS_DI_Prep0.21PQL
GW0519-MW-36 05/02/2019 320-49940-6 PFMOAA 91.0 ug/L Cl. Spec. Table 3Compound
J PFAS_DI_Prep0.21PQL
Page 25 of 29
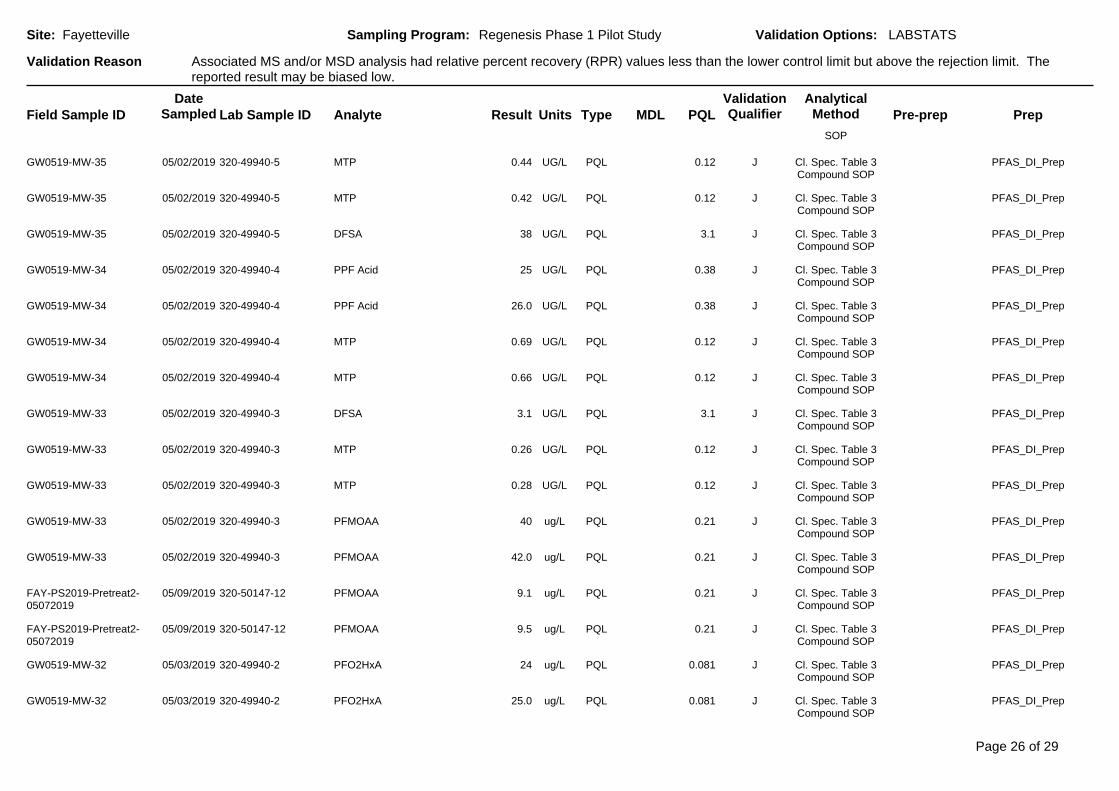
Associated MS and/or MSD analysis had relative percent recovery (RPR) values less than the lower control limit but above the rejection limit. Thereported result may be biased low.
LABSTATSValidation Options:
Validation Reason
FayettevilleSite: Sampling Program: Regenesis Phase 1 Pilot Study
AnalyticalMethodAnalyte
DateSampled PQL
ValidationQualifierLab Sample ID Pre-prepMDLResult TypeField Sample ID PrepUnits
SOP
GW0519-MW-35 05/02/2019 320-49940-5 MTP 0.44 UG/L Cl. Spec. Table 3Compound SOP
J PFAS_DI_Prep0.12PQL
GW0519-MW-35 05/02/2019 320-49940-5 MTP 0.42 UG/L Cl. Spec. Table 3Compound SOP
J PFAS_DI_Prep0.12PQL
GW0519-MW-35 05/02/2019 320-49940-5 DFSA 38 UG/L Cl. Spec. Table 3Compound SOP
J PFAS_DI_Prep3.1PQL
GW0519-MW-34 05/02/2019 320-49940-4 PPF Acid 25 UG/L Cl. Spec. Table 3Compound SOP
J PFAS_DI_Prep0.38PQL
GW0519-MW-34 05/02/2019 320-49940-4 PPF Acid 26.0 UG/L Cl. Spec. Table 3Compound SOP
J PFAS_DI_Prep0.38PQL
GW0519-MW-34 05/02/2019 320-49940-4 MTP 0.69 UG/L Cl. Spec. Table 3Compound SOP
J PFAS_DI_Prep0.12PQL
GW0519-MW-34 05/02/2019 320-49940-4 MTP 0.66 UG/L Cl. Spec. Table 3Compound SOP
J PFAS_DI_Prep0.12PQL
GW0519-MW-33 05/02/2019 320-49940-3 DFSA 3.1 UG/L Cl. Spec. Table 3Compound SOP
J PFAS_DI_Prep3.1PQL
GW0519-MW-33 05/02/2019 320-49940-3 MTP 0.26 UG/L Cl. Spec. Table 3Compound SOP
J PFAS_DI_Prep0.12PQL
GW0519-MW-33 05/02/2019 320-49940-3 MTP 0.28 UG/L Cl. Spec. Table 3Compound SOP
J PFAS_DI_Prep0.12PQL
GW0519-MW-33 05/02/2019 320-49940-3 PFMOAA 40 ug/L Cl. Spec. Table 3Compound SOP
J PFAS_DI_Prep0.21PQL
GW0519-MW-33 05/02/2019 320-49940-3 PFMOAA 42.0 ug/L Cl. Spec. Table 3Compound SOP
J PFAS_DI_Prep0.21PQL
FAY-PS2019-Pretreat2-05072019
05/09/2019 320-50147-12 PFMOAA 9.1 ug/L Cl. Spec. Table 3Compound SOP
J PFAS_DI_Prep0.21PQL
FAY-PS2019-Pretreat2-05072019
05/09/2019 320-50147-12 PFMOAA 9.5 ug/L Cl. Spec. Table 3Compound SOP
J PFAS_DI_Prep0.21PQL
GW0519-MW-32 05/03/2019 320-49940-2 PFO2HxA 24 ug/L Cl. Spec. Table 3Compound SOP
J PFAS_DI_Prep0.081PQL
GW0519-MW-32 05/03/2019 320-49940-2 PFO2HxA 25.0 ug/L Cl. Spec. Table 3Compound SOP
J PFAS_DI_Prep0.081PQL
Page 26 of 29

Associated MS and/or MSD analysis had relative percent recovery (RPR) values less than the lower control limit but above the rejection limit. Thereported result may be biased low.
LABSTATSValidation Options:
Validation Reason
FayettevilleSite: Sampling Program: Regenesis Phase 1 Pilot Study
AnalyticalMethodAnalyte
DateSampled PQL
ValidationQualifierLab Sample ID Pre-prepMDLResult TypeField Sample ID PrepUnits
GW0519-MW-31 05/03/2019 320-49945-1 DFSA 11 UG/L Cl. Spec. Table 3Compound SOP
J PFAS_DI_Prep3.1PQL
GW0519-MW-32 05/03/2019 320-49940-2 MTP 0.64 UG/L Cl. Spec. Table 3Compound SOP
J PFAS_DI_Prep0.12PQL
GW0519-MW-32 05/03/2019 320-49940-2 MTP 0.69 UG/L Cl. Spec. Table 3Compound SOP
J PFAS_DI_Prep0.12PQL
Page 27 of 29

Associated MS and/or MSD analysis had relative percent recovery (RPR) values less than the rejection level. The reported result may be biased low.
LABSTATSValidation Options:
Validation Reason
FayettevilleSite: Sampling Program: Regenesis Phase 1 Pilot Study
AnalyticalMethodAnalyte
DateSampled PQL
ValidationQualifierLab Sample ID Pre-prepMDLResult TypeField Sample ID PrepUnits
FAY-PS2019-Posttreat3-05072019
05/09/2019 320-50147-4 PFMOAA 1.4 ug/L Cl. Spec. Table 3Compound SOP
J PFAS_DI_Prep0.21PQL
FAY-PS2019-Posttreat6-05072019
05/09/2019 320-50147-7 PFMOAA 0.59 ug/L Cl. Spec. Table 3Compound SOP
J PFAS_DI_Prep0.21PQL
FAY-PS2019-Posttreat6-05072019
05/09/2019 320-50147-7 PFMOAA 0.59 ug/L Cl. Spec. Table 3Compound SOP
J PFAS_DI_Prep0.21PQL
FAY-PS2019-Posttreat9-05072019
05/09/2019 320-50147-10 PFMOAA 0.46 ug/L Cl. Spec. Table 3Compound SOP
J PFAS_DI_Prep0.21PQL
FAY-PS2019-Posttreat9-05072019
05/09/2019 320-50147-10 PFMOAA 0.44 ug/L Cl. Spec. Table 3Compound SOP
J PFAS_DI_Prep0.21PQL
FAY-PS2019-Pretreat1-05072019
05/09/2019 320-50147-11 PPF Acid 0.66 UG/L Cl. Spec. Table 3Compound SOP
J PFAS_DI_Prep0.38PQL
FAY-PS2019-Pretreat1-05072019
05/09/2019 320-50147-11 PPF Acid 0.6 UG/L Cl. Spec. Table 3Compound SOP
J PFAS_DI_Prep0.38PQL
FAY-PS2019-Pretreat2-05072019
05/09/2019 320-50147-12 PPF Acid 0.65 UG/L Cl. Spec. Table 3Compound SOP
J PFAS_DI_Prep0.38PQL
FAY-PS2019-Pretreat2-05072019
05/09/2019 320-50147-12 PPF Acid 0.69 UG/L Cl. Spec. Table 3Compound SOP
J PFAS_DI_Prep0.38PQL
GW0519-MW-34 05/02/2019 320-49940-4 PFMOAA 111 ug/L Cl. Spec. Table 3Compound SOP
J PFAS_DI_Prep0.21PQL
GW0519-MW-34 05/02/2019 320-49940-4 PFMOAA 120.0 ug/L Cl. Spec. Table 3Compound SOP
J PFAS_DI_Prep0.21PQL
GW0519-MW-32 05/03/2019 320-49940-2 DFSA 23 UG/L Cl. Spec. Table 3Compound SOP
J PFAS_DI_Prep3.1PQL
GW0519-MW-32 05/03/2019 320-49940-2 PFMOAA 121 ug/L Cl. Spec. Table 3Compound SOP
J PFAS_DI_Prep0.21PQL
GW0519-MW-32 05/03/2019 320-49940-2 PFMOAA 120.0 ug/L Cl. Spec. Table 3Compound SOP
J PFAS_DI_Prep0.21PQL
Page 28 of 29

The result is estimated since the concentration is between the method detection limit and practical quantitation limit.
LABSTATSValidation Options:
Validation Reason
FayettevilleSite: Sampling Program: Regenesis Phase 1 Pilot Study
AnalyticalMethodAnalyte
DateSampled PQL
ValidationQualifierLab Sample ID Pre-prepMDLResult TypeField Sample ID PrepUnits
GW0519-EQBLK-1 05/02/2019 280-123591-9 Chloroform 0.41 UG/L 0.16 8260BJ 5030B1.0MDL
GW0519-EQBLK-1 05/02/2019 280-123591-9 Carbon 0.16 MG/L 0.16 9060J1.0MDL
GW0519-EQBLK-1 05/02/2019 280-123591-9 Carbon Disulfide 0.45 UG/L 0.17 8260BJ 5030B2.0MDL
GW0519-EQBLK-1 05/02/2019 280-123591-9 1,2-Dibromo-3-Chloropropane
1.1 UG/L 0.47 8260BJ 5030B5.0MDL
GW0519-MW-31 05/03/2019 280-123591-20 1,2-Dichloroethane 0.18 UG/L 0.13 8260BJ 5030B1.0MDL
GW0519-MW-36-D 05/02/2019 280-123591-7 1,2-Dichloroethane 0.15 UG/L 0.13 8260BJ 5030B1.0MDL
GW0519-PZ-32 05/03/2019 280-123591-14 1,2-Dichloroethane 0.14 UG/L 0.13 8260BJ 5030B1.0MDL
Page 29 of 29

ADQM Data Review Narrative - FAY Regenesis Phase 1 Post 619.doc 1 of 3
ADQM DATA REVIEW NARRATIVE
Site Chemours FAY – Fayetteville Project Regenesis Phase 1 Post 6/19 Project Reviewer Michael Aucoin, AECOM as a Chemours contractor Sampling Dates June 18, 2019 June 19, 2019 Analytical Protocol
Laboratory Analytical Method Parameter(s) TestAmerica - Sacramento 537 Modified PFAS1 TestAmerica - Sacramento Cl. Spec. Table 3
Compound SOP Table 3+ compounds
TestAmerica - Denver 8260B Volatile Organics TestAmerica - Denver 6010D Calcium, total and dissolved TestAmerica - Denver 2340 C-1997 Total Hardness as CaCO3 TestAmerica - Denver 9060 Total Organic Carbon TestAmerica - Denver 9060 Dissolved Organic Carbon
1 Perfluoroalkylsubstances, a list of 33 compounds including HFPO-DA. Sample Receipt The following items are noted for this data set:
• All samples were received in satisfactory condition and within EPA temperature guideline on June 20, 2019
Data Review The electronic data submitted for this project was reviewed via the Data Verification Module (DVM) process. Overall the data is acceptable for use without qualification, except as noted below:
• Results for acetone in one sample was qualified B and the reported result may be biased high, or a false positive, due to a comparable concentration found in anassociated equipment blank.
• Several analytical results have been qualified J as estimated, and non-detect results qualified UJ indicating an estimated reporting limit, due to a poor or very poor surrogate or matrix spike recovery; sample analysis which exceeded the laboratory established hold time; and poor field duplicate or lab replicate precision. Volatile organic results reported between the method detection limit (MDL) and practical quantitation limit (PQL) were qualified J as estimated. See

ADQM Data Review Narrative - FAY Regenesis Phase 1 Post 619.doc 2 of 3
the Data Verification Module (DVM) Narrative Report for which samples were qualified, the specific reasons for qualification, and potential bias in reported results.
Attachments The DVM Narrative report is attached. The lab reports due to a large page count are stored on an AECOM network shared drive and are available to be posted on external shared drives, or on a flash drive.
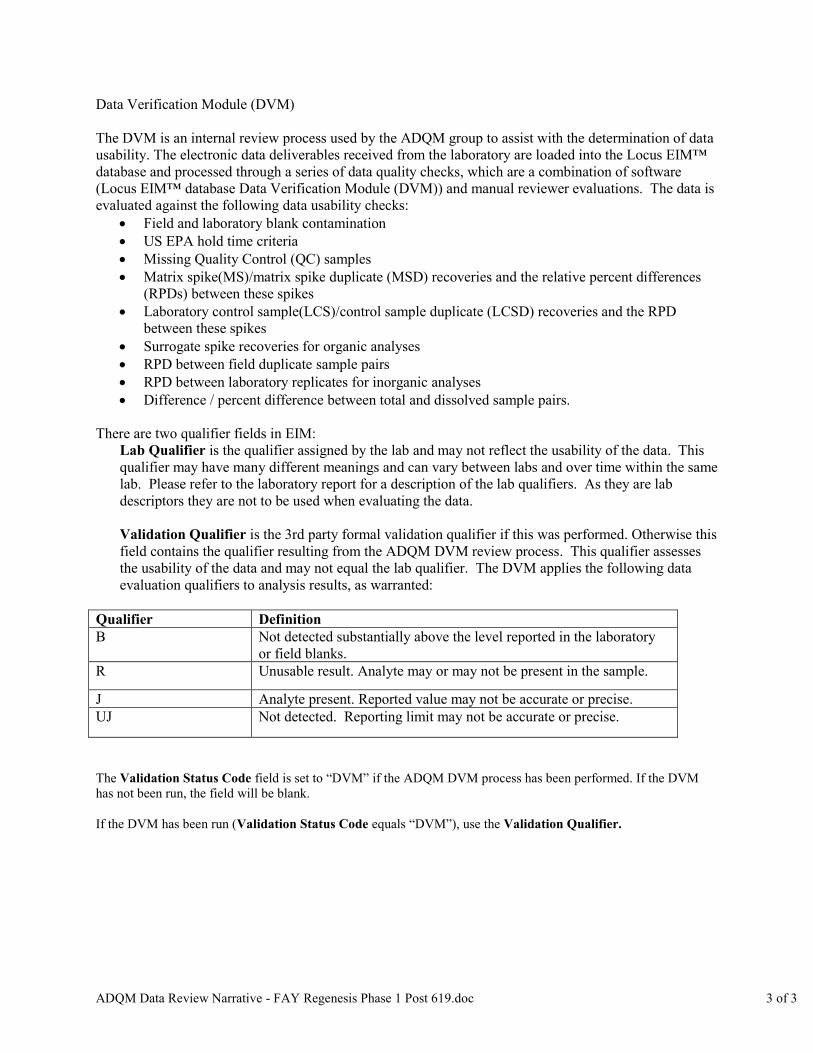
ADQM Data Review Narrative - FAY Regenesis Phase 1 Post 619.doc 3 of 3
Data Verification Module (DVM) The DVM is an internal review process used by the ADQM group to assist with the determination of data usability. The electronic data deliverables received from the laboratory are loaded into the Locus EIM™ database and processed through a series of data quality checks, which are a combination of software (Locus EIM™ database Data Verification Module (DVM)) and manual reviewer evaluations. The data is evaluated against the following data usability checks:
• Field and laboratory blank contamination • US EPA hold time criteria • Missing Quality Control (QC) samples • Matrix spike(MS)/matrix spike duplicate (MSD) recoveries and the relative percent differences
(RPDs) between these spikes • Laboratory control sample(LCS)/control sample duplicate (LCSD) recoveries and the RPD
between these spikes • Surrogate spike recoveries for organic analyses • RPD between field duplicate sample pairs • RPD between laboratory replicates for inorganic analyses • Difference / percent difference between total and dissolved sample pairs.
There are two qualifier fields in EIM:
Lab Qualifier is the qualifier assigned by the lab and may not reflect the usability of the data. This qualifier may have many different meanings and can vary between labs and over time within the same lab. Please refer to the laboratory report for a description of the lab qualifiers. As they are lab descriptors they are not to be used when evaluating the data. Validation Qualifier is the 3rd party formal validation qualifier if this was performed. Otherwise this field contains the qualifier resulting from the ADQM DVM review process. This qualifier assesses the usability of the data and may not equal the lab qualifier. The DVM applies the following data evaluation qualifiers to analysis results, as warranted:
Qualifier Definition B Not detected substantially above the level reported in the laboratory
or field blanks. R Unusable result. Analyte may or may not be present in the sample.
J Analyte present. Reported value may not be accurate or precise. UJ Not detected. Reporting limit may not be accurate or precise.
The Validation Status Code field is set to “DVM” if the ADQM DVM process has been performed. If the DVM has not been run, the field will be blank. If the DVM has been run (Validation Status Code equals “DVM”), use the Validation Qualifier.

DVM Narrative Report
Contamination detected in equipment blank(s). Sample result does not differ significantly from the analyte concentration detected in the associatedequipment blank(s).
LABSTATSValidation Options:
Validation Reason
FayettevilleSite: Sampling Program: Regenesis Phase 1 Post 6/19
AnalyticalMethodAnalyte
DateSampled PQL
ValidationQualifierLab Sample ID Pre-prepMDLResult TypeField Sample ID PrepUnits
GW0619-MW-34-2 06/19/2019 320-51599-1 Acetone 4.1 UG/L 1.9 8260BB 5030B10MDL
Page 1 of 29

Only one surrogate has relative percent recovery (RPR) values outside control limits and the parameter is a PFC (Nondetects).
LABSTATSValidation Options:
Validation Reason
FayettevilleSite: Sampling Program: Regenesis Phase 1 Post 6/19
AnalyticalMethodAnalyte
DateSampled PQL
ValidationQualifierLab Sample ID Pre-prepMDLResult TypeField Sample ID PrepUnits
GW0619-MW-36 06/18/2019 320-51608-2 Perfluorooctadecanoicacid
0.0020 ug/L 537 ModifiedUJ 3535_PFC0.0020PQL
GW0619-MW-36 06/18/2019 320-51608-2 Perfluorohexadecanoicacid (PFHxDA)
0.0020 ug/L 537 ModifiedUJ 3535_PFC0.0020PQL
Page 2 of 29

The analysis hold time for this sample was exceeded. The reporting limit may be biased low.
LABSTATSValidation Options:
Validation Reason
FayettevilleSite: Sampling Program: Regenesis Phase 1 Post 6/19
AnalyticalMethodAnalyte
DateSampled PQL
ValidationQualifierLab Sample ID Pre-prepMDLResult TypeField Sample ID PrepUnits
GW0619-MW-35 06/18/2019 320-51608-1 Byproduct 4 0.016 UG/L Cl. Spec. Table 3Compound SOP
UJ PFAS_DI_Prep0.016PQL
GW0619-MW-35 06/18/2019 320-51608-1 Byproduct 4 0.016 UG/L Cl. Spec. Table 3Compound SOP
UJ PFAS_DI_Prep0.016PQL
GW0619-MW-36 06/18/2019 320-51608-2 PFO3OA 0.0058 ug/L Cl. Spec. Table 3Compound SOP
UJ PFAS_DI_Prep0.0058PQL
GW0619-MW-36 06/18/2019 320-51608-2 PFO3OA 0.0058 ug/L Cl. Spec. Table 3Compound SOP
UJ PFAS_DI_Prep0.0058PQL
GW0619-MW-36 06/18/2019 320-51608-2 PFO4DA 0.0079 ug/L Cl. Spec. Table 3Compound SOP
UJ PFAS_DI_Prep0.0079PQL
GW0619-MW-36 06/18/2019 320-51608-2 PFO4DA 0.0079 ug/L Cl. Spec. Table 3Compound SOP
UJ PFAS_DI_Prep0.0079PQL
GW0619-MW-36 06/18/2019 320-51608-2 PFO5DA 0.0034 ug/L Cl. Spec. Table 3Compound SOP
UJ PFAS_DI_Prep0.0034PQL
GW0619-MW-36 06/18/2019 320-51608-2 PFO5DA 0.0034 ug/L Cl. Spec. Table 3Compound SOP
UJ PFAS_DI_Prep0.0034PQL
GW0619-MW-36 06/18/2019 320-51608-2 N-ethylperfluoro-1-octanesulfonamide
0.0037 UG/L Cl. Spec. Table 3Compound SOP
UJ PFAS_DI_Prep0.0037PQL
GW0619-MW-36 06/18/2019 320-51608-2 N-ethylperfluoro-1-octanesulfonamide
0.0037 UG/L Cl. Spec. Table 3Compound SOP
UJ PFAS_DI_Prep0.0037PQL
GW0619-MW-35 06/18/2019 320-51608-1 Byproduct 6 0.0020 UG/L Cl. Spec. Table 3Compound SOP
UJ PFAS_DI_Prep0.0020PQL
GW0619-MW-35 06/18/2019 320-51608-1 Byproduct 6 0.0020 UG/L Cl. Spec. Table 3Compound SOP
UJ PFAS_DI_Prep0.0020PQL
GW0619-MW-36 06/18/2019 320-51608-2 NVHOS 0.0054 UG/L Cl. Spec. Table 3Compound SOP
UJ PFAS_DI_Prep0.0054PQL
GW0619-MW-36 06/18/2019 320-51608-2 NVHOS 0.0054 UG/L Cl. Spec. Table 3Compound SOP
UJ PFAS_DI_Prep0.0054PQL
GW0619-MW-36 06/18/2019 320-51608-2 PES 0.0046 UG/L Cl. Spec. Table 3Compound SOP
UJ PFAS_DI_Prep0.0046PQL
GW0619-MW-36 06/18/2019 320-51608-2 PES 0.0046 UG/L Cl. Spec. Table 3Compound SOP
UJ PFAS_DI_Prep0.0046PQL
GW0619-MW-36 06/18/2019 320-51608-2 PMPA 0.057 UG/L Cl. Spec. Table 3Compound SOP
UJ PFAS_DI_Prep0.057PQL
Page 3 of 29

The analysis hold time for this sample was exceeded. The reporting limit may be biased low.
LABSTATSValidation Options:
Validation Reason
FayettevilleSite: Sampling Program: Regenesis Phase 1 Post 6/19
AnalyticalMethodAnalyte
DateSampled PQL
ValidationQualifierLab Sample ID Pre-prepMDLResult TypeField Sample ID PrepUnits
GW0619-MW-36 06/18/2019 320-51608-2 PMPA 0.057 UG/L Cl. Spec. Table 3Compound SOP
UJ PFAS_DI_Prep0.057PQL
GW0619-MW-36 06/18/2019 320-51608-2 PFECA B 0.0060 UG/L Cl. Spec. Table 3Compound SOP
UJ PFAS_DI_Prep0.0060PQL
GW0619-MW-36 06/18/2019 320-51608-2 PFECA B 0.0060 UG/L Cl. Spec. Table 3Compound SOP
UJ PFAS_DI_Prep0.0060PQL
GW0619-MW-36 06/18/2019 320-51608-2 2-(N-ethyl perfluoro-1-octanesulfonamido)-ethanol
0.0060 ug/L Cl. Spec. Table 3Compound SOP
UJ PFAS_DI_Prep0.0060PQL
GW0619-MW-36 06/18/2019 320-51608-2 2-(N-ethyl perfluoro-1-octanesulfonamido)-ethanol
0.0060 ug/L Cl. Spec. Table 3Compound SOP
UJ PFAS_DI_Prep0.0060PQL
GW0619-MW-36 06/18/2019 320-51608-2 2-(N-methyl perfluoro-1-octanesulfonamido)-ethanol
0.011 ug/L Cl. Spec. Table 3Compound SOP
UJ PFAS_DI_Prep0.011PQL
GW0619-MW-36 06/18/2019 320-51608-2 2-(N-methyl perfluoro-1-octanesulfonamido)-ethanol
0.011 ug/L Cl. Spec. Table 3Compound SOP
UJ PFAS_DI_Prep0.011PQL
GW0619-MW-36 06/18/2019 320-51608-2 PEPA 0.020 UG/L Cl. Spec. Table 3Compound SOP
UJ PFAS_DI_Prep0.020PQL
GW0619-MW-36 06/18/2019 320-51608-2 PEPA 0.020 UG/L Cl. Spec. Table 3Compound SOP
UJ PFAS_DI_Prep0.020PQL
GW0619-MW-36 06/18/2019 320-51608-2 PFESA-BP1 0.0027 UG/L Cl. Spec. Table 3Compound SOP
UJ PFAS_DI_Prep0.0027PQL
GW0619-MW-36 06/18/2019 320-51608-2 PFESA-BP1 0.0027 UG/L Cl. Spec. Table 3Compound SOP
UJ PFAS_DI_Prep0.0027PQL
GW0619-MW-36 06/18/2019 320-51608-2 N-methyl perfluoro-1-octanesulfonamide
0.0035 ug/L Cl. Spec. Table 3Compound SOP
UJ PFAS_DI_Prep0.0035PQL
GW0619-MW-36 06/18/2019 320-51608-2 N-methyl perfluoro-1-octanesulfonamide
0.0035 ug/L Cl. Spec. Table 3Compound SOP
UJ PFAS_DI_Prep0.0035PQL
GW0619-MW-35 06/18/2019 320-51608-1 PFECA B 0.0060 UG/L Cl. Spec. Table 3Compound SOP
UJ PFAS_DI_Prep0.0060PQL
GW0619-MW-35 06/18/2019 320-51608-1 PFECA B 0.0060 UG/L Cl. Spec. Table 3Compound SOP
UJ PFAS_DI_Prep0.0060PQL
Page 4 of 29
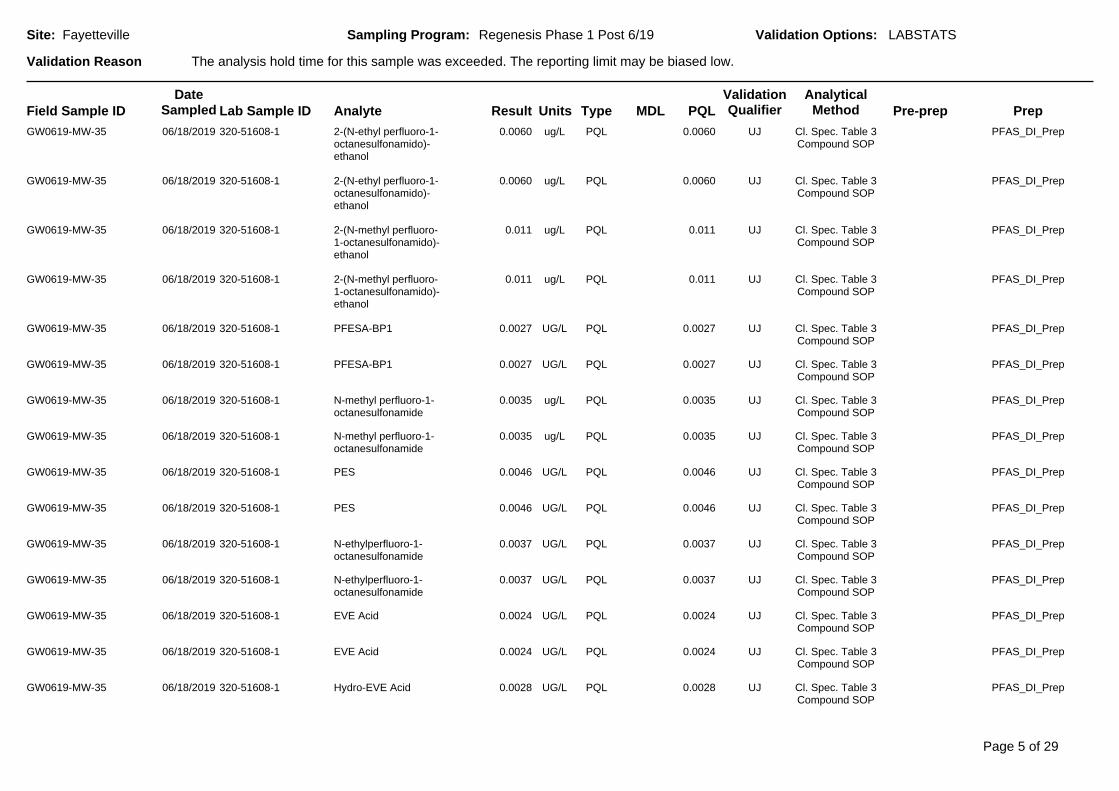
The analysis hold time for this sample was exceeded. The reporting limit may be biased low.
LABSTATSValidation Options:
Validation Reason
FayettevilleSite: Sampling Program: Regenesis Phase 1 Post 6/19
AnalyticalMethodAnalyte
DateSampled PQL
ValidationQualifierLab Sample ID Pre-prepMDLResult TypeField Sample ID PrepUnits
GW0619-MW-35 06/18/2019 320-51608-1 2-(N-ethyl perfluoro-1-octanesulfonamido)-ethanol
0.0060 ug/L Cl. Spec. Table 3Compound SOP
UJ PFAS_DI_Prep0.0060PQL
GW0619-MW-35 06/18/2019 320-51608-1 2-(N-ethyl perfluoro-1-octanesulfonamido)-ethanol
0.0060 ug/L Cl. Spec. Table 3Compound SOP
UJ PFAS_DI_Prep0.0060PQL
GW0619-MW-35 06/18/2019 320-51608-1 2-(N-methyl perfluoro-1-octanesulfonamido)-ethanol
0.011 ug/L Cl. Spec. Table 3Compound SOP
UJ PFAS_DI_Prep0.011PQL
GW0619-MW-35 06/18/2019 320-51608-1 2-(N-methyl perfluoro-1-octanesulfonamido)-ethanol
0.011 ug/L Cl. Spec. Table 3Compound SOP
UJ PFAS_DI_Prep0.011PQL
GW0619-MW-35 06/18/2019 320-51608-1 PFESA-BP1 0.0027 UG/L Cl. Spec. Table 3Compound SOP
UJ PFAS_DI_Prep0.0027PQL
GW0619-MW-35 06/18/2019 320-51608-1 PFESA-BP1 0.0027 UG/L Cl. Spec. Table 3Compound SOP
UJ PFAS_DI_Prep0.0027PQL
GW0619-MW-35 06/18/2019 320-51608-1 N-methyl perfluoro-1-octanesulfonamide
0.0035 ug/L Cl. Spec. Table 3Compound SOP
UJ PFAS_DI_Prep0.0035PQL
GW0619-MW-35 06/18/2019 320-51608-1 N-methyl perfluoro-1-octanesulfonamide
0.0035 ug/L Cl. Spec. Table 3Compound SOP
UJ PFAS_DI_Prep0.0035PQL
GW0619-MW-35 06/18/2019 320-51608-1 PES 0.0046 UG/L Cl. Spec. Table 3Compound SOP
UJ PFAS_DI_Prep0.0046PQL
GW0619-MW-35 06/18/2019 320-51608-1 PES 0.0046 UG/L Cl. Spec. Table 3Compound SOP
UJ PFAS_DI_Prep0.0046PQL
GW0619-MW-35 06/18/2019 320-51608-1 N-ethylperfluoro-1-octanesulfonamide
0.0037 UG/L Cl. Spec. Table 3Compound SOP
UJ PFAS_DI_Prep0.0037PQL
GW0619-MW-35 06/18/2019 320-51608-1 N-ethylperfluoro-1-octanesulfonamide
0.0037 UG/L Cl. Spec. Table 3Compound SOP
UJ PFAS_DI_Prep0.0037PQL
GW0619-MW-35 06/18/2019 320-51608-1 EVE Acid 0.0024 UG/L Cl. Spec. Table 3Compound SOP
UJ PFAS_DI_Prep0.0024PQL
GW0619-MW-35 06/18/2019 320-51608-1 EVE Acid 0.0024 UG/L Cl. Spec. Table 3Compound SOP
UJ PFAS_DI_Prep0.0024PQL
GW0619-MW-35 06/18/2019 320-51608-1 Hydro-EVE Acid 0.0028 UG/L Cl. Spec. Table 3Compound SOP
UJ PFAS_DI_Prep0.0028PQL
Page 5 of 29

The analysis hold time for this sample was exceeded. The reporting limit may be biased low.
LABSTATSValidation Options:
Validation Reason
FayettevilleSite: Sampling Program: Regenesis Phase 1 Post 6/19
AnalyticalMethodAnalyte
DateSampled PQL
ValidationQualifierLab Sample ID Pre-prepMDLResult TypeField Sample ID PrepUnits
GW0619-MW-35 06/18/2019 320-51608-1 Hydro-EVE Acid 0.0028 UG/L Cl. Spec. Table 3Compound SOP
UJ PFAS_DI_Prep0.0028PQL
GW0619-MW-35 06/18/2019 320-51608-1 PFECA-G 0.0041 UG/L Cl. Spec. Table 3Compound SOP
UJ PFAS_DI_Prep0.0041PQL
GW0619-MW-35 06/18/2019 320-51608-1 PFECA-G 0.0041 UG/L Cl. Spec. Table 3Compound SOP
UJ PFAS_DI_Prep0.0041PQL
GW0619-MW-33D 06/18/2019 320-51609-4 PFESA-BP1 0.053 UG/L Cl. Spec. Table 3Compound SOP
UJ PFAS_DI_Prep0.053PQL
GW0619-MW-33D 06/18/2019 320-51609-4 PFESA-BP1 0.053 UG/L Cl. Spec. Table 3Compound SOP
UJ PFAS_DI_Prep0.053PQL
GW0619-MW-33D 06/18/2019 320-51609-4 N-methyl perfluoro-1-octanesulfonamide
0.069 ug/L Cl. Spec. Table 3Compound SOP
UJ PFAS_DI_Prep0.069PQL
GW0619-MW-33D 06/18/2019 320-51609-4 N-methyl perfluoro-1-octanesulfonamide
0.069 ug/L Cl. Spec. Table 3Compound SOP
UJ PFAS_DI_Prep0.069PQL
GW0619-MW-33D 06/18/2019 320-51609-4 PES 0.092 UG/L Cl. Spec. Table 3Compound SOP
UJ PFAS_DI_Prep0.092PQL
GW0619-MW-33D 06/18/2019 320-51609-4 PES 0.092 UG/L Cl. Spec. Table 3Compound SOP
UJ PFAS_DI_Prep0.092PQL
GW0619-MW-33D 06/18/2019 320-51609-4 N-ethylperfluoro-1-octanesulfonamide
0.075 UG/L Cl. Spec. Table 3Compound SOP
UJ PFAS_DI_Prep0.075PQL
GW0619-MW-33D 06/18/2019 320-51609-4 N-ethylperfluoro-1-octanesulfonamide
0.075 UG/L Cl. Spec. Table 3Compound SOP
UJ PFAS_DI_Prep0.075PQL
GW0619-MW-33D 06/18/2019 320-51609-4 Hydro-EVE Acid 0.056 UG/L Cl. Spec. Table 3Compound SOP
UJ PFAS_DI_Prep0.056PQL
GW0619-MW-33D 06/18/2019 320-51609-4 Hydro-EVE Acid 0.056 UG/L Cl. Spec. Table 3Compound SOP
UJ PFAS_DI_Prep0.056PQL
GW0619-MW-33D 06/18/2019 320-51609-4 PFECA-G 0.082 UG/L Cl. Spec. Table 3Compound SOP
UJ PFAS_DI_Prep0.082PQL
GW0619-MW-33D 06/18/2019 320-51609-4 PFECA-G 0.082 UG/L Cl. Spec. Table 3Compound SOP
UJ PFAS_DI_Prep0.082PQL
GW0619-MW-33D 06/18/2019 320-51609-4 R-EVE 0.14 UG/L Cl. Spec. Table 3Compound SOP
UJ PFAS_DI_Prep0.14PQL
GW0619-MW-33D 06/18/2019 320-51609-4 R-EVE 0.14 UG/L Cl. Spec. Table 3Compound SOP
UJ PFAS_DI_Prep0.14PQL
Page 6 of 29

The analysis hold time for this sample was exceeded. The reporting limit may be biased low.
LABSTATSValidation Options:
Validation Reason
FayettevilleSite: Sampling Program: Regenesis Phase 1 Post 6/19
AnalyticalMethodAnalyte
DateSampled PQL
ValidationQualifierLab Sample ID Pre-prepMDLResult TypeField Sample ID PrepUnits
GW0619-MW-33D 06/18/2019 320-51609-4 Byproduct 4 0.32 UG/L Cl. Spec. Table 3Compound SOP
UJ PFAS_DI_Prep0.32PQL
GW0619-MW-33D 06/18/2019 320-51609-4 Byproduct 4 0.32 UG/L Cl. Spec. Table 3Compound SOP
UJ PFAS_DI_Prep0.32PQL
GW0619-MW-33D 06/18/2019 320-51609-4 EVE Acid 0.049 UG/L Cl. Spec. Table 3Compound SOP
UJ PFAS_DI_Prep0.049PQL
GW0619-MW-33D 06/18/2019 320-51609-4 EVE Acid 0.049 UG/L Cl. Spec. Table 3Compound SOP
UJ PFAS_DI_Prep0.049PQL
GW0619-MW-33D 06/18/2019 320-51609-4 Byproduct 6 0.031 UG/L Cl. Spec. Table 3Compound SOP
UJ PFAS_DI_Prep0.031PQL
GW0619-MW-33D 06/18/2019 320-51609-4 Byproduct 6 0.031 UG/L Cl. Spec. Table 3Compound SOP
UJ PFAS_DI_Prep0.031PQL
GW0619-MW-34-2 06/19/2019 320-51607-1 PES 0.046 UG/L Cl. Spec. Table 3Compound SOP
UJ PFAS_DI_Prep0.046PQL
GW0619-MW-34-2 06/19/2019 320-51607-1 PES 0.046 UG/L Cl. Spec. Table 3Compound SOP
UJ PFAS_DI_Prep0.046PQL
GW0619-MW-34-2 06/19/2019 320-51607-1 PMPA 0.57 UG/L Cl. Spec. Table 3Compound SOP
UJ PFAS_DI_Prep0.57PQL
GW0619-MW-34-2 06/19/2019 320-51607-1 PMPA 0.57 UG/L Cl. Spec. Table 3Compound SOP
UJ PFAS_DI_Prep0.57PQL
GW0619-MW-34-2 06/19/2019 320-51607-1 PFECA B 0.060 UG/L Cl. Spec. Table 3Compound SOP
UJ PFAS_DI_Prep0.060PQL
GW0619-MW-34-2 06/19/2019 320-51607-1 PFECA B 0.060 UG/L Cl. Spec. Table 3Compound SOP
UJ PFAS_DI_Prep0.060PQL
GW0619-MW-34-2 06/19/2019 320-51607-1 2-(N-ethyl perfluoro-1-octanesulfonamido)-ethanol
0.060 ug/L Cl. Spec. Table 3Compound SOP
UJ PFAS_DI_Prep0.060PQL
GW0619-MW-34-2 06/19/2019 320-51607-1 2-(N-ethyl perfluoro-1-octanesulfonamido)-ethanol
0.060 ug/L Cl. Spec. Table 3Compound SOP
UJ PFAS_DI_Prep0.060PQL
GW0619-MW-34-2 06/19/2019 320-51607-1 2-(N-methyl perfluoro-1-octanesulfonamido)-ethanol
0.11 ug/L Cl. Spec. Table 3Compound SOP
UJ PFAS_DI_Prep0.11PQL
GW0619-MW-34-2 06/19/2019 320-51607-1 2-(N-methyl perfluoro-1-
0.11 ug/L Cl. Spec. Table 3Compound
UJ PFAS_DI_Prep0.11PQL
Page 7 of 29

The analysis hold time for this sample was exceeded. The reporting limit may be biased low.
LABSTATSValidation Options:
Validation Reason
FayettevilleSite: Sampling Program: Regenesis Phase 1 Post 6/19
AnalyticalMethodAnalyte
DateSampled PQL
ValidationQualifierLab Sample ID Pre-prepMDLResult TypeField Sample ID PrepUnits
octanesulfonamido)-ethanol
SOP
GW0619-MW-34-2 06/19/2019 320-51607-1 PFESA-BP1 0.027 UG/L Cl. Spec. Table 3Compound SOP
UJ PFAS_DI_Prep0.027PQL
GW0619-MW-34-2 06/19/2019 320-51607-1 PFESA-BP1 0.027 UG/L Cl. Spec. Table 3Compound SOP
UJ PFAS_DI_Prep0.027PQL
GW0619-MW-34-2 06/19/2019 320-51607-1 N-methyl perfluoro-1-octanesulfonamide
0.035 ug/L Cl. Spec. Table 3Compound SOP
UJ PFAS_DI_Prep0.035PQL
GW0619-MW-34-2 06/19/2019 320-51607-1 N-methyl perfluoro-1-octanesulfonamide
0.035 ug/L Cl. Spec. Table 3Compound SOP
UJ PFAS_DI_Prep0.035PQL
GW0619-MW-34-2 06/19/2019 320-51607-1 EVE Acid 0.024 UG/L Cl. Spec. Table 3Compound SOP
UJ PFAS_DI_Prep0.024PQL
GW0619-MW-34-2 06/19/2019 320-51607-1 EVE Acid 0.024 UG/L Cl. Spec. Table 3Compound SOP
UJ PFAS_DI_Prep0.024PQL
GW0619-MW-34-2 06/19/2019 320-51607-1 PFESA-BP2 0.030 ug/L Cl. Spec. Table 3Compound SOP
UJ PFAS_DI_Prep0.030PQL
GW0619-MW-34-2 06/19/2019 320-51607-1 PFESA-BP2 0.030 ug/L Cl. Spec. Table 3Compound SOP
UJ PFAS_DI_Prep0.030PQL
GW0619-MW-34-2 06/19/2019 320-51607-1 Hydro-EVE Acid 0.028 UG/L Cl. Spec. Table 3Compound SOP
UJ PFAS_DI_Prep0.028PQL
GW0619-MW-34-2 06/19/2019 320-51607-1 Hydro-EVE Acid 0.028 UG/L Cl. Spec. Table 3Compound SOP
UJ PFAS_DI_Prep0.028PQL
GW0619-MW-34-2 06/19/2019 320-51607-1 PFECA-G 0.041 UG/L Cl. Spec. Table 3Compound SOP
UJ PFAS_DI_Prep0.041PQL
GW0619-MW-34-2 06/19/2019 320-51607-1 PFECA-G 0.041 UG/L Cl. Spec. Table 3Compound SOP
UJ PFAS_DI_Prep0.041PQL
GW0619-MW-34-2 06/19/2019 320-51607-1 R-EVE 0.070 UG/L Cl. Spec. Table 3Compound SOP
UJ PFAS_DI_Prep0.070PQL
GW0619-MW-34-2 06/19/2019 320-51607-1 R-EVE 0.070 UG/L Cl. Spec. Table 3Compound SOP
UJ PFAS_DI_Prep0.070PQL
GW0619-MW-34-2 06/19/2019 320-51607-1 Byproduct 4 0.16 UG/L Cl. Spec. Table 3Compound SOP
UJ PFAS_DI_Prep0.16PQL
GW0619-MW-34-2 06/19/2019 320-51607-1 Byproduct 4 0.16 UG/L Cl. Spec. Table 3Compound SOP
UJ PFAS_DI_Prep0.16PQL
Page 8 of 29

The analysis hold time for this sample was exceeded. The reporting limit may be biased low.
LABSTATSValidation Options:
Validation Reason
FayettevilleSite: Sampling Program: Regenesis Phase 1 Post 6/19
AnalyticalMethodAnalyte
DateSampled PQL
ValidationQualifierLab Sample ID Pre-prepMDLResult TypeField Sample ID PrepUnits
GW0619-MW-34-2 06/19/2019 320-51607-1 PFO4DA 0.079 ug/L Cl. Spec. Table 3Compound SOP
UJ PFAS_DI_Prep0.079PQL
GW0619-MW-34-2 06/19/2019 320-51607-1 PFO4DA 0.079 ug/L Cl. Spec. Table 3Compound SOP
UJ PFAS_DI_Prep0.079PQL
GW0619-MW-34-2 06/19/2019 320-51607-1 PFO5DA 0.034 ug/L Cl. Spec. Table 3Compound SOP
UJ PFAS_DI_Prep0.034PQL
GW0619-MW-34-2 06/19/2019 320-51607-1 PFO5DA 0.034 ug/L Cl. Spec. Table 3Compound SOP
UJ PFAS_DI_Prep0.034PQL
GW0619-MW-34-2 06/19/2019 320-51607-1 N-ethylperfluoro-1-octanesulfonamide
0.037 UG/L Cl. Spec. Table 3Compound SOP
UJ PFAS_DI_Prep0.037PQL
GW0619-MW-34-2 06/19/2019 320-51607-1 N-ethylperfluoro-1-octanesulfonamide
0.037 UG/L Cl. Spec. Table 3Compound SOP
UJ PFAS_DI_Prep0.037PQL
GW0619-MW-34-2 06/19/2019 320-51607-1 Byproduct 6 0.015 UG/L Cl. Spec. Table 3Compound SOP
UJ PFAS_DI_Prep0.015PQL
GW0619-MW-34-2 06/19/2019 320-51607-1 Byproduct 6 0.015 UG/L Cl. Spec. Table 3Compound SOP
UJ PFAS_DI_Prep0.015PQL
GW0619-MW-31 06/18/2019 320-51609-1 PFECA B 0.060 UG/L Cl. Spec. Table 3Compound SOP
UJ PFAS_DI_Prep0.060PQL
GW0619-MW-31 06/18/2019 320-51609-1 PFECA B 0.060 UG/L Cl. Spec. Table 3Compound SOP
UJ PFAS_DI_Prep0.060PQL
GW0619-MW-31 06/18/2019 320-51609-1 2-(N-ethyl perfluoro-1-octanesulfonamido)-ethanol
0.060 ug/L Cl. Spec. Table 3Compound SOP
UJ PFAS_DI_Prep0.060PQL
GW0619-MW-31 06/18/2019 320-51609-1 2-(N-ethyl perfluoro-1-octanesulfonamido)-ethanol
0.060 ug/L Cl. Spec. Table 3Compound SOP
UJ PFAS_DI_Prep0.060PQL
GW0619-MW-31 06/18/2019 320-51609-1 2-(N-methyl perfluoro-1-octanesulfonamido)-ethanol
0.11 ug/L Cl. Spec. Table 3Compound SOP
UJ PFAS_DI_Prep0.11PQL
GW0619-MW-31 06/18/2019 320-51609-1 2-(N-methyl perfluoro-1-octanesulfonamido)-ethanol
0.11 ug/L Cl. Spec. Table 3Compound SOP
UJ PFAS_DI_Prep0.11PQL
GW0619-MW-31 06/18/2019 320-51609-1 N-methyl perfluoro-1-octanesulfonamide
0.035 ug/L Cl. Spec. Table 3Compound SOP
UJ PFAS_DI_Prep0.035PQL
Page 9 of 29

The analysis hold time for this sample was exceeded. The reporting limit may be biased low.
LABSTATSValidation Options:
Validation Reason
FayettevilleSite: Sampling Program: Regenesis Phase 1 Post 6/19
AnalyticalMethodAnalyte
DateSampled PQL
ValidationQualifierLab Sample ID Pre-prepMDLResult TypeField Sample ID PrepUnits
GW0619-MW-31 06/18/2019 320-51609-1 N-methyl perfluoro-1-octanesulfonamide
0.035 ug/L Cl. Spec. Table 3Compound SOP
UJ PFAS_DI_Prep0.035PQL
GW0619-MW-31 06/18/2019 320-51609-1 PES 0.046 UG/L Cl. Spec. Table 3Compound SOP
UJ PFAS_DI_Prep0.046PQL
GW0619-MW-31 06/18/2019 320-51609-1 PES 0.046 UG/L Cl. Spec. Table 3Compound SOP
UJ PFAS_DI_Prep0.046PQL
GW0619-MW-31 06/18/2019 320-51609-1 N-ethylperfluoro-1-octanesulfonamide
0.037 UG/L Cl. Spec. Table 3Compound SOP
UJ PFAS_DI_Prep0.037PQL
GW0619-MW-31 06/18/2019 320-51609-1 N-ethylperfluoro-1-octanesulfonamide
0.037 UG/L Cl. Spec. Table 3Compound SOP
UJ PFAS_DI_Prep0.037PQL
GW0619-MW-31 06/18/2019 320-51609-1 PFECA-G 0.041 UG/L Cl. Spec. Table 3Compound SOP
UJ PFAS_DI_Prep0.041PQL
GW0619-MW-31 06/18/2019 320-51609-1 PFECA-G 0.041 UG/L Cl. Spec. Table 3Compound SOP
UJ PFAS_DI_Prep0.041PQL
GW0619-MW-31 06/18/2019 320-51609-1 EVE Acid 0.024 UG/L Cl. Spec. Table 3Compound SOP
UJ PFAS_DI_Prep0.024PQL
GW0619-MW-31 06/18/2019 320-51609-1 EVE Acid 0.024 UG/L Cl. Spec. Table 3Compound SOP
UJ PFAS_DI_Prep0.024PQL
GW0619-MW-31 06/18/2019 320-51609-1 Byproduct 6 0.015 UG/L Cl. Spec. Table 3Compound SOP
UJ PFAS_DI_Prep0.015PQL
GW0619-MW-31 06/18/2019 320-51609-1 Byproduct 6 0.015 UG/L Cl. Spec. Table 3Compound SOP
UJ PFAS_DI_Prep0.015PQL
GW0619-MW-32 06/18/2019 320-51609-2 PFECA B 0.060 UG/L Cl. Spec. Table 3Compound SOP
UJ PFAS_DI_Prep0.060PQL
GW0619-MW-32 06/18/2019 320-51609-2 PFECA B 0.060 UG/L Cl. Spec. Table 3Compound SOP
UJ PFAS_DI_Prep0.060PQL
GW0619-MW-32 06/18/2019 320-51609-2 2-(N-ethyl perfluoro-1-octanesulfonamido)-ethanol
0.060 ug/L Cl. Spec. Table 3Compound SOP
UJ PFAS_DI_Prep0.060PQL
GW0619-MW-32 06/18/2019 320-51609-2 2-(N-ethyl perfluoro-1-octanesulfonamido)-ethanol
0.060 ug/L Cl. Spec. Table 3Compound SOP
UJ PFAS_DI_Prep0.060PQL
GW0619-MW-32 06/18/2019 320-51609-2 2-(N-methyl perfluoro-1-octanesulfonamido)-
0.11 ug/L Cl. Spec. Table 3Compound SOP
UJ PFAS_DI_Prep0.11PQL
Page 10 of 29

The analysis hold time for this sample was exceeded. The reporting limit may be biased low.
LABSTATSValidation Options:
Validation Reason
FayettevilleSite: Sampling Program: Regenesis Phase 1 Post 6/19
AnalyticalMethodAnalyte
DateSampled PQL
ValidationQualifierLab Sample ID Pre-prepMDLResult TypeField Sample ID PrepUnits
ethanol
GW0619-MW-32 06/18/2019 320-51609-2 2-(N-methyl perfluoro-1-octanesulfonamido)-ethanol
0.11 ug/L Cl. Spec. Table 3Compound SOP
UJ PFAS_DI_Prep0.11PQL
GW0619-MW-32 06/18/2019 320-51609-2 N-methyl perfluoro-1-octanesulfonamide
0.035 ug/L Cl. Spec. Table 3Compound SOP
UJ PFAS_DI_Prep0.035PQL
GW0619-MW-32 06/18/2019 320-51609-2 N-methyl perfluoro-1-octanesulfonamide
0.035 ug/L Cl. Spec. Table 3Compound SOP
UJ PFAS_DI_Prep0.035PQL
GW0619-MW-32 06/18/2019 320-51609-2 PES 0.046 UG/L Cl. Spec. Table 3Compound SOP
UJ PFAS_DI_Prep0.046PQL
GW0619-MW-32 06/18/2019 320-51609-2 PES 0.046 UG/L Cl. Spec. Table 3Compound SOP
UJ PFAS_DI_Prep0.046PQL
GW0619-MW-32 06/18/2019 320-51609-2 N-ethylperfluoro-1-octanesulfonamide
0.037 UG/L Cl. Spec. Table 3Compound SOP
UJ PFAS_DI_Prep0.037PQL
GW0619-MW-32 06/18/2019 320-51609-2 N-ethylperfluoro-1-octanesulfonamide
0.037 UG/L Cl. Spec. Table 3Compound SOP
UJ PFAS_DI_Prep0.037PQL
GW0619-MW-32 06/18/2019 320-51609-2 PFECA-G 0.041 UG/L Cl. Spec. Table 3Compound SOP
UJ PFAS_DI_Prep0.041PQL
GW0619-MW-32 06/18/2019 320-51609-2 PFECA-G 0.041 UG/L Cl. Spec. Table 3Compound SOP
UJ PFAS_DI_Prep0.041PQL
GW0619-MW-33 06/18/2019 320-51609-3 PFECA B 0.060 UG/L Cl. Spec. Table 3Compound SOP
UJ PFAS_DI_Prep0.060PQL
GW0619-MW-33 06/18/2019 320-51609-3 PFECA B 0.060 UG/L Cl. Spec. Table 3Compound SOP
UJ PFAS_DI_Prep0.060PQL
GW0619-MW-33 06/18/2019 320-51609-3 2-(N-ethyl perfluoro-1-octanesulfonamido)-ethanol
0.060 ug/L Cl. Spec. Table 3Compound SOP
UJ PFAS_DI_Prep0.060PQL
GW0619-MW-33 06/18/2019 320-51609-3 2-(N-ethyl perfluoro-1-octanesulfonamido)-ethanol
0.060 ug/L Cl. Spec. Table 3Compound SOP
UJ PFAS_DI_Prep0.060PQL
GW0619-MW-33 06/18/2019 320-51609-3 2-(N-methyl perfluoro-1-octanesulfonamido)-ethanol
0.11 ug/L Cl. Spec. Table 3Compound SOP
UJ PFAS_DI_Prep0.11PQL
GW0619-MW-33 06/18/2019 320-51609-3 2-(N-methyl perfluoro-1-
0.11 ug/L Cl. Spec. Table 3Compound
UJ PFAS_DI_Prep0.11PQL
Page 11 of 29

The analysis hold time for this sample was exceeded. The reporting limit may be biased low.
LABSTATSValidation Options:
Validation Reason
FayettevilleSite: Sampling Program: Regenesis Phase 1 Post 6/19
AnalyticalMethodAnalyte
DateSampled PQL
ValidationQualifierLab Sample ID Pre-prepMDLResult TypeField Sample ID PrepUnits
octanesulfonamido)-ethanol
SOP
GW0619-MW-33 06/18/2019 320-51609-3 N-methyl perfluoro-1-octanesulfonamide
0.035 ug/L Cl. Spec. Table 3Compound SOP
UJ PFAS_DI_Prep0.035PQL
GW0619-MW-33 06/18/2019 320-51609-3 N-methyl perfluoro-1-octanesulfonamide
0.035 ug/L Cl. Spec. Table 3Compound SOP
UJ PFAS_DI_Prep0.035PQL
GW0619-MW-33 06/18/2019 320-51609-3 PES 0.046 UG/L Cl. Spec. Table 3Compound SOP
UJ PFAS_DI_Prep0.046PQL
GW0619-MW-33 06/18/2019 320-51609-3 PES 0.046 UG/L Cl. Spec. Table 3Compound SOP
UJ PFAS_DI_Prep0.046PQL
GW0619-MW-33 06/18/2019 320-51609-3 N-ethylperfluoro-1-octanesulfonamide
0.037 UG/L Cl. Spec. Table 3Compound SOP
UJ PFAS_DI_Prep0.037PQL
GW0619-MW-33 06/18/2019 320-51609-3 N-ethylperfluoro-1-octanesulfonamide
0.037 UG/L Cl. Spec. Table 3Compound SOP
UJ PFAS_DI_Prep0.037PQL
GW0619-MW-33 06/18/2019 320-51609-3 PFECA-G 0.041 UG/L Cl. Spec. Table 3Compound SOP
UJ PFAS_DI_Prep0.041PQL
GW0619-MW-33 06/18/2019 320-51609-3 PFECA-G 0.041 UG/L Cl. Spec. Table 3Compound SOP
UJ PFAS_DI_Prep0.041PQL
GW0619-MW-33 06/18/2019 320-51609-3 EVE Acid 0.024 UG/L Cl. Spec. Table 3Compound SOP
UJ PFAS_DI_Prep0.024PQL
GW0619-MW-33 06/18/2019 320-51609-3 EVE Acid 0.024 UG/L Cl. Spec. Table 3Compound SOP
UJ PFAS_DI_Prep0.024PQL
GW0619-MW-33 06/18/2019 320-51609-3 Byproduct 6 0.015 UG/L Cl. Spec. Table 3Compound SOP
UJ PFAS_DI_Prep0.015PQL
GW0619-MW-33 06/18/2019 320-51609-3 Byproduct 6 0.015 UG/L Cl. Spec. Table 3Compound SOP
UJ PFAS_DI_Prep0.015PQL
GW0619-MW-33D 06/18/2019 320-51609-4 PFECA B 0.12 UG/L Cl. Spec. Table 3Compound SOP
UJ PFAS_DI_Prep0.12PQL
GW0619-MW-33D 06/18/2019 320-51609-4 PFECA B 0.12 UG/L Cl. Spec. Table 3Compound SOP
UJ PFAS_DI_Prep0.12PQL
GW0619-MW-33D 06/18/2019 320-51609-4 2-(N-ethyl perfluoro-1-octanesulfonamido)-ethanol
0.12 ug/L Cl. Spec. Table 3Compound SOP
UJ PFAS_DI_Prep0.12PQL
GW0619-MW-33D 06/18/2019 320-51609-4 2-(N-ethyl perfluoro-1- 0.12 ug/L Cl. Spec. Table 3Compound
UJ PFAS_DI_Prep0.12PQL
Page 12 of 29

The analysis hold time for this sample was exceeded. The reporting limit may be biased low.
LABSTATSValidation Options:
Validation Reason
FayettevilleSite: Sampling Program: Regenesis Phase 1 Post 6/19
AnalyticalMethodAnalyte
DateSampled PQL
ValidationQualifierLab Sample ID Pre-prepMDLResult TypeField Sample ID PrepUnits
octanesulfonamido)-ethanol
SOP
GW0619-MW-33D 06/18/2019 320-51609-4 2-(N-methyl perfluoro-1-octanesulfonamido)-ethanol
0.22 ug/L Cl. Spec. Table 3Compound SOP
UJ PFAS_DI_Prep0.22PQL
GW0619-MW-33D 06/18/2019 320-51609-4 2-(N-methyl perfluoro-1-octanesulfonamido)-ethanol
0.22 ug/L Cl. Spec. Table 3Compound SOP
UJ PFAS_DI_Prep0.22PQL
GW0619-MW-36 06/18/2019 320-51608-2 PFESA-BP2 0.0030 ug/L Cl. Spec. Table 3Compound SOP
UJ PFAS_DI_Prep0.0030PQL
GW0619-MW-36 06/18/2019 320-51608-2 PFESA-BP2 0.0030 ug/L Cl. Spec. Table 3Compound SOP
UJ PFAS_DI_Prep0.0030PQL
GW0619-MW-36 06/18/2019 320-51608-2 Hydro-EVE Acid 0.0028 UG/L Cl. Spec. Table 3Compound SOP
UJ PFAS_DI_Prep0.0028PQL
GW0619-MW-36 06/18/2019 320-51608-2 Hydro-EVE Acid 0.0028 UG/L Cl. Spec. Table 3Compound SOP
UJ PFAS_DI_Prep0.0028PQL
GW0619-MW-36 06/18/2019 320-51608-2 PFECA-G 0.0041 UG/L Cl. Spec. Table 3Compound SOP
UJ PFAS_DI_Prep0.0041PQL
GW0619-MW-36 06/18/2019 320-51608-2 PFECA-G 0.0041 UG/L Cl. Spec. Table 3Compound SOP
UJ PFAS_DI_Prep0.0041PQL
GW0619-MW-36 06/18/2019 320-51608-2 R-EVE 0.0070 UG/L Cl. Spec. Table 3Compound SOP
UJ PFAS_DI_Prep0.0070PQL
GW0619-MW-36 06/18/2019 320-51608-2 R-EVE 0.0070 UG/L Cl. Spec. Table 3Compound SOP
UJ PFAS_DI_Prep0.0070PQL
GW0619-MW-36 06/18/2019 320-51608-2 Byproduct 4 0.016 UG/L Cl. Spec. Table 3Compound SOP
UJ PFAS_DI_Prep0.016PQL
GW0619-MW-36 06/18/2019 320-51608-2 Byproduct 4 0.016 UG/L Cl. Spec. Table 3Compound SOP
UJ PFAS_DI_Prep0.016PQL
GW0619-MW-36 06/18/2019 320-51608-2 Byproduct 5 0.0058 UG/L Cl. Spec. Table 3Compound SOP
UJ PFAS_DI_Prep0.0058PQL
GW0619-MW-36 06/18/2019 320-51608-2 Byproduct 5 0.0058 UG/L Cl. Spec. Table 3Compound SOP
UJ PFAS_DI_Prep0.0058PQL
GW0619-MW-36 06/18/2019 320-51608-2 Byproduct 6 0.0020 UG/L Cl. Spec. Table 3Compound SOP
UJ PFAS_DI_Prep0.0020PQL
Page 13 of 29

The analysis hold time for this sample was exceeded. The reporting limit may be biased low.
LABSTATSValidation Options:
Validation Reason
FayettevilleSite: Sampling Program: Regenesis Phase 1 Post 6/19
AnalyticalMethodAnalyte
DateSampled PQL
ValidationQualifierLab Sample ID Pre-prepMDLResult TypeField Sample ID PrepUnits
GW0619-MW-36 06/18/2019 320-51608-2 Byproduct 6 0.0020 UG/L Cl. Spec. Table 3Compound SOP
UJ PFAS_DI_Prep0.0020PQL
GW0619-MW-EB 06/18/2019 320-51607-2 NVHOS 0.0020 UG/L Cl. Spec. Table 3Compound SOP
UJ PFAS_DI_Prep0.0020PQL
GW0619-MW-EB 06/18/2019 320-51607-2 NVHOS 0.0020 UG/L Cl. Spec. Table 3Compound SOP
UJ PFAS_DI_Prep0.0020PQL
GW0619-MW-EB 06/18/2019 320-51607-2 PES 0.0020 UG/L Cl. Spec. Table 3Compound SOP
UJ PFAS_DI_Prep0.0020PQL
GW0619-MW-EB 06/18/2019 320-51607-2 PES 0.0020 UG/L Cl. Spec. Table 3Compound SOP
UJ PFAS_DI_Prep0.0020PQL
GW0619-MW-EB 06/18/2019 320-51607-2 PMPA 0.010 UG/L Cl. Spec. Table 3Compound SOP
UJ PFAS_DI_Prep0.010PQL
GW0619-MW-EB 06/18/2019 320-51607-2 PMPA 0.010 UG/L Cl. Spec. Table 3Compound SOP
UJ PFAS_DI_Prep0.010PQL
GW0619-MW-EB 06/18/2019 320-51607-2 PFECA B 0.0020 UG/L Cl. Spec. Table 3Compound SOP
UJ PFAS_DI_Prep0.0020PQL
GW0619-MW-EB 06/18/2019 320-51607-2 PFECA B 0.0020 UG/L Cl. Spec. Table 3Compound SOP
UJ PFAS_DI_Prep0.0020PQL
GW0619-MW-EB 06/18/2019 320-51607-2 2-(N-ethyl perfluoro-1-octanesulfonamido)-ethanol
0.0020 ug/L Cl. Spec. Table 3Compound SOP
UJ PFAS_DI_Prep0.0020PQL
GW0619-MW-EB 06/18/2019 320-51607-2 2-(N-ethyl perfluoro-1-octanesulfonamido)-ethanol
0.0020 ug/L Cl. Spec. Table 3Compound SOP
UJ PFAS_DI_Prep0.0020PQL
GW0619-MW-EB 06/18/2019 320-51607-2 2-(N-methyl perfluoro-1-octanesulfonamido)-ethanol
0.0020 ug/L Cl. Spec. Table 3Compound SOP
UJ PFAS_DI_Prep0.0020PQL
GW0619-MW-EB 06/18/2019 320-51607-2 2-(N-methyl perfluoro-1-octanesulfonamido)-ethanol
0.0020 ug/L Cl. Spec. Table 3Compound SOP
UJ PFAS_DI_Prep0.0020PQL
GW0619-MW-EB 06/18/2019 320-51607-2 PEPA 0.020 UG/L Cl. Spec. Table 3Compound SOP
UJ PFAS_DI_Prep0.020PQL
GW0619-MW-EB 06/18/2019 320-51607-2 PEPA 0.020 UG/L Cl. Spec. Table 3Compound SOP
UJ PFAS_DI_Prep0.020PQL
Page 14 of 29

The analysis hold time for this sample was exceeded. The reporting limit may be biased low.
LABSTATSValidation Options:
Validation Reason
FayettevilleSite: Sampling Program: Regenesis Phase 1 Post 6/19
AnalyticalMethodAnalyte
DateSampled PQL
ValidationQualifierLab Sample ID Pre-prepMDLResult TypeField Sample ID PrepUnits
GW0619-MW-EB 06/18/2019 320-51607-2 PFESA-BP1 0.0020 UG/L Cl. Spec. Table 3Compound SOP
UJ PFAS_DI_Prep0.0020PQL
GW0619-MW-EB 06/18/2019 320-51607-2 PFESA-BP1 0.0020 UG/L Cl. Spec. Table 3Compound SOP
UJ PFAS_DI_Prep0.0020PQL
GW0619-MW-EB 06/18/2019 320-51607-2 N-methyl perfluoro-1-octanesulfonamide
0.0020 ug/L Cl. Spec. Table 3Compound SOP
UJ PFAS_DI_Prep0.0020PQL
GW0619-MW-EB 06/18/2019 320-51607-2 N-methyl perfluoro-1-octanesulfonamide
0.0020 ug/L Cl. Spec. Table 3Compound SOP
UJ PFAS_DI_Prep0.0020PQL
GW0619-MW-EB 06/18/2019 320-51607-2 PFO2HxA 0.0020 ug/L Cl. Spec. Table 3Compound SOP
UJ PFAS_DI_Prep0.0020PQL
GW0619-MW-EB 06/18/2019 320-51607-2 PFO2HxA 0.0020 ug/L Cl. Spec. Table 3Compound SOP
UJ PFAS_DI_Prep0.0020PQL
GW0619-MW-EB 06/18/2019 320-51607-2 PFO3OA 0.0020 ug/L Cl. Spec. Table 3Compound SOP
UJ PFAS_DI_Prep0.0020PQL
GW0619-MW-EB 06/18/2019 320-51607-2 PFO3OA 0.0020 ug/L Cl. Spec. Table 3Compound SOP
UJ PFAS_DI_Prep0.0020PQL
GW0619-MW-EB 06/18/2019 320-51607-2 PFO4DA 0.0020 ug/L Cl. Spec. Table 3Compound SOP
UJ PFAS_DI_Prep0.0020PQL
GW0619-MW-EB 06/18/2019 320-51607-2 PFO4DA 0.0020 ug/L Cl. Spec. Table 3Compound SOP
UJ PFAS_DI_Prep0.0020PQL
GW0619-MW-EB 06/18/2019 320-51607-2 PFO5DA 0.0020 ug/L Cl. Spec. Table 3Compound SOP
UJ PFAS_DI_Prep0.0020PQL
GW0619-MW-EB 06/18/2019 320-51607-2 PFO5DA 0.0020 ug/L Cl. Spec. Table 3Compound SOP
UJ PFAS_DI_Prep0.0020PQL
GW0619-MW-EB 06/18/2019 320-51607-2 N-ethylperfluoro-1-octanesulfonamide
0.0020 UG/L Cl. Spec. Table 3Compound SOP
UJ PFAS_DI_Prep0.0020PQL
GW0619-MW-EB 06/18/2019 320-51607-2 N-ethylperfluoro-1-octanesulfonamide
0.0020 UG/L Cl. Spec. Table 3Compound SOP
UJ PFAS_DI_Prep0.0020PQL
GW0619-MW-EB 06/18/2019 320-51607-2 PFMOAA 0.0050 ug/L Cl. Spec. Table 3Compound SOP
UJ PFAS_DI_Prep0.0050PQL
GW0619-MW-EB 06/18/2019 320-51607-2 PFMOAA 0.0050 ug/L Cl. Spec. Table 3Compound SOP
UJ PFAS_DI_Prep0.0050PQL
GW0619-MW-EB 06/18/2019 320-51607-2 EVE Acid 0.0020 UG/L Cl. Spec. Table 3Compound SOP
UJ PFAS_DI_Prep0.0020PQL
Page 15 of 29

The analysis hold time for this sample was exceeded. The reporting limit may be biased low.
LABSTATSValidation Options:
Validation Reason
FayettevilleSite: Sampling Program: Regenesis Phase 1 Post 6/19
AnalyticalMethodAnalyte
DateSampled PQL
ValidationQualifierLab Sample ID Pre-prepMDLResult TypeField Sample ID PrepUnits
GW0619-MW-EB 06/18/2019 320-51607-2 EVE Acid 0.0020 UG/L Cl. Spec. Table 3Compound SOP
UJ PFAS_DI_Prep0.0020PQL
GW0619-MW-EB 06/18/2019 320-51607-2 PFESA-BP2 0.0020 ug/L Cl. Spec. Table 3Compound SOP
UJ PFAS_DI_Prep0.0020PQL
GW0619-MW-EB 06/18/2019 320-51607-2 PFESA-BP2 0.0020 ug/L Cl. Spec. Table 3Compound SOP
UJ PFAS_DI_Prep0.0020PQL
GW0619-MW-EB 06/18/2019 320-51607-2 Hydro-EVE Acid 0.0020 UG/L Cl. Spec. Table 3Compound SOP
UJ PFAS_DI_Prep0.0020PQL
GW0619-MW-EB 06/18/2019 320-51607-2 Hydro-EVE Acid 0.0020 UG/L Cl. Spec. Table 3Compound SOP
UJ PFAS_DI_Prep0.0020PQL
GW0619-MW-EB 06/18/2019 320-51607-2 PFECA-G 0.0020 UG/L Cl. Spec. Table 3Compound SOP
UJ PFAS_DI_Prep0.0020PQL
GW0619-MW-EB 06/18/2019 320-51607-2 PFECA-G 0.0020 UG/L Cl. Spec. Table 3Compound SOP
UJ PFAS_DI_Prep0.0020PQL
GW0619-MW-EB 06/18/2019 320-51607-2 R-EVE 0.0020 UG/L Cl. Spec. Table 3Compound SOP
UJ PFAS_DI_Prep0.0020PQL
GW0619-MW-EB 06/18/2019 320-51607-2 R-EVE 0.0020 UG/L Cl. Spec. Table 3Compound SOP
UJ PFAS_DI_Prep0.0020PQL
GW0619-MW-EB 06/18/2019 320-51607-2 Byproduct 4 0.0020 UG/L Cl. Spec. Table 3Compound SOP
UJ PFAS_DI_Prep0.0020PQL
GW0619-MW-EB 06/18/2019 320-51607-2 Byproduct 4 0.0020 UG/L Cl. Spec. Table 3Compound SOP
UJ PFAS_DI_Prep0.0020PQL
GW0619-MW-EB 06/18/2019 320-51607-2 Byproduct 5 0.0020 UG/L Cl. Spec. Table 3Compound SOP
UJ PFAS_DI_Prep0.0020PQL
GW0619-MW-EB 06/18/2019 320-51607-2 Byproduct 5 0.0020 UG/L Cl. Spec. Table 3Compound SOP
UJ PFAS_DI_Prep0.0020PQL
GW0619-MW-EB 06/18/2019 320-51607-2 Byproduct 6 0.0020 UG/L Cl. Spec. Table 3Compound SOP
UJ PFAS_DI_Prep0.0020PQL
GW0619-MW-EB 06/18/2019 320-51607-2 Byproduct 6 0.0020 UG/L Cl. Spec. Table 3Compound SOP
UJ PFAS_DI_Prep0.0020PQL
GW0619-MW-36 06/18/2019 320-51608-2 EVE Acid 0.0024 UG/L Cl. Spec. Table 3Compound SOP
UJ PFAS_DI_Prep0.0024PQL
GW0619-MW-36 06/18/2019 320-51608-2 EVE Acid 0.0024 UG/L Cl. Spec. Table 3Compound SOP
UJ PFAS_DI_Prep0.0024PQL
Page 16 of 29
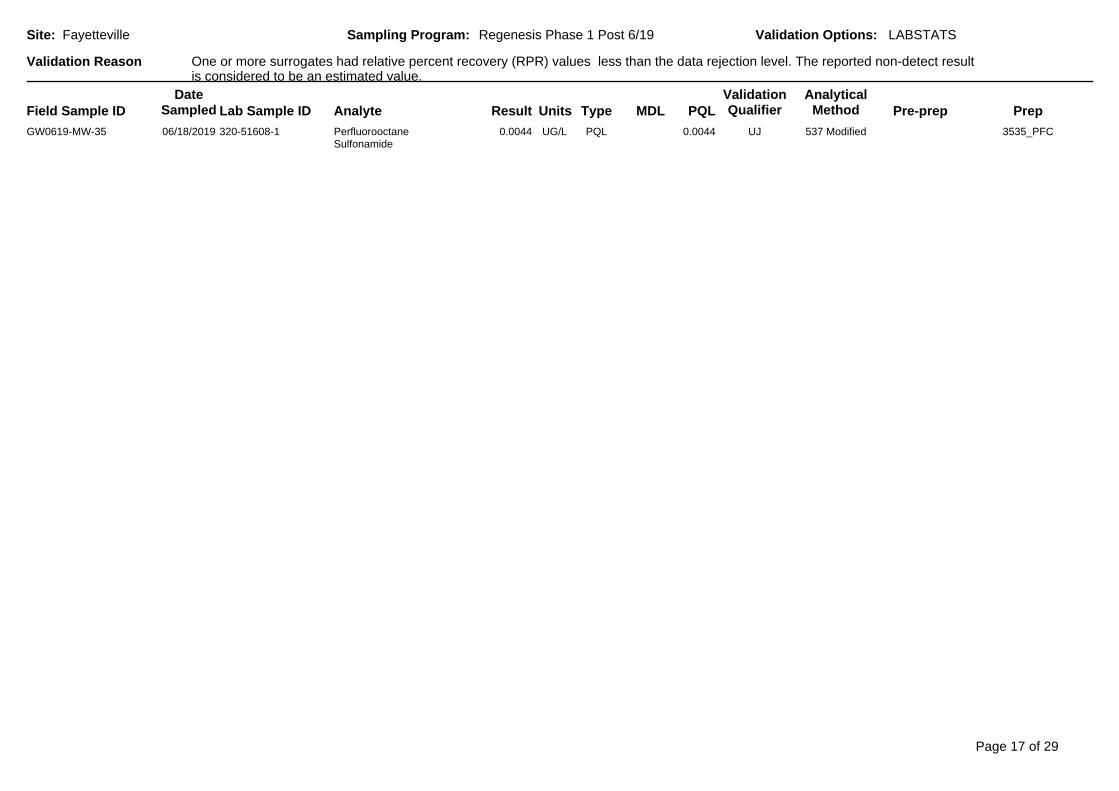
One or more surrogates had relative percent recovery (RPR) values less than the data rejection level. The reported non-detect result is considered to be an estimated value.
LABSTATSValidation Options:
Validation Reason
FayettevilleSite: Sampling Program: Regenesis Phase 1 Post 6/19
AnalyticalMethodAnalyte
DateSampled PQL
ValidationQualifierLab Sample ID Pre-prepMDLResult TypeField Sample ID PrepUnits
GW0619-MW-35 06/18/2019 320-51608-1 PerfluorooctaneSulfonamide
0.0044 UG/L 537 ModifiedUJ 3535_PFC0.0044PQL
Page 17 of 29

High relative percent difference (RPD) observed between field duplicate and parent sample. The reported result may be imprecise.
LABSTATSValidation Options:
Validation Reason
FayettevilleSite: Sampling Program: Regenesis Phase 1 Post 6/19
AnalyticalMethodAnalyte
DateSampled PQL
ValidationQualifierLab Sample ID Pre-prepMDLResult TypeField Sample ID PrepUnits
GW0619-MW-33 06/18/2019 320-51609-3 PFO5DA 0.20 ug/L Cl. Spec. Table 3Compound SOP
J PFAS_DI_Prep0.034PQL
GW0619-MW-33 06/18/2019 320-51609-3 PFO5DA 0.18 ug/L Cl. Spec. Table 3Compound SOP
J PFAS_DI_Prep0.034PQL
GW0619-MW-33D 06/18/2019 320-51609-4 PFO5DA 0.22 ug/L Cl. Spec. Table 3Compound SOP
J PFAS_DI_Prep0.067PQL
Page 18 of 29

Quality review criteria exceeded between the REP (laboratory replicate) and parent sample. The reported result may be imprecise.
LABSTATSValidation Options:
Validation Reason
FayettevilleSite: Sampling Program: Regenesis Phase 1 Post 6/19
AnalyticalMethodAnalyte
DateSampled PQL
ValidationQualifierLab Sample ID Pre-prepMDLResult TypeField Sample ID PrepUnits
GW0619-MW-33 06/18/2019 320-51609-3 PFMOAA 75 ug/L Cl. Spec. Table 3Compound SOP
J PFAS_DI_Prep0.21PQL
GW0619-MW-33 06/18/2019 320-51609-3 PFMOAA 65.0 ug/L Cl. Spec. Table 3Compound SOP
J PFAS_DI_Prep0.21PQL
GW0619-MW-33 06/18/2019 320-51609-3 PFO4DA 0.75 ug/L Cl. Spec. Table 3Compound SOP
J PFAS_DI_Prep0.079PQL
GW0619-MW-33 06/18/2019 320-51609-3 PFO4DA 0.85 ug/L Cl. Spec. Table 3Compound SOP
J PFAS_DI_Prep0.079PQL
GW0619-MW-32 06/18/2019 320-51609-2 PFO4DA 1.5 ug/L Cl. Spec. Table 3Compound SOP
J PFAS_DI_Prep0.079PQL
GW0619-MW-32 06/18/2019 320-51609-2 PFO4DA 1.7 ug/L Cl. Spec. Table 3Compound SOP
J PFAS_DI_Prep0.079PQL
Page 19 of 29
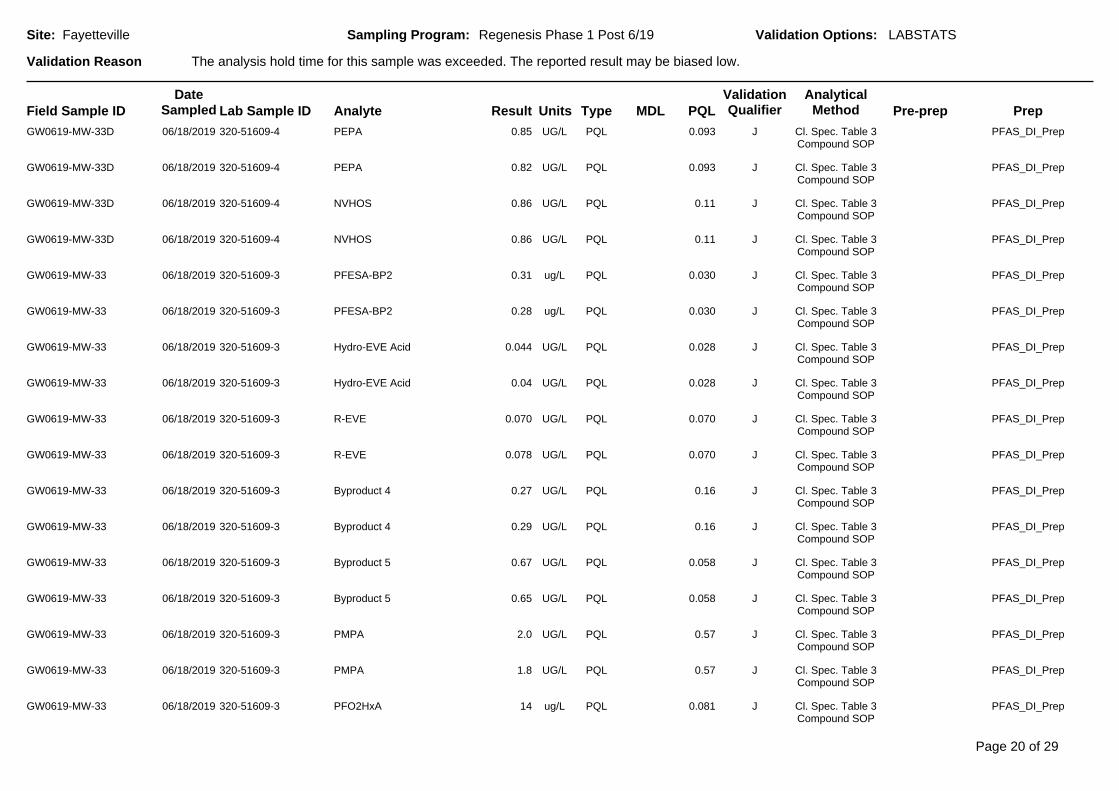
The analysis hold time for this sample was exceeded. The reported result may be biased low.
LABSTATSValidation Options:
Validation Reason
FayettevilleSite: Sampling Program: Regenesis Phase 1 Post 6/19
AnalyticalMethodAnalyte
DateSampled PQL
ValidationQualifierLab Sample ID Pre-prepMDLResult TypeField Sample ID PrepUnits
GW0619-MW-33D 06/18/2019 320-51609-4 PEPA 0.85 UG/L Cl. Spec. Table 3Compound SOP
J PFAS_DI_Prep0.093PQL
GW0619-MW-33D 06/18/2019 320-51609-4 PEPA 0.82 UG/L Cl. Spec. Table 3Compound SOP
J PFAS_DI_Prep0.093PQL
GW0619-MW-33D 06/18/2019 320-51609-4 NVHOS 0.86 UG/L Cl. Spec. Table 3Compound SOP
J PFAS_DI_Prep0.11PQL
GW0619-MW-33D 06/18/2019 320-51609-4 NVHOS 0.86 UG/L Cl. Spec. Table 3Compound SOP
J PFAS_DI_Prep0.11PQL
GW0619-MW-33 06/18/2019 320-51609-3 PFESA-BP2 0.31 ug/L Cl. Spec. Table 3Compound SOP
J PFAS_DI_Prep0.030PQL
GW0619-MW-33 06/18/2019 320-51609-3 PFESA-BP2 0.28 ug/L Cl. Spec. Table 3Compound SOP
J PFAS_DI_Prep0.030PQL
GW0619-MW-33 06/18/2019 320-51609-3 Hydro-EVE Acid 0.044 UG/L Cl. Spec. Table 3Compound SOP
J PFAS_DI_Prep0.028PQL
GW0619-MW-33 06/18/2019 320-51609-3 Hydro-EVE Acid 0.04 UG/L Cl. Spec. Table 3Compound SOP
J PFAS_DI_Prep0.028PQL
GW0619-MW-33 06/18/2019 320-51609-3 R-EVE 0.070 UG/L Cl. Spec. Table 3Compound SOP
J PFAS_DI_Prep0.070PQL
GW0619-MW-33 06/18/2019 320-51609-3 R-EVE 0.078 UG/L Cl. Spec. Table 3Compound SOP
J PFAS_DI_Prep0.070PQL
GW0619-MW-33 06/18/2019 320-51609-3 Byproduct 4 0.27 UG/L Cl. Spec. Table 3Compound SOP
J PFAS_DI_Prep0.16PQL
GW0619-MW-33 06/18/2019 320-51609-3 Byproduct 4 0.29 UG/L Cl. Spec. Table 3Compound SOP
J PFAS_DI_Prep0.16PQL
GW0619-MW-33 06/18/2019 320-51609-3 Byproduct 5 0.67 UG/L Cl. Spec. Table 3Compound SOP
J PFAS_DI_Prep0.058PQL
GW0619-MW-33 06/18/2019 320-51609-3 Byproduct 5 0.65 UG/L Cl. Spec. Table 3Compound SOP
J PFAS_DI_Prep0.058PQL
GW0619-MW-33 06/18/2019 320-51609-3 PMPA 2.0 UG/L Cl. Spec. Table 3Compound SOP
J PFAS_DI_Prep0.57PQL
GW0619-MW-33 06/18/2019 320-51609-3 PMPA 1.8 UG/L Cl. Spec. Table 3Compound SOP
J PFAS_DI_Prep0.57PQL
GW0619-MW-33 06/18/2019 320-51609-3 PFO2HxA 14 ug/L Cl. Spec. Table 3Compound SOP
J PFAS_DI_Prep0.081PQL
Page 20 of 29

The analysis hold time for this sample was exceeded. The reported result may be biased low.
LABSTATSValidation Options:
Validation Reason
FayettevilleSite: Sampling Program: Regenesis Phase 1 Post 6/19
AnalyticalMethodAnalyte
DateSampled PQL
ValidationQualifierLab Sample ID Pre-prepMDLResult TypeField Sample ID PrepUnits
GW0619-MW-33 06/18/2019 320-51609-3 PFO2HxA 13.0 ug/L Cl. Spec. Table 3Compound SOP
J PFAS_DI_Prep0.081PQL
GW0619-MW-33 06/18/2019 320-51609-3 PFO3OA 3.3 ug/L Cl. Spec. Table 3Compound SOP
J PFAS_DI_Prep0.058PQL
GW0619-MW-33 06/18/2019 320-51609-3 PFO3OA 3.1 ug/L Cl. Spec. Table 3Compound SOP
J PFAS_DI_Prep0.058PQL
GW0619-MW-33 06/18/2019 320-51609-3 PEPA 0.84 UG/L Cl. Spec. Table 3Compound SOP
J PFAS_DI_Prep0.047PQL
GW0619-MW-33 06/18/2019 320-51609-3 PEPA 0.76 UG/L Cl. Spec. Table 3Compound SOP
J PFAS_DI_Prep0.047PQL
GW0619-MW-33 06/18/2019 320-51609-3 PFESA-BP1 0.034 UG/L Cl. Spec. Table 3Compound SOP
J PFAS_DI_Prep0.027PQL
GW0619-MW-33 06/18/2019 320-51609-3 PFESA-BP1 0.033 UG/L Cl. Spec. Table 3Compound SOP
J PFAS_DI_Prep0.027PQL
GW0619-MW-32 06/18/2019 320-51609-2 R-EVE 0.089 UG/L Cl. Spec. Table 3Compound SOP
J PFAS_DI_Prep0.070PQL
GW0619-MW-32 06/18/2019 320-51609-2 R-EVE 0.098 UG/L Cl. Spec. Table 3Compound SOP
J PFAS_DI_Prep0.070PQL
GW0619-MW-32 06/18/2019 320-51609-2 Byproduct 4 0.44 UG/L Cl. Spec. Table 3Compound SOP
J PFAS_DI_Prep0.16PQL
GW0619-MW-32 06/18/2019 320-51609-2 Byproduct 4 0.46 UG/L Cl. Spec. Table 3Compound SOP
J PFAS_DI_Prep0.16PQL
GW0619-MW-32 06/18/2019 320-51609-2 Byproduct 5 1.2 UG/L Cl. Spec. Table 3Compound SOP
J PFAS_DI_Prep0.058PQL
GW0619-MW-32 06/18/2019 320-51609-2 Byproduct 5 1.2 UG/L Cl. Spec. Table 3Compound SOP
J PFAS_DI_Prep0.058PQL
GW0619-MW-32 06/18/2019 320-51609-2 Byproduct 6 0.017 UG/L Cl. Spec. Table 3Compound SOP
J PFAS_DI_Prep0.015PQL
GW0619-MW-32 06/18/2019 320-51609-2 Byproduct 6 0.017 UG/L Cl. Spec. Table 3Compound SOP
J PFAS_DI_Prep0.015PQL
GW0619-MW-33 06/18/2019 320-51609-3 NVHOS 0.88 UG/L Cl. Spec. Table 3Compound SOP
J PFAS_DI_Prep0.054PQL
GW0619-MW-33 06/18/2019 320-51609-3 NVHOS 0.81 UG/L Cl. Spec. Table 3Compound SOP
J PFAS_DI_Prep0.054PQL
Page 21 of 29

The analysis hold time for this sample was exceeded. The reported result may be biased low.
LABSTATSValidation Options:
Validation Reason
FayettevilleSite: Sampling Program: Regenesis Phase 1 Post 6/19
AnalyticalMethodAnalyte
DateSampled PQL
ValidationQualifierLab Sample ID Pre-prepMDLResult TypeField Sample ID PrepUnits
GW0619-MW-32 06/18/2019 320-51609-2 PFMOAA 146 ug/L Cl. Spec. Table 3Compound SOP
J PFAS_DI_Prep0.21PQL
GW0619-MW-32 06/18/2019 320-51609-2 PFMOAA 140.0 ug/L Cl. Spec. Table 3Compound SOP
J PFAS_DI_Prep0.21PQL
GW0619-MW-32 06/18/2019 320-51609-2 EVE Acid 0.025 UG/L Cl. Spec. Table 3Compound SOP
J PFAS_DI_Prep0.024PQL
GW0619-MW-32 06/18/2019 320-51609-2 EVE Acid 0.026 UG/L Cl. Spec. Table 3Compound SOP
J PFAS_DI_Prep0.024PQL
GW0619-MW-32 06/18/2019 320-51609-2 PFESA-BP2 0.51 ug/L Cl. Spec. Table 3Compound SOP
J PFAS_DI_Prep0.030PQL
GW0619-MW-32 06/18/2019 320-51609-2 PFESA-BP2 0.5 ug/L Cl. Spec. Table 3Compound SOP
J PFAS_DI_Prep0.030PQL
GW0619-MW-32 06/18/2019 320-51609-2 Hydro-EVE Acid 0.081 UG/L Cl. Spec. Table 3Compound SOP
J PFAS_DI_Prep0.028PQL
GW0619-MW-32 06/18/2019 320-51609-2 Hydro-EVE Acid 0.078 UG/L Cl. Spec. Table 3Compound SOP
J PFAS_DI_Prep0.028PQL
GW0619-MW-31 06/18/2019 320-51609-1 NVHOS 0.76 UG/L Cl. Spec. Table 3Compound SOP
J PFAS_DI_Prep0.054PQL
GW0619-MW-31 06/18/2019 320-51609-1 NVHOS 0.77 UG/L Cl. Spec. Table 3Compound SOP
J PFAS_DI_Prep0.054PQL
GW0619-MW-32 06/18/2019 320-51609-2 PMPA 2.4 UG/L Cl. Spec. Table 3Compound SOP
J PFAS_DI_Prep0.57PQL
GW0619-MW-32 06/18/2019 320-51609-2 PMPA 2.4 UG/L Cl. Spec. Table 3Compound SOP
J PFAS_DI_Prep0.57PQL
GW0619-MW-32 06/18/2019 320-51609-2 PFO2HxA 27 ug/L Cl. Spec. Table 3Compound SOP
J PFAS_DI_Prep0.081PQL
GW0619-MW-32 06/18/2019 320-51609-2 PFO2HxA 27.0 ug/L Cl. Spec. Table 3Compound SOP
J PFAS_DI_Prep0.081PQL
GW0619-MW-32 06/18/2019 320-51609-2 PFO3OA 6.7 ug/L Cl. Spec. Table 3Compound SOP
J PFAS_DI_Prep0.058PQL
GW0619-MW-32 06/18/2019 320-51609-2 PFO3OA 7.0 ug/L Cl. Spec. Table 3Compound SOP
J PFAS_DI_Prep0.058PQL
GW0619-MW-32 06/18/2019 320-51609-2 PFO5DA 0.33 ug/L Cl. Spec. Table 3Compound SOP
J PFAS_DI_Prep0.034PQL
Page 22 of 29
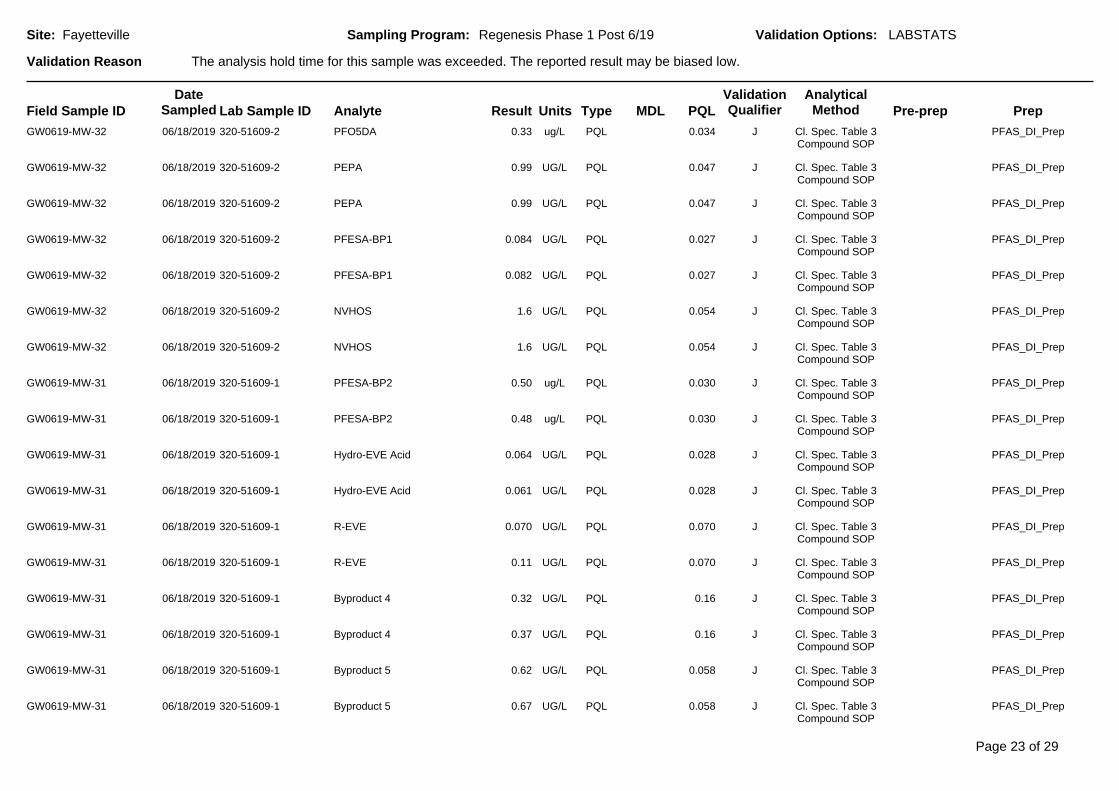
The analysis hold time for this sample was exceeded. The reported result may be biased low.
LABSTATSValidation Options:
Validation Reason
FayettevilleSite: Sampling Program: Regenesis Phase 1 Post 6/19
AnalyticalMethodAnalyte
DateSampled PQL
ValidationQualifierLab Sample ID Pre-prepMDLResult TypeField Sample ID PrepUnits
GW0619-MW-32 06/18/2019 320-51609-2 PFO5DA 0.33 ug/L Cl. Spec. Table 3Compound SOP
J PFAS_DI_Prep0.034PQL
GW0619-MW-32 06/18/2019 320-51609-2 PEPA 0.99 UG/L Cl. Spec. Table 3Compound SOP
J PFAS_DI_Prep0.047PQL
GW0619-MW-32 06/18/2019 320-51609-2 PEPA 0.99 UG/L Cl. Spec. Table 3Compound SOP
J PFAS_DI_Prep0.047PQL
GW0619-MW-32 06/18/2019 320-51609-2 PFESA-BP1 0.084 UG/L Cl. Spec. Table 3Compound SOP
J PFAS_DI_Prep0.027PQL
GW0619-MW-32 06/18/2019 320-51609-2 PFESA-BP1 0.082 UG/L Cl. Spec. Table 3Compound SOP
J PFAS_DI_Prep0.027PQL
GW0619-MW-32 06/18/2019 320-51609-2 NVHOS 1.6 UG/L Cl. Spec. Table 3Compound SOP
J PFAS_DI_Prep0.054PQL
GW0619-MW-32 06/18/2019 320-51609-2 NVHOS 1.6 UG/L Cl. Spec. Table 3Compound SOP
J PFAS_DI_Prep0.054PQL
GW0619-MW-31 06/18/2019 320-51609-1 PFESA-BP2 0.50 ug/L Cl. Spec. Table 3Compound SOP
J PFAS_DI_Prep0.030PQL
GW0619-MW-31 06/18/2019 320-51609-1 PFESA-BP2 0.48 ug/L Cl. Spec. Table 3Compound SOP
J PFAS_DI_Prep0.030PQL
GW0619-MW-31 06/18/2019 320-51609-1 Hydro-EVE Acid 0.064 UG/L Cl. Spec. Table 3Compound SOP
J PFAS_DI_Prep0.028PQL
GW0619-MW-31 06/18/2019 320-51609-1 Hydro-EVE Acid 0.061 UG/L Cl. Spec. Table 3Compound SOP
J PFAS_DI_Prep0.028PQL
GW0619-MW-31 06/18/2019 320-51609-1 R-EVE 0.070 UG/L Cl. Spec. Table 3Compound SOP
J PFAS_DI_Prep0.070PQL
GW0619-MW-31 06/18/2019 320-51609-1 R-EVE 0.11 UG/L Cl. Spec. Table 3Compound SOP
J PFAS_DI_Prep0.070PQL
GW0619-MW-31 06/18/2019 320-51609-1 Byproduct 4 0.32 UG/L Cl. Spec. Table 3Compound SOP
J PFAS_DI_Prep0.16PQL
GW0619-MW-31 06/18/2019 320-51609-1 Byproduct 4 0.37 UG/L Cl. Spec. Table 3Compound SOP
J PFAS_DI_Prep0.16PQL
GW0619-MW-31 06/18/2019 320-51609-1 Byproduct 5 0.62 UG/L Cl. Spec. Table 3Compound SOP
J PFAS_DI_Prep0.058PQL
GW0619-MW-31 06/18/2019 320-51609-1 Byproduct 5 0.67 UG/L Cl. Spec. Table 3Compound SOP
J PFAS_DI_Prep0.058PQL
Page 23 of 29

The analysis hold time for this sample was exceeded. The reported result may be biased low.
LABSTATSValidation Options:
Validation Reason
FayettevilleSite: Sampling Program: Regenesis Phase 1 Post 6/19
AnalyticalMethodAnalyte
DateSampled PQL
ValidationQualifierLab Sample ID Pre-prepMDLResult TypeField Sample ID PrepUnits
GW0619-MW-31 06/18/2019 320-51609-1 PFMOAA 70 ug/L Cl. Spec. Table 3Compound SOP
J PFAS_DI_Prep0.21PQL
GW0619-MW-31 06/18/2019 320-51609-1 PFMOAA 67.0 ug/L Cl. Spec. Table 3Compound SOP
J PFAS_DI_Prep0.21PQL
GW0619-MW-31 06/18/2019 320-51609-1 PMPA 4.3 UG/L Cl. Spec. Table 3Compound SOP
J PFAS_DI_Prep0.57PQL
GW0619-MW-31 06/18/2019 320-51609-1 PMPA 4.2 UG/L Cl. Spec. Table 3Compound SOP
J PFAS_DI_Prep0.57PQL
GW0619-MW-31 06/18/2019 320-51609-1 PFO2HxA 15 ug/L Cl. Spec. Table 3Compound SOP
J PFAS_DI_Prep0.081PQL
GW0619-MW-31 06/18/2019 320-51609-1 PFO2HxA 15.0 ug/L Cl. Spec. Table 3Compound SOP
J PFAS_DI_Prep0.081PQL
GW0619-MW-31 06/18/2019 320-51609-1 PFO3OA 3.4 ug/L Cl. Spec. Table 3Compound SOP
J PFAS_DI_Prep0.058PQL
GW0619-MW-31 06/18/2019 320-51609-1 PFO3OA 3.6 ug/L Cl. Spec. Table 3Compound SOP
J PFAS_DI_Prep0.058PQL
GW0619-MW-31 06/18/2019 320-51609-1 PFO4DA 0.88 ug/L Cl. Spec. Table 3Compound SOP
J PFAS_DI_Prep0.079PQL
GW0619-MW-31 06/18/2019 320-51609-1 PFO4DA 0.95 ug/L Cl. Spec. Table 3Compound SOP
J PFAS_DI_Prep0.079PQL
GW0619-MW-31 06/18/2019 320-51609-1 PFO5DA 0.40 ug/L Cl. Spec. Table 3Compound SOP
J PFAS_DI_Prep0.034PQL
GW0619-MW-31 06/18/2019 320-51609-1 PFO5DA 0.42 ug/L Cl. Spec. Table 3Compound SOP
J PFAS_DI_Prep0.034PQL
GW0619-MW-31 06/18/2019 320-51609-1 PEPA 1.8 UG/L Cl. Spec. Table 3Compound SOP
J PFAS_DI_Prep0.047PQL
GW0619-MW-31 06/18/2019 320-51609-1 PEPA 1.8 UG/L Cl. Spec. Table 3Compound SOP
J PFAS_DI_Prep0.047PQL
GW0619-MW-31 06/18/2019 320-51609-1 PFESA-BP1 0.038 UG/L Cl. Spec. Table 3Compound SOP
J PFAS_DI_Prep0.027PQL
GW0619-MW-31 06/18/2019 320-51609-1 PFESA-BP1 0.027 UG/L Cl. Spec. Table 3Compound SOP
J PFAS_DI_Prep0.027PQL
GW0619-MW-35 06/18/2019 320-51608-1 NVHOS 0.075 UG/L Cl. Spec. Table 3Compound SOP
J PFAS_DI_Prep0.0054PQL
Page 24 of 29
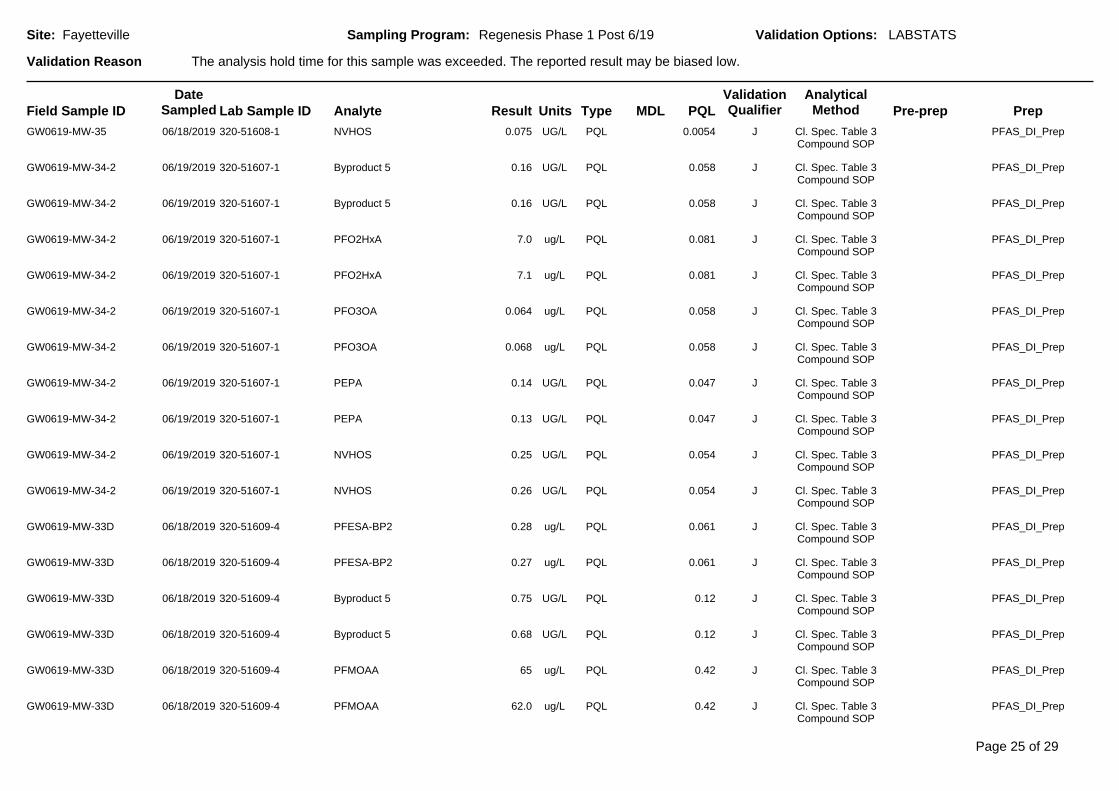
The analysis hold time for this sample was exceeded. The reported result may be biased low.
LABSTATSValidation Options:
Validation Reason
FayettevilleSite: Sampling Program: Regenesis Phase 1 Post 6/19
AnalyticalMethodAnalyte
DateSampled PQL
ValidationQualifierLab Sample ID Pre-prepMDLResult TypeField Sample ID PrepUnits
GW0619-MW-35 06/18/2019 320-51608-1 NVHOS 0.075 UG/L Cl. Spec. Table 3Compound SOP
J PFAS_DI_Prep0.0054PQL
GW0619-MW-34-2 06/19/2019 320-51607-1 Byproduct 5 0.16 UG/L Cl. Spec. Table 3Compound SOP
J PFAS_DI_Prep0.058PQL
GW0619-MW-34-2 06/19/2019 320-51607-1 Byproduct 5 0.16 UG/L Cl. Spec. Table 3Compound SOP
J PFAS_DI_Prep0.058PQL
GW0619-MW-34-2 06/19/2019 320-51607-1 PFO2HxA 7.0 ug/L Cl. Spec. Table 3Compound SOP
J PFAS_DI_Prep0.081PQL
GW0619-MW-34-2 06/19/2019 320-51607-1 PFO2HxA 7.1 ug/L Cl. Spec. Table 3Compound SOP
J PFAS_DI_Prep0.081PQL
GW0619-MW-34-2 06/19/2019 320-51607-1 PFO3OA 0.064 ug/L Cl. Spec. Table 3Compound SOP
J PFAS_DI_Prep0.058PQL
GW0619-MW-34-2 06/19/2019 320-51607-1 PFO3OA 0.068 ug/L Cl. Spec. Table 3Compound SOP
J PFAS_DI_Prep0.058PQL
GW0619-MW-34-2 06/19/2019 320-51607-1 PEPA 0.14 UG/L Cl. Spec. Table 3Compound SOP
J PFAS_DI_Prep0.047PQL
GW0619-MW-34-2 06/19/2019 320-51607-1 PEPA 0.13 UG/L Cl. Spec. Table 3Compound SOP
J PFAS_DI_Prep0.047PQL
GW0619-MW-34-2 06/19/2019 320-51607-1 NVHOS 0.25 UG/L Cl. Spec. Table 3Compound SOP
J PFAS_DI_Prep0.054PQL
GW0619-MW-34-2 06/19/2019 320-51607-1 NVHOS 0.26 UG/L Cl. Spec. Table 3Compound SOP
J PFAS_DI_Prep0.054PQL
GW0619-MW-33D 06/18/2019 320-51609-4 PFESA-BP2 0.28 ug/L Cl. Spec. Table 3Compound SOP
J PFAS_DI_Prep0.061PQL
GW0619-MW-33D 06/18/2019 320-51609-4 PFESA-BP2 0.27 ug/L Cl. Spec. Table 3Compound SOP
J PFAS_DI_Prep0.061PQL
GW0619-MW-33D 06/18/2019 320-51609-4 Byproduct 5 0.75 UG/L Cl. Spec. Table 3Compound SOP
J PFAS_DI_Prep0.12PQL
GW0619-MW-33D 06/18/2019 320-51609-4 Byproduct 5 0.68 UG/L Cl. Spec. Table 3Compound SOP
J PFAS_DI_Prep0.12PQL
GW0619-MW-33D 06/18/2019 320-51609-4 PFMOAA 65 ug/L Cl. Spec. Table 3Compound SOP
J PFAS_DI_Prep0.42PQL
GW0619-MW-33D 06/18/2019 320-51609-4 PFMOAA 62.0 ug/L Cl. Spec. Table 3Compound SOP
J PFAS_DI_Prep0.42PQL
Page 25 of 29
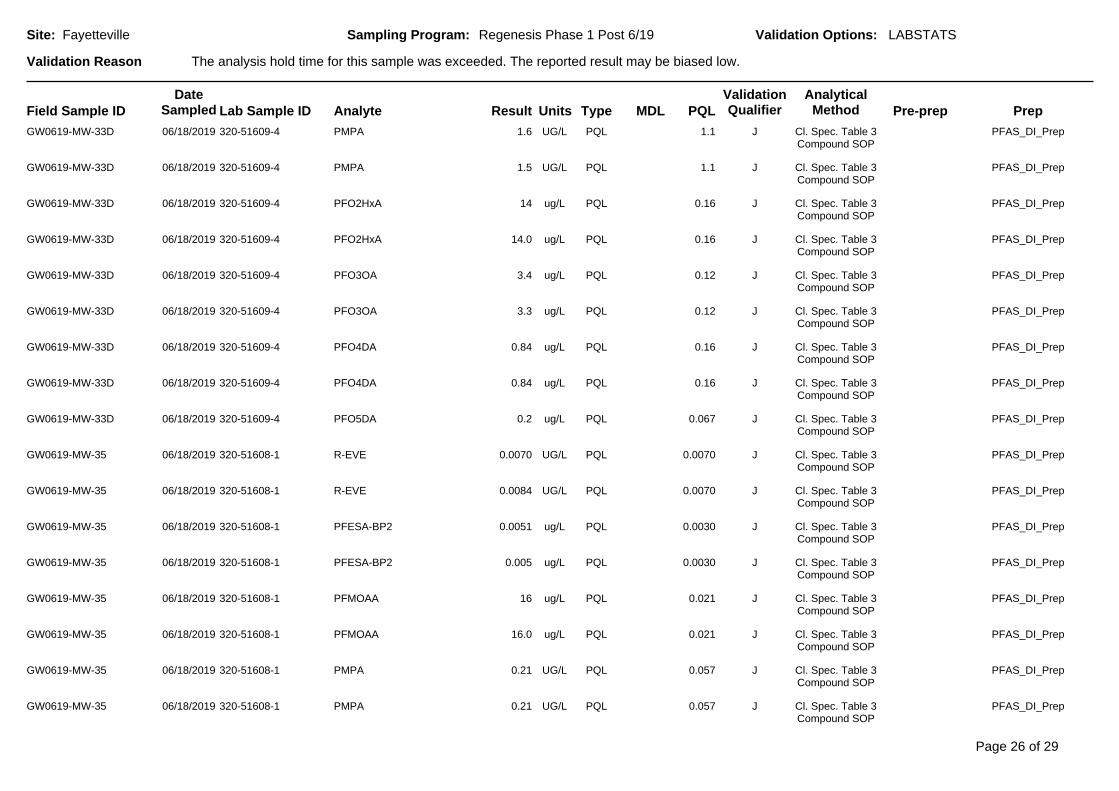
The analysis hold time for this sample was exceeded. The reported result may be biased low.
LABSTATSValidation Options:
Validation Reason
FayettevilleSite: Sampling Program: Regenesis Phase 1 Post 6/19
AnalyticalMethodAnalyte
DateSampled PQL
ValidationQualifierLab Sample ID Pre-prepMDLResult TypeField Sample ID PrepUnits
GW0619-MW-33D 06/18/2019 320-51609-4 PMPA 1.6 UG/L Cl. Spec. Table 3Compound SOP
J PFAS_DI_Prep1.1PQL
GW0619-MW-33D 06/18/2019 320-51609-4 PMPA 1.5 UG/L Cl. Spec. Table 3Compound SOP
J PFAS_DI_Prep1.1PQL
GW0619-MW-33D 06/18/2019 320-51609-4 PFO2HxA 14 ug/L Cl. Spec. Table 3Compound SOP
J PFAS_DI_Prep0.16PQL
GW0619-MW-33D 06/18/2019 320-51609-4 PFO2HxA 14.0 ug/L Cl. Spec. Table 3Compound SOP
J PFAS_DI_Prep0.16PQL
GW0619-MW-33D 06/18/2019 320-51609-4 PFO3OA 3.4 ug/L Cl. Spec. Table 3Compound SOP
J PFAS_DI_Prep0.12PQL
GW0619-MW-33D 06/18/2019 320-51609-4 PFO3OA 3.3 ug/L Cl. Spec. Table 3Compound SOP
J PFAS_DI_Prep0.12PQL
GW0619-MW-33D 06/18/2019 320-51609-4 PFO4DA 0.84 ug/L Cl. Spec. Table 3Compound SOP
J PFAS_DI_Prep0.16PQL
GW0619-MW-33D 06/18/2019 320-51609-4 PFO4DA 0.84 ug/L Cl. Spec. Table 3Compound SOP
J PFAS_DI_Prep0.16PQL
GW0619-MW-33D 06/18/2019 320-51609-4 PFO5DA 0.2 ug/L Cl. Spec. Table 3Compound SOP
J PFAS_DI_Prep0.067PQL
GW0619-MW-35 06/18/2019 320-51608-1 R-EVE 0.0070 UG/L Cl. Spec. Table 3Compound SOP
J PFAS_DI_Prep0.0070PQL
GW0619-MW-35 06/18/2019 320-51608-1 R-EVE 0.0084 UG/L Cl. Spec. Table 3Compound SOP
J PFAS_DI_Prep0.0070PQL
GW0619-MW-35 06/18/2019 320-51608-1 PFESA-BP2 0.0051 ug/L Cl. Spec. Table 3Compound SOP
J PFAS_DI_Prep0.0030PQL
GW0619-MW-35 06/18/2019 320-51608-1 PFESA-BP2 0.005 ug/L Cl. Spec. Table 3Compound SOP
J PFAS_DI_Prep0.0030PQL
GW0619-MW-35 06/18/2019 320-51608-1 PFMOAA 16 ug/L Cl. Spec. Table 3Compound SOP
J PFAS_DI_Prep0.021PQL
GW0619-MW-35 06/18/2019 320-51608-1 PFMOAA 16.0 ug/L Cl. Spec. Table 3Compound SOP
J PFAS_DI_Prep0.021PQL
GW0619-MW-35 06/18/2019 320-51608-1 PMPA 0.21 UG/L Cl. Spec. Table 3Compound SOP
J PFAS_DI_Prep0.057PQL
GW0619-MW-35 06/18/2019 320-51608-1 PMPA 0.21 UG/L Cl. Spec. Table 3Compound SOP
J PFAS_DI_Prep0.057PQL
Page 26 of 29

The analysis hold time for this sample was exceeded. The reported result may be biased low.
LABSTATSValidation Options:
Validation Reason
FayettevilleSite: Sampling Program: Regenesis Phase 1 Post 6/19
AnalyticalMethodAnalyte
DateSampled PQL
ValidationQualifierLab Sample ID Pre-prepMDLResult TypeField Sample ID PrepUnits
GW0619-MW-35 06/18/2019 320-51608-1 PFO2HxA 1.8 ug/L Cl. Spec. Table 3Compound SOP
J PFAS_DI_Prep0.0081PQL
GW0619-MW-35 06/18/2019 320-51608-1 PFO2HxA 1.8 ug/L Cl. Spec. Table 3Compound SOP
J PFAS_DI_Prep0.0081PQL
GW0619-MW-35 06/18/2019 320-51608-1 PFO3OA 0.053 ug/L Cl. Spec. Table 3Compound SOP
J PFAS_DI_Prep0.0058PQL
GW0619-MW-35 06/18/2019 320-51608-1 PFO3OA 0.053 ug/L Cl. Spec. Table 3Compound SOP
J PFAS_DI_Prep0.0058PQL
GW0619-MW-35 06/18/2019 320-51608-1 PFO4DA 0.017 ug/L Cl. Spec. Table 3Compound SOP
J PFAS_DI_Prep0.0079PQL
GW0619-MW-35 06/18/2019 320-51608-1 PFO4DA 0.017 ug/L Cl. Spec. Table 3Compound SOP
J PFAS_DI_Prep0.0079PQL
GW0619-MW-35 06/18/2019 320-51608-1 PFO5DA 0.0052 ug/L Cl. Spec. Table 3Compound SOP
J PFAS_DI_Prep0.0034PQL
GW0619-MW-35 06/18/2019 320-51608-1 PFO5DA 0.0052 ug/L Cl. Spec. Table 3Compound SOP
J PFAS_DI_Prep0.0034PQL
GW0619-MW-35 06/18/2019 320-51608-1 PEPA 0.038 UG/L Cl. Spec. Table 3Compound SOP
J PFAS_DI_Prep0.020PQL
GW0619-MW-35 06/18/2019 320-51608-1 PEPA 0.036 UG/L Cl. Spec. Table 3Compound SOP
J PFAS_DI_Prep0.020PQL
GW0619-MW-36 06/18/2019 320-51608-2 PFO2HxA 0.013 ug/L Cl. Spec. Table 3Compound SOP
J PFAS_DI_Prep0.0081PQL
GW0619-MW-36 06/18/2019 320-51608-2 PFO2HxA 0.014 ug/L Cl. Spec. Table 3Compound SOP
J PFAS_DI_Prep0.0081PQL
GW0619-MW-35 06/18/2019 320-51608-1 Byproduct 5 0.026 UG/L Cl. Spec. Table 3Compound SOP
J PFAS_DI_Prep0.0058PQL
GW0619-MW-35 06/18/2019 320-51608-1 Byproduct 5 0.026 UG/L Cl. Spec. Table 3Compound SOP
J PFAS_DI_Prep0.0058PQL
GW0619-MW-34-2 06/19/2019 320-51607-1 PFMOAA 68 ug/L Cl. Spec. Table 3Compound SOP
J PFAS_DI_Prep0.21PQL
GW0619-MW-34-2 06/19/2019 320-51607-1 PFMOAA 75.0 ug/L Cl. Spec. Table 3Compound SOP
J PFAS_DI_Prep0.21PQL
GW0619-MW-36 06/18/2019 320-51608-2 PFMOAA 4.9 ug/L Cl. Spec. Table 3Compound SOP
J PFAS_DI_Prep0.021PQL
Page 27 of 29
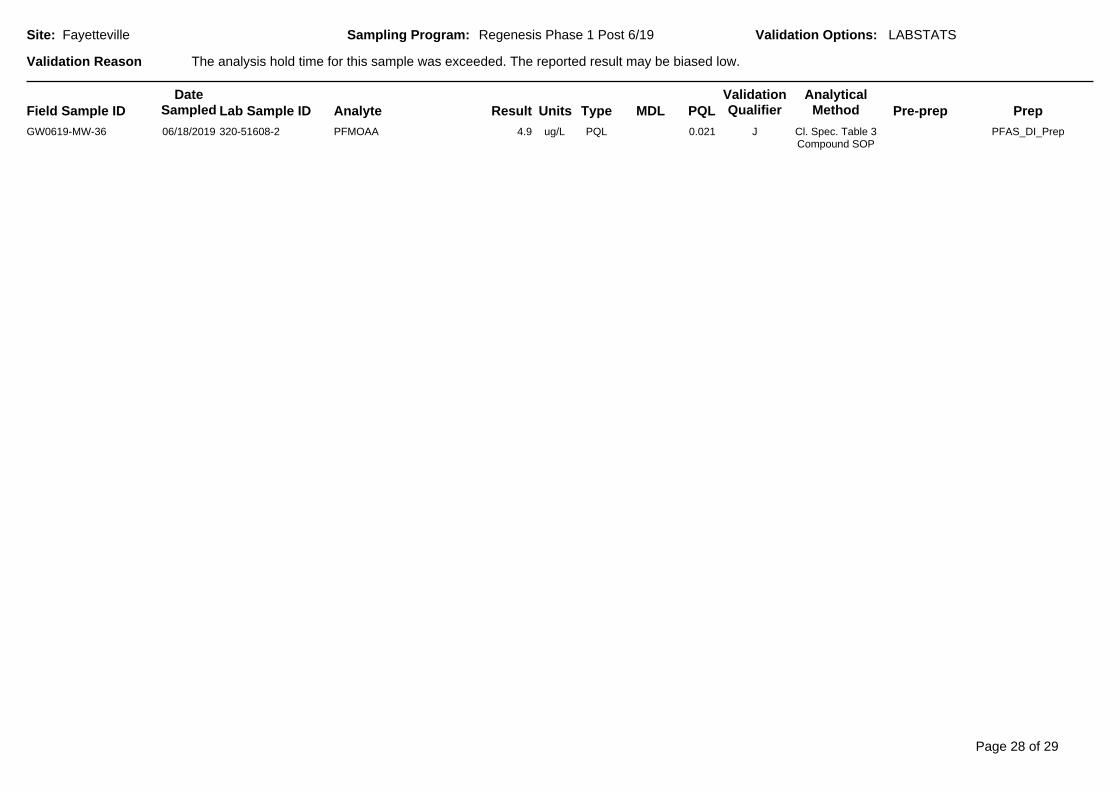
The analysis hold time for this sample was exceeded. The reported result may be biased low.
LABSTATSValidation Options:
Validation Reason
FayettevilleSite: Sampling Program: Regenesis Phase 1 Post 6/19
AnalyticalMethodAnalyte
DateSampled PQL
ValidationQualifierLab Sample ID Pre-prepMDLResult TypeField Sample ID PrepUnits
GW0619-MW-36 06/18/2019 320-51608-2 PFMOAA 4.9 ug/L Cl. Spec. Table 3Compound SOP
J PFAS_DI_Prep0.021PQL
Page 28 of 29
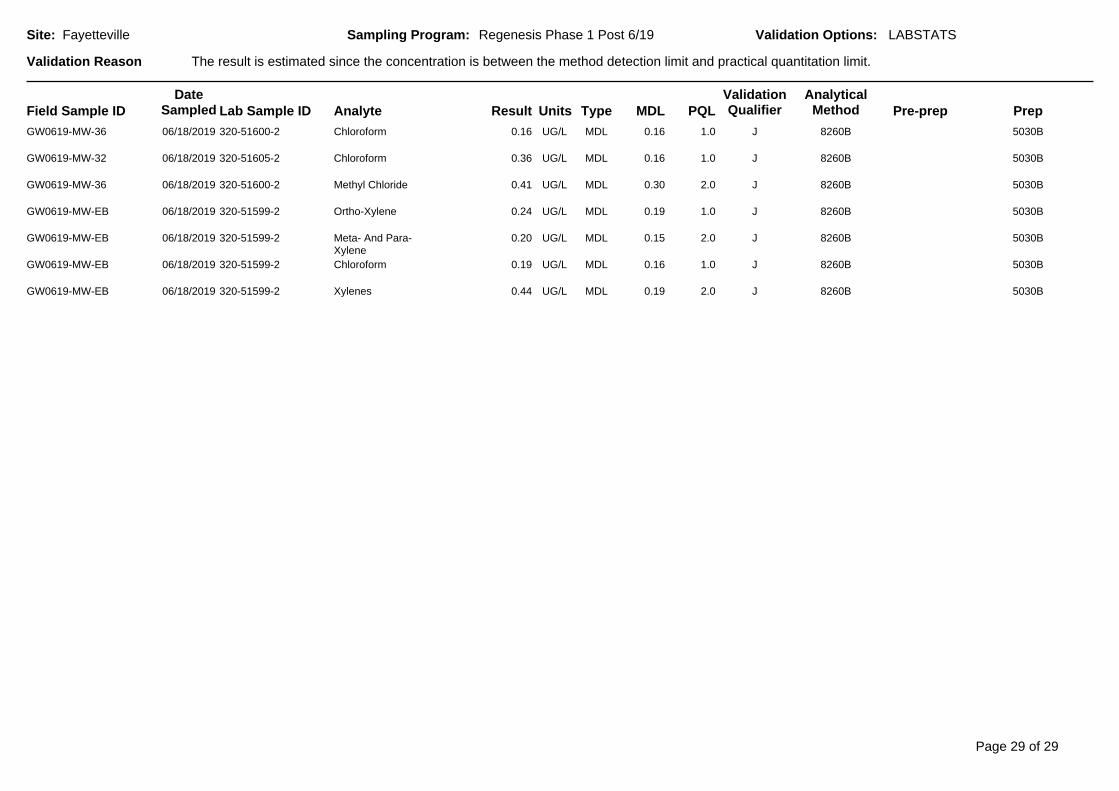
The result is estimated since the concentration is between the method detection limit and practical quantitation limit.
LABSTATSValidation Options:
Validation Reason
FayettevilleSite: Sampling Program: Regenesis Phase 1 Post 6/19
AnalyticalMethodAnalyte
DateSampled PQL
ValidationQualifierLab Sample ID Pre-prepMDLResult TypeField Sample ID PrepUnits
GW0619-MW-36 06/18/2019 320-51600-2 Chloroform 0.16 UG/L 0.16 8260BJ 5030B1.0MDL
GW0619-MW-32 06/18/2019 320-51605-2 Chloroform 0.36 UG/L 0.16 8260BJ 5030B1.0MDL
GW0619-MW-36 06/18/2019 320-51600-2 Methyl Chloride 0.41 UG/L 0.30 8260BJ 5030B2.0MDL
GW0619-MW-EB 06/18/2019 320-51599-2 Ortho-Xylene 0.24 UG/L 0.19 8260BJ 5030B1.0MDL
GW0619-MW-EB 06/18/2019 320-51599-2 Meta- And Para-Xylene
0.20 UG/L 0.15 8260BJ 5030B2.0MDL
GW0619-MW-EB 06/18/2019 320-51599-2 Chloroform 0.19 UG/L 0.16 8260BJ 5030B1.0MDL
GW0619-MW-EB 06/18/2019 320-51599-2 Xylenes 0.44 UG/L 0.19 8260BJ 5030B2.0MDL
Page 29 of 29

ADQM Data Review Narrative - FAY Regenesis Phase 1 Post 719.doc 1 of 3
ADQM DATA REVIEW NARRATIVE
Site Chemours FAY – Fayetteville Project Regenesis Phase 1 Post 7/19 Project Reviewer Michael Aucoin, AECOM as a Chemours contractor Sampling Dates July 17, 2019 July 18, 2019 Analytical Protocol
Laboratory Analytical Method Parameter(s) TestAmerica - Sacramento 537 Modified PFAS1 TestAmerica - Sacramento Cl. Spec. Table 3
Compound SOP Table 3+ compounds
TestAmerica - Denver 8260B Volatile Organics TestAmerica - Denver 6010D Calcium, total and dissolved TestAmerica - Denver 2340 C-1997 Total Hardness as CaCO3 TestAmerica - Denver 9060 Total Organic Carbon TestAmerica - Denver 9060 Dissolved Organic Carbon
1 Perfluoroalkylsubstances, a list of 33 compounds including HFPO-DA. Sample Receipt The following items are noted for this data set:
• All samples were received in satisfactory condition and within EPA temperature guideline on July 19 and 23, 2019
Data Review The electronic data submitted for this project was reviewed via the Data Verification Module (DVM) process. Overall the data is acceptable for use without qualification, except as noted below:
• Results for DOC, acetone or toluene in one or more samples were qualified B and the reported result may be biased high, or a false positive, due to a comparable concentration found in an associated equipment blank.
• Analytical results have been qualified J as estimated, and non-detect results qualified UJ indicating an estimated reporting limit, due to a poor matrix spike recovery; and poor field duplicate or lab replicate precision. DOC, calcium, dissolved calcium, and volatile organic results reported between the method detection limit (MDL) and practical quantitation limit (PQL)

ADQM Data Review Narrative - FAY Regenesis Phase 1 Post 719.doc 2 of 3
were qualified J as estimated. See the Data Verification Module (DVM) Narrative Report for which samples were qualified, the specific reasons for qualification, and potential bias in reported results.
Attachments The DVM Narrative report is attached. The lab reports due to a large page count are stored on an AECOM network shared drive and are available to be posted on external shared drives, or on a flash drive.

ADQM Data Review Narrative - FAY Regenesis Phase 1 Post 719.doc 3 of 3
Data Verification Module (DVM) The DVM is an internal review process used by the ADQM group to assist with the determination of data usability. The electronic data deliverables received from the laboratory are loaded into the Locus EIM™ database and processed through a series of data quality checks, which are a combination of software (Locus EIM™ database Data Verification Module (DVM)) and manual reviewer evaluations. The data is evaluated against the following data usability checks:
• Field and laboratory blank contamination • US EPA hold time criteria • Missing Quality Control (QC) samples • Matrix spike(MS)/matrix spike duplicate (MSD) recoveries and the relative percent differences
(RPDs) between these spikes • Laboratory control sample(LCS)/control sample duplicate (LCSD) recoveries and the RPD
between these spikes • Surrogate spike recoveries for organic analyses • RPD between field duplicate sample pairs • RPD between laboratory replicates for inorganic analyses • Difference / percent difference between total and dissolved sample pairs.
There are two qualifier fields in EIM:
Lab Qualifier is the qualifier assigned by the lab and may not reflect the usability of the data. This qualifier may have many different meanings and can vary between labs and over time within the same lab. Please refer to the laboratory report for a description of the lab qualifiers. As they are lab descriptors they are not to be used when evaluating the data. Validation Qualifier is the 3rd party formal validation qualifier if this was performed. Otherwise this field contains the qualifier resulting from the ADQM DVM review process. This qualifier assesses the usability of the data and may not equal the lab qualifier. The DVM applies the following data evaluation qualifiers to analysis results, as warranted:
Qualifier Definition B Not detected substantially above the level reported in the laboratory
or field blanks. R Unusable result. Analyte may or may not be present in the sample.
J Analyte present. Reported value may not be accurate or precise. UJ Not detected. Reporting limit may not be accurate or precise.
The Validation Status Code field is set to “DVM” if the ADQM DVM process has been performed. If the DVM has not been run, the field will be blank. If the DVM has been run (Validation Status Code equals “DVM”), use the Validation Qualifier.

DVM Narrative Report
Contamination detected in equipment blank(s). Sample result does not differ significantly from the analyte concentration detected in the associatedequipment blank(s).
LABSTATSValidation Options:
Validation Reason
FayettevilleSite: Sampling Program: Regenesis Phase 1 Post 7/19
AnalyticalMethodAnalyte
DateSampled PQL
ValidationQualifierLab Sample ID Pre-prepMDLResult TypeField Sample ID PrepUnits
GW0719-MW-31-Z 07/18/2019 280-126432-5 Dissolved OrganicCarbon
2200 UG/L 350 9060B1000MDL
GW0719-MW-32 07/18/2019 280-126432-2 Acetone 26 UG/L 1.9 8260BB 5030B10MDL
GW0719-MW-33-DZ 07/18/2019 280-126432-10 Dissolved OrganicCarbon
1700 UG/L 350 9060B1000MDL
GW0719-MW-33-Z 07/18/2019 280-126432-7 Dissolved OrganicCarbon
2400 UG/L 350 9060B1000MDL
GW0719-MW-33-D 07/18/2019 280-126432-4 Toluene 0.27 UG/L 0.17 8260BB 5030B1.0MDL
Page 1 of 5

High relative percent difference (RPD) observed between field duplicate and parent sample. The reported result may be imprecise.
LABSTATSValidation Options:
Validation Reason
FayettevilleSite: Sampling Program: Regenesis Phase 1 Post 7/19
AnalyticalMethodAnalyte
DateSampled PQL
ValidationQualifierLab Sample ID Pre-prepMDLResult TypeField Sample ID PrepUnits
GW0719-MW-33-D 07/18/2019 280-126480-4 Hfpo Dimer Acid 1.3 UG/L 537 ModifiedJ 3535_PFC0.14PQL
GW0719-MW-33 07/18/2019 280-126480-3 Hfpo Dimer Acid 0.95 UG/L 537 ModifiedJ 3535_PFC0.14PQL
Page 2 of 5

Quality review criteria exceeded between the REP (laboratory replicate) and parent sample. The reported result may be imprecise.
LABSTATSValidation Options:
Validation Reason
FayettevilleSite: Sampling Program: Regenesis Phase 1 Post 7/19
AnalyticalMethodAnalyte
DateSampled PQL
ValidationQualifierLab Sample ID Pre-prepMDLResult TypeField Sample ID PrepUnits
GW0719-MW-32 07/18/2019 280-126480-2 Hfpo Dimer Acid (trial) 1.7 UG/L 537 ModifiedJ 3535_PFC0.14PQL
GW0719-MW-32 07/18/2019 280-126480-2 Hfpo Dimer Acid 1.7 UG/L 537 ModifiedJ 3535_PFC0.14PQL
Page 3 of 5
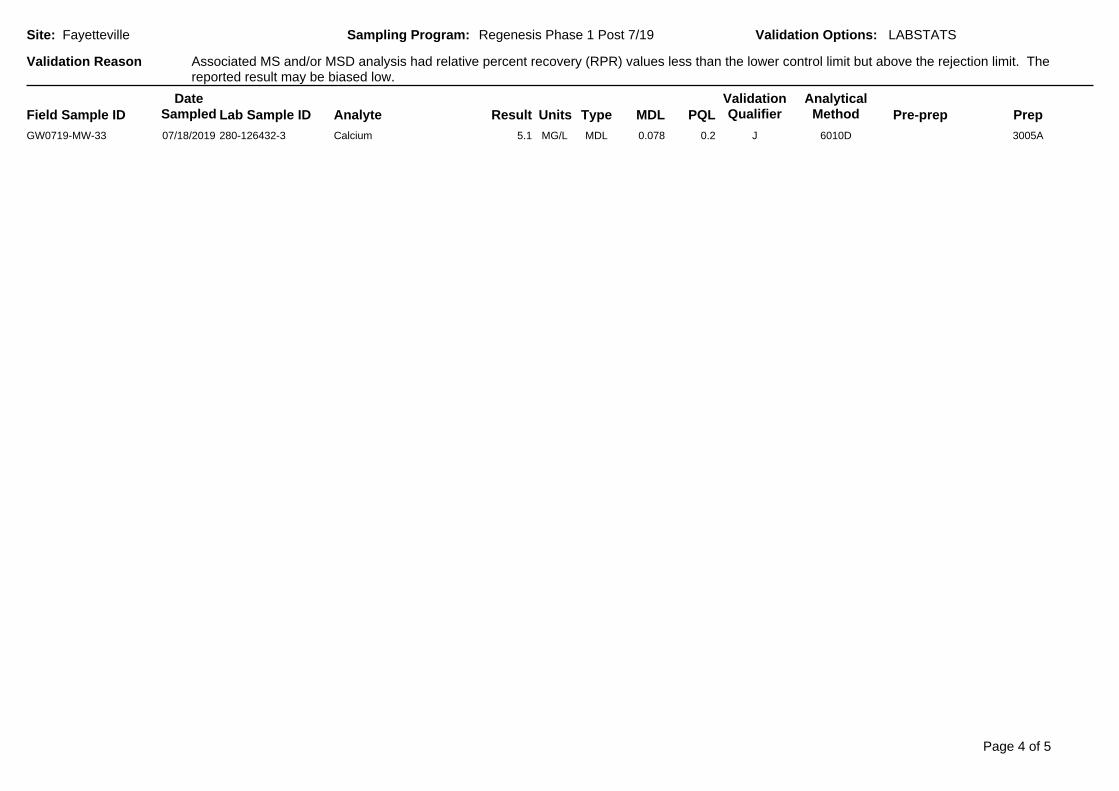
Associated MS and/or MSD analysis had relative percent recovery (RPR) values less than the lower control limit but above the rejection limit. Thereported result may be biased low.
LABSTATSValidation Options:
Validation Reason
FayettevilleSite: Sampling Program: Regenesis Phase 1 Post 7/19
AnalyticalMethodAnalyte
DateSampled PQL
ValidationQualifierLab Sample ID Pre-prepMDLResult TypeField Sample ID PrepUnits
GW0719-MW-33 07/18/2019 280-126432-3 Calcium 5.1 MG/L 0.078 6010DJ 3005A0.2MDL
Page 4 of 5
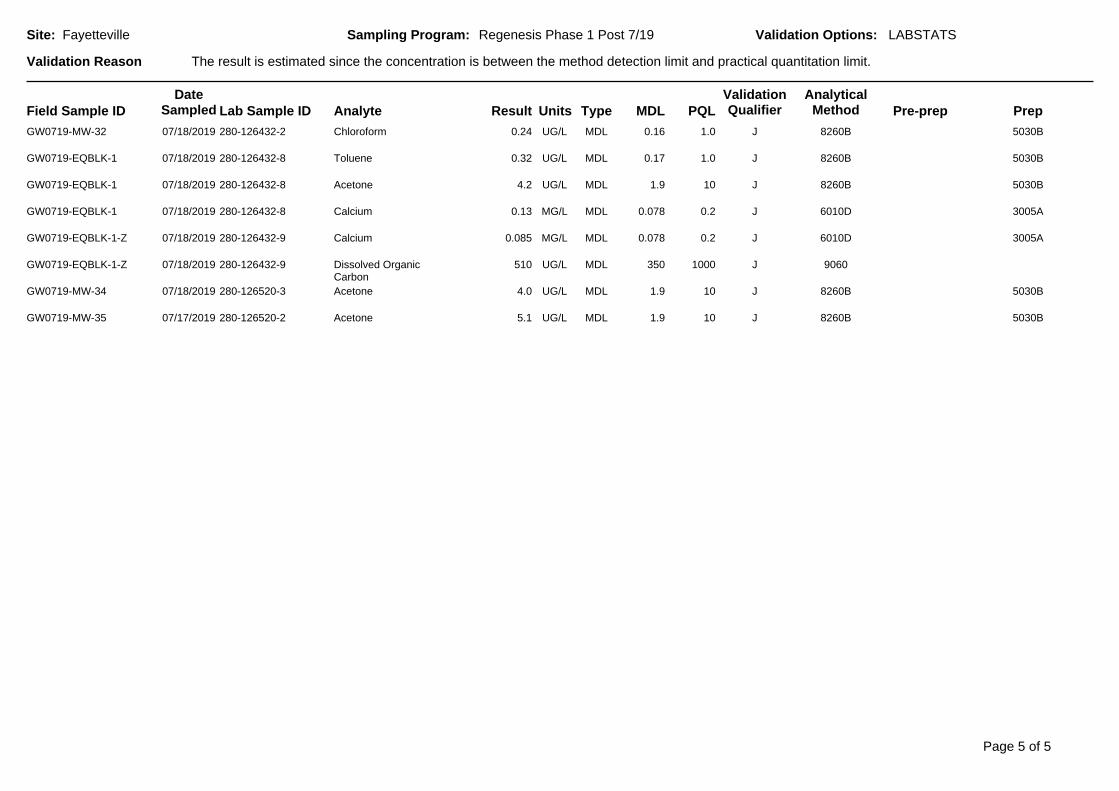
The result is estimated since the concentration is between the method detection limit and practical quantitation limit.
LABSTATSValidation Options:
Validation Reason
FayettevilleSite: Sampling Program: Regenesis Phase 1 Post 7/19
AnalyticalMethodAnalyte
DateSampled PQL
ValidationQualifierLab Sample ID Pre-prepMDLResult TypeField Sample ID PrepUnits
GW0719-MW-32 07/18/2019 280-126432-2 Chloroform 0.24 UG/L 0.16 8260BJ 5030B1.0MDL
GW0719-EQBLK-1 07/18/2019 280-126432-8 Toluene 0.32 UG/L 0.17 8260BJ 5030B1.0MDL
GW0719-EQBLK-1 07/18/2019 280-126432-8 Acetone 4.2 UG/L 1.9 8260BJ 5030B10MDL
GW0719-EQBLK-1 07/18/2019 280-126432-8 Calcium 0.13 MG/L 0.078 6010DJ 3005A0.2MDL
GW0719-EQBLK-1-Z 07/18/2019 280-126432-9 Calcium 0.085 MG/L 0.078 6010DJ 3005A0.2MDL
GW0719-EQBLK-1-Z 07/18/2019 280-126432-9 Dissolved OrganicCarbon
510 UG/L 350 9060J1000MDL
GW0719-MW-34 07/18/2019 280-126520-3 Acetone 4.0 UG/L 1.9 8260BJ 5030B10MDL
GW0719-MW-35 07/17/2019 280-126520-2 Acetone 5.1 UG/L 1.9 8260BJ 5030B10MDL
Page 5 of 5

ADQM Data Review Narrative - FAY Regenesis Phase 1 Post 819.doc 1 of 3
ADQM DATA REVIEW NARRATIVE
Site Chemours FAY – Fayetteville Project Regenesis Phase 1 Post 8/19 Project Reviewer Michael Aucoin, AECOM as a Chemours contractor Sampling Dates August 9, 2019 August 12, 2019 Analytical Protocol
Laboratory Analytical Method Parameter(s) TestAmerica - Sacramento 537 Modified PFAS1 TestAmerica - Sacramento Cl. Spec. Table 3
Compound SOP Table 3+ compounds
TestAmerica - Denver 8260B Volatile Organics TestAmerica - Denver 6010D Calcium, total and dissolved TestAmerica - Denver 2340 C-1997 Total Hardness as CaCO3 TestAmerica - Denver 9060 Total Organic Carbon TestAmerica - Denver 9060 Dissolved Organic Carbon
1 Perfluoroalkylsubstances, a list of 33 compounds including HFPO-DA. Sample Receipt The following items are noted for this data set:
• All samples were received in satisfactory condition and within EPA temperature guideline on August 10 and 13, 2019
Data Review The electronic data submitted for this project was reviewed via the Data Verification Module (DVM) process. Overall the data is acceptable for use without qualification, except as noted below:
• Results for DOC or volatile organics in one or more samples were qualified B and the reported result may be biased high, or a false positive, due to a comparable concentration found in an associated equipment blank, trip blank, or lab method blank.
• Analytical results have been qualified J as estimated, and non-detect results qualified UJ indicating an estimated reporting limit, due to a poor or very poor surrogate, lab blank spike, or matrix spike recovery; and poor field duplicate or lab replicate precision. TOC, DOC, and volatile organic results reported between the method detection limit (MDL) and practical
ADQM Data Review Narrative - FAY Regenesis Phase 1 Post 819.doc 2 of 3
quantitation limit (PQL) were qualified J as estimated. See the Data Verification Module (DVM) Narrative Report for which samples were qualified, the specific reasons for qualification, and potential bias in reported results.
Attachments The DVM Narrative report is attached. The lab reports due to a large page count are stored on an AECOM network shared drive and are available to be posted on external shared drives, or on a flash drive.

ADQM Data Review Narrative - FAY Regenesis Phase 1 Post 819.doc 3 of 3
Data Verification Module (DVM) The DVM is an internal review process used by the ADQM group to assist with the determination of data usability. The electronic data deliverables received from the laboratory are loaded into the Locus EIM™ database and processed through a series of data quality checks, which are a combination of software (Locus EIM™ database Data Verification Module (DVM)) and manual reviewer evaluations. The data is evaluated against the following data usability checks:
• Field and laboratory blank contamination • US EPA hold time criteria • Missing Quality Control (QC) samples • Matrix spike(MS)/matrix spike duplicate (MSD) recoveries and the relative percent differences
(RPDs) between these spikes • Laboratory control sample(LCS)/control sample duplicate (LCSD) recoveries and the RPD
between these spikes • Surrogate spike recoveries for organic analyses • RPD between field duplicate sample pairs • RPD between laboratory replicates for inorganic analyses • Difference / percent difference between total and dissolved sample pairs.
There are two qualifier fields in EIM:
Lab Qualifier is the qualifier assigned by the lab and may not reflect the usability of the data. This qualifier may have many different meanings and can vary between labs and over time within the same lab. Please refer to the laboratory report for a description of the lab qualifiers. As they are lab descriptors they are not to be used when evaluating the data. Validation Qualifier is the 3rd party formal validation qualifier if this was performed. Otherwise this field contains the qualifier resulting from the ADQM DVM review process. This qualifier assesses the usability of the data and may not equal the lab qualifier. The DVM applies the following data evaluation qualifiers to analysis results, as warranted:
Qualifier Definition B Not detected substantially above the level reported in the laboratory
or field blanks. R Unusable result. Analyte may or may not be present in the sample.
J Analyte present. Reported value may not be accurate or precise. UJ Not detected. Reporting limit may not be accurate or precise.
The Validation Status Code field is set to “DVM” if the ADQM DVM process has been performed. If the DVM has not been run, the field will be blank. If the DVM has been run (Validation Status Code equals “DVM”), use the Validation Qualifier.
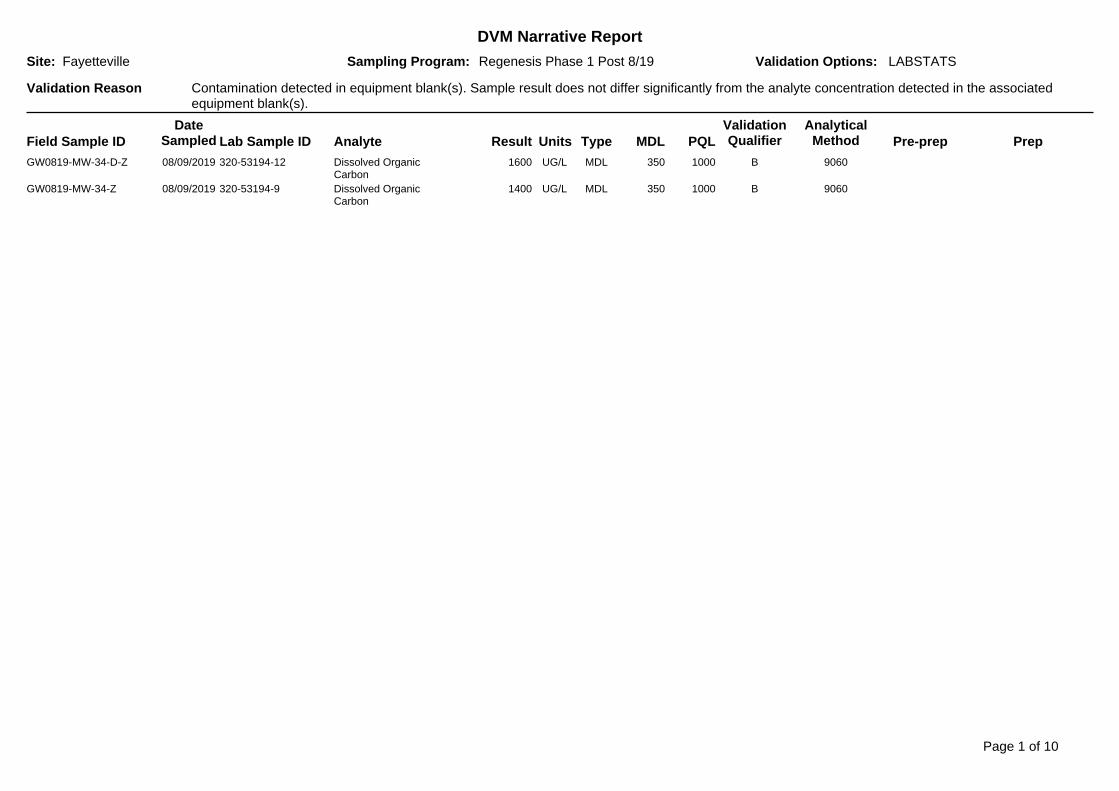
DVM Narrative Report
Contamination detected in equipment blank(s). Sample result does not differ significantly from the analyte concentration detected in the associatedequipment blank(s).
LABSTATSValidation Options:
Validation Reason
FayettevilleSite: Sampling Program: Regenesis Phase 1 Post 8/19
AnalyticalMethodAnalyte
DateSampled PQL
ValidationQualifierLab Sample ID Pre-prepMDLResult TypeField Sample ID PrepUnits
GW0819-MW-34-D-Z 08/09/2019 320-53194-12 Dissolved OrganicCarbon
1600 UG/L 350 9060B1000MDL
GW0819-MW-34-Z 08/09/2019 320-53194-9 Dissolved OrganicCarbon
1400 UG/L 350 9060B1000MDL
Page 1 of 10

Contamination detected in Method Blank(s). Sample result does not differ significantly from the analyte concentration detected in the associated methodblank(s).
LABSTATSValidation Options:
Validation Reason
FayettevilleSite: Sampling Program: Regenesis Phase 1 Post 8/19
AnalyticalMethodAnalyte
DateSampled PQL
ValidationQualifierLab Sample ID Pre-prepMDLResult TypeField Sample ID PrepUnits
GW0819-MW-36 08/09/2019 320-53194-1 Acetone 11 UG/L 1.9 8260BB 5030B10MDL
GW0819-MW-32 08/09/2019 320-53194-4 Acetone 5.1 UG/L 1.9 8260BB 5030B10MDL
Page 2 of 10
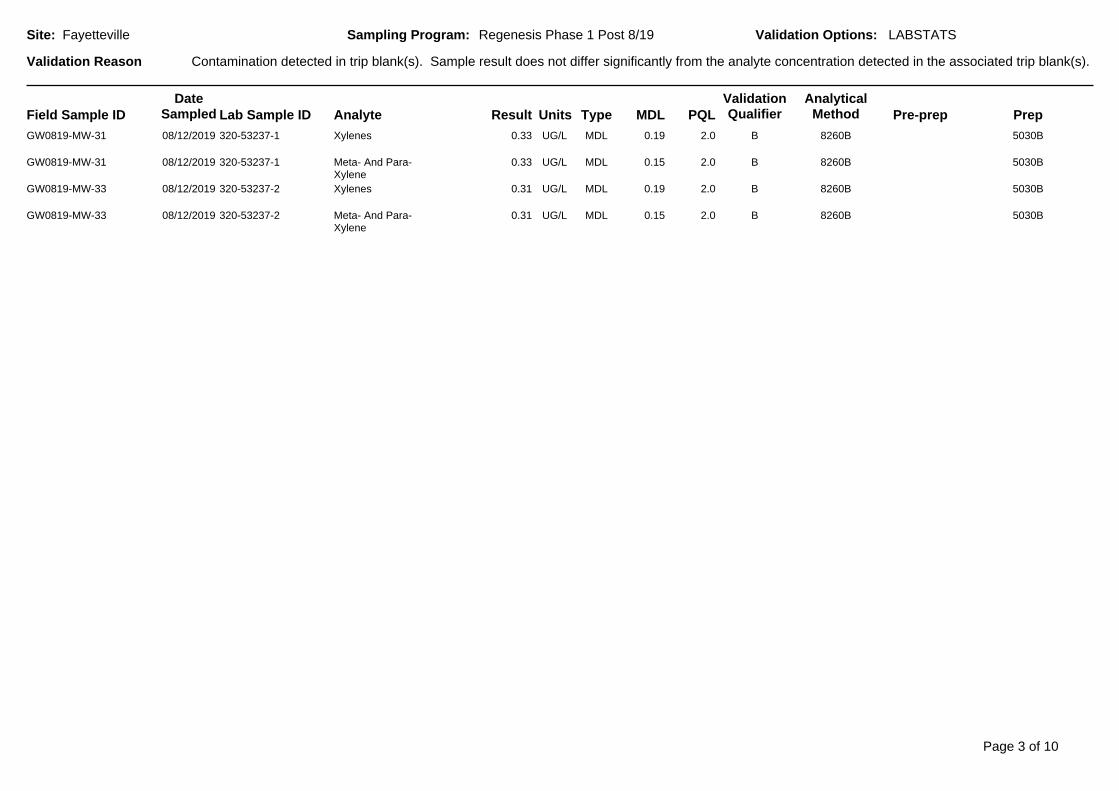
Contamination detected in trip blank(s). Sample result does not differ significantly from the analyte concentration detected in the associated trip blank(s).
LABSTATSValidation Options:
Validation Reason
FayettevilleSite: Sampling Program: Regenesis Phase 1 Post 8/19
AnalyticalMethodAnalyte
DateSampled PQL
ValidationQualifierLab Sample ID Pre-prepMDLResult TypeField Sample ID PrepUnits
GW0819-MW-31 08/12/2019 320-53237-1 Xylenes 0.33 UG/L 0.19 8260BB 5030B2.0MDL
GW0819-MW-31 08/12/2019 320-53237-1 Meta- And Para-Xylene
0.33 UG/L 0.15 8260BB 5030B2.0MDL
GW0819-MW-33 08/12/2019 320-53237-2 Xylenes 0.31 UG/L 0.19 8260BB 5030B2.0MDL
GW0819-MW-33 08/12/2019 320-53237-2 Meta- And Para-Xylene
0.31 UG/L 0.15 8260BB 5030B2.0MDL
Page 3 of 10
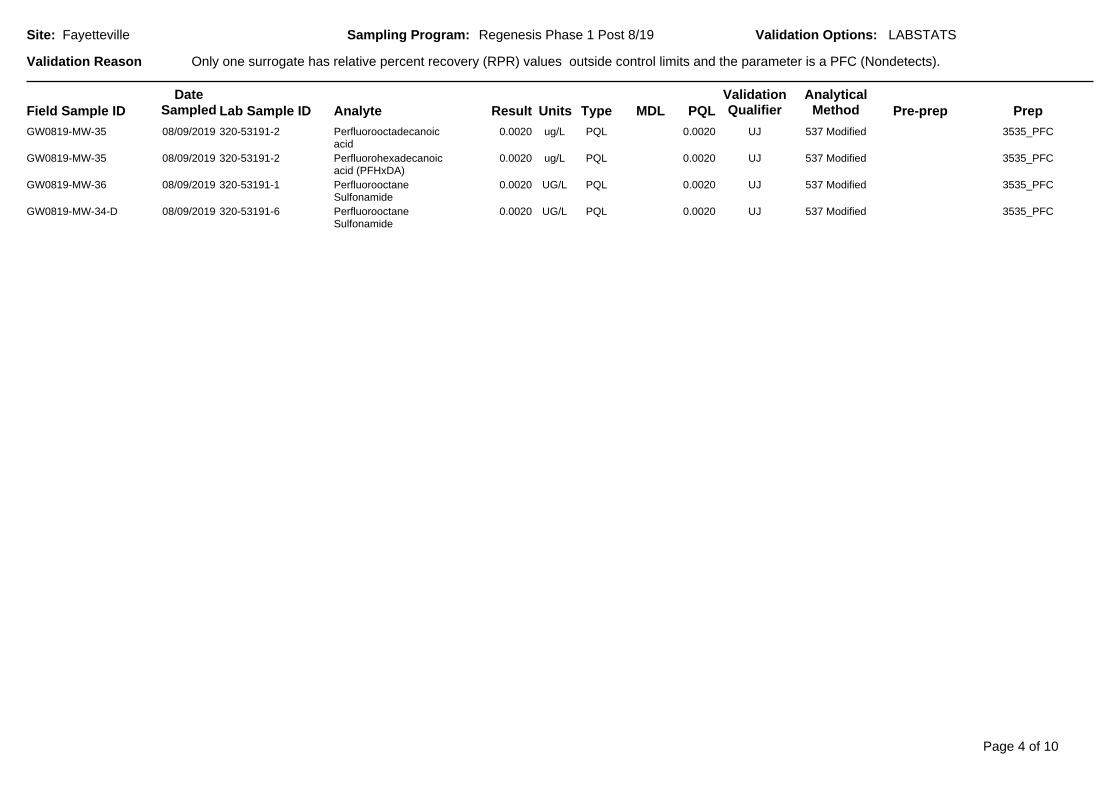
Only one surrogate has relative percent recovery (RPR) values outside control limits and the parameter is a PFC (Nondetects).
LABSTATSValidation Options:
Validation Reason
FayettevilleSite: Sampling Program: Regenesis Phase 1 Post 8/19
AnalyticalMethodAnalyte
DateSampled PQL
ValidationQualifierLab Sample ID Pre-prepMDLResult TypeField Sample ID PrepUnits
GW0819-MW-35 08/09/2019 320-53191-2 Perfluorooctadecanoicacid
0.0020 ug/L 537 ModifiedUJ 3535_PFC0.0020PQL
GW0819-MW-35 08/09/2019 320-53191-2 Perfluorohexadecanoicacid (PFHxDA)
0.0020 ug/L 537 ModifiedUJ 3535_PFC0.0020PQL
GW0819-MW-36 08/09/2019 320-53191-1 PerfluorooctaneSulfonamide
0.0020 UG/L 537 ModifiedUJ 3535_PFC0.0020PQL
GW0819-MW-34-D 08/09/2019 320-53191-6 PerfluorooctaneSulfonamide
0.0020 UG/L 537 ModifiedUJ 3535_PFC0.0020PQL
Page 4 of 10
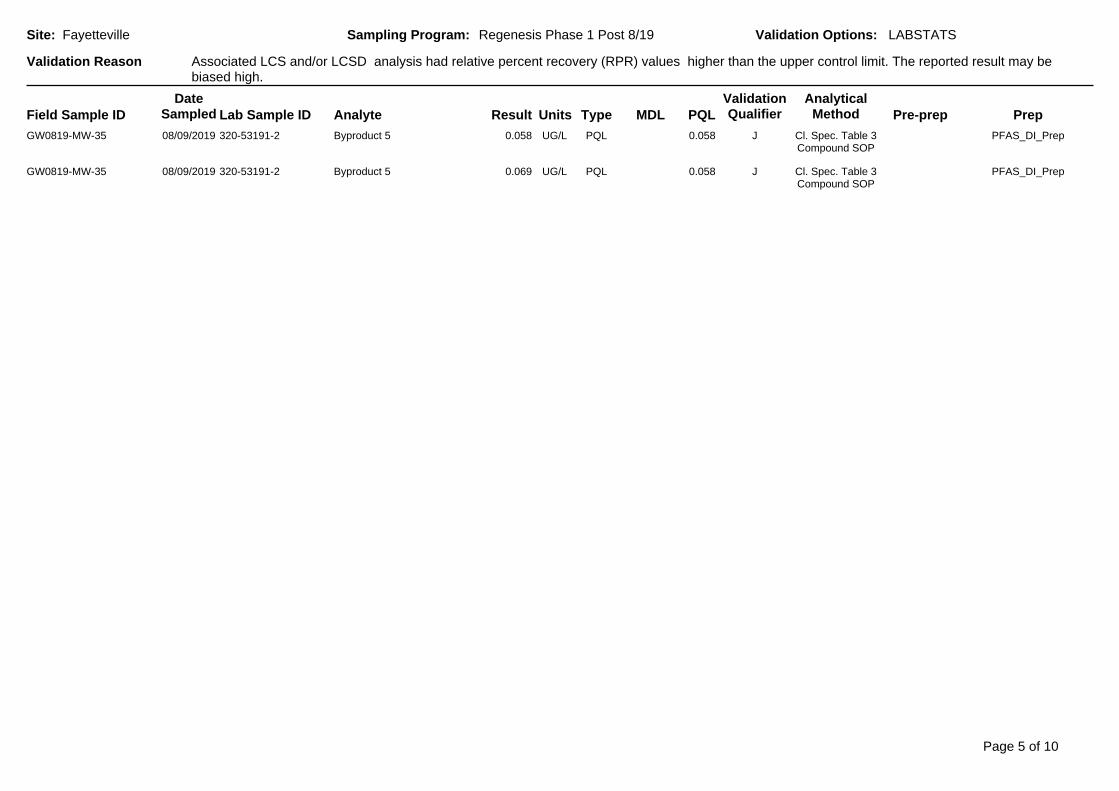
Associated LCS and/or LCSD analysis had relative percent recovery (RPR) values higher than the upper control limit. The reported result may bebiased high.
LABSTATSValidation Options:
Validation Reason
FayettevilleSite: Sampling Program: Regenesis Phase 1 Post 8/19
AnalyticalMethodAnalyte
DateSampled PQL
ValidationQualifierLab Sample ID Pre-prepMDLResult TypeField Sample ID PrepUnits
GW0819-MW-35 08/09/2019 320-53191-2 Byproduct 5 0.058 UG/L Cl. Spec. Table 3Compound SOP
J PFAS_DI_Prep0.058PQL
GW0819-MW-35 08/09/2019 320-53191-2 Byproduct 5 0.069 UG/L Cl. Spec. Table 3Compound SOP
J PFAS_DI_Prep0.058PQL
Page 5 of 10

Associated MS and/or MSD analysis had relative percent recovery (RPR) values higher than the upper control limit. The reported result may be biasedhigh.
LABSTATSValidation Options:
Validation Reason
FayettevilleSite: Sampling Program: Regenesis Phase 1 Post 8/19
AnalyticalMethodAnalyte
DateSampled PQL
ValidationQualifierLab Sample ID Pre-prepMDLResult TypeField Sample ID PrepUnits
GW0819-MW-35 08/09/2019 320-53191-2 PFMOAA 49 ug/L Cl. Spec. Table 3Compound SOP
J PFAS_DI_Prep0.21PQL
GW0819-MW-35 08/09/2019 320-53191-2 PFMOAA 49.0 ug/L Cl. Spec. Table 3Compound SOP
J PFAS_DI_Prep0.21PQL
GW0819-MW-32 08/09/2019 320-53191-4 R-EVE 0.084 UG/L Cl. Spec. Table 3Compound SOP
J PFAS_DI_Prep0.070PQL
GW0819-MW-32 08/09/2019 320-53191-4 R-EVE 0.075 UG/L Cl. Spec. Table 3Compound SOP
J PFAS_DI_Prep0.070PQL
GW0819-MW-32 08/09/2019 320-53191-4 Byproduct 5 1.2 UG/L Cl. Spec. Table 3Compound SOP
J PFAS_DI_Prep0.058PQL
GW0819-MW-32 08/09/2019 320-53191-4 Byproduct 5 1.2 UG/L Cl. Spec. Table 3Compound SOP
J PFAS_DI_Prep0.058PQL
GW0819-MW-32 08/09/2019 320-53191-4 PFO4DA 0.93 ug/L Cl. Spec. Table 3Compound SOP
J PFAS_DI_Prep0.079PQL
GW0819-MW-32 08/09/2019 320-53191-4 PFO4DA 0.88 ug/L Cl. Spec. Table 3Compound SOP
J PFAS_DI_Prep0.079PQL
GW0819-MW-32 08/09/2019 320-53191-4 PFO5DA 0.23 ug/L Cl. Spec. Table 3Compound SOP
J PFAS_DI_Prep0.034PQL
GW0819-MW-32 08/09/2019 320-53191-4 PFO5DA 0.22 ug/L Cl. Spec. Table 3Compound SOP
J PFAS_DI_Prep0.034PQL
Page 6 of 10

High relative percent difference (RPD) observed between field duplicate and parent sample. The reported result may be imprecise.
LABSTATSValidation Options:
Validation Reason
FayettevilleSite: Sampling Program: Regenesis Phase 1 Post 8/19
AnalyticalMethodAnalyte
DateSampled PQL
ValidationQualifierLab Sample ID Pre-prepMDLResult TypeField Sample ID PrepUnits
GW0819-MW-34-D 08/09/2019 320-53194-11 Total Hardness AsCaCO3
18 MG/L 0.30 2340 C-1997J3.0MDL
GW0819-MW-34 08/09/2019 320-53194-3 Total Hardness AsCaCO3
30 MG/L 0.30 2340 C-1997J3.0MDL
Page 7 of 10

Quality review criteria exceeded between the REP (laboratory replicate) and parent sample. The reported result may be imprecise.
LABSTATSValidation Options:
Validation Reason
FayettevilleSite: Sampling Program: Regenesis Phase 1 Post 8/19
AnalyticalMethodAnalyte
DateSampled PQL
ValidationQualifierLab Sample ID Pre-prepMDLResult TypeField Sample ID PrepUnits
GW0819-MW-35 08/09/2019 320-53194-2 Total Hardness AsCaCO3
150 MG/L 1.2 2340 C-1997J12MDL
GW0819-MW-31 08/12/2019 320-53233-1 R-EVE 0.18 UG/L Cl. Spec. Table 3Compound SOP
J PFAS_DI_Prep0.070PQL
GW0819-MW-31 08/12/2019 320-53233-1 R-EVE 0.25 UG/L Cl. Spec. Table 3Compound SOP
J PFAS_DI_Prep0.070PQL
GW0819-MW-32 08/09/2019 320-53194-4 Total Hardness AsCaCO3
88 MG/L 0.30 2340 C-1997J3.0MDL
Page 8 of 10

One or more surrogates had relative percent recovery (RPR) values less than the data rejection level. The reported result may be biased low.
LABSTATSValidation Options:
Validation Reason
FayettevilleSite: Sampling Program: Regenesis Phase 1 Post 8/19
AnalyticalMethodAnalyte
DateSampled PQL
ValidationQualifierLab Sample ID Pre-prepMDLResult TypeField Sample ID PrepUnits
GW0819-MW-35 08/09/2019 320-53191-2 PerfluorooctaneSulfonamide
0.0034 UG/L 537 ModifiedJ 3535_PFC0.0020PQL
Page 9 of 10

The result is estimated since the concentration is between the method detection limit and practical quantitation limit.
LABSTATSValidation Options:
Validation Reason
FayettevilleSite: Sampling Program: Regenesis Phase 1 Post 8/19
AnalyticalMethodAnalyte
DateSampled PQL
ValidationQualifierLab Sample ID Pre-prepMDLResult TypeField Sample ID PrepUnits
GW0819-MW-34 08/09/2019 320-53194-3 Carbon 0.70 MG/L 0.35 9060J1.0MDL
GW0819-MW-34-D 08/09/2019 320-53194-11 Carbon 0.83 MG/L 0.35 9060J1.0MDL
GW0819-EQBLK 08/09/2019 320-53194-5 Acetone 7.2 UG/L 1.9 8260BJ 5030B10MDL
GW0819-EQBLK-Z 08/09/2019 320-53194-6 Dissolved OrganicCarbon
380 UG/L 350 9060J1000MDL
GW0819-MWTBLK-1 08/09/2019 320-53194-13 Acetone 4.9 UG/L 1.9 8260BJ 5030B10MDL
GW0819-TBLK2 08/12/2019 320-53237-5 Xylenes 0.29 UG/L 0.19 8260BJ 5030B2.0MDL
GW0819-TBLK2 08/12/2019 320-53237-5 Acetone 6.9 UG/L 1.9 8260BJ 5030B10MDL
GW0819-TBLK2 08/12/2019 320-53237-5 Meta- And Para-Xylene
0.29 UG/L 0.15 8260BJ 5030B2.0MDL
GW0819-MW-36 08/09/2019 320-53194-1 Methyl Bromide 0.30 UG/L 0.21 8260BJ 5030B2.0MDL
Page 10 of 10


LABORATORY REPORTS PROVIDED ELECTRONICALLY ON THE ENCLOSED DVD


APPENDIX E SAMPLING LOGS

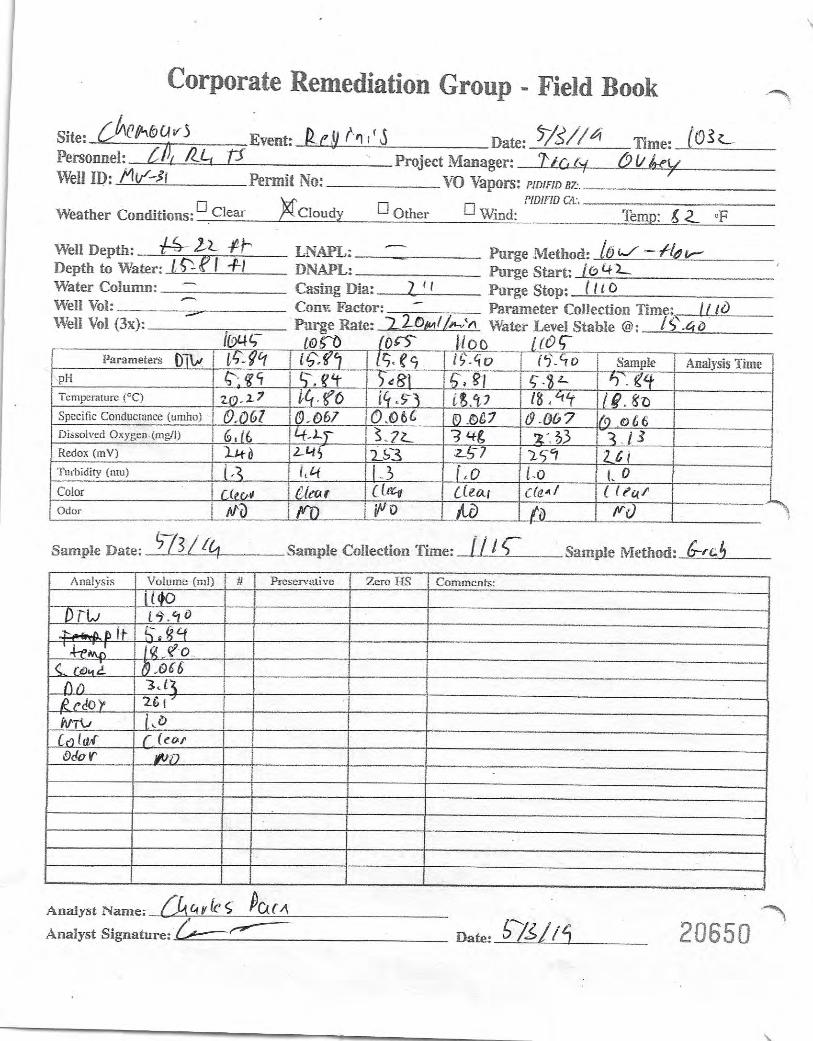


Site Name: Well ID: Well Diameter: Inches
Samplers: Event:
Purging Data Pump Depth:
Pump Loc:
Method: Date: 07-18-2019 Time: 12:46 Water Volume =
16
Time DTW Pump Rate Vol. pH DO Redox Turbidity Color Odor24 hr. ft. ml/min. gal. mg/L mV NTU
16.22 6.56 2.39 153.00 15.90 Clear No
16.24 6.45 2.23 183.00 1.30 Clear No
16.24 6.43 2.13 191.00 0.10 Clear No
16.24 6.42 2.02 200.00 0.00 Clear No
Sampling Data Zero HS:
Method: Date: Time: 13:15Field Parameters
Sample ID:
DuplicateID:
Partly Sunny
None
Wind (mph) 8
Precipitation:
Sky:
Comments
SAMPLE SET
Table 3+
PFAS
Parameter Method
EPA 537 Modified
PFAS
Bottle
Table 3
2-250 mL poly
250 mL poly
NP
NP
DO (mg/L)
ORP (mV)
2.02
200.00
GW0619-MW-31 WEATHER CONDITIONS
96.00
250 mL poly NP
Temperature (F):
-2.56
07-18-2019
Peristaltic Pump
Temp.(oC) PFAS23.58
Screen Interval:
17-22
6.42pH
STABILIZED PARAMETERS
0.15Spec. Cond.(mS/cm)
Turbidity (NTU)
Pres.
Depth to Well Bottom (ft.):
Peristaltic Pump
Spec. Cond.mS/cm
Total Volume Purged (gallons):
Temp.oC
Initial Depth to Water (ft.):
0.15 23.19
0.15 22.93
0.15 23.55
0.15 23.58
WELL SAMPLING RECORD
= (Total Depth of Well - Depth To Water ) x Casing Volume per Foot
Chemours Fayetteville 2
Charles Pace Luke Tart
WATER VOLUME CALCULATION
Other Tracy Ovbey
bottom of well
MW-31
Project Manager:

Site Name: Well ID: Well Diameter: Inches
Samplers: Event:
Purging Data Pump Depth:
Pump Loc:
Method: Date: 08-12-2019 Time: 10:33 Water Volume =
15.8
Time DTW Pump Rate Vol. pH DO Redox Turbidity Color Odor24 hr. ft. ml/min. gal. mg/L mV NTU
15.96 5.93 4.39 186.00 0.00 Clear No
16.00 5.97 2.61 190.00 0.00 Clear No
16.00 5.99 2.13 192.00 0.00 Clear No
16.00 5.98 2.19 196.00 0.00 Clear No
16.00 5.98 2.03 200.00 0.00 Clear No
Sampling Data Zero HS:
Method: Date: Time: 11:15Field Parameters
Sample ID:
DuplicateID:
Sunny
None
Wind (mph) 4
Precipitation:
Sky:
Comments
SAMPLE SET
Table 3+
PFAS
Parameter Method
EPA 537 Modified
PFAS
Bottle
Table 3
2-250 mL poly
250 mL poly
NP
NP
DO (mg/L)
ORP (mV)
2.03
200.00
GW0619-MW-31 WEATHER CONDITIONS
86.00
250 mL poly NP
Temperature (F):
-2.528
08-12-2019
Low Flow: Geo Pump
Temp.(oC) PFAS24.15
Screen Interval:
17-22
5.98pH
STABILIZED PARAMETERS
0.12Spec. Cond.(mS/cm)
Turbidity (NTU)
Pres.
Depth to Well Bottom (ft.):
Peristaltic Pump
Spec. Cond.mS/cm
Total Volume Purged (gallons):
Temp.oC
Initial Depth to Water (ft.):
0.13 24.64
0.12 24.95
0.12 24.41
0.12 24.44
0.12 24.15
WELL SAMPLING RECORD
= (Total Depth of Well - Depth To Water ) x Casing Volume per Foot
Chemours Fayetteville 2
CHARLES PACE Thomas Strayhorn
WATER VOLUME CALCULATION
Other Tracy Ovbey
bottom of well
MW-31
Project Manager:

Site Name: Well ID: Well Diameter: Inches
Samplers: Event:
Purging Data Pump Depth:
Pump Loc:
Method: Date: 06-18-2019 Time: 16:11 Water Volume =
15.8 22
Time DTW Pump Rate Vol. pH DO Redox Turbidity Color Odor24 hr. ft. ml/min. gal. mg/L mV NTU15:50 16.05 300.00 5.45 3.87 99.00 3.80 Clear No
15:55 16.05 300.00 5.37 3.01 113.00 1.60 Clear No
16:00 16.05 300.00 5.36 2.86 119.00 0.70 Clear No
16:05 16.05 300.00 5.36 2.73 124.00 0.60 Clear No
16:10 16.05 300.00 5.35 2.74 127.00 0.60 Clear No
Sampling Data Zero HS:
Method: Date: Time: 16:15Field Parameters
Sample ID:
DuplicateID:
WELL SAMPLING RECORD
= (Total Depth of Well - Depth To Water ) x Casing Volume per Foot
Chemours Fayetteville 2
Charles Pace Jacob Limpus
WATER VOLUME CALCULATION
Other Tracy Ovbey
within screen
MW-31
Project Manager:
Depth to Well Bottom (ft.):
Dedicated tubing
Spec. Cond.mS/cm
Total Volume Purged (gallons):
Temp.oC
Initial Depth to Water (ft.):
0.10 22.33
0.10 21.59
0.10 21.41
0.10 21.12
0.10 21.05
Temperature (F):
0.992
06-18-2019
Low Flow: Geo Pump
Temp.(oC) PFAS21.05
Screen Interval:
17-22
5.35pH
STABILIZED PARAMETERS
0.10
0.60
Spec. Cond.(mS/cm)
Turbidity (NTU)
Pres.
95.00
250 mL poly NP
DO (mg/L)
ORP (mV)
2.74
127.00
MW-31_061819 WEATHER CONDITIONS
Comments
SAMPLE SET
Table 3+
PFAS
Parameter Method
EPA 537 Modified
PFAS
Bottle
Table 3
2-250 mL poly
250 mL poly
NP
NP
Partly Sunny
None
Wind (mph) 10
Precipitation:
Sky:

Site Name: Well ID: Well Diameter: Inches
Samplers: Event:
Purging Data Pump Depth:
Pump Loc:
Method: Date: 07-18-2019 Time: 11:22 Water Volume =
14.91
Time DTW Pump Rate Vol. pH DO Redox Turbidity Color Odor24 hr. ft. ml/min. gal. mg/L mV NTU
15.21 7.08 0.00 -10.00 155.00 Cloudy No
15.22 6.89 0.00 18.00 26.00 Cloudy No
15.22 6.89 0.00 10.00 14.60 Clear No
15.22 6.86 0.00 3.00 6.50 Clear No
15.22 6.82 0.00 -2.00 4.10 Clear No
15.22 6.85 0.00 -10.00 2.00 Clear No
15.22 6.85 0.00 -15.00 1.50 Clear No
15.22 6.84 0.00 -15.00 0.90 Clear No
Sampling Data Zero HS:
Method: Date: Time: 12:20Field Parameters
Sample ID:
DuplicateID:
Partly Cloudy
None
Wind (mph) 11
Precipitation:
Sky:
Comments
SAMPLE SET
Table 3+
PFAS
Parameter Method
EPA 537 Modified
PFAS
Bottle
Table 3
2-250 mL poly
250 mL poly
NP
NP
0.19 22.09
DO (mg/L)
ORP (mV)
GW0619-MW-32 WEATHER CONDITIONS
93.00
250 mL poly NP
Temperature (F):
-2.386
07-18-2019
Peristaltic Pump
Temp.(oC) PFAS22.21
Screen Interval:
13-18.5
6.84pH
STABILIZED PARAMETERS
0.19
0.90
Spec. Cond.(mS/cm)
Turbidity (NTU)
Pres.
Depth to Well Bottom (ft.):
Peristaltic Pump
Spec. Cond.mS/cm
Total Volume Purged (gallons):
Temp.oC
Initial Depth to Water (ft.):
0.19 22.59
0.19 22.36
0.19 22.30
0.19 22.27
0.19 22.17
WELL SAMPLING RECORD
= (Total Depth of Well - Depth To Water ) x Casing Volume per Foot
Chemours Fayetteville 2
Charles Pace
WATER VOLUME CALCULATION
Other Tracy Ovbey
bottom of well
MW-32
Project Manager:
0.19 22.10
0.19 22.21

Site Name: Well ID: Well Diameter: Inches
Samplers: Event:
Purging Data Pump Depth:
Pump Loc:
Method: Date: 08-09-2019 Time: 13:49 Water Volume =
14.81 20.55
Time DTW Pump Rate Vol. pH DO Redox Turbidity Color Odor24 hr. ft. ml/min. gal. mg/L mV NTU
15.05 6.34 4.44 34.00 29.40
15.05 6.25 0.49 65.00 0.00
15.09 6.27 0.29 73.00 0.00
15.06 6.27 0.14 80.00 0.00
15.06 6.28 0.05 84.00 0.00
15.06 6.30 0.02 86.00 0.00 Clear No
Sampling Data Zero HS:
Method: Date: Time: 14:30Field Parameters
Sample ID:
DuplicateID:
Sunny
None
Wind (mph)
Precipitation:
Sky:
SAMPLE SET
Table 3+
PFAS
Parameter Method
EPA 537 Modified
PFAS
Bottle
Table 3
2-250 mL poly
250 mL poly
NP
NP
DO (mg/L)
ORP (mV)
0.02
86.00
GW0619-MW-32 WEATHER CONDITIONS
97.00
250 mL poly NP
Temperature (F):
0.918
08-09-2019
Low Flow: Geo Pump
Temp.(oC) PFAS25.53
Screen Interval:
13-18.5
6.30pH
STABILIZED PARAMETERS
0.15Spec. Cond.(mS/cm)
Turbidity (NTU)
Pres.
Dedicated tubing
Spec. Cond.mS/cm
Total Volume Purged (gallons):
Temp.oC
Initial Depth to Water (ft.):
0.16 26.00
0.15 25.37
0.16 25.82
0.15 24.85
0.15 25.12
Comments
WELL SAMPLING RECORD
= (Total Depth of Well - Depth To Water ) x Casing Volume per Foot
Chemours Fayetteville 2
CHARLES PACE Steven Boor
WATER VOLUME CALCULATION
Other Tracy Ovbey
17within screen
MW-32
Project Manager:
Depth to Well Bottom (ft.):
0.15 25.53

Site Name: Well ID: Well Diameter: Inches
Samplers: Event:
Purging Data Pump Depth:
Pump Loc:
Method: Date: 06-18-2019 Time: 15:58 Water Volume =
14.84 18.5
Time DTW Pump Rate Vol. pH DO Redox Turbidity Color Odor24 hr. ft. ml/min. gal. mg/L mV NTU15:22 14.93 100.00 5.41 0.15 190.00 46.40 Clear No
15:30 14.93 100.00 5.41 0.16 183.00 62.70 Clear No
15:42 14.93 100.00 5.43 0.12 180.00 3.20 Clear No
15:49 14.93 100.00 5.43 0.11 180.00 0.70 Clear No
15:53 14.93 100.00 5.43 0.12 181.00 0.00 Clear Mo
15:58 14.93 100.00 5.44 0.13 182.00 0.00 Clear No
Sampling Data Zero HS:
Method: Date: Time: 16:00Field Parameters
Sample ID:
DuplicateID:
Partly Cloudy
None
Wind (mph) 9
Precipitation:
Sky:
SAMPLE SET
Table 3+
PFAS
Parameter Method
EPA 537 Modified
PFAS
Bottle
Table 3
2-250 mL poly
250 mL poly
NP
NP
DO (mg/L)
ORP (mV)
0.13
182.00
MW-32_061819 WEATHER CONDITIONS
91.00
250 mL poly NP
Temperature (F):
0.586
06-18-2019
Temp.(oC) PFAS27.31
Screen Interval:
13-18.5
5.44pH
STABILIZED PARAMETERS
0.16Spec. Cond.(mS/cm)
Turbidity (NTU)
Pres.
Peristaltic Pump
Spec. Cond.mS/cm
Total Volume Purged (gallons):
Temp.oC
Initial Depth to Water (ft.):
0.17 29.29
0.16 28.80 Water level stable at 14.93
0.16 28.41
0.16 28.05
0.16 27.76
Comments
WELL SAMPLING RECORD
= (Total Depth of Well - Depth To Water ) x Casing Volume per Foot
Chemours Fayetteville 2
Curtis Brown and Charles Tart
WATER VOLUME CALCULATION
Other Tracy Ovbey
MW-32
Project Manager:
Depth to Well Bottom (ft.):
0.16 27.31

Site Name: Well ID: Well Diameter: Inches
Samplers: Event:
Purging Data Pump Depth:
Pump Loc:
Method: Date: 07-18-2019 Time: 09:32 Water Volume =
14.45
Time DTW Pump Rate Vol. pH DO Redox Turbidity Color Odor24 hr. ft. ml/min. gal. mg/L mV NTU
14.51 6.82 0.00 65.00 8.60 Clear No
14.51 6.74 0.00 110.00 16.20 Clear No
14.51 6.69 0.00 131.00 2.40 Clear No
14.51 6.69 0.00 110.00 5.90 Clear No
14.51 6.67 0.00 121.00 6.40 Clear No
14.51 6.61 0.00 137.00 1.70 Clear No
14.51 6.55 0.00 147.00 1.20 Clear No
14.51 6.54 0.00 150.00 0.70 Clear No
Sampling Data Zero HS:
Method: Date: Time: 10:30Field Parameters
Sample ID:
DuplicateID:
Sunny
None
Wind (mph) 11
Precipitation:
Sky:
Comments
SAMPLE SET
Table 3+
PFAS
Parameter Method
EPA 537 Modified
PFAS
Bottle
Table 3
2-250 mL poly
250 mL poly
NP
NP
0.17 22.49
DO (mg/L)
ORP (mV) 150.00
GW0619-MW-33 WEATHER CONDITIONS
GW0619-MW-33-D
89.00
250 mL poly NP
Temperature (F):
-2.312
07-18-2019
Peristaltic Pump
Temp.(oC) PFAS22.64
Screen Interval:
12-17
6.54pH
STABILIZED PARAMETERS
0.17
0.70
Spec. Cond.(mS/cm)
Turbidity (NTU)
Pres.
Depth to Well Bottom (ft.):
Peristaltic Pump
Spec. Cond.mS/cm
Total Volume Purged (gallons):
Temp.oC
Initial Depth to Water (ft.):
0.17 22.35
0.17 22.51
0.17 22.11
0.17 22.08
0.17 22.22
WELL SAMPLING RECORD
= (Total Depth of Well - Depth To Water ) x Casing Volume per Foot
Chemours Fayetteville 2
Charles Pace Luke Tart
WATER VOLUME CALCULATION
Other Tracy Ovbey
bottom of well
MW-33
Project Manager:
0.17 22.66
0.17 22.64

Site Name: Well ID: Well Diameter: Inches
Samplers: Event:
Purging Data Pump Depth:
Pump Loc:
Method: Date: 08-12-2019 Time: 11:29 Water Volume =
14.3
Time DTW Pump Rate Vol. pH DO Redox Turbidity Color Odor24 hr. ft. ml/min. gal. mg/L mV NTU
14.34 6.24 1.67 126.00 7.90 Clear No
14.33 6.29 0.38 135.00 0.00 Clear No
14.33 6.28 0.25 144.00 0.00 Clear No
14.33 6.28 0.13 149.00 0.00 Clear No
14.33 6.28 0.10 153.00 0.00 Clear No
14.33 6.28 0.07 155.00 0.00 Clear No
Sampling Data Zero HS:
Method: Date: Time: 12:10Field Parameters
Sample ID:
DuplicateID:
Sunny
Wind (mph) 4
Precipitation:
Sky:
SAMPLE SET
Table 3+
PFAS
Parameter Method
EPA 537 Modified
PFAS
Bottle
Table 3
2-250 mL poly
250 mL poly
NP
NP
DO (mg/L)
ORP (mV)
0.07
155.00
GW0619-MW-33 WEATHER CONDITIONS
89.00
250 mL poly NP
Temperature (F):
-2.288
08-12-2019
Low Flow: Geo Pump
Temp.(oC) PFAS25.71
Screen Interval:
12-17
6.28pH
STABILIZED PARAMETERS
0.14Spec. Cond.(mS/cm)
Turbidity (NTU)
Pres.
Peristaltic Pump
Spec. Cond.mS/cm
Total Volume Purged (gallons):
Temp.oC
Initial Depth to Water (ft.):
0.14 26.73
0.14 27.06
0.14 26.93
0.14 26.22
0.14 25.61
Comments
WELL SAMPLING RECORD
= (Total Depth of Well - Depth To Water ) x Casing Volume per Foot
Chemours Fayetteville 2
CHARLES PACE Thomas Strayhorn
WATER VOLUME CALCULATION
Other Tracy Ovbey
bottom of well
MW-33
Project Manager:
Depth to Well Bottom (ft.):
0.14 25.71

Site Name: Well ID: Well Diameter: Inches
Samplers: Event:
Purging Data Pump Depth:
Pump Loc:
Method: Date: 06-18-2019 Time: 15:27 Water Volume =
14.29 19.82
Time DTW Pump Rate Vol. pH DO Redox Turbidity Color Odor24 hr. ft. ml/min. gal. mg/L mV NTU14:59 14.34 275.00 5.32 2.10 294.00 50.60 Hazy
15:06 14.34 275.00 5.38 1.29 302.00 18.50 Clear
15:08 14.34 275.00 5.37 1.31 304.00 26.10 Clear
15:17 14.34 275.00 5.34 1.13 306.00 15.10 Clear
15:21 14.34 5.34 1.05 307.00 7.90 Clear
15:27 14.34 5.34 1.03 307.00 6.80
Sampling Data Zero HS:
Method: Date: Time: 15:27Field Parameters
Sample ID:
DuplicateID:
Partly Sunny
None
Wind (mph) 8
Precipitation:
Sky:
SAMPLE SET
Table 3+
PFAS
Parameter Method
EPA 537 Modified
PFAS
Bottle
Table 3
2-250 mL poly
250 mL poly
NP
NP
DO (mg/L)
ORP (mV)
1.03
307.00
MW-33_061819 WEATHER CONDITIONS
MW-33_061819-D
91.00
250 mL poly NP
Temperature (F):
0.885
06-18-2019
Low Flow: Geo Pump
Temp.(oC) PFAS23.28
Screen Interval:
12-17
5.34pH
STABILIZED PARAMETERS
0.16
6.80
Spec. Cond.(mS/cm)
Turbidity (NTU)
Pres.
Dedicated tubing
Spec. Cond.mS/cm
Total Volume Purged (gallons):
Temp.oC
Initial Depth to Water (ft.):
0.16 24.00
0.16 23.77
0.16 23.82
0.16 23.43
0.16 23.47
Comments
WELL SAMPLING RECORD
= (Total Depth of Well - Depth To Water ) x Casing Volume per Foot
Chemours Fayetteville 2
Ken Stuart Sarah Barrett
WATER VOLUME CALCULATION
Other Tracy Ovbey
19within screen
MW-33
Project Manager:
Depth to Well Bottom (ft.):
0.16 23.28

Site Name: Well ID: Well Diameter: Inches
Samplers: Event:
Purging Data Pump Depth:
Pump Loc:
Method: Date: 07-18-2019 Time: 08:16 Water Volume =
15.98
Time DTW Pump Rate Vol. pH DO Redox Turbidity Color Odor24 hr. ft. ml/min. gal. mg/L mV NTU
16.50 6.60 0.35 42.00 1000.00 Black No
16.40 6.67 0.00 37.00 378.00 Dark cloudy color No
16.40 6.73 0.00 27.00 316.00 Cloudy No
16.40 6.77 0.00 20.00 300.00 Cloudy No
16.40 6.78 0.00 16.00 301.00 Cloudy No
16.40 6.79 0.00 15.00 305.00 Cloudy No
16.40 6.81 0.00 13.00 330.00 Cloudy No
16.40 6.82 0.00 12.00 345.00 Cloudy No
16.40 6.81 0.00 13.00 367.00 Cloudy No
16.40 6.76 0.00 14.00 374.00 Cloudy No
16.40 6.82 0.00 12.00 378.00 Cloudy No
Sampling Data Zero HS:
Method: Date: Time: 09:25Field Parameters
Sample ID:
DuplicateID:
Sunny
None
Wind (mph) 10
Precipitation:
Sky:
Comments
SAMPLE SET
Table 3+
PFAS
Parameter Method
EPA 537 Modified
PFAS
Bottle
Table 3
2-250 mL poly
250 mL poly
NP
NP
0.18 21.81
DO (mg/L)
ORP (mV) 12.00
GW0619-MW-34 WEATHER CONDITIONS
81.00
250 mL poly NP
Temperature (F):
-2.557
07-18-2019
Peristaltic Pump
Temp.(oC) PFAS21.85
Screen Interval:
17-22
6.82pH
STABILIZED PARAMETERS
0.18
378.00
Spec. Cond.(mS/cm)
Turbidity (NTU)
Pres.
Depth to Well Bottom (ft.):
Dedicated tubing
Spec. Cond.mS/cm
Total Volume Purged (gallons):
Temp.oC
Initial Depth to Water (ft.):
0.16 21.38
0.16 21.70
0.17 21.54
0.17 21.77
0.18 21.79
WELL SAMPLING RECORD
= (Total Depth of Well - Depth To Water ) x Casing Volume per Foot
Chemours Fayetteville 2
Charles Pace
WATER VOLUME CALCULATION
Other Tracy Ovbey
MW-34
Project Manager:
0.18 21.67
0.13 21.80
0.18 21.83
0.18 21.76
0.18 21.85 Due to lack of stabilization, the 4 samples were taken in 1-liter amber

Site Name: Well ID: Well Diameter: Inches
Samplers: Event:
Purging Data Pump Depth:
Pump Loc:
Method: Date: 08-09-2019 Time: 12:07 Water Volume =
16.11
Time DTW Pump Rate Vol. pH DO Redox Turbidity Color Odor24 hr. ft. ml/min. gal. mg/L mV NTU
16.18 6.09 0.00 49.00 261.00 Dark grey
16.19 6.04 0.00 60.00 29.70
16.19 6.02 0.00 67.00 0.00
16.19 6.06 0.00 66.00 2.90
16.19 6.07 0.00 66.00 12.50
Sampling Data Zero HS:
Method: Date: Time: 12:50Field Parameters
Sample ID:
DuplicateID:
Sunny
None
Wind (mph)
Precipitation:
Sky:
Comments
SAMPLE SET
Table 3+
PFAS
Parameter Method
EPA 537 Modified
PFAS
Bottle
Table 3
2-250 mL poly
250 mL poly
NP
NP
DO (mg/L)
ORP (mV) 66.00
GW0619-MW-34 WEATHER CONDITIONS
GW0619-MW-34-D
97.00
250 mL poly NP
Temperature (F):
-2.578
08-09-2019
Low Flow: Geo Pump
Temp.(oC) PFAS27.44
Screen Interval:
17-22
6.07pH
STABILIZED PARAMETERS
0.13
12.50
Spec. Cond.(mS/cm)
Turbidity (NTU)
Pres.
Depth to Well Bottom (ft.):
Dedicated tubing
Spec. Cond.mS/cm
Total Volume Purged (gallons):
Temp.oC
Initial Depth to Water (ft.):
0.12 32.58
0.12 28.53
0.13 27.77
0.13 27.68
0.13 27.44
WELL SAMPLING RECORD
= (Total Depth of Well - Depth To Water ) x Casing Volume per Foot
Chemours Fayetteville 2
CHARLES PACE Steven Boor
WATER VOLUME CALCULATION
Other Tracy Ovbey
20within screen
MW-34
Project Manager:
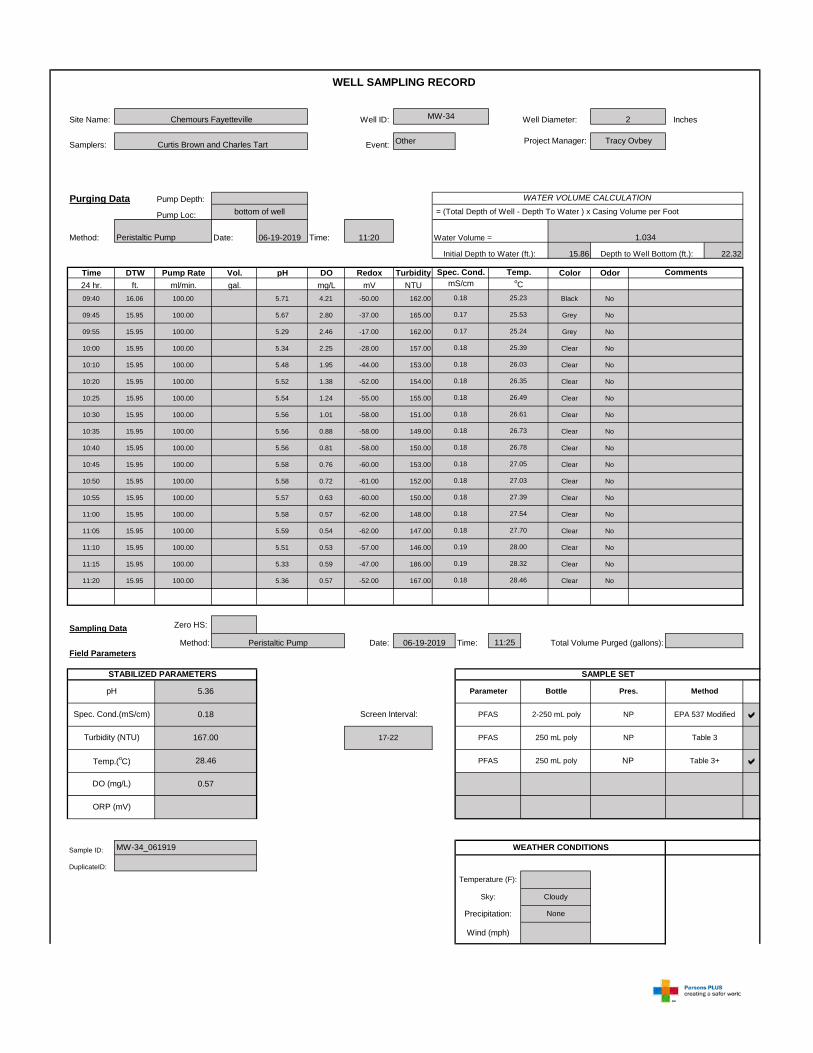
Site Name: Well ID: Well Diameter: Inches
Samplers: Event:
Purging Data Pump Depth:
Pump Loc:
Method: Date: 06-19-2019 Time: 11:20 Water Volume =
15.86 22.32
Time DTW Pump Rate Vol. pH DO Redox Turbidity Color Odor24 hr. ft. ml/min. gal. mg/L mV NTU09:40 16.06 100.00 5.71 4.21 -50.00 162.00 Black No
09:45 15.95 100.00 5.67 2.80 -37.00 165.00 Grey No
09:55 15.95 100.00 5.29 2.46 -17.00 162.00 Grey No
10:00 15.95 100.00 5.34 2.25 -28.00 157.00 Clear No
10:10 15.95 100.00 5.48 1.95 -44.00 153.00 Clear No
10:20 15.95 100.00 5.52 1.38 -52.00 154.00 Clear No
10:25 15.95 100.00 5.54 1.24 -55.00 155.00 Clear No
10:30 15.95 100.00 5.56 1.01 -58.00 151.00 Clear No
10:35 15.95 100.00 5.56 0.88 -58.00 149.00 Clear No
10:40 15.95 100.00 5.56 0.81 -58.00 150.00 Clear No
10:45 15.95 100.00 5.58 0.76 -60.00 153.00 Clear No
10:50 15.95 100.00 5.58 0.72 -61.00 152.00 Clear No
10:55 15.95 100.00 5.57 0.63 -60.00 150.00 Clear No
11:00 15.95 100.00 5.58 0.57 -62.00 148.00 Clear No
11:05 15.95 100.00 5.59 0.54 -62.00 147.00 Clear No
11:10 15.95 100.00 5.51 0.53 -57.00 146.00 Clear No
11:15 15.95 100.00 5.33 0.59 -47.00 186.00 Clear No
11:20 15.95 100.00 5.36 0.57 -52.00 167.00 Clear No
Sampling Data Zero HS:
Method: Date: Time: 11:25Field Parameters
Sample ID:
DuplicateID:
Cloudy
None
Wind (mph)
Precipitation:
Sky:
Comments
SAMPLE SET
Table 3+
PFAS
Parameter Method
EPA 537 Modified
PFAS
Bottle
Table 3
2-250 mL poly
250 mL poly
NP
NP
0.18 26.35
DO (mg/L)
ORP (mV)
0.57
MW-34_061919 WEATHER CONDITIONS
250 mL poly NP
Temperature (F):
1.034
06-19-2019
Peristaltic Pump
Temp.(oC) PFAS28.46
Screen Interval:
17-22
5.36pH
STABILIZED PARAMETERS
0.18
167.00
Spec. Cond.(mS/cm)
Turbidity (NTU)
Pres.
Depth to Well Bottom (ft.):
Peristaltic Pump
Spec. Cond.mS/cm
Total Volume Purged (gallons):
Temp.oC
Initial Depth to Water (ft.):
0.18 25.23
0.17 25.53
0.17 25.24
0.18 25.39
0.18 26.03
WELL SAMPLING RECORD
= (Total Depth of Well - Depth To Water ) x Casing Volume per Foot
Chemours Fayetteville 2
Curtis Brown and Charles Tart
WATER VOLUME CALCULATION
Other Tracy Ovbey
bottom of well
MW-34
Project Manager:
0.18 26.49
0.18 26.61
0.18 26.73
0.18 26.78
0.18 27.05
0.18 27.03
0.18 27.39
0.18 27.54
0.18 28.46
0.18 27.70
0.19 28.00
0.19 28.32


Site Name: Well ID: Well Diameter: Inches
Samplers: Event:
Purging Data Pump Depth:
Pump Loc:
Method: Date: 07-17-2019 Time: 16:07 Water Volume =
15.46
Time DTW Pump Rate Vol. pH DO Redox Turbidity Color Odor24 hr. ft. ml/min. gal. mg/L mV NTU
15.56 6.37 2.51 -44.00 1000.00 Black No
15.57 5.86 0.13 -21.00 840.00 Black No
15.57 5.80 0.00 -30.00 609.00 Cloudy No
15.57 5.99 0.00 -42.00 377.00 Cloudy No
15.57 5.88 0.00 -40.00 385.00 Black No
15.57 5.72 0.00 -38.00 391.00 Black No
15.57 5.70 0.00 -40.00 410.00 Black No
Sampling Data Zero HS:
Method: Date: Time: 17:10Field Parameters
Sample ID:
DuplicateID:
0.18 24.03
Partly Cloudy
None
Wind (mph) 12
Precipitation:
Sky:
SAMPLE SET
Table 3+
PFAS
Parameter Method
EPA 537 Modified
PFAS
Bottle
Table 3
2-250 mL poly
250 mL poly
NP
NP
DO (mg/L)
ORP (mV)
GW0619-MW-35 WEATHER CONDITIONS
102.00
250 mL poly NP
Temperature (F):
-2.474
07-17-2019
Peristaltic Pump
Temp.(oC) PFAS23.88
Screen Interval:
14-19
5.70pH
STABILIZED PARAMETERS
0.18
410.00
Spec. Cond.(mS/cm)
Turbidity (NTU)
Pres.
Dedicated tubing
Spec. Cond.mS/cm
Total Volume Purged (gallons):
Temp.oC
Initial Depth to Water (ft.):
0.36 24.82
0.22 24.21
0.20 24.17
0.18 25.39
0.18 24.11
Comments
0.18 23.88 Due to lack of stabilization, 4 samples were taken in 1-liter amber
WELL SAMPLING RECORD
= (Total Depth of Well - Depth To Water ) x Casing Volume per Foot
Chemours Fayetteville 2
Charles Pace Luke Tart
WATER VOLUME CALCULATION
Other Tracy Ovbey
bottom of well
MW-35
Project Manager:
Depth to Well Bottom (ft.):

Site Name: Well ID: Well Diameter: Inches
Samplers: Event:
Purging Data Pump Depth:
Pump Loc:
Method: Date: 08-09-2019 Time: 10:36 Water Volume =
15.35 21.9
Time DTW Pump Rate Vol. pH DO Redox Turbidity Color Odor24 hr. ft. ml/min. gal. mg/L mV NTU
15.45 6.76 0.00 -78.00 719.00 Black
15.44 6.47 0.00 -50.00 1000.00
15.44 6.34 0.00 -44.00 830.00
15.44 6.38 0.00 -47.00 890.00
15.44 6.37 0.00 -46.00 903.00
15.44 6.68 0.00 -70.00 1000.00
15.44 6.51 0.00 -70.00 940.00
15.44 6.49 0.00 -74.00 671.00
15.44 6.33 0.00 -55.00 278.00
15.44 6.32 0.00 -49.00 173.00
15.44 6.33 0.00 -48.00 171.00
15.44 6.32 0.00 -48.00 180.00
Sampling Data Zero HS:
Method: Date: Time: 12:00Field Parameters
Sample ID:
DuplicateID:
Sunny
None
Wind (mph)
Precipitation:
Sky:
Comments
SAMPLE SET
Table 3+
PFAS
Parameter Method
EPA 537 Modified
PFAS
Bottle
Table 3
2-250 mL poly
250 mL poly
NP
NP
0.36 29.10
DO (mg/L)
ORP (mV)
GW0619-MW-35 WEATHER CONDITIONS
96.00
250 mL poly NP
Temperature (F):
1.048
08-09-2019
Low Flow: Geo Pump
Temp.(oC) PFAS26.36
Screen Interval:
14-19
6.32pH
STABILIZED PARAMETERS
0.17
180.00
Spec. Cond.(mS/cm)
Turbidity (NTU)
Pres.
Depth to Well Bottom (ft.):
Dedicated tubing
Spec. Cond.mS/cm
Total Volume Purged (gallons):
Temp.oC
Initial Depth to Water (ft.):
0.38 25.18
0.22 25.18
0.19 25.15
0.20 25.82
0.20 27.55 Pedi pump malfunctioned; pumping was stopped, adjusted, and
WELL SAMPLING RECORD
= (Total Depth of Well - Depth To Water ) x Casing Volume per Foot
Chemours Fayetteville 2
CHARLES PACE Steven Boor
WATER VOLUME CALCULATION
Other Tracy Ovbey
18within screen
MW-35
Project Manager:
0.25 29.40
0.25 30.69
0.17 26.36
0.16 27.07
0.17 26.41
0.17 26.15

Site Name: Well ID: Well Diameter: Inches
Samplers: Event:
Purging Data Pump Depth:
Pump Loc:
Method: Date: 06-18-2019 Time: 14:59 Water Volume =
15.27 19
Time DTW Pump Rate Vol. pH DO Redox Turbidity Color Odor24 hr. ft. ml/min. gal. mg/L mV NTU14:00 15.35 300.00 6.24 5.37 -3.00 646.00 Black No
14:05 15.39 300.00 5.82 0.12 -26.00 784.00 Black No
14:10 15.39 300.00 5.85 0.00 -39.00 1000.00 Black No
14:15 15.39 300.00 5.88 0.00 -48.00 827.00 Black No
14:20 15.39 300.00 5.87 0.00 -52.00 1000.00 Black No
14:25 15.39 300.00 5.86 0.00 -55.00 1000.00 Black No
14:30 15.39 300.00 5.86 0.00 -56.00 1000.00 Black No
14:35 15.39 300.00 6.69 0.00 -124.00 1000.00 Black No
14:40 15.39 300.00 5.88 0.00 -58.00 1000.00 Black No
14:45 15.39 300.00 5.86 0.00 -59.00 1000.00 Black No
14:50 15.39 300.00 5.85 0.00 -60.00 1000.00 Black No
14:55 15.39 300.00 5.83 0.00 -60.00 1000.00 Black No
14:59 15.39 300.00 5.82 0.00 -60.00 1000.00 Black No
Sampling Data Zero HS:
Method: Date: Time: 15:10Field Parameters
Sample ID:
DuplicateID:
Partly Sunny
None
Wind (mph) 10
Precipitation:
Sky:
Comments
SAMPLE SET
Table 3+
PFAS
Parameter Method
EPA 537 Modified
PFAS
Bottle
Table 3
2-250 mL poly
250 mL poly
NP
NP
0.22 21.54
DO (mg/L)
ORP (mV)
MW-35_061819 WEATHER CONDITIONS
90.00
250 mL poly NP
Temperature (F):
0.597
06-18-2019
Low Flow: Geo Pump
Temp.(oC) PFAS21.94
Screen Interval:
14-19
5.82pH
STABILIZED PARAMETERS
0.21
1000.00
Spec. Cond.(mS/cm)
Turbidity (NTU)
Pres.
Depth to Well Bottom (ft.):
Dedicated tubing
Spec. Cond.mS/cm
Total Volume Purged (gallons):
Temp.oC
Initial Depth to Water (ft.):
0.25 22.92
0.20 22.45
0.20 22.43
0.21 22.25
0.22 21.66
WELL SAMPLING RECORD
= (Total Depth of Well - Depth To Water ) x Casing Volume per Foot
Chemours Fayetteville 2
Charles Pace Jacob Limpus
WATER VOLUME CALCULATION
Other Tracy Ovbey
within screen
MW-35
Project Manager:
0.22 21.51
0.88 21.35
0.21 21.29
0.21 21.94
0.22 21.28
0.22 21.32
0.21 21.33

Site Name: Well ID: Well Diameter: Inches
Samplers: Event:
Purging Data Pump Depth:
Pump Loc:
Method: Date: 07-17-2019 Time: 13:30 Water Volume =
15.71
Time DTW Pump Rate Vol. pH DO Redox Turbidity Color Odor24 hr. ft. ml/min. gal. mg/L mV NTU
15.85 6.87 6.74 -196.00 1000.00 Black No
15.85 6.40 0.00 -176.00 1000.00 Black No
15.87 6.39 0.00 -177.00 1000.00 Black No
15.87 6.44 0.00 -182.00 1000.00 Black No
15.87 6.45 0.00 -135.00 1000.00 Black No
15.87 6.49 0.00 -188.00 1000.00 Black No
15.87 6.49 1.44 -190.00 1000.00 Black No
15.87 6.51 0.00 -193.00 1000.00 Blwck No
15.87 6.50 0.00 -194.00 1000.00 Black No
15.87 6.50 0.00 -194.00 1000.00 Black No
15.87 6.53 0.00 -197.00 1000.00 Black No
15.87 6.68 0.00 -120.00 1000.00 Black No
15.87 6.40 0.00 -158.00 1000.00 Black No
16.87 6.44 0.00 -169.00 1000.00 Black No
15.87 6.43 0.00 -175.00 1000.00 Black No
15.87 6.47 0.00 -182.00 1000.00 Black No
15.87 6.48 0.00 -184.00 1000.00 Black No
Sampling Data Zero HS:
Method: Date: Time: 15:40Field Parameters
Sample ID:
DuplicateID:
0.27 25.24
0.27 25.55
0.27 25.63 Due to lack stabilization, samples were taken in 4 1-liter amber bottles
0.32 26.73
0.27 25.58
0.27 24.34
0.28 25.02
0.28 25.09
0.28 25.00
0.29 25.26
0.29 25.02
WELL SAMPLING RECORD
= (Total Depth of Well - Depth To Water ) x Casing Volume per Foot
Chemours Fayetteville 2
Charles Pace
WATER VOLUME CALCULATION
Other Tracy Ovbey
bottom of well
MW-36
Project Manager:
Depth to Well Bottom (ft.):
Peristaltic Pump
Spec. Cond.mS/cm
Total Volume Purged (gallons):
Temp.oC
Initial Depth to Water (ft.):
0.56 25.06
0.31 25.55
0.30 25.22
0.30 25.38
0.30 25.20
Temperature (F):
-2.514
07-17-2019
Low Flow: Geo Pump
Temp.(oC) PFAS25.63
Screen Interval:
12-17
6.48pH
STABILIZED PARAMETERS
0.27
1000.00
Spec. Cond.(mS/cm)
Turbidity (NTU)
Pres.
101.00
250 mL poly NP
DO (mg/L)
ORP (mV)
GW0619-MW-36 WEATHER CONDITIONS
Comments
SAMPLE SET
Table 3+
PFAS
Parameter Method
EPA 537 Modified
PFAS
Bottle
Table 3
2-250 mL poly
250 mL poly
NP
NP
0.29 24.76
Sunny
None
Wind (mph)
Precipitation:
Sky:

Site Name: Well ID: Well Diameter: Inches
Samplers: Event:
Purging Data Pump Depth:
Pump Loc:
Method: Date: 08-09-2019 Time: 09:14 Water Volume =
15.61 19.4
Time DTW Pump Rate Vol. pH DO Redox Turbidity Color Odor24 hr. ft. ml/min. gal. mg/L mV NTU
15.71 7.11 0.00 -152.00 1000.00 Black
15.71 6.74 0.00 -113.00 655.00
15.71 6.66 0.00 -107.00 261.00
15.71 6.69 0.00 -111.00 276.00
15.71 6.71 0.00 -115.00 269.00
15.71 6.72 0.00 -118.00 280.00
15.71 6.75 0.00 -122.00 289.00
15.71 6.76 0.00 -124.00 293.00
Sampling Data Zero HS:
Method: Date: Time: 10:35Field Parameters
Sample ID:
DuplicateID:
Partly Sunny
None
Wind (mph)
Precipitation:
Sky:
Comments
SAMPLE SET
Table 3+
PFAS
Parameter Method
EPA 537 Modified
PFAS
Bottle
Table 3
2-250 mL poly
250 mL poly
NP
NP
0.26 24.31
DO (mg/L)
ORP (mV)
GW0619-MW-36 WEATHER CONDITIONS
83.00
250 mL poly NP
Temperature (F):
0.606
08-09-2019
Low Flow: Geo Pump
Temp.(oC) PFAS24.57
Screen Interval:
12-17
6.76pH
STABILIZED PARAMETERS
0.25
293.00
Spec. Cond.(mS/cm)
Turbidity (NTU)
Pres.
Depth to Well Bottom (ft.):
Dedicated tubing
Spec. Cond.mS/cm
Total Volume Purged (gallons):
Temp.oC
Initial Depth to Water (ft.):
0.72 23.33
0.31 23.45
0.27 23.70
0.27 23.76
0.26 24.10
WELL SAMPLING RECORD
= (Total Depth of Well - Depth To Water ) x Casing Volume per Foot
Chemours Fayetteville 2
CHARLES PACE Steven Boor
WATER VOLUME CALCULATION
Other Tracy Ovbey
bottom of well
MW-36
Project Manager:
0.26 24.43
0.25 24.57
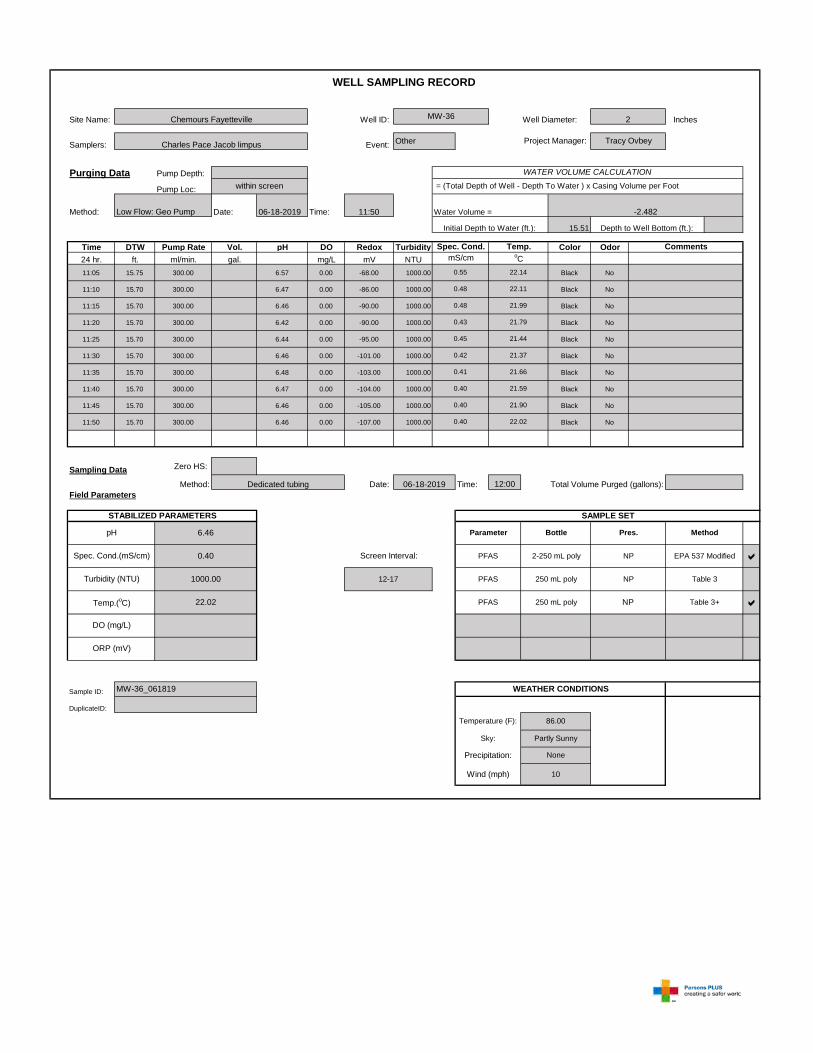
Site Name: Well ID: Well Diameter: Inches
Samplers: Event:
Purging Data Pump Depth:
Pump Loc:
Method: Date: 06-18-2019 Time: 11:50 Water Volume =
15.51
Time DTW Pump Rate Vol. pH DO Redox Turbidity Color Odor24 hr. ft. ml/min. gal. mg/L mV NTU11:05 15.75 300.00 6.57 0.00 -68.00 1000.00 Black No
11:10 15.70 300.00 6.47 0.00 -86.00 1000.00 Black No
11:15 15.70 300.00 6.46 0.00 -90.00 1000.00 Black No
11:20 15.70 300.00 6.42 0.00 -90.00 1000.00 Black No
11:25 15.70 300.00 6.44 0.00 -95.00 1000.00 Black No
11:30 15.70 300.00 6.46 0.00 -101.00 1000.00 Black No
11:35 15.70 300.00 6.48 0.00 -103.00 1000.00 Black No
11:40 15.70 300.00 6.47 0.00 -104.00 1000.00 Black No
11:45 15.70 300.00 6.46 0.00 -105.00 1000.00 Black No
11:50 15.70 300.00 6.46 0.00 -107.00 1000.00 Black No
Sampling Data Zero HS:
Method: Date: Time: 12:00Field Parameters
Sample ID:
DuplicateID:
Partly Sunny
None
Wind (mph) 10
Precipitation:
Sky:
Comments
SAMPLE SET
Table 3+
PFAS
Parameter Method
EPA 537 Modified
PFAS
Bottle
Table 3
2-250 mL poly
250 mL poly
NP
NP
0.42 21.37
DO (mg/L)
ORP (mV)
MW-36_061819 WEATHER CONDITIONS
86.00
250 mL poly NP
Temperature (F):
-2.482
06-18-2019
Low Flow: Geo Pump
Temp.(oC) PFAS22.02
Screen Interval:
12-17
6.46pH
STABILIZED PARAMETERS
0.40
1000.00
Spec. Cond.(mS/cm)
Turbidity (NTU)
Pres.
Depth to Well Bottom (ft.):
Dedicated tubing
Spec. Cond.mS/cm
Total Volume Purged (gallons):
Temp.oC
Initial Depth to Water (ft.):
0.55 22.14
0.48 22.11
0.48 21.99
0.43 21.79
0.45 21.44
WELL SAMPLING RECORD
= (Total Depth of Well - Depth To Water ) x Casing Volume per Foot
Chemours Fayetteville 2
Charles Pace Jacob limpus
WATER VOLUME CALCULATION
Other Tracy Ovbey
within screen
MW-36
Project Manager:
0.40 21.90
0.40 22.02
0.41 21.66
0.40 21.59