plymouth district heating · table 3—4 plot reasons for unknown ... plymouth district heating ......
TRANSCRIPT

Copyright © 1976 - 2014 BuroHappold Engineering. All Rights Reserved.
Plymouth District Heating
Millbay Heat Network Feasibility Study
033238
5 November 2014
Revision 01


Plymouth District Heating Revision 01
Millbay Heat Network Feasibility Study 5 November 2014
Copyright © 1976 - 2014 BuroHappold Engineering. All Rights Reserved. Page 3
Revision Description Issued by Date Checked
00 Draft for comment JE 20/10/14 SB
01 Final for issue JE 05/11/14 AY
O:\033238 Plymouth District Heating\F42 Sustainability\03 Reports\Millbay\Report final issue\141020 JG 033238
Millbay Heat Network Feasibility Study 01.docx
This report has been prepared for the sole benefit, use and information of Plymouth County Council for the purposes
set out in the report or instructions commissioning it. The liability of BuroHappold Limited in respect of the
information contained in the report will not extend to any third party.
author Justin Etherington & Jon
Gregg
date 20/10/2014
approved Alasdair Young
signature
date 5/11/14
..


Plymouth District Heating Revision 01
Millbay Heat Network Feasibility Study 5 November 2014
Copyright © 1976 - 2014 BuroHappold Engineering. All Rights Reserved. Page 5
Contents
1 Executive Summary 9
1.1 Millbay Masterplan 9
1.2 Millbay Cluster 9
1.3 Opportunities 10
1.4 Pavilions Cluster 10
1.5 Next Steps 11
2 Introduction 12
2.1 Report outline and goals 12
2.2 Scope of study 12
2.2.1 Methodology - Millbay 13
2.3 Policy Review 14
2.3.1 National Planning Policy Framework 14
2.3.2 Plymouth City Council Core Strategy 14
2.3.3 Millbay and Stonehouse Area Action Plan; 2006-2021, PCC, adapted 2007 14
2.4 Methodology 16
3 Millbay Masterplan analysis 17
3.1 Millbay developers and phasing 17
3.2 Network Design 19
3.3 Approach 21
3.4 Load schedule 22
4 Millbay cluster 25
4.1 Introduction to cluster 25
4.1.1 Table of connections 26
4.2 Load schedule 27
4.2.1 Cluster Network Phasing 29
4.3 Constraints 32
4.4 Network Details 34

Plymouth District Heating Revision 01
Millbay Heat Network Feasibility Study 5 November 2014
Copyright © 1976 - 2014 BuroHappold Engineering. All Rights Reserved. Page 6
4.4.1 Energy Centre 34
4.4.2 Pipework 34
4.4.3 Plant selection 35
4.4.4 Connections 37
4.5 Techno-economic modelling 37
4.5.1 Technical modelling 38
4.5.2 Commercial modelling 39
4.6 Results 41
4.7 Opportunities 43
4.7.1 Alternative heat sources 43
5 Pavilions Cluster 44
5.1 Introduction to cluster 44
6 Conclusions 45
6.1 Millbay Cluster 45
6.2 Pavilions Cluster 46
6.3 Next steps 46
Appendix A Millbay Cluster Financial Modelling Inputs
Appendix B Modelling Assumptions
Table of Tables
Table 1—1 Summary of recommended plant................................................................................................................. 10
Table 1—2 Detailed commercial results for option 2 .................................................................................................... 10
Table 3—1 Building type and Colour ............................................................................................................................... 21
Table 3—2 Plot reasons for inability to connect to a network .................................................................................... 22
Table 3—3 Load Schedule ................................................................................................................................................. 23
Table 3—4 Plot reasons for unknown connection to a network ................................................................................. 24
Table 4—1 Load schedule for Millbay network cluster ................................................................................................. 27
Table 4—2 Indicative network and trunk lengths ......................................................................................................... 34
Table 4—3 Energy centre plant components ................................................................................................................. 35
Table 4—4 Boiler selection and strategy ......................................................................................................................... 35
Table 4—5 Avoided costs for the connections to the heat network scheme ............................................................. 37

Plymouth District Heating Revision 01
Millbay Heat Network Feasibility Study 5 November 2014
Copyright © 1976 - 2014 BuroHappold Engineering. All Rights Reserved. Page 7
Table 4—6 Outline of plant options iterations ............................................................................................................... 38
Table 4—7 Outline of results by options model ............................................................................................................ 38
Table 4—8 Market Led scheme results ............................................................................................................................ 40
Table 4—9 Heat price parity led results .......................................................................................................................... 40
Table 4—10 Technical summary of recommended energy centre plant. ................................................................... 41
Table 4—11 Detailed commercial results for option 2.................................................................................................. 41
Table 6—1 Option 2 techno-economic modelling results ............................................................................................ 46
Table of Figures
Figure 2—1 Methodology Flow Chart ............................................................................................................................. 16
Figure 3—1 Proposed and existing Millbay redevelopment plots and respective developers ............................... 17
Figure 3—2 Millbay Masterplan Phasing ........................................................................................................................ 18
Figure 3—3 proposed heat network clusters .................................................................................................................. 19
Figure 3—4 Proposed network phasing .......................................................................................................................... 20
Figure 3—5 Load schedule creation approach ............................................................................................................... 21
Figure 3—6 Network connection likelihood ................................................................................................................... 22
Figure 4—1 Proposed Millbay heat network clusters ................................................................................................... 25
Figure 4—2 Millbay cluster load visualisation ................................................................................................................ 28
Figure 4—3 Indicative Network route and phasing ...................................................................................................... 29
Figure 4—4 Total heat demand by network phase ........................................................................................................ 30
Figure 4—5 Cumulative total heat demand .................................................................................................................... 30
Figure 4—6 Cumulative peak heat load .......................................................................................................................... 30
Figure 4—7 Annual Heat demand by building typology .............................................................................................. 31
Figure 4—8 Annual heat demand by plot ....................................................................................................................... 31
Figure 4—9 Southern end of the Boulevard constraints .............................................................................................. 32
Figure 4—10 Marina waterfront constraints .................................................................................................................. 33
Figure 4—11 Potential Energy Centre location with direct sea access (Trinity pier shown).................................... 36
Figure 4—12 Scheme NPV vs. years performance ......................................................................................................... 41
Figure 5—1 Proposed Pavilions heat network cluster .................................................................................................. 44
Figure 6—1 Millbay Cluster Indicative Heat Network ................................................................................................... 45

Plymouth District Heating Revision 01
Millbay Heat Network Feasibility Study 5 November 2014
Copyright © 1976 - 2014 BuroHappold Engineering. All Rights Reserved. Page 8
Glossary
Term Definition
CHP Combined heat and power
DE Decentralised energy
DECC Department of Energy and Climate Change
DH District heating
DHW Domestic hot water
DECC Heat Networks Delivery Unit
ESCO Energy Service Company
IRR Internal rate of return
kW Kilowatt
kWh Kilowatt hour
MW Megawatt
MWh Megawatt hour
NPV Net present value
PCC Plymouth City Council
RHI Renewable Heat Incentive

Plymouth District Heating Revision 01
Millbay Heat Network Feasibility Study 5 November 2014
Copyright © 1976 - 2014 BuroHappold Engineering. All Rights Reserved. Page 9
1 Executive Summary
BuroHappold Ltd has been commissioned by Plymouth City Council (PCC) to provide consulting services relating to
the development of heat network projects around Plymouth. This work has been partly funded by the Department of
Energy and Climate Change’s (DECC) Heat Networks Delivery Unit (HNDU).
The Millbay appointment relates to a possible heat network connecting; viable plots within the Millbay Masterplan,
updated mid-2014, developed by MUSE working for the English Cities Fund, further new developments to the south of
Millbay Masterplan by Linden Homes,the redevelopment of the existing Plymouth Pavilions by Akkeron and including
several existing buildings with significant energy loads.
The scope of the Millbay Heat Network Feasibility Study is to provide information to establish high level technical
feasibility for a potential catalyst DE network and a high level assessment of its commercial viability.
The study provides evidence to support the development of a DE network in the Millbay area which is feasible.
However it is likely to require funding support to attract private sector investment. This network and underpins longer
term planning policies under the Plymouth Plan.
1.1 Millbay Masterplan
The Millbay Marina area has been identified as an area of significant growth by the PCC and redevelopment of the
area has been planned with several areas that are currently under construction.
A potential DHN is split into two separate network cluster for analysis, the Millbay Cluster and the Pavilions Cluster,
this is due limited information of the Pavilions redevelopment. If the Millbay Marina network cluster is viable as a
standalone network; further extension to the Pavilions Cluster will further benefit the overall scheme.
Phasing of a heat network will be required as the masterplan is built out. The indicative network and the phasing, has
been produced in line with the 2014 Millbay masterplan. Three network phases have been segregated within the
Millbay cluster, Phases A-C, and the Pavilions Cluster is covered by only Network Phase D.
1.2 Millbay Cluster
The Millbay cluster is based and focussed around the English Cities Fund (ECF) Masterplan as submitted for planning
and dated 06/06/14. Surrounding plots have also been investigated, Ballard House, the existing residential plot on
Custom House lane and the proposed new development, Millbay Marina Village. Existing schemes with individual
boilers have been excluded from the analysis. Future conversion of individual boilers for connection to the heat
network has not been considered in this study.
The Millbay technical analysis proves the cluster to have sufficient heat density for the a district energy scheme with a
line density of 10.8MWh/m and a total heat load of ca. 11,500MWh/a if all potential connections existing and
proposed are connected.

Plymouth District Heating Revision 01
Millbay Heat Network Feasibility Study 5 November 2014
Copyright © 1976 - 2014 BuroHappold Engineering. All Rights Reserved. Page 10
Table 1—1 Summary of recommended plant.
Capex
Network
Cost
Energy Centre cost CHP Thermal
Capacity (MW)
CHP Electrical
Capacity
(MW)
Boiler Capacity
(MW)
Thermal Store
Capacity
£4,116,000 £1,877,000 £2,239,000 0.527 0.505 4.5 50 m3
To analyse the commercial performance of the network two approaches were tested:
a. Fully market led – targets a unit heat price (inclusions/exclusions as described in 4.5.2.1) to return an IRR for
network and energy centre excl. building connection plant of 6% and 10%. Avoided plant included but not
further funding streams for CAPEX offsetting.
b. Heat price parity led – calculates required S106 or grant funding to return an IRR of 6% and 10% with a heat
price of 5.8p/kWh (inclusions/exclusions as described in 4.5.2.1). Avoided plant cost included.
Table 1—2 Detailed commercial results for option 2
Scheme IRR Unit
heat
cost
p/kWh
Capital
Funding
Avoided
costs
S106/ Grant
funding
Yr. 1
Annual
Revenue
NPV @
3.5%
discount
rate
Line
density
MWh/m
MW CHP
capacity/
MWh heat
demand
Market
led
6% 6.1 £4,116,000 £1,300,000 £ - £158,600 £770,200 10.8 0.9
10% 7.1 £4,116,000 £1,300,000 £ - £263,100 £2,436,900 10.8 0.9
Price
parity
6% 5.8 £4,116,000 £1,300,000 £456,860 £127,200 £711,300 10.8 0.9
10% 5.8 £4,116,000 £1,300,000 £ 1,176,799 £127,200 £1,407,200 10.8 0.9
For a market led scheme to be adopted a strong return on investment is required. To achieve an IRR of 10% an
uncompetitive heat price 22% higher than comparative gas price is required.. If a lower IRR of 6% could be considered
acceptable then a unit cost of only 5% above the comparative gas tariff may be charged which may be accepted by
the consumer for the relative reduction in carbon emissions of ca. 37% when compared with a traditional gas fired
system.
By competing on a price parity level the scheme is most likely to gain acceptance from users and consumers existing
and future short term connections. To achieve a 6% IRR the contribution required is ca. £500,000 on top of the
£1,300,000 of avoided plant cost to be reclaimed from developers. To increase the IRR to 10% the contribution
required rises threefold to ca £1,200,000 on top of the avoided plant cost.
Modelling assumed an electricity grid spill price of 6.0p/kWh. Should a private wire scheme be found scheme
commercial performance will improve.
1.3 Opportunities
The situation of the Millbay site provides the opportunity for alternative heat sources to be considered. Vicinity to the
sea could enable water source heat pumps, and the good road connection enable heat only biomass to reduce carbon
intensity of heat.
1.4 Pavilions Cluster
The Pavilions Cluster is focussed around the existing and planned Plymouth Pavilions redevelopment. The current
unknown situation of the Plymouth Pavilions redevelopment the cluster has been considered separately for analysis.

Plymouth District Heating Revision 01
Millbay Heat Network Feasibility Study 5 November 2014
Copyright © 1976 - 2014 BuroHappold Engineering. All Rights Reserved. Page 11
1.5 Next Steps
A detailed feasibility study is recommended for the Millbay cluster as well as the Pavilions cluster when information is
available. This would enable scenario testing and sensitivity testing to a greater resolution of the marina scheme, a full
technical constraints and opportunities analysis, development of a more detailed commercial model and investigate
the impact the Pavilions cluster.

Plymouth District Heating Revision 01
Millbay Heat Network Feasibility Study 5 November 2014
Copyright © 1976 - 2014 BuroHappold Engineering. All Rights Reserved. Page 12
2 Introduction
2.1 Report outline and goals
The Millbay redevelopment provides a significant opportunity for the application of a DHN and this study,
commissioned by the Plymouth County Council (PCC), has been undertaken to investigate the viability and feasibility
of a district heat network (DHN) within the Millbay Area.
BuroHappold Ltd has been commissioned by Plymouth City Council to provide consulting services relating to the
development of heat network projects around Plymouth. This work has been partly funded by the Department of
Energy and Climate Change’s Heat Networks Delivery Unit and Section 106 contributions from PCC. This work is split
into a number of tasks:
City Centre Scheme - Plymouth City Council, University of Plymouth and UPP buildings
Step 1 – Initial feasibility review
Step 2 – Detailed feasibility review and commercial model.
Millbay – review of the potential for a district heating scheme in the Millbay redevelopment area.
This report represents the findings from the Millbay work. The aim of this work is to establish the high level technical
feasibility and commercial viability of a district energy scheme in a part of the city which does not currently have a
district system, focussing around the significant redevelopment of the Millbay Marina.
The delivery of a district energy network would be through negotiation as part of the planning process. This study will
provide evidence to support the development of a DE network in the Millbay area and to underpin longer term
planning policies under the Plymouth Plan.
2.2 Scope of study
The scope of this report relates to the Millbay section of the appointment, covering a heat network feasibility study
providing high level technical feasibility for a potential catalyst DE network and a high level assessment of its
commercial viability. The study will provide an evidence base for potential future investment in a network and the
Millbay area as well as influence PCC policy CC05 to obligate connection to a lower carbon intensity heat network.
Areas to be included in the study are as follows:
The Millbay Masterplan, updated as of 2014
Millbay Marina Village, south of Millbay Masterplan by Linden Homes
The redevelopment of the existing Plymouth Pavilions by Akkeron
Significant existing buildings including; the Duke of Cornwall Hotel, New Continental Hotel, Wesley Court-
The Crescent and Ballard House

Plymouth District Heating Revision 01
Millbay Heat Network Feasibility Study 5 November 2014
Copyright © 1976 - 2014 BuroHappold Engineering. All Rights Reserved. Page 13
2.2.1 Methodology - Millbay
The scope of this report relates to the Millbay section of the appointment relating to a heat network feasibility and
viability study in the Millbay Masterplan, as well as several existing buildings both north and south of the development
area.
Work item Description
Kick off work shop Workshop with client team to confirm study brief, programme, client objectives and key success factors.
Obtain any information not received in advance. Initial site visit to walk site, identify possible building
connections and walk the route of potential network, survey for constraints preventing installation of network.
Data gathering and
review of available
data
Review of masterplan and floor area schedule for new build. Identify suitable energy consumption and peak
load benchmarks. Identify additional existing buildings with potential for connection to the scheme (e.g.
Ballard House). Use of VOA data if available from council on floor area for existing buildings to establish heat
loads. Validate load profiles against existing model. Develop load schedule of potential connections including
annual consumption (kWh), peak loads (kW) and load profile (kW/hr. by month) for each connection.
Identify anchor
loads
Review energy loads to identify key anchor loads based on those with highest potential for connection to heat
network. Selection to be made on basis of heat size or load profile characteristic. Public sector buildings or
those with public sector interest, large heat consumers and new development to be prioritised.
Energy load and
constraints
mapping
Heat loads will be mapped. Key constraints such as the extensive surface water drainage storage tanks in the
area will be mapped. Energy loads will be mapped as circles proportional to the heat loads.
Options
development
Long list of possible options for building connections, infrastructure route and plant type (CHP/biomass/heat
pump). The opportunity to use seawater heat pumps connected to a low temperature heat network and
benefiting from the Renewable Heat Incentive is a key opportunity which should be considered. This
technology is particularly suited to new build development which are already highly energy efficient and do
not require large amounts of space heating or high temperatures. Operating a network at 60 ⁰C rather than 90
⁰C reduces heat loss from the pipes by over 40%.
Energy centre
location
Review of likely energy centre locations including those linked to new development, on areas outside the
consented masterplan or within existing buildings which have suitable plant space. Access to the sea water
will be an important part of location if a heat pump scheme is to be used.
Review of options
with client
Shortlist of options by webex/teleconference with client. During this session a discussion will be held to agree
the most plausible option over two time periods: an initial option which could be delivered in the shorter
term, and a longer term ‘vision’ option which captures the long term potential. Both options will be modelled.
Develop scheme
map
The proposed scheme will be overlaid on a map of the area showing connected buildings and network routes.
High level
modelling of
shortlisted option
Technical model of proposed scheme using high level excel model to undertake load profiling and CHP
operation modelling.
Commercial model based on high level excel model of selected option (base and vision) comparing their
performance using IRR with a common range of input assumptions to be agreed with the client (energy price,
capital cost, fuel costs) to determine whether the scheme is self-financing or whether additional funding is
required via connection charges, grants or other mechanisms
Implementation
review
A brief review of how the scheme could be developed will be undertaken, setting out key requirements for
delivery and reviewing key risks.
Draft report Report setting out results of technical and economic modelling and acting as evidence base for planning
policy in the area with respect to DE.
Workshop to
present results and
final report
Present results to the client team and agree changes to the final report.
Produce final report reflecting comments of the client.

Plymouth District Heating Revision 01
Millbay Heat Network Feasibility Study 5 November 2014
Copyright © 1976 - 2014 BuroHappold Engineering. All Rights Reserved. Page 14
The report is structured as follows:
Section 3 contains analysis of the Millbay Masterplan and surrounding areas, including potential network
design, connection register and high level load schedule
Section 4 considers the only the Identified Millbay Cluster and interrogates it in more detail than is
covered in Section 3, presenting the techno-economic modelling prepared to represent the commercial
viability of the scheme
Section outlines the potential Pavilions cluster and the current level of technical investigation
Section 6 sets out the conclusions and next steps
2.3 Policy Review
2.3.1 National Planning Policy Framework
The National Planning Policy Framework (NPFF) outlines the Government’s planning policies for England and how
these are expected to be applied. The NPPF includes policies relevant to the preparation of this Energy statement by
seeking to secure reductions in greenhouse gas emissions and supporting the delivery of low carbon and associated
infrastructure
2.3.2 Plymouth City Council Core Strategy
The PCC has an overarching aim to reduce their carbon dioxide emissions by 30% by 2020. Has led to the adopted the
Core Strategy Policy CS20 which sets out a requirement for development to incorporate onsite renewable
technologies to reduce carbon emissions. Core Strategy CS20 states that:
All non-residential developments exceeding 1,000 square metres of gross floor space, and new
residential developments comprising 10 or more units (whether new build or conversion) to incorporate
onsite renewable energy production equipment to off-set at least 10% of predicted carbon emissions for
the period up to 2010, rising to 15% for the period 2010-2016.
2.3.3 Millbay and Stonehouse Area Action Plan; 2006-2021, PCC, adapted 2007
Currently the Millbay and Stonehouse AAP only outlines policy relating to architectural form, building use and
development policy. Proposal MS03 outline the ambition for the development area, that a sustainable community will
be created.
Proposal MS03 - Land between Western Approach/ Union Street and East Quay/ Clyde Quay
A sustainable new neighbourhood will be created between East Quay /Clyde Quay and Western Approach/ Union
Street that will incorporate a new Boulevard to provide a strong link between the City Centre and Union Street and the
Millbay waterfront.
Currently the Millbay and Stonehouse AAP does not include any site specific energy or carbon targets. The ambition is
that a policy similar to Policy CC05, in the City Centre and University area, will obligate connection to low carbon heat
network, prioritised over Policy CS20

Plymouth District Heating Revision 01
Millbay Heat Network Feasibility Study 5 November 2014
Copyright © 1976 - 2014 BuroHappold Engineering. All Rights Reserved. Page 15
Policy CC05 - Combined Heat and Power, District Heating and Cooling is the key policy promoting heat networks. The
policy states that delivery of heat network throughout the City Centre and University area will be encouraged. To
enable the delivery of this network:
2. All proposals for non-residential development exceeding 1,000 sq. m of gross floor space and residential
developments comprising 10 or more units (whether new build or conversion) will be encouraged:
a) Where the district wide network is not yet operational in relation to the particular development under consideration,
to:
Make an offsite contribution to the establishment of the network.
Include heating and cooling systems that allow future connection to the local district heating/cooling
networks.
b) Where the district wide network is operational in relation to the particular development under
consideration to:
Connect to the network.
Make an offsite contribution towards local completion of the network
The requirement (set out in Core Strategy Policy CS20) for development to incorporate onsite renewable energy
production equipment is relaxed for such developments, in favour of measures that enable the delivery of area wide
solutions.
Plymouth District Heating Revision 01
Millbay Heat Network Feasibility Study 5 November 2014
Copyright © 1976 - 2014 BuroHappold Engineering. All Rights Reserved. Page 16
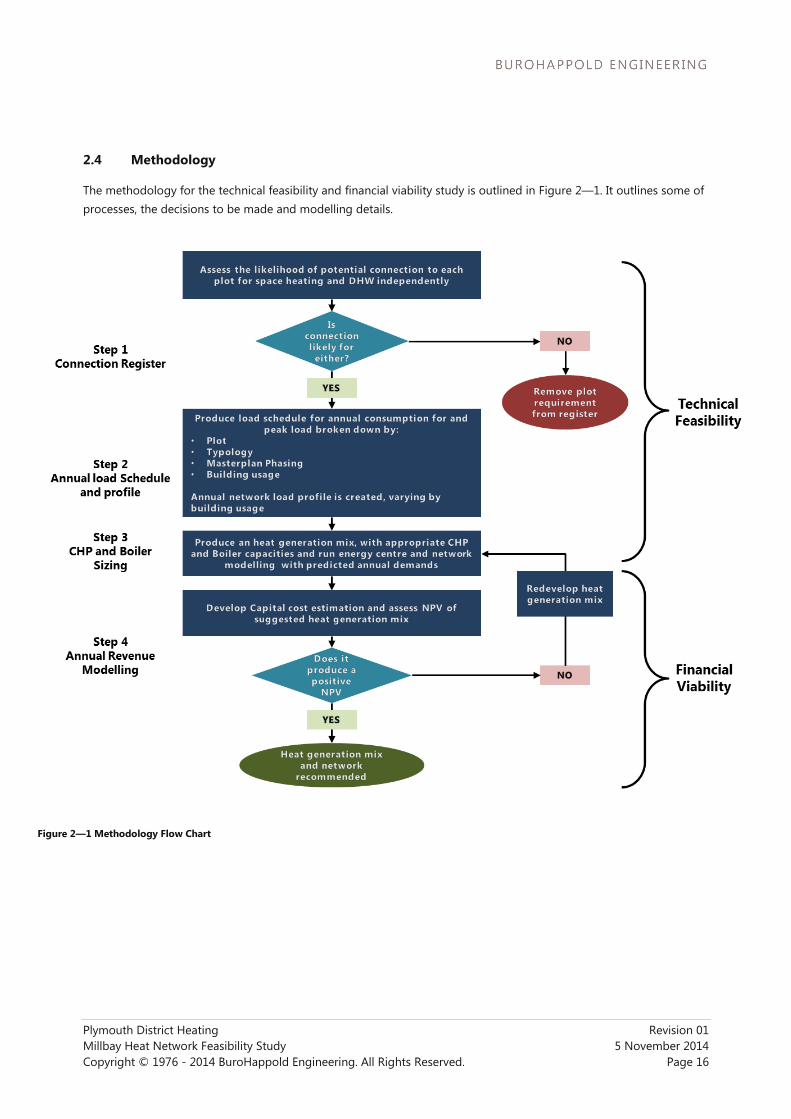
2.4 Methodology
The methodology for the technical feasibility and financial viability study is outlined in Figure 2—1. It outlines some of
processes, the decisions to be made and modelling details.
Figure 2—1 Methodology Flow Chart

Plymouth District Heating Revision 01
Millbay Heat Network Feasibility Study 5 November 2014
Copyright © 1976 - 2014 BuroHappold Engineering. All Rights Reserved. Page 17
3 Millbay Masterplan analysis
3.1 Millbay developers and phasing
The Millbay area redevelopment is currently underway with several plots to the north of the bay, either under
construction or completed. The redevelopment is being undertaken by several varying developers, Figure 3—1
outlines the plots considered in this study, the current state of construction and the associated developers.
Figure 3—1 Proposed and existing Millbay redevelopment plots and respective developers

Plymouth District Heating Revision 01
Millbay Heat Network Feasibility Study 5 November 2014
Copyright © 1976 - 2014 BuroHappold Engineering. All Rights Reserved. Page 18
Figure 3—2 Millbay Masterplan Phasing
MUSE and The English Cities Fund, as of June 2014, has recently updated and resubmitted the Millbay Masterplan for
planning; rationalising the number and massing of the plots included.
Most notably the Plymouth Pavilions redevelopment, Plots E1 – E4, are now under the ownership of Akkeron Group.
The Pavilions redevelopment is current on hold until the development at Home Park is completed.
Home Park is set for completion in summer 2015, and aims to become a hub for sporting and leisure facilities in
Plymouth. The redevelopment will provide an ice arena, multiplex cinema, quality hotel, a new grandstand for
Plymouth Argyle Football Club, plus cafés, restaurants and shops. The Ice rink at the Home Park redevelopment will
replace the rink at the Plymouth Pavilions; therefore until completed, demolition cannot start on areas of the Plymouth
Pavilions.

Plymouth District Heating Revision 01
Millbay Heat Network Feasibility Study 5 November 2014
Copyright © 1976 - 2014 BuroHappold Engineering. All Rights Reserved. Page 19
3.2 Network Design
Due to the status of the Pavilions development the study has separated the two areas into separate network clusters.
These cluster are the Millbay Cluster and the Pavilions Cluster, outlined in Figure 3—3. The logic of the separation is
that if the Millbay Marina network cluster is viable as a standalone network; further extension to the Pavilions Cluster
will further benefit the overall scheme.
Figure 3—3 proposed heat network clusters

Plymouth District Heating Revision 01
Millbay Heat Network Feasibility Study 5 November 2014
Copyright © 1976 - 2014 BuroHappold Engineering. All Rights Reserved. Page 20
Phasing of a heat network will be required as the masterplan is built out. The indicative network and the phasing of it,
have been produced in line with the current masterplan, as outlined in Figure 3—4. Three network phases have been
segregated within the Millbay cluster, Phases A-C, and the Pavilions Cluster is covered by only Network Phase D.
Figure 3—4 Proposed network phasing
Network phase D has been segregated from the Millbay redevelopment due to the current status of the ongoing
Pavilions Redevelopment. The phase network and cluster only considers the full build out of the redevelopment and
the existing arena; excluding the current ice rink and surround facilities that will be removed and replaced as part of
the redevelopment.

Plymouth District Heating Revision 01
Millbay Heat Network Feasibility Study 5 November 2014
Copyright © 1976 - 2014 BuroHappold Engineering. All Rights Reserved. Page 21
3.3 Approach
To assess the feasibility of a DHN in the Millbay area, predicted energy and peak usage figures were apportioned to
each plot. The load schedule for a potential network was collated from various sources and the approach taken is
visually represented in Figure 3—5. Plots were split into three different scenarios; existing plots which were already on
the site prior to the redevelopment, new build developments which are either not build yet or are completed/under
construction.
Table 3—1 Building type and Colour
Building Type Colour
Existing plot Orange
New Build proposed plot Blue
New Build plot completed or under construction Yellow
Figure 3—5 Load schedule creation approach
Energy and peak benchmarking was used to collate a load schedule. Existing plots were investigated either by direct
contact with developers, building managers or owners to gain specific data. If this could not be gathered building
footprints were estimated and benchmarks applied.
Planning applications were used to estimate new build developments energy usage. The outline masterplan
application was used to gather gross building footprints and usage types, from these benchmarks were applied. For
plots that have been completed or are currently under construction, reserved matters applications provided energy
modelling results.

Plymouth District Heating Revision 01
Millbay Heat Network Feasibility Study 5 November 2014
Copyright © 1976 - 2014 BuroHappold Engineering. All Rights Reserved. Page 22
3.4 Load schedule
The information gathered, through the approach outlined in section 3.3, was used to build up a more detailed picture
of the site and surrounding areas. Connection likelihood was associated to each plot and from that the final load
schedule was created.
Figure 3—6 Network connection likelihood
Several plots were ruled out from connection and the reasons are outlined in Table 3—2.
Table 3—2 Plot reasons for inability to connect to a network
Map Ref
A1 Dwellings have individual boilers – no centralised plant for connection
B Insufficient Information on usage and build out
D3 Dwellings have individual boilers – no centralised plant for connection
F1 Removed from Masterplan
F2 Removed from Masterplan
I Ministry of Defence Owned site – no interest in connection
3 Dwellings have individual electric heating and hot water – no centralised plant for connection
6 Dwellings have individual boilers – no centralised plant for connection

Plymouth District Heating Revision 01
Millbay Heat Network Feasibility Study 5 November 2014
Copyright © 1976 - 2014 BuroHappold Engineering. All Rights Reserved. Page 23
Discussion has been had with several stakeholders in the Millbay and Pavilions Clusters, including developers, building
managers and building owners. From this a connection register and subsequent load schedule was been produced.
Table 3—3 outlines the connection potential, construction status and associated load. Green indicates that the plot is
assumed to connect, the Orange is maybe or currently unknown, and Red is assuming d that connection is not
possible.
Table 3—3 Load Schedule
Map
Ref. Name/Plot Type Cluster Space Heating type Hot Water system
1
Duke of Cornwall
Hotel Existing City Centre Unknown - awaiting response
Unknown - awaiting
response
2
New Continental
Hotel Existing City Centre Unknown - awaiting response
Unknown - awaiting
response
3
Wesley Court - The
Crescent Existing City Centre Electric Electric
4 Ballard House Existing Millbay Gas –fired centralised boilers
Calorifier supplied by
boilers
5 Travelodge Existing City Centre Electric
Gas fired communal
system
6
Custom House Lane
blocks 1/2 Existing Millbay Individual gas boilers Individual gas boilers
7
Millbay Marina
Village Proposed Millbay Gas-fired communal heating
Gas fired communal
system
8 Crescent Court Proposed City Centre Gas-fired communal heating
Gas fired communal
system
G Cargo_2 Existing Millbay Gas-fired communal heating
Gas fired communal
system
D1 Phoenix Quay Existing Millbay Gas-fired communal heating
Gas fired communal
system
D2 Millbay Road Proposed Millbay Removed from Masterplan
D3 Cargo, Hobart Street Existing Millbay Individual gas boilers Individual gas boilers
D4
Plymouth School of
Creative Arts
Under
Construction Millbay Gas-fired communal heating
Gas fired communal
system
A1 East Quay
Under
Construction Millbay Individual gas boilers Individual gas boilers
A2 East Quay Proposed Millbay Assume policy can influence connectivity
A3 East Quay Proposed Millbay
B West Quay Proposed Millbay Not connecting Not connecting
C1 Core Harbour North Proposed Millbay
Assume policy can influence connectivity
C2 Core Harbour North Proposed Millbay
C3 Core Harbour South Proposed Millbay
C4 Core Harbour South Proposed Millbay
H Clyde Quay Proposed Millbay
E1 Pavilions Proposed City Centre
E2 Pavilions Proposed City Centre
E2a Pavilions Existing City Centre Unknown - awaiting response
Unknown - awaiting
response
E3/E4 Pavilions Proposed City Centre
F1/F2 Bath St/Martin St Proposed Removed from Masterplan
I Trinity Pier Proposed Removed from Masterplan
K Inner Basin Proposed Removed from Masterplan

Plymouth District Heating Revision 01
Millbay Heat Network Feasibility Study 5 November 2014
Copyright © 1976 - 2014 BuroHappold Engineering. All Rights Reserved. Page 24
Map reference 1, 2, E1, E2, E2a and E3/E4 are currently a maybe as finalised information has not be obtained regarding
current plant, connection availability and heating/hot water systems; most notably the Pavilion redevelopment. Due to
the status of the redevelopment and lack of finalised information, the possibility of connection has not been finalised.
Further stakeholder engagement is required with regards to the plots named in Table 3—4 to finalise potential loads
and to clearly assess the viability of a network cluster in this area.
Table 3—4 Plot reasons for unknown connection to a network
Map Ref
1 Duke of Cornwall Hotel No response from attempted contact
2 New Continental Hotel No response from attempted contact
4 Ballard House No response from attempted contact
E1, E2, E3/E4 Pavilions - Proposed Development plans currently provide levels of uncertainty
E2a Pavilions - Existing Contact made but no plant or metering data has been provided

Plymouth District Heating Revision 01
Millbay Heat Network Feasibility Study 5 November 2014
Copyright © 1976 - 2014 BuroHappold Engineering. All Rights Reserved. Page 25
4 Millbay cluster
4.1 Introduction to cluster
Figure 4—1 Proposed Millbay heat network clusters
The Millbay cluster is based and focussed around the English Cities Fund (ECF) Masterplan as submitted for planning
and dated 06/06/14. Surrounding plots have also been investigated, notably plots 6 and 7. These consist of the
existing residential plot on Custom House lane and the proposed new development, Millbay Marina Village.
Plots that are considered not viable for connection have been removed from the cluster. Future conversion of plots
with individual boilers for connection to the heat network has not been considered in this study. The viability of
conversion could include in the future and become financially viable.
The network has been divided into 3 clusters in accordance with the masterplan for design purposes but for technical
and commercial modelling the marina scheme will be considered at full connection size.
This modelling approach has been taken as a result of inadequate resolution of developer completion dates and the
understanding that the southern Linden homes development expected to break ground in the near future which
stretches the network to the furthest extents.

Plymouth District Heating Revision 01
Millbay Heat Network Feasibility Study 5 November 2014
Copyright © 1976 - 2014 BuroHappold Engineering. All Rights Reserved. Page 26
4.1.1 Table of connections
Map
Ref. Name/Plot
New
Build Space Heating type Hot Water system
4 Ballard House No Gas –fired centralised boilers Calorifier supplied by boilers
6
Custom House Lane
blocks 1/2 No
Individual gas boilers Individual gas boilers
7 Millbay Marina Village Yes Gas-fired communal heating Gas fired communal system
G Cargo_2 Yes Gas-fired communal heating Gas fired communal system
D1 Phoenix Quay Yes Gas-fired communal heating Gas fired communal system
D2 Millbay Road Yes Removed from Masterplan
D3 Cargo, Hobart Street Yes Individual gas boilers Individual gas boilers
D4
Plymouth School of
Creative Arts Yes
Gas-fired communal heating Gas fired communal system
A1 East Quay Yes Individual gas boilers Individual gas boilers
A2 East Quay Yes Assume policy can influence connectivity
A3 East Quay Yes
B West Quay Yes Not connecting Not connecting
C1 Core Harbour North Yes
Assume policy can influence connectivity
C2 Core Harbour North Yes
C3 Core Harbour South Yes
C4 Core Harbour South Yes
H Clyde Quay Yes
F1/F2 Bath St/Martin St Yes Removed from Masterplan
I Trinity Pier No Removed from Masterplan
K Inner Basin Yes Removed from Masterplan
Key
Connectable
Unknown
Not connecting

Plymouth District Heating Revision 01
Millbay Heat Network Feasibility Study 5 November 2014
Copyright © 1976 - 2014 BuroHappold Engineering. All Rights Reserved. Page 27
4.2 Load schedule
Table 4—1 Load schedule for Millbay network cluster
Baseline energy demands (kWh/yr.)
Map
Ref. Name/Plot Typology Type
M/plan
Phasing
Plot
Area
(m2)
Annual
Demand
Space
Heating
Hot
Water
Peak Load
(kW)
4 Ballard House* Office Existing - 9,450 1,134,000 907,200 226,800 468
7 Millbay Marina
Village Apartments Proposed - 20,200 642,345 295,962 346,383 579
7 Millbay Marina
Village Leisure Proposed - 305 20,836 16,669 4,167 3.9
G Cargo_2 Apartments Existing P2 4,190 231,116 173,337 57,779 160
G Cargo_2 Commercial Existing P2 345 41,400 33,120 8,280 -
D1 Phoenix Quay Apartments Existing P1 6,519 299,874 224,906 74,969 15
D1 Phoenix Quay Townhouses Existing P1 3,736 172,314 129,235 43,078 258
D1 Phoenix Quay Commercial Existing P1 1,244 149,280 119,424 29,856 165
D4 Plymouth School
of Creative Arts Education
Under
Construction P3a 8,825 328,904 89,258 239,645 60
A2 East Quay Apartments Proposed P3 11,830 544,180 408,135 136,045 470
A3 East Quay Apartments Proposed P3 5,390 247,940 185,955 61,985 454
C1 Core Harbour
North Apartments Proposed P5 2,810 129,260 96,945 32,315 206
C1 Core Harbour
North Leisure Proposed P5 340 125,800 100,640 25,160 107
C1 Core Harbour
North Hotel Proposed P5 4,225 1,014,000 811,200 202,800 8
C2 Core Harbour
North Apartments Proposed P5 8,655 398,130 318,504 79,626 189
C2 Core Harbour
North Leisure Proposed P5 1,735 641,950 513,560 128,390 332
C3 Core Harbour
South Business Proposed P6 12,020 1,442,400 1,153,920 288,480 44
C4 Core Harbour
South Apartments Proposed P6 6,610 304,060 243,248 60,812 538
C4 Core Harbour
South Leisure Proposed P6 780 288,600 216,450 72,150 253
H Clyde Quay Apartments Proposed P4 12,690 583,740 466,992 116,748 19
H Clyde Quay Leisure Proposed P4 4,620 1,709,400 1,367,520 341,880 487
* Note – Ballard House information received after draft issue of report not included in analysis. Annual gas
consumption 2013 of 980MWh with 2 x 700kW installed boilers serving space heating and domestic hot
water generation by a single calorifier.

Plymouth District Heating Revision 01
Millbay Heat Network Feasibility Study 5 November 2014
Copyright © 1976 - 2014 BuroHappold Engineering. All Rights Reserved. Page 28
Figure 4—2 Millbay cluster load visualisation

Plymouth District Heating Revision 01
Millbay Heat Network Feasibility Study 5 November 2014
Copyright © 1976 - 2014 BuroHappold Engineering. All Rights Reserved. Page 29
4.2.1 Cluster Network Phasing
Figure 4—3 Indicative Network route and phasing
The indicative network has been split into three phases to mirror the phased growth of the masterplan build out.
Network Phases A, B and C incorporate Masterplan Phases 1 to 3a, 3 to 4 and 5 to 6 respectively.
The network has been design to provide the shortest route for all plot connections whilst avoiding the constraints as
outlined in 4.3 whilst still connecting major loads. Main roads have been avoided and road crossing minimised where
possible, minimising disturbance to local transport red routes.

Plymouth District Heating Revision 01
Millbay Heat Network Feasibility Study 5 November 2014
Copyright © 1976 - 2014 BuroHappold Engineering. All Rights Reserved. Page 30
Figure 4—4 Total heat demand by network phase
Figure 4—5 Cumulative total heat demand
Figure 4—6 Cumulative peak heat load

Plymouth District Heating Revision 01
Millbay Heat Network Feasibility Study 5 November 2014
Copyright © 1976 - 2014 BuroHappold Engineering. All Rights Reserved. Page 31
Figure 4—7 Annual Heat demand by building typology
Figure 4—8 Annual heat demand by plot
The available heat load has a mixed use characteristic which is well suited to DE schemes as this provides a balance
between daytime and night time loads.
The peak load of the scheme is approx. 4.5MW which defines the capacity of the energy centre.

Plymouth District Heating Revision 01
Millbay Heat Network Feasibility Study 5 November 2014
Copyright © 1976 - 2014 BuroHappold Engineering. All Rights Reserved. Page 32
4.3 Constraints
A heat network within the Millbay cluster will be heavily constrained within a few key areas. These areas are south of
the new Boulevard and Brunel Way and along the marina front West of West Hoe Road. Crossing existing and
potential utilises will provide the most significant constraint to network routing. Avoiding congested areas is the
advised method for mitigating clashes.
Southern end of Boulevard
The waterfront routes are highly congested with existing utilities routed from the boulevard. For the heat network to
reach Ballard House and Plots A2, to avoid crossing the proposed utilities corridor at the adjacent to plot C4, it is
suggested to run along West Hoe Road to avoid a clash.
Figure 4—9 Southern end of the Boulevard constraints
• Creates a clear barrier to the optimum routing for connection of the phases.
• Requires a routing of the network outside of the masterplan area along the eastern side of the site
• Utilities barriers include:
– Sewers
– HV lines
– Main trunk lines
– Existing attenuation tanks
Not possible
to cross here
Suggested DH
Network routing

Plymouth District Heating Revision 01
Millbay Heat Network Feasibility Study 5 November 2014
Copyright © 1976 - 2014 BuroHappold Engineering. All Rights Reserved. Page 33
Marina waterfront
Congestion of proposed utilities will provide difficulty for connection to plots along the Marina waterfront west of
West Hoe Road. Routing is suggested along West Hoe Road for connection to Plots A2, A3 and the Millbay Marina
Village on Custom House Road.
• Congested utility routing along marina side access road.
• DH route to be installed along West Hoe road and access plots from eastern side or installed within plot
boundaries.
• Level change between West Hoe road and plots could enable a services
Figure 4—10 Marina waterfront constraints
Not possible to
install here
Suggested DH
Network routing
Plymouth District Heating Revision 01
Millbay Heat Network Feasibility Study 5 November 2014
Copyright © 1976 - 2014 BuroHappold Engineering. All Rights Reserved. Page 34
4.4 Network Details
4.4.1 Energy Centre
Due to the high level nature of this study a finalised Energy Centre location has not been proposed. On initial
investigation of the scheme, a single energy centre is considered for the Millbay cluster. The single energy centre
should be:
Supplied by mains gas
easily accessible for both installation and maintenance
located where a flue can have a high discharge point
located in a non-critical acoustic area
implemented early within the development build out
located in a centralised location
if possible located to allow access to seawater for use in heat pumps
The Energy Centre could be grown in size and capacity with the connection of increasing loads. This will reduce draw
down, matching capital expenditure to phasing which will in turn spread capital expenditure over the duration of build
out.
Plots A2 or A3 within Masterplan Phase 3 would provide a viable option for a single energy as construction has not
started but further analysis is required before this can be finalised. Alternatively multiple energy centres can be
considered to allow for phased growth, connected by controls, enabling them to be controlled and operated in
combination building in resilience and reducing reliance on a single set of installed plant.
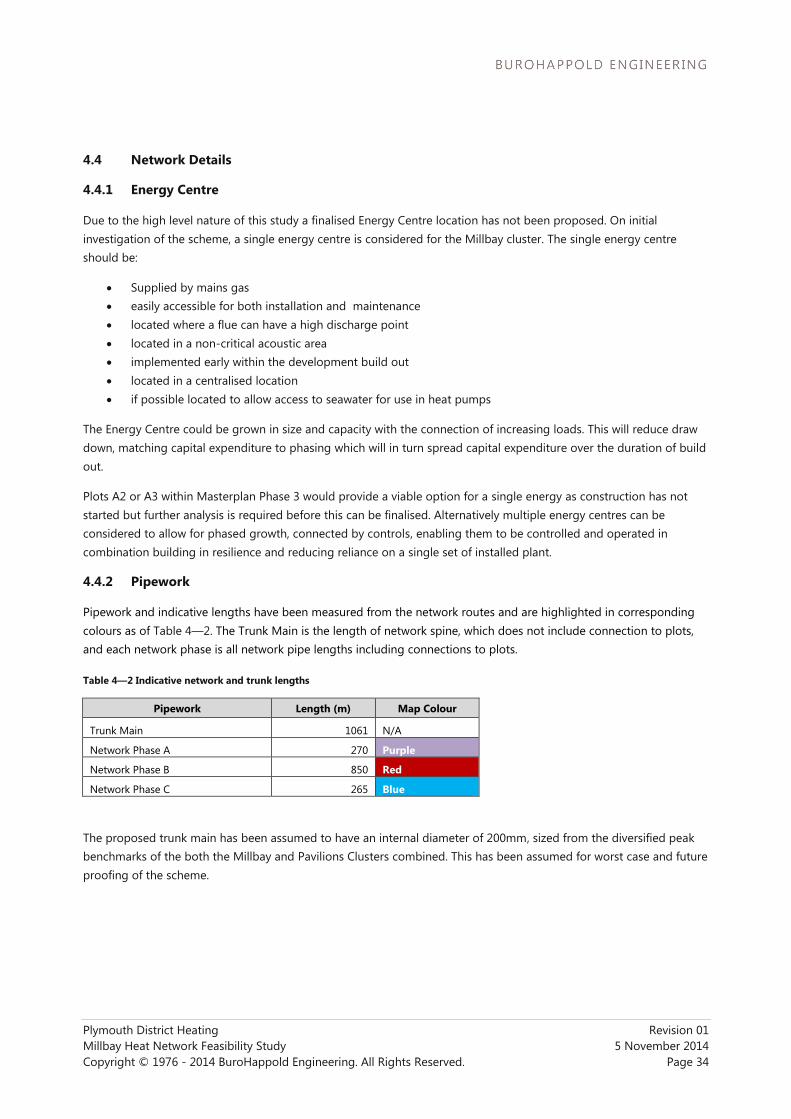
4.4.2 Pipework
Pipework and indicative lengths have been measured from the network routes and are highlighted in corresponding
colours as of Table 4—2. The Trunk Main is the length of network spine, which does not include connection to plots,
and each network phase is all network pipe lengths including connections to plots.
Table 4—2 Indicative network and trunk lengths
Pipework Length (m) Map Colour
Trunk Main 1061 N/A
Network Phase A 270 Purple
Network Phase B 850 Red
Network Phase C 265 Blue
The proposed trunk main has been assumed to have an internal diameter of 200mm, sized from the diversified peak
benchmarks of the both the Millbay and Pavilions Clusters combined. This has been assumed for worst case and future
proofing of the scheme.

Plymouth District Heating Revision 01
Millbay Heat Network Feasibility Study 5 November 2014
Copyright © 1976 - 2014 BuroHappold Engineering. All Rights Reserved. Page 35
4.4.3 Plant selection
The energy centre is a small power plant, generating heat for distribution and generating electricity. Table 4—3 lists
the main plant components required.
Table 4—3 Energy centre plant components
System element Item Description
Heat generation CHP Spark ignition reciprocating as engine
+ ancillary equipment including acoustic cladding, oil tanks, control
panels and ventilation.
Boilers Gas boilers – preferably condensing if possible
Flues Twin wall steel flues with exhaust higher than surrounding buildings
Thermal storage Insulated tank
Distribution Pumps Main DH pumps
Jockey pump (for low flow conditions)
Network Pipework routings to connect heat sources to distribution points.
Ancillary equipment Ventilation system - Louvre openings for combustion air – boilers and CHP
- Exhaust system for CHP combustion air and engine cooling
Utilities connections - Gas connection - gas governor
- Electrical substation - CHP connection and LV connection
- Water connection – make up water
- Foul water connection
Water treatment:
- Dirt separation
- Pressurisation system
- De-aeration
- Dosing
Resilience is a vital characteristic which must be provided by the energy centre to provide a continuous level of service
even with failures and maintenance time.
To provide this resilience critical plant including peak boilers and pumps are selected on an N+1 basis.
Table 4—4 shows the boiler selection for costing.
Table 4—4 Boiler selection and strategy
Peak Heat load (MW) Boiler selection (MW) Notes
4.5 2 x 2.25MW + 1 x 2.25MW spare N+1 selection strategy. Boilers would be
rotated to ensure even use.
The CHP engines are sized using modelling of the loading profiles and analysed for annual run hours and contribution
to heat load. The economic analysis then compares and contrasts the results to identify the best fit for the scheme.
It is assumed for modelling that the network is installed to encompass phase A, B and C in one installation. If this
installation strategy is adopted a single energy centre could be used to serve the scheme. In practice it is likely the
investment into networks would be staged to match revenues.

Plymouth District Heating Revision 01
Millbay Heat Network Feasibility Study 5 November 2014
Copyright © 1976 - 2014 BuroHappold Engineering. All Rights Reserved. Page 36
For future proofing for integration of sea-water source heat pumps a location with direct access to the sea is required.
The sea access discharge and supply area will need to be into an unconstrained basin to allow for dissipation of heat
and replacement of heat when heating and cooling.
Any proposed site will need to be served by a gas and electrical network with adequate capacity.
There is a conflict of interests as seafront access is higher value land for sale not desired for sale not technical area.
Potential energy centre locations are shown in Figure 4—11.
Figure 4—11 Potential Energy Centre location with direct sea access (Trinity pier shown)
A potential location could be in plot A3 as this is close to Trinity pier which is understood to being retained with an
industrial function.
A location adjacent to Ballard House could be considered as the building is existing and under council ownership.

Plymouth District Heating Revision 01
Millbay Heat Network Feasibility Study 5 November 2014
Copyright © 1976 - 2014 BuroHappold Engineering. All Rights Reserved. Page 37
4.4.4 Connections
A single connection to each plot from the network is assumed. This will provide the simplest solution and for the
network and future planning. All breakdown and sub metering will occur within plots, providing most design flexibility
within each plot. A single Heat Interface Unit (HIU) or heat exchangers should be provided in a central plant room, the
heat will be metered at this point per plot and distribution will occur to each building/dwelling (no heat exchangers or
metering has been included in this modelling).
Charging will occur on a plot by plot basis from the main network provider and sub metering will provide cost per user
after this point, which will be managed by the building management.
Good practice for plot connection can be found in the Draft CHPA Heat network Code of Practice document.
Connecting to the established low carbon DE network developments will avoid costs for plant elements, these costs
are assumed to be paid to the DE network operator to cover network investment. Avoided costs which can be
reclaimed to contribute towards the network include boilers, CHP engines for carbon reduction commitment and
reduced plant room size gained by compact nature of heat exchangers. Table 3—1 shows the calculated contribution
from proposed developments which are not yet built to the Marina scheme.
The timing of connections and establishment of the network will play a key part in the amount of avoided costs that
can be recovered. If the network is not in place at the completion of developments a planning measure could be
implemented to offer a window for the establishment of the network e.g. 3-5 years without carbon commitments. The
developer could be asked for a contribution to network costs which could be refunded in the case of the network not
being installed. After which time the network is either installed or other mitigating measures are required for
installation by the developers.
Table 4—5 Avoided costs for the connections to the heat network scheme
Avoided cost Cost Avoided technology Total saved Source
Boilers £40/kW 3345 kW £ 150,500 Spons 2012
CHP £919/kWth 890 kWth £ 818,000 Spons 2012
Plant room £3,300/m2 105 m
2 £ 346,500 BH project cost data
Total potential contribution for Millbay scheme £ 1,315,100
For consideration in any further studies is the option of retaining existing communal boilers in existing plots to reduce
peak capacity of the energy centre and therefore capital outlay.
The plots would receive low carbon heat from the network to cover baseload heat with local retained boilers serving
the peak load.
4.5 Techno-economic modelling
A technical and financial viability study has been conducted to assess the potential of the scheme as a standalone
cluster. The cluster has been assessed with full build out and with all plots that have not already been ruled out. Full
build out and connection has been assumed to assess the scheme, providing a full connection register and an
assessment of the full scheme.

Plymouth District Heating Revision 01
Millbay Heat Network Feasibility Study 5 November 2014
Copyright © 1976 - 2014 BuroHappold Engineering. All Rights Reserved. Page 38
4.5.1 Technical modelling
An iterative technical approach has been taken to assess the financial viability of a potential scheme. Energy Pro, an
energy centre simulation package, assesses annual heat profiles on an hourly basis. The iterations of CHP, Boiler, and
Thermal store are outlined in Table 4—6. Several options were modelled, varying CHP capacities and thermal store, to
assess the impact on heat fraction and Net Present Value.
A baseline model for carbon comparison is generated by comparing the CO2 output of a traditional gas solution to the
emissions generated through the CHP and boiler combination. The carbon factors from Part L 2013 were used for
calculation.
Table 4—6 Outline of plant options iterations
Options Model CHP Thermal Capacity
(MW)
CHP Electrical
Capacity (MW) Boiler Capacity (MW)
Thermal Store
Capacity
Option 1 0.527 0.505 4.5 50 m3
Option 2 0.872 0.770 4.5 50 m3
Option 3 0.872 0.770 4.5 100 m3
Option 4 1.428 1.150 4.5 100 m3
Table 4—7 Outline of results by options model
Options Model CHP Run
Hours
CHP Heat
Output
(kWh)
% of Heat
met by CHP
Electricity Produced
(kWh)
CO2 saving vs. gas
baseline
Option 1 7,736 4,041 35.2 3,872 33%
Option 2 6,766 5,456 47.5 4,818 37%
Option 3 6,726 5,768 49.8 5,057 39%
Option 4 5,787 7,474 65.0 6,019 40%
Table 4—7 shows the operational characteristics of each plant scenario run. All scenarios achieve a high number of
run hours, adequate to operate the CHP unit economically. Scenario 4 returns the highest % of heat met by the CHP
and highest carbon savings. However higher capital costs will affect the return of the scenario when analysed in the
commercial model.

Plymouth District Heating Revision 01
Millbay Heat Network Feasibility Study 5 November 2014
Copyright © 1976 - 2014 BuroHappold Engineering. All Rights Reserved. Page 39
4.5.2 Commercial modelling
The technical scenarios are analysed with an economic model to assess the economic viability of the technically
justified schemes. Inputs and assumptions into the commercial model can be found in Appendix B.
4.5.2.1 Cost of heat
To understand the costs associated with retailing heat a simple example of a typical flat can be used. Between the
generator and consumer there are a number of components which make up the final retailed heat price:
Costs the consumer pays:
Consumer metering and billing
Standing charge £/kW connected
Unit heat cost of heat consumed p/kWh
Costs the heat supplier sees
Cost of heat generation including network losses p/kWh – fuel costs
O&M of network and plant
Original CAPEX
Components include a standing charge for metering and billing and then the unit cost for heat. This component must
cover the costs incurred by the generator for fuel purchase, O&M, distribution losses and other associated costs.
The heat price as calculated by the model takes into account the following costs:
Standing charge modelled at £14/kW connected
Cost of heat generation including network losses p/kWh
O&M of network and plant
Original CAPEX
Avoided plant costs
It assumes that billing and metering costs ca. £120-140/year per residential unit are passed through costs to whichever
entity is responsible for metering and billing, and these would be added to the final billing
The maximum sales price at a block level is a comparison to what the consumer would pay on a standard residential
gas tariff. At block level distribution losses from within the plant room to the final users must also be accounted for.
Cost Source
Residential gas price 5.1 p/kWh DECC Updated Energy & Emissions Projections - September
2013 – 2015 residential tariff
Boiler efficiency 85% Industry value
Cost of heat 6.0 p/kWh Calculated
Building distribution losses 15% BH project experience
Cost of heat 5.2 p/kWh Calculated
Unit cost of standing charge 0.6 p/kWh Total standing charge (£) / Total heat sales incl. losses
Minimum cost of heat for parity 5.8 p/kWh Calculated value
Note. The 5.1 p/kWh is the cost excluding billing and metering, standing charges and plant replacement funding.

Plymouth District Heating Revision 01
Millbay Heat Network Feasibility Study 5 November 2014
Copyright © 1976 - 2014 BuroHappold Engineering. All Rights Reserved. Page 40
4.5.2.2 Commercial model study
Two schemes are tested for the Millbay marina network:
a. Fully market led – targets a unit heat price (inclusions/exclusions as described in 4.5.2.1) to return an IRR for
network and energy centre excl. building connection plant of 6% and 10%. Avoided plant included but not
further funding streams for CAPEX offsetting.
b. Heat price parity led – calculates required S106 or grant funding to return an IRR of 6% and 10% with a heat
price of 5.8p/kWh (inclusions/exclusions as described in 4.5.2.1). Avoided plant cost included.
Table 4—8 Market Led scheme results
Market led scheme, sales price of heat p/kWh
- 14£/kW standing charge
- without metering charges
IRR Option 1 Option 2 Option 3 Option 4
6% 6.3 6.1 6.2 6.3
10% 7.1 7.1 7.1 7.3
Table 4—9 Heat price parity led results
Heat price parity S106/Grant funding required above £1.3m for avoided plant costs
- 14£/kW standing charge
- without metering charges
Heat parity price 5.8 p/kWh
IRR Option 1 Option 2 Option 3 Option 4
6% £ 635,800 £ 456,900 £ 593,400 £ 658,600
10% £ 1,208,800 £ 1,176,800 £ 1,306,300 £ 1,428,900
The commercial modelling result is Option 2 as the best performing technical plant configuration, generating the
lowest unit heat price in the market led scheme and lowest capital funding requirement in the price parity scheme.

Plymouth District Heating Revision 01
Millbay Heat Network Feasibility Study 5 November 2014
Copyright © 1976 - 2014 BuroHappold Engineering. All Rights Reserved. Page 41
4.6 Results
The detailed commercial results for technical option 2 (see Table 4—10) are displayed in Table 4—11. The results are
discussed below.
Table 4—10 Technical summary of recommended energy centre plant.
Capex CHP Thermal Capacity
(MW)
CHP Electrical
Capacity (MW) Boiler Capacity (MW)
Thermal Store
Capacity
£4,116,000 0.527 0.505 4.5 50 m3
Table 4—11 Detailed commercial results for option 2
Scheme IRR Unit heat
cost
(p/kWh)
Capital
Funding
Avoided
costs
S106/ Grant
funding
Yr. 1
Annual
Revenue
NPV @
3.5%
discount
rate
Line
density
MWh/m
MW CHP
capacity/
MWh heat
demand
A. Market
led
6% 6.1 £4,116,000 £1,300,000 £ - £158,600 £770,200 10.8 0.9
10% 7.1 £4,116,000 £1,300,000 £ - £263,100 £2,436,900 10.8 0.9
Price
parity
6% 5.8 £4,116,000 £1,300,000 £456,860 £127,200 £711,300 10.8 0.9
10% 5.8 £4,116,000 £1,300,000 £ 1,176,799 £127,200 £1,407,200 10.8 0.9
Figure 4—12 Scheme NPV vs. years performance
Market led scheme
For a market led scheme to be adopted a strong return on investment is required. To achieve a 10% IRR unit heat sales
cost must be increased to 7.1p/kWh. This is 22% higher than the comparable gas tariff and therefore not considered to
be competitive. If a lower IRR of 6% could be considered acceptable then a unit cost of only 5% above the
comparative gas tariff may be charged which may be accepted by the consumer for the relative reduction in carbon
emissions of ca. 37% when compared with a traditional gas fired system.

Plymouth District Heating Revision 01
Millbay Heat Network Feasibility Study 5 November 2014
Copyright © 1976 - 2014 BuroHappold Engineering. All Rights Reserved. Page 42
Price parity scheme
By competing on a price parity level the scheme is most likely to gain acceptance from users and consumers existing
and future short term connections. The price parity model is based on an amount of funding – likely either Section 106
or a grant funding source to be found to achieve an IRR of either 6% or 10% for the fixed unit heat cost of 5.8p/kWh.
To achieve a 6% IRR the contribution required is ca. £500,000 on top of the £1,300,000 of avoided plant cost to be
reclaimed from developers.
To increase the IRR to 10% the contribution required rises threefold to ca £1,200,000 on top of the avoided plant cost.
Is assumed that all electricity produced will be sold to the grid with an electricity grid spill price of 6.0p/kWh. This has
been assumed as a worst case scenario and it is recommended that a private wire scheme is found and investigated to
increase the unit sale price of this electricity. Connection of a private wire scheme will improve the commercial
performance of the scheme which could be used to reduce unit heat cost or increase return.
Plymouth District Heating Revision 01
Millbay Heat Network Feasibility Study 5 November 2014
Copyright © 1976 - 2014 BuroHappold Engineering. All Rights Reserved. Page 43
4.7 Opportunities
With the implementation of a low carbon heat network within the Millbay Marina masterplan will provide several
technological and financial opportunities.
4.7.1 Alternative heat sources
Current modelling assumes the use of gas fired CHP and boilers only. A Millbay Marina heat network provides the
opportunity for varying technologies to plug into the system, where appropriate, and provide heat from varying
sources. As the network has this capability, it may be able to provide each individual plots with low carbon and
renewable energy with limited plant area as well as potentially providing the 15% renewable contribution required.
4.7.1.1 Biomass
Biomass provides a potential opportunity for the network, reducing the carbon factors of heat further than gas fired
CHP. Solid Biomass and can come in many forms, wood chip, solid wood logs, waste wood and wood products in
pellet form. The calorific value of Solid Biomass is heavily reliant on the moisture content of the fuel; wet fuels produce
less energy per kg and create a higher proportion of waste products. A solid biomass with low moisture content is
required to avoid reprocessing and drying.
Millbay has good access to an abundance of biomass sources, due to its accessibility by road network and also would
be eligible and benefit from the Renewable Heat Incentive.
Currently Biomass CHP systems are not fully established in the UK market but biomass heat only boilers could replace
a proportion of the gas fired boilers, reducing the gas fired boiler heat fraction. Biomass provides a low carbon
intensity compared to natural gas, varying from 0.016 – 0.039 kg CO2 per kWh1 compared to 0.216 kg CO2 per kWh for
natural gas.
4.7.1.2 Water source heat pumps
In the long term with the decarbonisation of heat, large scale water source heat pumps could provide a viable heat
source for the Millbay Marina. Heat pumps utilising sea water from the bay could provide a source of free heat. The
current efficiency of heat pumps is increased if low temperature networks, approx. 60ºC, can be use making the a
system much more viable. Further investigation of the potential connected buildings is required to define the system
performance constraints.
1 The Government’s Standard Assessment Procedure for Energy Rating of Dwellings; SAP 2012 version 9.92 (October 2013)

Plymouth District Heating Revision 01
Millbay Heat Network Feasibility Study 5 November 2014
Copyright © 1976 - 2014 BuroHappold Engineering. All Rights Reserved. Page 44
5 Pavilions Cluster
5.1 Introduction to cluster
Figure 5—1 Proposed Pavilions heat network cluster
The Pavilions Cluster is focussed around the existing and planned Plymouth Pavilions redevelopment, starting at from
the north section of the Boulevard, north of Millbay road and East of Bath Street.
Due to the current unknown situation of the Plymouth Pavilions redevelopment the cluster has been considered
separately for analysis. The current and potential Pavilions redevelopment provides a significant opportunity for an
anchor load and therefore a cluster has been created around it. Plot E2 is split into proposed and existing
developments. The redevelopment plans will only maintain the current Arena and therefore this is the only section of
the existing development considered in the cluster.
Further connection opportunities were investigated, highlighting plots 1, 2, 3, 5 and 8. Plots 1, 2 and 5 are hotels which
can provide a high and consistent load to the network. Crescent Court a student halls of residence development, plot
8 has been considered also as it is under construction and will have a central plant room with CHP.
Plot 3, Wesley Court; The Crescent, is not considered viable for connection and therefore has been removed from the
cluster. The dwellings in Wesley Court have individual electric heating and hot water, therefore has no existing
centralised plant for a heat network connection.
At this point insufficient information is available for to analyse the proposed or existing Pavilions development and
currently several existing plots have not replied to requests for information. It is proposed that the Pavilions Cluster is
the focus of further study when reliable information becomes available.

Plymouth District Heating Revision 01
Millbay Heat Network Feasibility Study 5 November 2014
Copyright © 1976 - 2014 BuroHappold Engineering. All Rights Reserved. Page 45
6 Conclusions
6.1 Millbay Cluster
The initial modelling of the Millbay cluster as a standalone network is technically feasible and commercial modelling
suggests that a workable scheme could be achieved. To achieve a competitive IRR whilst maintaining competition of
heat price additional funding is required. This considered it is likely that a council led scheme is more likely to succeed
rather than an external ESCO which will require higher rates of return.
To achieve a performing commercial operation modelling suggests that £0.5m funding on top of £1.3m from avoided
plant costs within the developments could yield a return of 6%. By increasing funding to £1.2m the IRR can be
increased to 10%.
This conclusion has been made with the assumption that local policy can influence and oblige connectivity to a
proposed network. Further analysis and a more detailed study is suggested to investigate the network further.
Figure 6—1 Millbay Cluster Indicative Heat Network
The indicative network routing as shown in Figure 6—1 avoids congested utilities making a complicated network
routing. The proposed Millbay cluster provides a high load density, 1,750MWh/ha.a which is deemed suitable for
district energy.
Current understanding of phasing (2006/2011 masterplan) does not enable an adjacent network build out and
therefore a decentralised network growth may be considered, with multiple energy centres.
The plant combination in Table 6—1 is the recommended energy centre capacity for the marina network at full
connection capacity and the potential performance.

Plymouth District Heating Revision 01
Millbay Heat Network Feasibility Study 5 November 2014
Copyright © 1976 - 2014 BuroHappold Engineering. All Rights Reserved. Page 46
Table 6—1 Option 2 techno-economic modelling results
Options Model CHP Thermal Capacity
(MW)
CHP Electrical
Capacity (MW) Boiler Capacity (MW) Thermal Store Capacity
Option 2 0.872 0.770 4.5 50 m3
Options Model CHP Run Hours CHP Heat Output
(kWh)
% of Heat met by
CHP
Electricity Produced
(kWh)
Option 2 6,766 5,456 47.5 4,818
6.2 Pavilions Cluster
At this point sufficient information is not available for to analyse the Proposed or existing Pavilions development and
currently several existing plots have not replied to requests for information. It is proposed that the Pavilions Cluster is
the focus of further study when reliable information becomes available.
6.3 Next steps
To progress this potential scheme a further study is recommended for the Millbay marina scheme as identified in this
study and the pavilions cluster.
A delivery strategy is required for this project. Understanding if there is appetite for a council led DE supply
vehicle who could operate this scheme, or how an external operator could be integrated into the project.
A detailed feasibility study to further develop the proposed system to a level that gives confidence for
costing and business case development.
o Investigate the impact the Pavilions cluster.
o Further investigation of Millbay marina connections
o Technical constraints and opportunities analysis,
o Energy centre location
o Development of a more detailed commercial model
o Delivery planning
o Funding options
o Scenario testing and sensitivity testing to a greater resolution

Plymouth District Heating Revision 01
Millbay Heat Network Feasibility Study 5 November 2014
Copyright © 1976 - 2014 BuroHappold Engineering. All Rights Reserved.
Appendix A Millbay Cluster Financial Modelling Inputs
SCENARIO
Op
tio
n 1
Op
tio
n 2
Op
tio
n 3
Op
tio
n 4
Thermal Storage volume m3 50 50 100 100
Heat Demand (including losses) MWh/yr. 11,494 11,495 11,494 11,494
Electricity demand MWh/yr. 3,872 4,818 5,057 6,019
Network distribution losses MWh/yr. 1,045 1,045 1,045 1,045
CHP Gas Input MWh/yr. 11,010 13,033 13,680 16,995
CHP Heat Output MWh/yr. 4,041 5,456 5,768 7,474
CHP Electrical Output - total MWh/yr. 3,872 4,818 5,057 6,019
CHP Electrical Output - landlord MWh/yr. 0 0 0 0
CHP Electrical Output - private wire MWh/yr. 0 0 0 0
CHP Electrical Output - exported to grid MWh/yr. 3,872 4,818 5,057 6,019
Electricity imported MWh/yr. 0 0 0 0
CHP Operating Hours Hours 7,736 6,766 6,726 5,787
Boiler gas input MWh/yr. 8,769 7,104 6,786 4,730
Boiler heat output MWh/yr. 7,454 6,039 5,768 4,020
Energy Centre parasitic load MWh/yr. 115 115 115 115
% Heat through CHP % 35% 48% 50% 65%
Carbon emissions t/yr. 1964 1841 1785 1741
Carbon savings vs. Baseline (2921 t/yr.) % 33% 37% 39% 40%
trunk network length m 1,061 1,061 1,061 1,061
MWh demand /m MWh/m 10.8 10.8 10.8 10.8
MW CHP capacity / MWh demand MW/MWh 0.5 0.9 0.9 1.3
trunk network DN diameter mm 200.0 200.0 200.0 200.0

Plymouth District Heating Revision 01
Millbay Heat Network Feasibility Study 5 November 2014
Copyright © 1976 - 2014 BuroHappold Engineering. All Rights Reserved.
Appendix B Modelling Assumptions
Operating assumptions Unit Reference
Gas boiler efficiency % 85% Based on Best Practice
DH heating network losses % 10% Previous BuroHappold Projects
Energy centre parasitic load (% of heat
production)
% 1%
CHP gross heat efficiency % 45% GLA DH manual
CHP gross electrical efficiency % 35% GLA DH manual
Price assumptions Reference
Gas import price yr. 1 override p/kWh 2.8 Assumption for bulk purchase
Residential gas price p/kWh 5.1 DECC residential heat retail price from DECC Updated Energy &
Emissions Projections - September 2013
Grid spill power sales override p/kWh 6.0 Assumed value from alternative CHP schemes
Plant replacement fund (% of energy
centre capex)
% 70.0% % of energy centre capex that will need replacing within below
period
Plant replacement fund (% of energy
centre capex)
yrs. 20 Replacement period for energy centre capex
Heating standing charge £/kW 14 Charged per peak kW connected
Funding assumptions
Model lifetime years 25
Start year year 2016
Discount rate % 3.5% HM Treasury Green Book


Justin Etherington & Jon Gregg
BuroHappold Limited
17 Newman Street
London
W1T 1PD
UK
T: +44 (0)207 927 9700
F: +44 (0)870 787 4145
Email: [email protected]