pmd study & measurement fixed analyzer method
TRANSCRIPT

PMD Study & Measurement – Fixed Analyzer
Method
Rastislav Motuz, Petr Munster, and Miloslav Filka
Abstract: The paper theoretically describes Polarization Mode
Dispersion (PMD) which is important parameter in high-speed
optical networks. Furthermore, compensation methods and
measurement principles are presented. Main attention is given to
Fixed Analyzer (FA) method that uses common research
laboratory equipment in setup. We performed practical
measurement of the PMD by using Optical Spectrum Analyzer
(OSA) Anritsu MS9740A, in-line polarizers and a polarization
controller. To verify the accuracy of measurements Reference
Measurement (RM) using a modular platform EXFO FTB-200 in
combination with CD/PMD module EXFO FTB-5700 was
performed. Moreover, PMD etalons with defined values of delay
was used for measurement. All results were evaluated in
comparison with defined limit values.
Index terms: PMD measurement, Fixed Analyzer method, fiber,
polarization, dispersion, DGD
I. INTRODUCTION
Dynamic evolution of fiber optical communication brings
high transmission rates and wide bandwidth for new services.
But with increasing transmission rate is necessary to deal also
with issues as Chromatic Dispersion (CD) or PMD. The PMD
is optical phenomenon which affects optical transmissions
with transmission bitrates up 2.5 Gb/s.
PMD causes optical signal degradation especially nowadays,
when bitrates in a core or metro networks commonly exceed
40 Gb/s. It is recommended to measure this parameter not only
after fiber fabrication but also after its installation in order to
keep demanded quality of service. There are several methods
of PMD measurement. Each of them offers advantages or
disadvantages and the selection depends on specific conditions
and requirements [1].
There are no any recent publications focusing directly on the
FA method using the OSA and with practical measurement or
comparison the FA method with other measurement method.
In publication [2] the authors reported an improvement of the
FA measurement technique. With suggested modification the
measurement uncertainty was reduced of more than 40%.
Authors in [3] presented an interesting relation between the
PMD and the Raman gain. It was found that the increase of
Manuscript received September 22, 2015; revised December 18, 2015.
Research described in this paper was financed by the National Sustainability Program under grant LO1401, and SIX CZ.1.05/2.1.00/03.0072.
For the research, infrastructure of the SIX Center was used.
Authors are with the Department of Telecommunications, Brno University of Technology, Brno, Czech Republic (E-mails:[email protected],
[email protected], [email protected]).
PMD value reduces the value of a gain, which negatively
affects the signal integrity while being transmitted. For
practical verification the FA method was.
This paper is organized as follows: Section I contains
introduction and State of Art. Necessary background to the
PMD including important parameters and a description of
polarization phenomenon is provided in Section II. Section III
deals with possibilities of PMD compensation. Following
section, Section IV, discusses PMD measurement techniques
with focusing on the FA method. In addition, theoretical
advantages and disadvantages are stated. Measurement
methodology of the FA and RM is described in section V.
Section VI contains experimental results and Sections VII
concludes the paper.
II. POLARIZATION MODE DISPERSION
In ideal optical fiber both orthogonal polarization planes
(two polarization modes) of light beam propagate with same
speed, and hence no dispersion occurs. Unfortunately, a real
optical fiber has non ideal circular shape which causes
different spreading speeds of both planes. One plane of
polarization represents a fast-axis, the other plane is a slow-
axis. The obvious fact is that the optical signal spreads in
different speeds of the both planes of polarization. This
situation is shown in Fig. 1.
Fig. 1. Optical pulse spreading through an ideal and a real fiber [4].
The main cause of this effect is a birefringence which means
that each plane of polarization has a different refractive index
[5].
The ∆τ indicates the time delay called DGD (Differential
Group Delay), which is expressed in ps. Spectral mean value
of DGD is called PMD. This phenomenon causes the OSNR
(Optical Signal to Noise Ratio) degradation and the increase of
JOURNAL OF COMMUNICATIONS SOFTWARE AND SYSTEMS, VOL. 11, NO. 4, DECEMBER 2015 199
1845-6421/12/8412 © 2015 CCIS
the BER (Bit Error Rate). The DGD value changes slowly in
comparison to its wavelength dependence [4].
The PMD value is unstable in time, because it is affected by
a number of other factors like non-circularities of the fiber
shape (core stress, cladding eccentricity, elliptical fiber
design), micro air bubbles or externally applied stress on the
fiber, micro and macro bending, twisting and variations of
temperature [6], [7].
Mathematical expression of the PMD for relatively short
lengths of optical fibers (up to 10 km) is given by the
following formula:
𝐷PMD (𝜆) =∆𝜏
𝐿, [
ps
km] (1)
where DPMD (λ) is the PMD coefficient, ∆τ is the DGD and L
is the fiber length. For standard telecommunication optical
fiber (G.652.D) is typical weak or none polarization mode
coupling, which usually means that fiber exhibit little or none
wavelength dependence of the DGD. Moreover, PMD grow
linearly with the fiber length.
Strong polarization mode coupling occurs in case the fiber
length is longer than 10 km. This usually exhibit standard
telecommunication fibers when DGD varies randomly with
wavelength. Furthermore, PMD rises with the square root of
the fiber length as is described below:
𝐷PMD (𝜆) =∆𝜏
√𝐿. [
ps
√km] (2)
Fig. 2 shows dependence of the PMD on the fiber length.
Fig. 2. PMD dependence on the fiber length [4].
Limiting value of the PMD (λ) for a conventional fiber
(G.652.D) according to ITU (International Telecommunication
Union) is 0.2 ps/√km [5], [8].
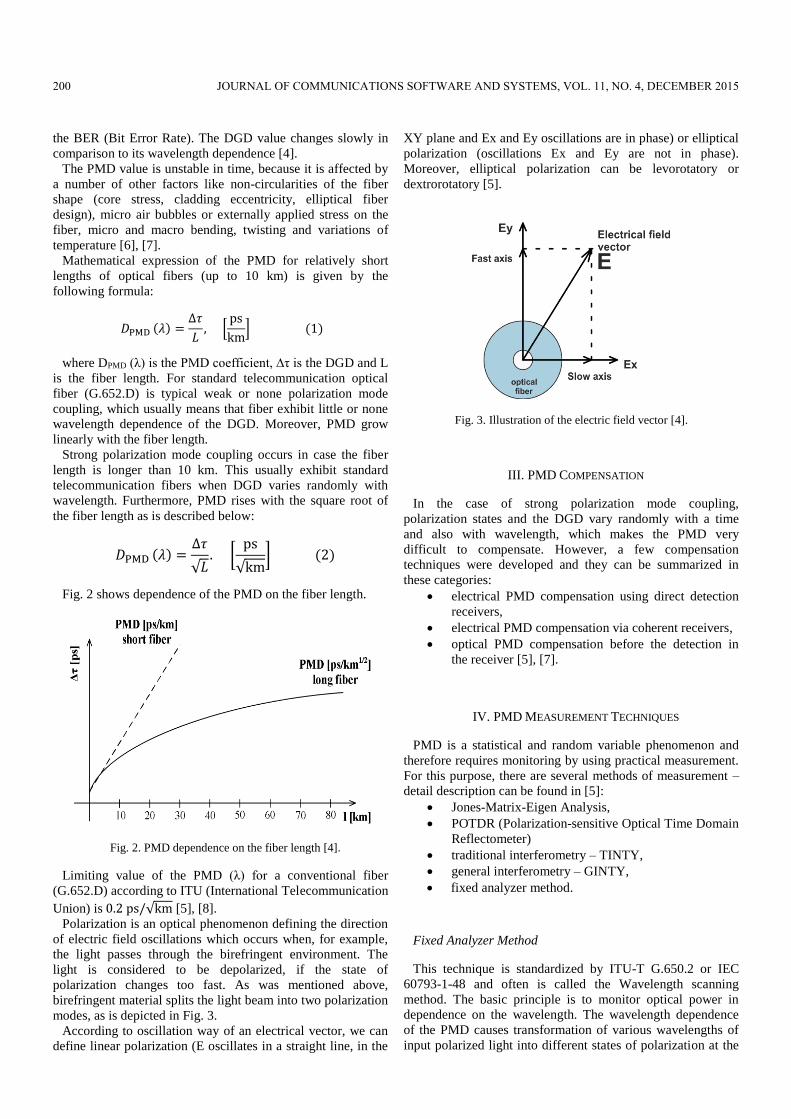
Polarization is an optical phenomenon defining the direction
of electric field oscillations which occurs when, for example,
the light passes through the birefringent environment. The
light is considered to be depolarized, if the state of
polarization changes too fast. As was mentioned above,
birefringent material splits the light beam into two polarization
modes, as is depicted in Fig. 3.
According to oscillation way of an electrical vector, we can
define linear polarization (E oscillates in a straight line, in the
XY plane and Ex and Ey oscillations are in phase) or elliptical
polarization (oscillations Ex and Ey are not in phase).
Moreover, elliptical polarization can be levorotatory or
dextrorotatory [5].
Fig. 3. Illustration of the electric field vector [4].
III. PMD COMPENSATION
In the case of strong polarization mode coupling,
polarization states and the DGD vary randomly with a time
and also with wavelength, which makes the PMD very
difficult to compensate. However, a few compensation
techniques were developed and they can be summarized in
these categories:
electrical PMD compensation using direct detection
receivers,
electrical PMD compensation via coherent receivers,
optical PMD compensation before the detection in
the receiver [5], [7].
IV. PMD MEASUREMENT TECHNIQUES
PMD is a statistical and random variable phenomenon and
therefore requires monitoring by using practical measurement.
For this purpose, there are several methods of measurement –
detail description can be found in [5]:
Jones-Matrix-Eigen Analysis,
POTDR (Polarization-sensitive Optical Time Domain
Reflectometer)
traditional interferometry – TINTY,
general interferometry – GINTY,
fixed analyzer method.
Fixed Analyzer Method
This technique is standardized by ITU-T G.650.2 or IEC
60793-1-48 and often is called the Wavelength scanning
method. The basic principle is to monitor optical power in
dependence on the wavelength. The wavelength dependence
of the PMD causes transformation of various wavelengths of
input polarized light into different states of polarization at the
200 JOURNAL OF COMMUNICATIONS SOFTWARE AND SYSTEMS, VOL. 11, NO. 4, DECEMBER 2015
fiber output. Then the optical power after polarizer changes
randomly with the wavelength.
According to ITU-T G.650.2, the mean DGD can be
calculated by equation:
∆𝜏 =𝑘2 ∙ 𝑁𝑒 ∙ 𝜆1 ∙ 𝜆2
2 ∙ c ∙ (𝜆2 − 𝜆1), [ps] (3)
where Ne is the number of the extremes (maxima and minima)
minus one, c is the speed of the light, k2 represents a constant
with the value of 0.82 (long fibers and strong mode coupling)
or 1.00 (short fibers with weak mode coupling). Wavelengths
𝜆1 and 𝜆2 define the set frequency range.
Another way of calculating the mean DGD value is to use
the FFT (Fast Fourier Transformation).
The Fixed Analyzer method schema is shown in the Fig. 4.
Fig. 4. Basic scheme of the Fixed Analyzer method [5].
Instead of a broadband light source (e.g. SLED –
Superluminescent Light Emitting Diode), the ASE (Amplified
Spontaneous Emission) from EDFA (Erbium Doped Fiber
Amplifier) can be used.
Although the angular position of polarizers should be fixed,
their orientation is not critical to know. Polarizer in the
transmitter part is necessary only if the input light is not
polarized.
Some of optical spectrum analyzers show the wavelength
dependence of the optical power directly.
Main advantage of the FA measurement technique is
possibility of measuring an optical path through multiple
EDFAs. Also, this measurement is very fast and exhibits a
good absolute uncertainty. The sensitivity to input polarization
state seems to be a major disadvantage. This measurement
technique is suitable for telecommunication fibers, but there is
a possibility of limitation caused by high PMD values [5] [7].
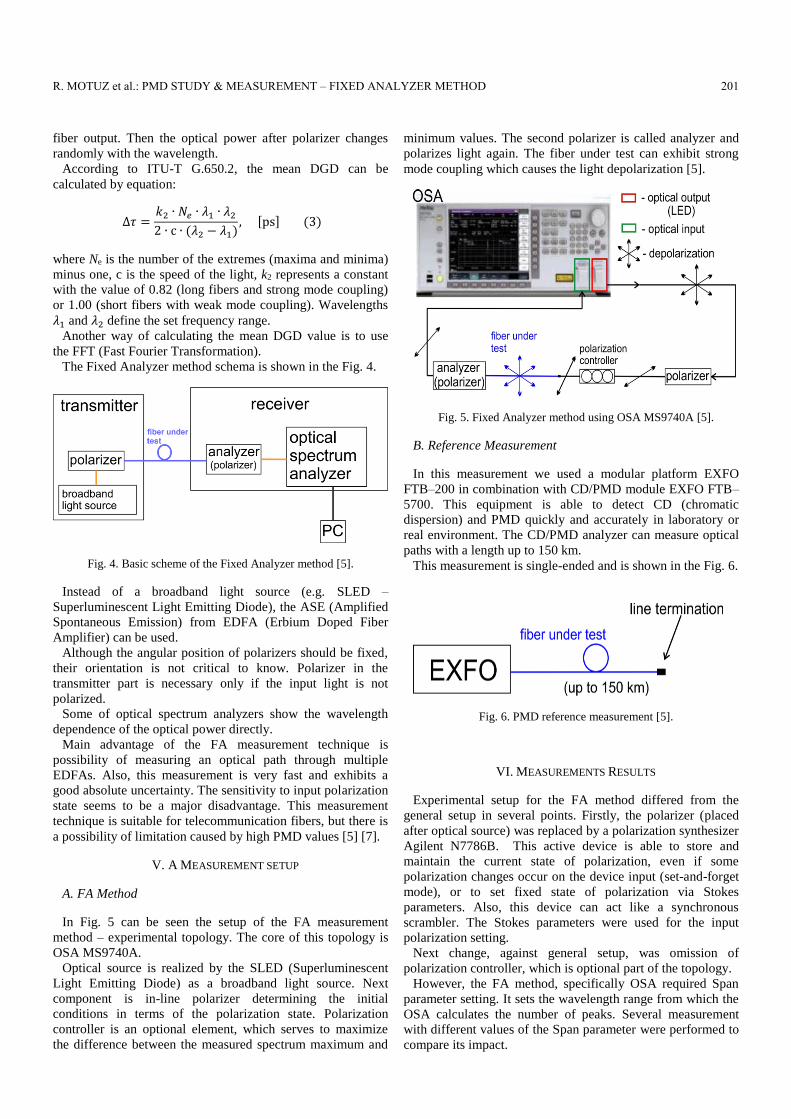
V. A MEASUREMENT SETUP
A. FA Method
In Fig. 5 can be seen the setup of the FA measurement
method – experimental topology. The core of this topology is
OSA MS9740A.
Optical source is realized by the SLED (Superluminescent
Light Emitting Diode) as a broadband light source. Next
component is in-line polarizer determining the initial
conditions in terms of the polarization state. Polarization
controller is an optional element, which serves to maximize
the difference between the measured spectrum maximum and
minimum values. The second polarizer is called analyzer and
polarizes light again. The fiber under test can exhibit strong
mode coupling which causes the light depolarization [5].
Fig. 5. Fixed Analyzer method using OSA MS9740A [5].
B. Reference Measurement
In this measurement we used a modular platform EXFO
FTB–200 in combination with CD/PMD module EXFO FTB–
5700. This equipment is able to detect CD (chromatic
dispersion) and PMD quickly and accurately in laboratory or
real environment. The CD/PMD analyzer can measure optical
paths with a length up to 150 km.
This measurement is single-ended and is shown in the Fig. 6.
Fig. 6. PMD reference measurement [5].
VI. MEASUREMENTS RESULTS
Experimental setup for the FA method differed from the
general setup in several points. Firstly, the polarizer (placed
after optical source) was replaced by a polarization synthesizer
Agilent N7786B. This active device is able to store and
maintain the current state of polarization, even if some
polarization changes occur on the device input (set-and-forget
mode), or to set fixed state of polarization via Stokes
parameters. Also, this device can act like a synchronous
scrambler. The Stokes parameters were used for the input
polarization setting.
Next change, against general setup, was omission of
polarization controller, which is optional part of the topology.
However, the FA method, specifically OSA required Span
parameter setting. It sets the wavelength range from which the
OSA calculates the number of peaks. Several measurement
with different values of the Span parameter were performed to
compare its impact.
R. MOTUZ et al.: PMD STUDY & MEASUREMENT – FIXED ANALYZER METHOD 201
Input polarization stayed fixed during all FA method
measurements. Thanks to the speed of the measurement, we
were able to get an average of 10 values.
Fig. 7 shows the arrangement of the measurement
workplace.
Fig. 7. The measurement workplace for the Fixed Analyzer method.
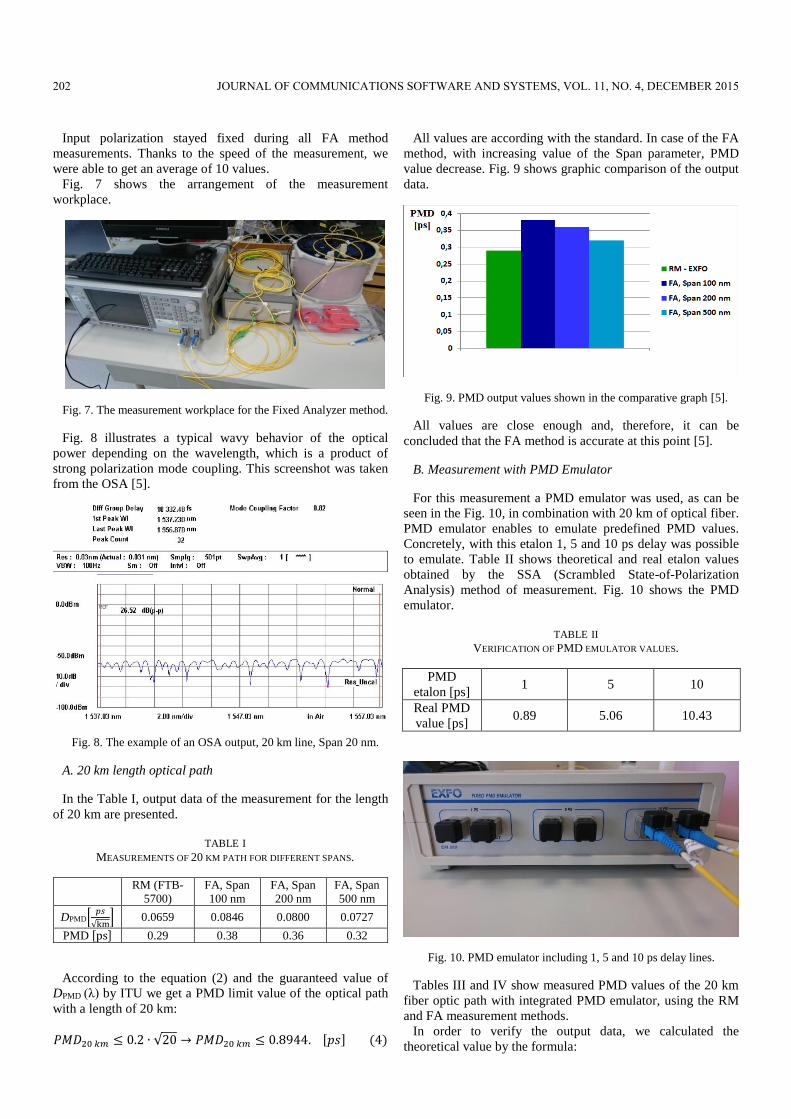
Fig. 8 illustrates a typical wavy behavior of the optical
power depending on the wavelength, which is a product of
strong polarization mode coupling. This screenshot was taken
from the OSA [5].
Fig. 8. The example of an OSA output, 20 km line, Span 20 nm.
A. 20 km length optical path
In the Table I, output data of the measurement for the length
of 20 km are presented.
TABLE I MEASUREMENTS OF 20 KM PATH FOR DIFFERENT SPANS.
RM (FTB-
5700)
FA, Span
100 nm
FA, Span
200 nm
FA, Span
500 nm
DPMD[𝑝𝑠
√km] 0.0659 0.0846 0.0800 0.0727
PMD [ps] 0.29 0.38 0.36 0.32
According to the equation (2) and the guaranteed value of
DPMD (λ) by ITU we get a PMD limit value of the optical path
with a length of 20 km:
𝑃𝑀𝐷20 𝑘𝑚 ≤ 0.2 ∙ √20 → 𝑃𝑀𝐷20 𝑘𝑚 ≤ 0.8944. [𝑝𝑠] (4)
All values are according with the standard. In case of the FA
method, with increasing value of the Span parameter, PMD
value decrease. Fig. 9 shows graphic comparison of the output
data.
Fig. 9. PMD output values shown in the comparative graph [5].
All values are close enough and, therefore, it can be
concluded that the FA method is accurate at this point [5].
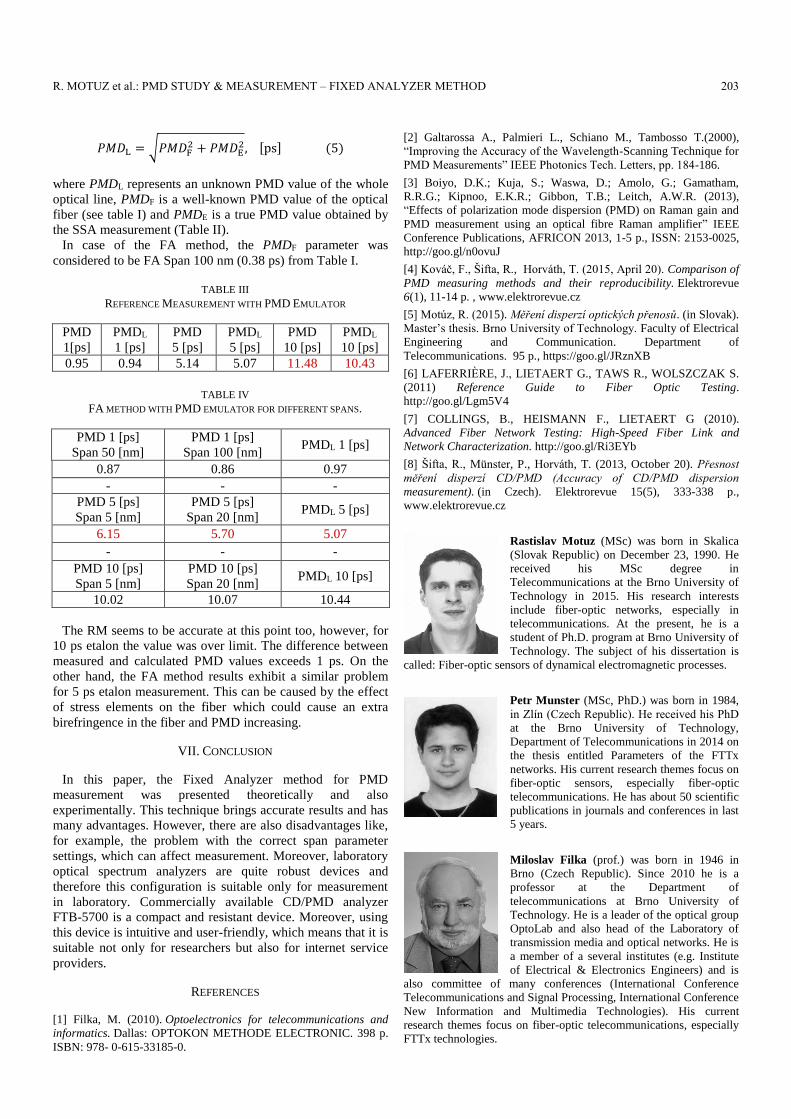
B. Measurement with PMD Emulator
For this measurement a PMD emulator was used, as can be
seen in the Fig. 10, in combination with 20 km of optical fiber.
PMD emulator enables to emulate predefined PMD values.
Concretely, with this etalon 1, 5 and 10 ps delay was possible
to emulate. Table II shows theoretical and real etalon values
obtained by the SSA (Scrambled State-of-Polarization
Analysis) method of measurement. Fig. 10 shows the PMD
emulator.
TABLE II VERIFICATION OF PMD EMULATOR VALUES.
PMD
etalon [ps] 1 5 10
Real PMD
value [ps] 0.89 5.06 10.43
Fig. 10. PMD emulator including 1, 5 and 10 ps delay lines.
Tables III and IV show measured PMD values of the 20 km
fiber optic path with integrated PMD emulator, using the RM
and FA measurement methods.
In order to verify the output data, we calculated the
theoretical value by the formula:
202 JOURNAL OF COMMUNICATIONS SOFTWARE AND SYSTEMS, VOL. 11, NO. 4, DECEMBER 2015
𝑃𝑀𝐷L = √𝑃𝑀𝐷F2 + 𝑃𝑀𝐷E
2, [ps] (5)
where PMDL represents an unknown PMD value of the whole
optical line, PMDF is a well-known PMD value of the optical
fiber (see table I) and PMDE is a true PMD value obtained by
the SSA measurement (Table II).
In case of the FA method, the PMDF parameter was
considered to be FA Span 100 nm (0.38 ps) from Table I.
TABLE III REFERENCE MEASUREMENT WITH PMD EMULATOR
PMD
1[ps]
PMDL
1 [ps]
PMD
5 [ps]
PMDL
5 [ps]
PMD
10 [ps]
PMDL
10 [ps]
0.95 0.94 5.14 5.07 11.48 10.43
TABLE IV FA METHOD WITH PMD EMULATOR FOR DIFFERENT SPANS.
PMD 1 [ps]
Span 50 [nm]
PMD 1 [ps]
Span 100 [nm] PMDL 1 [ps]
0.87 0.86 0.97
- - -
PMD 5 [ps]
Span 5 [nm]
PMD 5 [ps]
Span 20 [nm] PMDL 5 [ps]
6.15 5.70 5.07
- - -
PMD 10 [ps]
Span 5 [nm]
PMD 10 [ps]
Span 20 [nm] PMDL 10 [ps]
10.02 10.07 10.44
The RM seems to be accurate at this point too, however, for
10 ps etalon the value was over limit. The difference between
measured and calculated PMD values exceeds 1 ps. On the
other hand, the FA method results exhibit a similar problem
for 5 ps etalon measurement. This can be caused by the effect
of stress elements on the fiber which could cause an extra
birefringence in the fiber and PMD increasing.
VII. CONCLUSION
In this paper, the Fixed Analyzer method for PMD
measurement was presented theoretically and also
experimentally. This technique brings accurate results and has
many advantages. However, there are also disadvantages like,
for example, the problem with the correct span parameter
settings, which can affect measurement. Moreover, laboratory
optical spectrum analyzers are quite robust devices and
therefore this configuration is suitable only for measurement
in laboratory. Commercially available CD/PMD analyzer
FTB-5700 is a compact and resistant device. Moreover, using
this device is intuitive and user-friendly, which means that it is
suitable not only for researchers but also for internet service
providers.
REFERENCES
[1] Filka, M. (2010). Optoelectronics for telecommunications and
informatics. Dallas: OPTOKON METHODE ELECTRONIC. 398 p.
ISBN: 978- 0-615-33185-0.
[2] Galtarossa A., Palmieri L., Schiano M., Tambosso T.(2000),
“Improving the Accuracy of the Wavelength-Scanning Technique for
PMD Measurements” IEEE Photonics Tech. Letters, pp. 184-186.
[3] Boiyo, D.K.; Kuja, S.; Waswa, D.; Amolo, G.; Gamatham,
R.R.G.; Kipnoo, E.K.R.; Gibbon, T.B.; Leitch, A.W.R. (2013),
“Effects of polarization mode dispersion (PMD) on Raman gain and
PMD measurement using an optical fibre Raman amplifier” IEEE
Conference Publications, AFRICON 2013, 1-5 p., ISSN: 2153-0025,
http://goo.gl/n0ovuJ
[4] Kováč, F., Šifta, R., Horváth, T. (2015, April 20). Comparison of
PMD measuring methods and their reproducibility. Elektrorevue
6(1), 11-14 p. , www.elektrorevue.cz
[5] Motúz, R. (2015). Měření disperzí optických přenosů. (in Slovak).
Master’s thesis. Brno University of Technology. Faculty of Electrical
Engineering and Communication. Department of
Telecommunications. 95 p., https://goo.gl/JRznXB
[6] LAFERRIÈRE, J., LIETAERT G., TAWS R., WOLSZCZAK S.
(2011) Reference Guide to Fiber Optic Testing.
http://goo.gl/Lgm5V4
[7] COLLINGS, B., HEISMANN F., LIETAERT G (2010).
Advanced Fiber Network Testing: High-Speed Fiber Link and
Network Characterization. http://goo.gl/Ri3EYb
[8] Šifta, R., Münster, P., Horváth, T. (2013, October 20). Přesnost
měření disperzí CD/PMD (Accuracy of CD/PMD dispersion
measurement). (in Czech). Elektrorevue 15(5), 333-338 p.,
www.elektrorevue.cz
Rastislav Motuz (MSc) was born in Skalica
(Slovak Republic) on December 23, 1990. He
received his MSc degree in
Telecommunications at the Brno University of
Technology in 2015. His research interests
include fiber-optic networks, especially in
telecommunications. At the present, he is a
student of Ph.D. program at Brno University of
Technology. The subject of his dissertation is
called: Fiber-optic sensors of dynamical electromagnetic processes.
Petr Munster (MSc, PhD.) was born in 1984,
in Zlín (Czech Republic). He received his PhD
at the Brno University of Technology,
Department of Telecommunications in 2014 on
the thesis entitled Parameters of the FTTx
networks. His current research themes focus on
fiber-optic sensors, especially fiber-optic
telecommunications. He has about 50 scientific
publications in journals and conferences in last
5 years.
Miloslav Filka (prof.) was born in 1946 in
Brno (Czech Republic). Since 2010 he is a
professor at the Department of
telecommunications at Brno University of
Technology. He is a leader of the optical group
OptoLab and also head of the Laboratory of
transmission media and optical networks. He is
a member of a several institutes (e.g. Institute
of Electrical & Electronics Engineers) and is
also committee of many conferences (International Conference
Telecommunications and Signal Processing, International Conference
New Information and Multimedia Technologies). His current
research themes focus on fiber-optic telecommunications, especially
FTTx technologies.
R. MOTUZ et al.: PMD STUDY & MEASUREMENT – FIXED ANALYZER METHOD 203