pmr workshop, 25 september 2014, world bank
TRANSCRIPT
Strictly Confidential © 2013 Strictly Confidential © 2013
Grzegorz Peszko Lead Economist, Climate Policy Team,
Climate Change Group, The World Bank
Source: EBRD Analysis 2010-2012 (Grzegorz Peszko, Janina Ketterer)
based on the modeling by McKinsey & Company (Russia), Studies for EBRD by NERA
+ Bloomberg New Energy Finance (Kazakhstan, Turkey, Ukraine)
PMR Workshop, 25th September 2014, World Bank

Strictly Confidential © 2013
Rationale
▪ Frustration of practitioners that abatement measures
that look so profitable on the MAC curves are so difficult
to find and finance
▪ McKinsey reports and other MAC curves keeps
referring that several abatement options (e.g. EE) are
“profitable” although curves are welfare-economic, and
not financial.
▪ What may be “profitable” to society at large is not
necessarily profitable to economic agents (firms, public
entities, residents)
▪ What mix of policies can encourage actions to deliver
various emissions pathways and targets?
Strictly Confidential © 2013 3
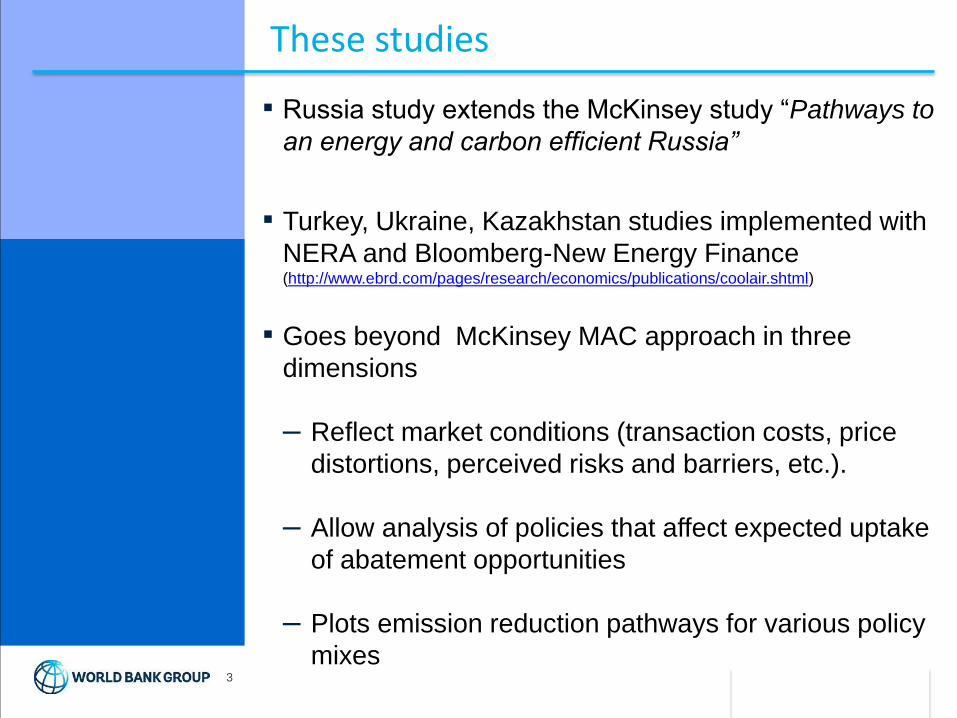
▪ Russia study extends the McKinsey study “Pathways to
an energy and carbon efficient Russia”
▪ Turkey, Ukraine, Kazakhstan studies implemented with
NERA and Bloomberg-New Energy Finance (http://www.ebrd.com/pages/research/economics/publications/coolair.shtml)
▪ Goes beyond McKinsey MAC approach in three
dimensions
– Reflect market conditions (transaction costs, price
distortions, perceived risks and barriers, etc.).
– Allow analysis of policies that affect expected uptake
of abatement opportunities
– Plots emission reduction pathways for various policy
mixes
These studies

Strictly Confidential © 2013 4
▪ Bottom-up, engineering marginal cost curves
▪ Illustrate economics of supply of emission
reduction measures
▪ Increasing average annual unit costs
(vertical axis) of discrete emission reduction
measures plotted against their abatement
potentials (horizontal axis)
▪ Abatement potentials estimated as
practically achievable technical/economic
potentials
The building blocks of the MAC curve
Abatement
measure
Abatement potential (tCo2e/a)
Un
it co
st (E
UR
/t)
Strictly Confidential © 2013 5
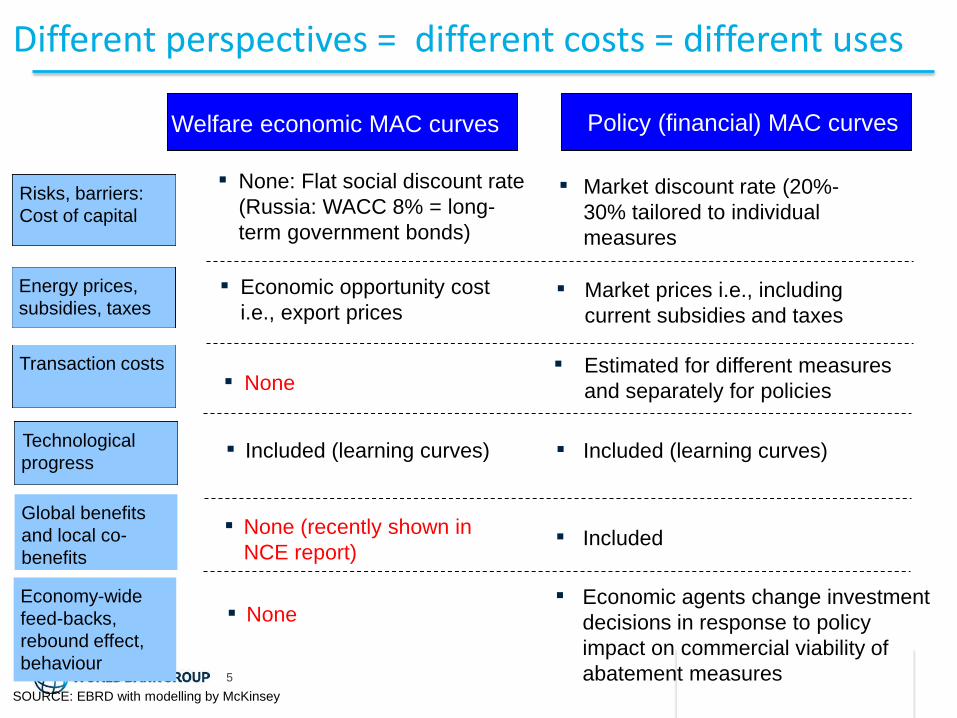
Different perspectives = different costs = different uses
Welfare economic MAC curves
▪ None: Flat social discount rate
(Russia: WACC 8% = long-
term government bonds)
Risks, barriers:
Cost of capital
▪ None Transaction costs
Policy (financial) MAC curves
▪ Economic opportunity cost
i.e., export prices ▪ Market prices i.e., including
current subsidies and taxes
Energy prices,
subsidies, taxes
SOURCE: EBRD with modelling by McKinsey
▪ Market discount rate (20%-
30% tailored to individual
measures
Global benefits
and local co-
benefits
▪ None (recently shown in
NCE report) ▪ Included
▪ Estimated for different measures
and separately for policies
Technological
progress ▪ Included (learning curves) ▪ Included (learning curves)
Economy-wide
feed-backs,
rebound effect,
behaviour
▪ None ▪ Economic agents change investment
decisions in response to policy
impact on commercial viability of
abatement measures

Strictly Confidential © 2013
SOURCE: McKinsey analysis
Transaction costs broken into 2 x 3 matrix (Russia study)
Planning Implementation Monitoring and
Verification
▪Search for vendors,
contractors
▪Negotiation
▪Engineering
feasibility studies
▪Business plan
▪Permits and licenses
▪Search for funding
information etc.
▪Registration
▪Baseline
determination
▪Approval
▪Validation
▪ Insurance
▪Bribery &
corruption
▪Overheads
▪Access routes
and site
preparation
▪Certification
▪Legal Fees
▪Enforcement
▪Review
▪n/a
▪Baseline
evaluation
▪Data collection
▪Reporting
▪Brokerage
▪Trading
‘Project’ transaction
costs, covering all costs
related to project
execution, incremental
to BAU
‘Policy’ transaction
costs, covering
all costs
associated with
applying for
‘green’ funding, FITs,
etc.
Large scale
emissions
trading, e.g.
JI
Government
subsidies
etc.

Strictly Confidential © 2013
Transaction costs are found to average around 7 EUR/t but can be significantly higher for some measures
SOURCE: McKinsey analysis
2030 transaction costs* EUR/t CO2
Project
Trading & subsidy
300 200 1,400 1,300
125
35
30
25
20
15
120
115
10
0
900 800 700 600 500
Ø 7.1
1,000 100 0 1,100 1,200
55
5
45
50
60
400
40
Abatement potential Mt CO2
Building retrofit with ‘small’ project size
SME energy efficiency projects
Small scale apartment heat meters and thermostats
Retrofit small residential buildings
Retrofit medium residential buildings
Nuclear

Strictly Confidential © 2013 8
Transaction costs are highest in energy efficiency
SOURCE: McKinsey analysis for EBRD
Transaction costs
per tonne
EUR/tonne CO2
Average
Non-energy
Low-carbon
energy
Energy efficiency
Project
Policy
Total cost
EUR bn, 2030
Abatement
potential
Mt, 2030
7.0
2.3
0.3
9.7
553
284
520
1358 7.1
4.8
2.3
0.6 0.1
0.5
8.3 6.4
1.9
12.7 8.4 4.3

Strictly Confidential © 2013
Transaction costs and market discount rates (Turkey, Ukraine, Kazakhstan studies)
Strictly Confidential © 2013
10
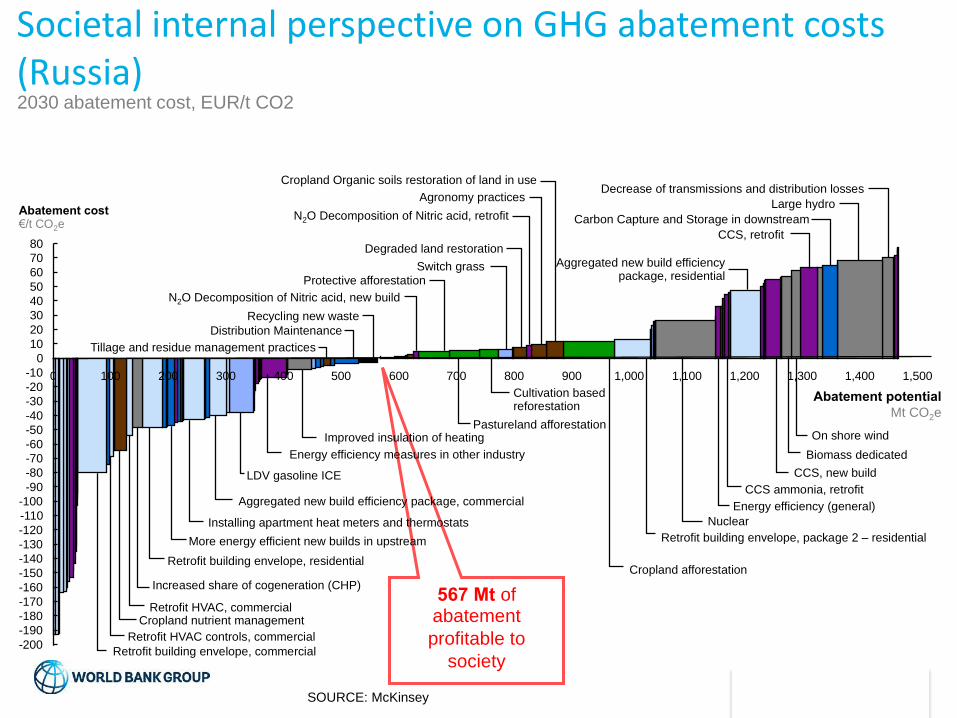
Societal internal perspective on GHG abatement costs (Russia)
SOURCE: McKinsey
2030 abatement cost, EUR/t CO2
567 Mt of abatement
profitable to
society
0
900 800 700 600 500 400 300 1,500 1,400 1,300 1,200 1,100 1,000 100 0 200
Abatement cost €/t CO2e
-90
-80
-70
-60
-50
-40
-30
-200
-20
-190
-180
-170
-160
-150
-140
-130
-120
-110
-100
-10
70
60
50
40
30
20
10
80
Cropland nutrient management
Retrofit building envelope, commercial
Increased share of cogeneration (CHP)
Retrofit building envelope, residential
Decrease of transmissions and distribution losses
Large hydro
Carbon Capture and Storage in downstream
CCS, retrofit
Aggregated new build efficiency package, residential
On shore wind
Biomass dedicated
CCS, new build
Retrofit building envelope, package 2 – residential
Nuclear
Cropland afforestation
Cropland Organic soils restoration of land in use
Agronomy practices
Degraded land restoration
Cultivation based reforestation
Pastureland afforestation
Protective afforestation
Installing apartment heat meters and thermostats
Aggregated new build efficiency package, commercial
LDV gasoline ICE
Improved insulation of heating
Distribution Maintenance
Retrofit HVAC controls, commercial
Retrofit HVAC, commercial
More energy efficient new builds in upstream
Energy efficiency (general)
CCS ammonia, retrofit
N2O Decomposition of Nitric acid, retrofit
N2O Decomposition of Nitric acid, new build
Recycling new waste
Tillage and residue management practices
Switch grass
Energy efficiency measures in other industry
Abatement potential
Mt CO2e

Strictly Confidential © 2013 11
If current market conditions persisted for a long time, only few measures would be profitable to investors
SOURCE: EBRD based on McKinsey analysis
2030 Abatement potential, Mt CO2
2030 Abatement cost per lever, EUR/t CO2
-150
-100
50
350
250
800 100 200 300 400
400
0
500 600 700 900 1,000 1,100 1,200 1,300
150
0
200
300
-50
100
-200
426 Mt of abatement profitable to
investors
Retrofit building envelop, commercial
Cropland nutrient management
Transport
Cropland afforestation
Cropland organic soils restoration
Large hydro
Retrofit building envelope, package 2 - residential
Nuclear
Retrofit building envelope, residential
Protective afforestation
Improved insulation of heating grid
On shore & geothermal
More CHP
Installing apartment heat meters
Retrofit HVAC, residential
Reduction of T&D loss
CCS levers

Strictly Confidential © 2013
Integrated policy mix 1: Economic reforms
150
100
300
400
50
-100
-150
-200
-250
250
-50
350
0
200
1,200 1,000 100 0 -50
100
-200
-150
50
400
-250
350
300
250
200
150
0
900 800 700 600 500 1,100 400 300 200
-100
1,300
Lighting
Average Abatement Cost -8.59 € Profitable Incremental CAPEX 253953 €
Retrofit building envelope, commercial
Profitable Abatement 547.21 (Mt)
Energy efficiency buildings
Cost of capital Energy prices
Reduced transaction costs
Policy transaction costs
Carbon prices Feed in tariffs
Policy mix 1 = Economic reforms
9% Liberalized
û
û
û
û
Transport
Total surplus 39,291 M€
Retrofit building envelope, package 2 - residential
Nuclear
CCS Cropland afforestation
Large hydro
2030 Abatement potential, Mt CO2
On shore & geothermal
Biomass Energy efficiency, petroleum sector
Abatement cost per lever, EUR/t CO2

Strictly Confidential © 2013 13
Integrated policy mix 2: Reduction of transaction costs Abatement cost per lever, EUR/t CO2
SOURCE: EBRD with modelling by McKinsey
2030 Abatement potential, Mt CO2
-250
50
-100
-150
-200
-50
200
150
250
0
100
400
350
300
Average Abatement Cost -12.04 € Profitable Incremental CAPEX 342771 €
200
150
100
0
900 100 700 600 1,200 400 300 200 0 1,300 1,100 1,000
-100
50
-50
-250
-200
-150
800
400
350
300
250
500
Retrofit building envelope, commercial
Profitable Abatement 609.89 (Mt)
Energy efficiency buildings Transport
Total surplus 41,334 M€
Retrofit building envelope, package 2 - residential
Nuclear
CCS
Cost of capital Energy prices
Reduced transaction costs
Policy transaction costs
Carbon prices Feed in tariffs
Policy mix 2 = 1 + EE support
9% Liberalized
ü
û
û
û
Reduction of T&D loss Energy efficiency, petroleum sector
On shore & geothermal
Large hydro

Strictly Confidential © 2013 14
Integrated policy mix 3: Feed-in-tariffs Abatement cost per lever, EUR/t CO2
SOURCE: EBRD with modelling by McKinsey
Average Abatement Cost -18.28 € Profitable Incremental CAPEX 369220 €
800
100
300
250
300
1,100 1,300 100 0 1,200
200
900
0
200
150
400 500 600 700
400
-250
-100
350
50
-50
-200
-150
1,000
350
200
-250
250
0
50
300
-100
400
-150
-200
-50
100
150
Energy efficiency buildings Transport
2030 Abatement potential, Mt CO2
Profitable Abatement 651.57 (Mt)
Retrofit building envelope, commercial
Nuclear
Total surplus 41,750 M€
Cost of capital Energy prices
Reduced transaction costs
Policy transaction costs
Carbon prices Feed in tariffs
Policy mix 3 = 2 + FIT
9% Liberalized
ü
ü
û
û
Reduction of T&D loss
Large hydro
Biomass
On shore wind
Strictly Confidential © 2013
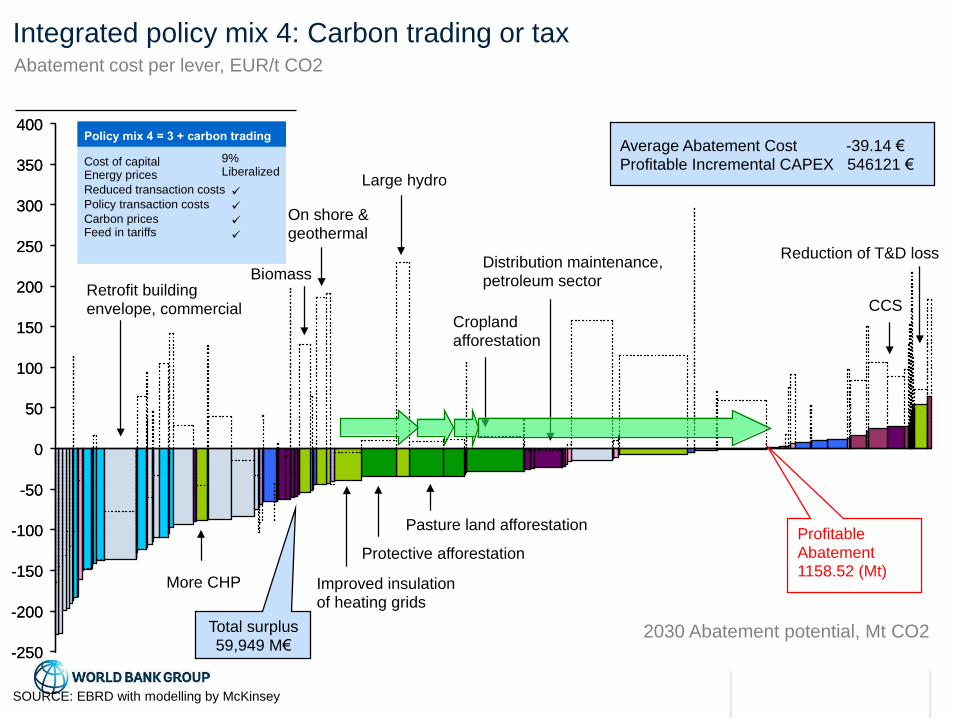
Integrated policy mix 4: Carbon trading or tax Abatement cost per lever, EUR/t CO2
SOURCE: EBRD with modelling by McKinsey
Cost of capital Energy prices
Reduced transaction costs
Policy transaction costs
Carbon prices Feed in tariffs
Policy mix 4 = 3 + carbon trading
9% Liberalized
ü
ü
ü
ü
2030 Abatement potential, Mt CO2
350
100
-150
-100
50
400
0
300
200
150
250
-50
-250
-200
-150
350
-250
-50
250
0
100
150
200
300
-200
400
50
-100
Retrofit building envelope, commercial
Cropland afforestation
Average Abatement Cost -39.14 € Profitable Incremental CAPEX 546121 €
Total surplus 59,949 M€
Profitable Abatement 1158.52 (Mt)
Large hydro
On shore & geothermal
CCS
Biomass
Reduction of T&D loss
Improved insulation of heating grids
Protective afforestation
Pasture land afforestation
Distribution maintenance, petroleum sector
More CHP
Strictly Confidential © 2013
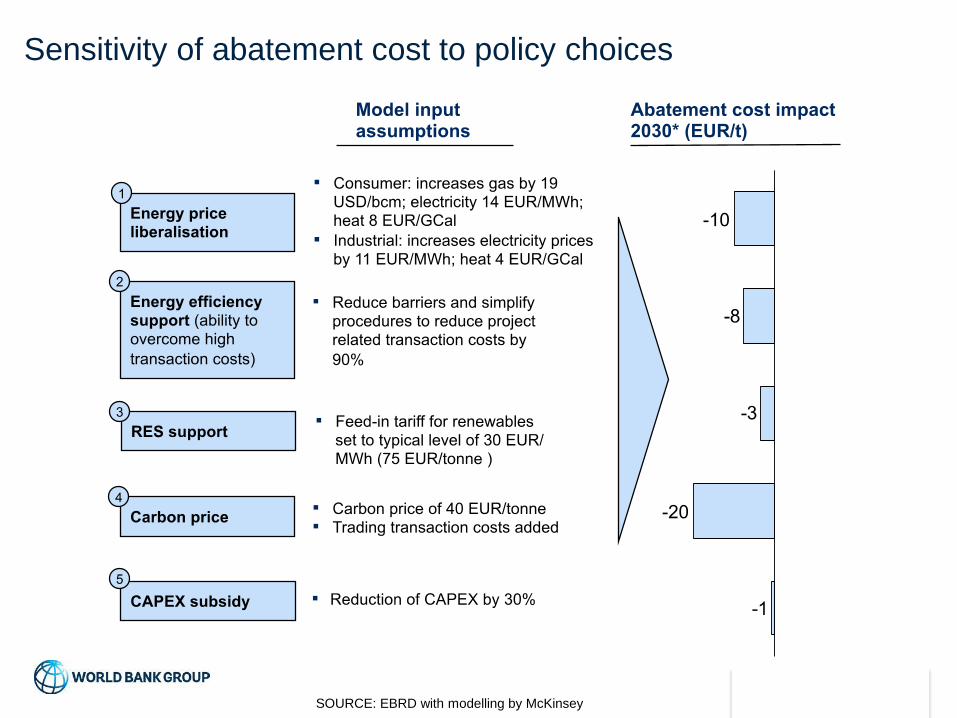
SOURCE: EBRD with modelling by McKinsey
Sensitivity of abatement cost to policy choices
Strictly Confidential © 2013
17

Strictly Confidential © 2013
18

Thank you