pn acquisition using adaptive thresholding and...
TRANSCRIPT

King Saud University
College of Computer and Information Sciences
Department of Computer Engineering
PN Acquisition Using Adaptive Thresholding and Smart
Antenna for Direct Sequence CDMA Mobile Communication
Submitted in Partial Fulfillment of the Requirements for the Master’s Degree in the Department of Computer Engineering at
the College of Computer and Information Sciences, King Saud University
By
Nour Nasser Alhariqi
24 Safar 1434 6 January 2013

ii

iii
ملخص الرسالة
جامعة الملك سعود –كلية علوم الحاسب والمعلومات :الكلية
هندسة الحاسب االليقسم : القسم
مسار الشبكات :المسار
باستخدام العتبة التكيفية والهوائي الذكي التصاالت التسلسل PNمزامنة شفرات الـ :عنوان الرسالة
.الوصول المتعدد بتقسيم الشفرات المتنقله/المباشر
نور ناصر الحريقي: اسم الطالب
مراد بركات ستا الدكتوراأل : اسم المشرف
ماجستيرال : الدرجة العلمية
هـ 4242صفر 42 :تاريخ المناقشة
اتصاالت التسلسل , ائيات الذكية واله, العتبات التكيفية , PN شفرات الـ مزامنة: الكلمات الداللية للبحث
.الوصول المتعدد بتقسيم الشفرات المتنقله/المباشر
: الملخص
ة اتصاالت و لك بأنظم PNلشفرات الـ dwellهذه الرسالة تقدم ألية فعالة لعملية المزامنة التسلسلية أحادية الـ
متعددة المسارات Rayleighلقنوات اتصال( (DS-CDMAالوصول المتعدد بتقسيم الشفرات /التسلسل المباشر
صفوان و بركات قدموا طريقة مبتكرة تتبنى استخدام الهوائيات الذكية مع , ]4[ في المرجع. ات االضمحالل البطئ
في انظمة االتصاالت ات PN في عملية مزامنة شفرة الـ ( CFAR)العتبة التكيفية معدل اإلنذار الخاطئ الثابت
. النطاق العريض
نظام التصاالت المقترح الزال يتبنى فكرة استخدام الهوائيات الذكية في عملية , في هذا العمل البحثي
كعتبة تكيفية في البيئات ات اشارات CMLD-CFARولكن بتطبيق خوارزمية الـ PNالمزامنة التسلسلية لشفرة الـ
تتميز بيئات االتصال المتنقل بوجود االشارات المتعددة المسارات واشارات المستخدمين . المستخدمين المتعددة
استخدام آليات العتبة الثابتة في عملية المزامنة يتميز . PNاالخرين والتي لها تأثير على اداء عملية مزامنة شفرة الـ

iv
أو /ونتيجة لذلك سيكون هناك إزدياد في معدل اإلنذار الخاطئ و. لقدرة على التكيف مع تلك البيئات المتغيرةبعدم ا
الهوائيات الذكية هي مصفوفة . انخفاض في احتمالية الكشف وبناء عليه فإن استخدام العتبات التكيفية مطلب ضروري
تكيفيا لتقليل تأثير الضوضاء وتداخالت الوصول المتعدد من عناصر الهوائيات التي بإمكانها تعديل نمط المصفوفة
(MAI )من المستخدمين االخرين واالشارات المتعددة المسارات.
احتمال , بإستنتاج المعادالت الرياضية الحتمال اإلنذار الخاطئ PNتم تحليل اآللية المقدمة لتزامن شفرات الـ
المقدم PNكاة المقدمة توضح متانة وفاعلية نظام مزامنة شفرة الـ نتائج المحا. المتوسط الزمني للتزامن, الكشف
.لنظام االتصاالت المعتبر
v
Abstract
College: Collage of Computer and Information Sciences – King Saud University
Department: Department of Computer Engineering
Track: Network track
Title of the thesis: PN Acquisition Using Adaptive Thresholding and Smart Antenna for
Direct Sequence CDMA Mobile Communication
Student Name: Nour Nasser Alhariqi
Supervisor Name: Professor Mourad Barkat
Degree: Master
Discussion Date: 6 January 2013
Tagged to search: PN code acquisition, Smart antenna, CFAR, DS-CDMA
Abstract :
This thesis presents an efficient single dwell serial search pseudo-noise (PN) code
acquisition scheme for direct sequence code division multiple access (DS-CDMA)
communication systems in Rayleigh slowly fading multipath channel. In [1], Sofwan and
Barkat presented a novel approach using smart antenna and adaptive thresholding
constant false alarm rate (CFAR) for PN code acquisition in wideband communication.
In this thesis, the proposed communication system still considers PN code
acquisition by using smart antenna but with the censored mean level detector constant
false alarm rate (CMLD-CFAR) as an adaptive threshold processor in multiuser signals
situations. In mobile communication environments, multipath signals and other users'
signals affect the performance of PN code acquisition. Fixed threshold techniques are
unable to adapt to these varying environments. Accordingly, a high false alarm rate

vi
and/or a low detection probability may result, and thus adaptive thresholding techniques
are essential. A smart antenna is an array of antenna elements that can modify the array
pattern adaptively to minimize the effect of noise, multiple access interference (MAI) of
other users, and multipath fading.
The proposed PN code acquistion scheme has been analyzed by deriving closed
form expressions for the probability of false alarm, the probability of detection, and the
mean acquisition time. The simulation results presented show the robustness and
efficiency of the acquisition process in the communication system considered.

vii
Acknowledgements
First and foremost, I would like to express my deepest gratitude to Allah Almighty for
providing me the blessings to complete this work. All praise is to Allah.
My sincere gratitude and thanks goes to Professor Mourad Barkat for his
supervision, patience, and support during my thesis work. I am eternally grateful to him,
because with his guidance, enthusiasm and encouragement, my dream of writing and
publishing a paper became a reality. Truly, I am very proud that Professor Mourad is my
mentor.
Also I am most grateful to my colleague Aghus Sofwan for his continuous and
unbounded help, the brilliant discussions, and for sure his patience to my frequent
questions. I cannot imagine that I can find a colleague more collaborative than him. So
here, I would like to express my greatest admiration and a lot of thanks to Aghus.
My thanks also extend to the members of my thesis committee: Dr. Ghulam
Muhammad and Dr. Salman Alqahtani.
My loving thanks are for my wonderful mother for her prays, endless love, priceless
friendship, support and continues encouraging. Also, I express my deepest sense of
gratitude to my great father for what he did and does for me. My warmest thanks also go
to my brothers: Mohammad, Ahmad, Qusai, Suhaip, and Qutaibah for the love that they
grant me. They are always standing beside me and supporting me during the entire period
of my graduate studies.
viii
Table of Contents
- iii -.............................................................................................................ملخص الرسالة
Abstract....................................................................................................................- v -
Acknowledgment...................................................................................................- vii -
List of Figures..........................................................................................................- x -
List of Abbreviations.............................................................................................- xii -
Chapter 1 – General Introduction.............................................................................- 1-
1.1 Introduction .............................................................................................. - 2 -
1.2 Literature Review...................................................................................... - 4 -
1.3 Objectives ................................................................................................. - 9 -
1.4 Organization of the Thesis ...................................................................... - 11 -
Chapter 2 – Spread Spectrum Communication, Adaptive Thresholding CFAR
Detection, and Smart Antenna................................................... ...........................- 12 -
2.1 Introduction ............................................................................................ - 13 -
2.2 Spread Spectrum ..................................................................................... - 14 -
2.2.1 What is the Spread Spectrum? ...................................................... - 15 -
2.2.2 Pseudo Noise Code Sequences ..................................................... - 16 -
2.2.3 Types of Spread Spectrum............................................................ - 16 -
2.3 Code Division Multiple Access ............................................................... - 19 -
2.4 PN Code Acquisition for Direct Sequence Receiver ................................ - 22 -
2.5 Adaptive Thresholding CFAR Detection ................................................. - 27 -
2.5.1 Adaptive CFAR Detection ........................................................... - 27 -
2.5.2 Adaptive CFAR thresholding for the PN code acquisition ............ - 34 -
2.6 Smart Antenna Systems .......................................................................... - 34 -
2.6.1 What is the Smart Antenna System? ............................................. - 35 -
2.6.2 Architecture of the Smart Antenna System ................................... - 36 -
2.6.3 Adaptive Beamforming Algorithms.............................................. - 38 -
2.6.4 Types of the Smart Antenna Systems ........................................... - 39 -
2.6.5 The Advantages of the Smart Antenna Systems ............................ - 43 -
Chapter 3 – Communication System Model and Analysis....................................- 45 -
3.1 Introduction ............................................................................................ - 46 -

ix
3.2 Communication System Model ............................................................... - 47 -
3.2.1 The Transmitted Signal ................................................................ - 48 -
3.2.2 The Communication Channel Model ............................................ - 49 -
3.2.3 The Antenna Array Elements ....................................................... - 50 -
3.2.4 The Received Signal .................................................................... - 50 -
3.2.5 The Correlator .............................................................................. - 51 -
3.2.6 The Least Mean Square Processor ................................................ - 53 -
3.2.7 The CMLD-CFAR Processor ....................................................... - 54 -
3.3 System Analysis ...................................................................................... - 55 -
3.3.1 The Probability of False Alarm .................................................... - 56 -
3.3.2 The Probability of Detection ........................................................ - 58 -
3.3.3 The Mean Acquisition Time ......................................................... - 59 -
3.4 Results and Discussions .......................................................................... - 63 -
3.4.1 Probability of Detection ............................................................... - 64 -
3.4.2 Mean Acquisition Time ................................................................ - 70 -
Chapter 4 – Conclusion................................................... ......................................- 73 -
4.1 Summary and Conclusions ...................................................................... - 74 -
4.2 Suggestions for Future Research Work .................................................... - 75 -
Appendix - MATLAB Codes…………………………………………………….- 76 -
References…..……………………………………………………………………- 83 -

x
List of Figures
Fig. 2-1: The multiple access techniques: (a) FDMA, (b) TDMA, and (c) CDMA…..…14
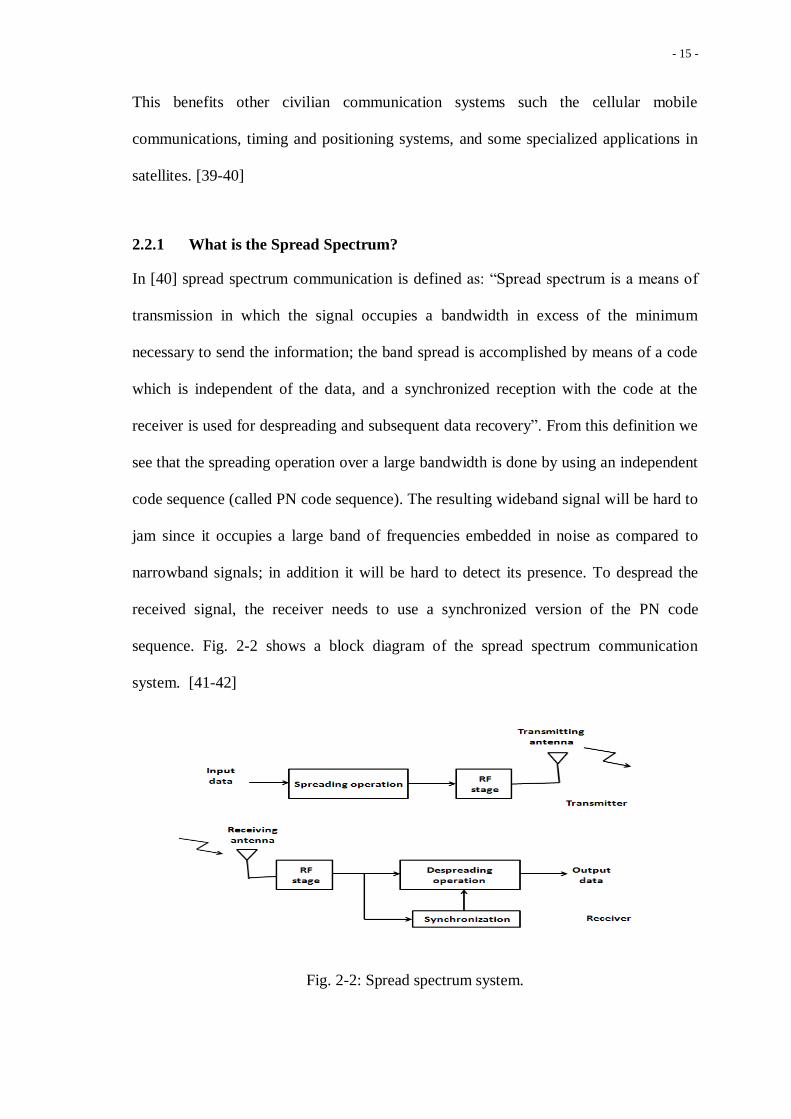
Fig. 2-2: Spread spectrum system...……………………………………………….……..15
Fig. 2-3: Direct sequence spreading operation……………………………..…………….17
Fig. 2-4: Direct sequence despreading operation. ……………………………………….18
Fig. 2-5: Frequency hopping spread spectrum. ………………………………………….19
Fig. 2-6: DS-CDMA. …………………………..………………………………….……..19
Fig. 2-7: DS-CDMA transmitter. …………………………..……………………..……..20
Fig. 2-8: Non-coherent DS-CDMA receiver. …………………………..…………….….22
Fig. 2-9: Coherent DS-CDMA receiver. ………………………………………….……..22
Fig. 2-10: A classification of the PN code acquisition schemes based on the detector
structure. …………………………..…………………………..…………...26
Fig. 2-11: Effect of the noise power increase on the probability of false alarm for a fixed
threshold. …………………………..…………………………..…………….28
Fig. 2-12: Cell averaging CFAR…………………………..…………………………..…29
Fig. 2-13: Model of a clutter edge where test cell in clear……………………………....30
Fig. 2-14: Model of a clutter edge where test cell in clutter. ………………………..….30
Fig. 2-15: Threshold too high. …………………………..………………………..……..32
Fig. 2-16: Threshold not high enough. …………………………..………………..…….32
Fig. 2-17: The clutter edge and spikes model. …………………………..…………...…33
Fig. 2-18: Adaptive PN code acquisition detector…………………………………..…..34
Fig. 2-19: Human auditory function……………………………………………….…….36
Fig. 2-20: Reception part of the smart antenna system……………………………….....37
Fig. 2-21: Transmission part of a smart antenna……………………………………..….38
Fig. 2-22: Coverage pattern (a) Switched beam (b) adaptive array …………………….40
Fig. 2-23: Switched beam smart antenna system. …………………………………...….40
Fig.2-24: Switched beam and adaptive array beams in the presence of interference
signals. ……………...…………..…………………………………..………42
Fig.2-25: Switched beam and adaptive array coverage in low/significant interference
environment. …………………………..………………………..……..……42
Fig. 3-1: Block diagram of the proposed system………………………………………...48

xi
Fig. 3-2: Tapped delay line model of the frequency-selective channel……………….….49
Fig. 3-3: Correlator consists of in-phase (I) and quadrature-phase (Q) components….…51
Fig. 3-4: The LMS processor..………….………………..……………………………….53
Fig. 3-5: CMLD-CFAR processor. …………………………..…………………………..55
Fig. 3-6: The circular state transition diagram………………...…………………………60
Fig. 3-7: The H1 state.. …………………………..…………………………..………..…62
Fig. 3-8: Comparison of using CA-CFAR processing with CMLD-CFAR system with
multipath. …………………………..…………………………..……………...65
Fig. 3-9: Comparison of between the proposed system with and the APP
system. …………………………..…………………………..…………………66
Fig. 3-10: Effect of the number of antenna elements on the detection performance.…67
Fig.3-11: Comparison of for different number of antenna elements and different
values of number of censored cells ……..…………..…………..…………68
Fig. 3-12: Effect of the number of reference cells on the detection performance…....69
Fig. 3-13: Effect of the correlation length integer on the detection performance……..70
Fig. 3-14: Effect of the number of antenna elements on the . ……………..……..71
Fig. 3-15: Effect of the correlation length integer on the ………………….……72

xii
List of Abbreviations
adaptive acquisition processor AAP
additive white Gaussian noise AWGN
analog-to-digital A/D
application specific integrated circuits ASIC
binary PSK BPSK
cell under test CUT
cell-averaging constant false alarm rate CA-CFAR
censored mean level detector CMLD
censored mean level detector constant false alarm rate CMLD-CFAR
code division multiple access CDMA
constant false alarm rate CFAR
digital signal processing DSP
digital-to-analog D/A
direct sequence DS
direct sequence code division multiple access DS-CDMA
direction of arrival DOV
excision CFAR E-CFAR
frequency division multiple access FDMA
frequency hopping FH
frequency hopping code division multiple access FH-CDMA
full period code FPC
generalized censored mean level detector GCMLD

xiii
generalized two-level censored mean level detector GTL-CMLD
greatest of CFAR GO-CFAR
Interim Standard 95 IS-95
inter-symbol interference ISI
least mean square LMS
maximum likelihood ML
mean level acquisition processor MLAP
mean square error MSE
minimum variance MV
multiple access interference MAI
non-line-of-sight NLOS
order statistics acquisition processor OSAP
order statistics CFAR OS-CFAR
partial period code PPC
phase shift keying PSK
pseudo-noise PN
quadrature PSK QPSK
radio frequency RF
signal of interest SOI
signals not of interest SNOI
signal-to-interference plus- noise ratio SINR
signal-to-interference ratio SIR
signal-to-noise ratio SNR
Smallest of CFAR SO-CFAR

xiv
switching CFAR S-CFAR
switching ordered statistic CFAR SOS-CFAR
time division multiple access TDMA
trimmed mean CFAR TM-CFAR
uniform linear array ULA
Universal Mobile Telecommunications System UMTS
variable index CFAR VI-CFAR

- 1 -
Chapter 1
General Introduction
1.1 Introduction
1.2 Literature Review
1.3 Objectives
1.4 Organization of the Thesis
Summary
In this chapter, we present an introduction to the research topic and the specific
problem under consideration. Then we give a literature review presenting some of
the related research work in this rich literature. We give an explanation and the
purpose of this thesis and the research objectives. Then, the chapter is concluded
with a section presenting the organization of the thesis.

- 2 -
1.1 Introduction
For years, direct sequence code division multiple access (DS-CDMA) appears as one of
the most favored technique for cellular communication systems. The Interim Standard
95 (IS-95) from the second generation cellular standards, and the cdma2000 and the
Universal Mobile Telecommunications System (UMTS) from the third generation
cellular standards all are some examples of the DS-CDMA technique. The amount of
interest and effort invested in this area by research institutions and industry is gigantic
and constantly growing. DS-CDMA communication systems have received
considerable interest in the literature and the problem of pseudo-noise (PN) code
acquisition is one of the topics that have been studied extensively.
To transmit a data signal in the direct sequence (DS) communication systems, the
sender uses a PN code to spread the signal before transmission. This same code is then
used by the receiver for the despreading operation. To be able to demodulate properly
the received signal, the receiver must first perform the PN codes synchronization
between the received code and the locally generated one. The goal of this process is to
align these two PN code sequences, which is achieved in two stages; (1) PN acquisition,
which coarsely aligns the two PN code sequences within a fraction of the chip duration,
and (2) PN tracking, which is a finer alignment that aims to reducing synchronization
errors to an acceptable limit [2].
Due to the unknown time delay between the transmitter and the receiver, the
phase of the received PN code is unknown. Therefore, all possible phases of the
spreading PN code will form an uncertainty region of phases that can be divided into a
number of cells; each cell corresponds to a different phase delay. To find the correct
code phase, the receiver in the PN code acquisition stage searches over these cells.

- 3 -
According to the search mechanism, the acquisition stage can be classified as: the serial
search acquisition in which one uncertainty code phase is tested at a time [3-4], the
parallel search acquisition in which all possible code phases are tested simultaneously
[5-6], and the hybrid search acquisition which combine the serial search with the
parallel search [2,7]. To determine whether the tested phase cell is a synchronized code
phase, that is the local code and the received PN code sequence are aligned or not, the
correlation between these two PN codes is computed and compared to a threshold value
to make the synchronization decision.
The PN code acquisition can be modeled as a binary hypothesis problem, where
the code phase cells represent either hypothesis for the correct phase that results in
the synchronization (the alignment) state or hypothesis for the incorrect code phase
that results in the non-synchronization (the non-alignment) state. The receiver seeks to
make a correct decision by accepting code phases and rejecting code phases and
trying to avoid as much as possible the miss and the false alarm situations [8].
PN acquisition is the most challenging stage in code synchronization. In mobile
communications it is known that the receiver receives multiple copies of the transmitted
signal from several paths with different attenuations and time delays, furthermore the
multiple access interference (MAI) signals are common in DS-CDMA communication
systems. In addition to that, the power of the received signal is inversely proportional to
some power n of the distance between the transmitter and the receiver, where n is
normally between 3 and 4 [9]. All these circumstances have serious effects on the PN
code acquisition performance. Moreover, since the received signal levels are unknown
and location varying, using a fixed threshold may cause too many false alarms and/or
low detection probability according to the selected threshold value [8-9]. If the

- 4 -
threshold value is too low, the false alarm probability will increase seriously. On the
other hand, if it is too high the probability of miss is increased [8].
An efficient PN code acquisition is a significant requirement for DS-CDMA
wideband communication receivers. It is essential to acquire the PN code sequence both
quickly and accurately in order to provide a high quality communication.
1.2 Literature Review
To overcome the excessive false alarms that may result from using the fixed threshold, a
threshold value set adaptively according to the surrounding environment to maintain a
constant false alarm rate (CFAR) has been proven to give best results. CFAR algorithms
are well developed in the field of automatic radar signal detection. The main idea is to
estimate the background noise variance or power, which is not known, from a reference
window consisting of a number of cells to set the threshold adaptively [8].
Finn and Johnson [10] proposed the cell-averaging constant false alarm rate (CA-
CFAR) detector. The adaptive threshold is obtained from the maximum likelihood
estimated noise power, which is the arithmetic mean of the output of the reference cells.
In a homogeneous environment, the samples in the reference cells are assumed to be
independent and identically distributed (i.i.d.). In this case, the probability of detection
of the CA-CFAR detector approaches the probability of detection of the optimum
Neyman-Pearson detector as the number of reference cells becomes very large. Under
non-homogeneous conditions and in multiple interference situations, the performance of
the CA-CFAR detector deteriorates seriously and many detectors have been proposed in
the literature to improve the detection performance [11-24]. In [11], Rohling proposed
the order statistics CFAR (OS-CFAR) detector in which one cell is chosen to represent
the estimate of the noise power after rank ordering the contents of the cells in the

- 5 -
reference window. Cho and Barkat [12] proposed the moving OS-CFAR detector for
non-homogeneous situations. Rickard and Dillard [13] proposed the censored mean
level detector (CMLD) in which the reference cells are rank ordered and the highest
cells containing interferences are censored. The performance of the CMLD for a known
number of interferences has been studied in [14]. Gandhi and Kassam [15] proposed the
trimmed mean CFAR (TM-CFAR) detector. In the TM-CFAR detector, the noise power
estimation is the mean of the rank ordered reference cells after censoring a number of
cells from the both ends (lower end and upper end) of the reference window. When the
number of interferences in not known a priori, Barkat et al. [16] proposed the
generalized censored mean level detector (GCMLD), in which cells containing
interferences are determined and censored. When the background noise level presents a
transition of two levels in addition to interferences, Himonas and Barkat [17] proposed
the first concept on automatic censoring in CFAR processing and called the detector the
generalized two-level censored mean level detector (GTL-CMLD), which censors
automatically unwanted interferences. In [18], Smith and Varshney introduced the
variable index CFAR (VI-CFAR), an intelligent CFAR processor based on data
variability. Automatic censoring based on ordered data variability in a multi-
interference environment was also considered in [19]. In [20], Cao proposed the
switching CFAR (S-CFAR) in which the magnitude of the test cell is exploited to select
appropriate reference cells for the noise power estimation. Meng [21] comments on the
S-CFAR by proposing a simpler approach based on order statistic to obtain alternative
expressions for the probabilities of false alarm and detection, and in a paper to appear in
January 2013, Zhang et al. [22] proposed an improved switching CFAR detector for
non-homogeneous environments. Erfanian and Vakili [23] proposed a switching
ordered statistic CFAR (SOS-CFAR) for different radar environments. A MATLAB

- 6 -
simulation study of some CFAR implementation cost and performance tradeoffs in
heterogeneous environments was considered in [24].
CFAR processing has found a fertile environment in adaptive PN code acquisition
for wideband DS-CDMA communication systems. Several researches have been
proposed in literature which employing the CFAR processing to set an adaptive
threshold for the PN acquisition [9, 25-28]. In [25], Benkrinah and Barkat considered
an adaptive PN code sequence acquisition using the OS-CFAR in DS-CDMA
communication systems for a multipath Rayleigh fading channel. In [26], the channel
was assumed to be a non-fading additive white Gaussian noise (AWGN) and the CA-
CFAR processing was used to compute the adaptive threshold. The simulation results
have shown that this system gave a better performance than the conventional system
with a fixed threshold.
Kim et al. considered in [9] two adaptive acquisition schemes for PN code
sequences; CA-CFAR processing which they called mean level acquisition processor
(MLAP) and OS-CFAR which they called order statistics acquisition processor (OSAP)
in Rayleigh fading. However for the OS-CFAR they select the smallest ranked cell
which may result in higher false alarm rates. In [27] the CMLD was renamed as
adaptive acquisition processor (AAP) and considered multipath fading channels. The
excision CFAR (E-CFAR) was considered in [28] for adaptive PN acquisition in DS
spread spectrum communication. The idea of excision CFAR was actually first
introduced in 1988 by Barkat [29] and called it a modified CFAR detector.
Today many DS-CDMA communication systems rely on multiple antennas for
both reception and/or transmission. Using multiple antennas to improve PN acquisition
performance has received considerable interest in the literature. Two different

- 7 -
approaches for the multiple antennas can be considered depending on the inter-element
separation and the signal processing on the reception of the signals. Multiple antennas
either are in the form antenna diversity or in the form of smart antenna (adaptive
antenna array with beamforming) [30]. Antenna diversity uses enough distance between
antenna elements to ensure that the corresponding channels have independent fading
processes. In practice this separation depends on the angular spread characterization of
the radio channel. Narrow angular spreads require considerable antenna separation,
whereas closer separation is sufficient in large angular spreads to obtain independent
channel behavior. An improvement in the signal-to-noise ratio (SNR) will result from
the noncoherent combining of received signals from each antenna, which in turn,
improves the statistics of the detector, and consequently the acquisition [30].
PN code synchronization utilizing antenna diversity has been widely discussed in
the literature. In [6] Rick and Milstein have investigated the use of antenna diversity to
improve the conventional parallel acquisition performance of a DS spread spectrum
signal in both Rayleigh and Rician amplitude distributions. In [31], Krouma and Barkat
considered a hybrid double-dwell system with antenna diversity for DS-CDMA using
the CA-CFAR processing in Rayleigh fading channels. An extended version was
considering computations of the time acquisition and more comparison with a hybrid
single dwell was given in [32]. In [33], Kwon et al. considered the three fundamental
CFAR processors; CA-CFAR, greatest of CFAR (GO-CFAR) and the smallest of
CFAR (SO-CFAR) in a hybrid PN acquisition of DS-CDMA communication systems
for both homogenous and non-homogeneous environment. In [34], Bekhakhecha et al.
considered an adaptive PN code acquisition using antenna diversity and OS-CFAR
processing. They evaluated the detection performance of the proposed scheme in a

- 8 -
frequency selective fading channel and the simulation results showed a substantial
performance improvement.
Due to many distinctive advantages of using smart antenna, there was a focus on
utilizing a smart antenna to improve PN acquisition in the last few years [1, 35-37].
Smart antenna has a good ability in combating MAI signals, tracking mobile signals,
reducing multipath fading, and improving signal power gain [1]. Wang and Kwon [35]
proposed an efficient PN code acquisition scheme that used all smart antenna elements
during PN code acquisition. The results showed that employing all antenna elements for
PN acquisition has improved the detection performance and the mean acquisition time
compared to using just a single antenna for the acquisition under AWGN and Rayleigh
fading channels. In [36], the same authors try to make an iterative estimation of the
received power using the iterative weights obtained from the least mean square (LMS)
algorithm to compute iteratively a new threshold for a better PN code acquisition for
each cell. This requires extremely heavy computations and the assumption that the
smart antenna can track the direction of arrival (DOA) estimation of the desired user
signal perfectly, and yet it does not yield a constant false alarm rate. The DOA with
beamforming with a fixed threshold for PN acquisition was considered by Puska et al.
in [37].
In new recent research, Sofwan and Barkat [1] provide a novel approach for PN
code acquisition using smart antenna and adaptive thresholding TM-CFAR processing
to achieve the design probability of false alarm rate (CFAR). In addition, the results
have shown a serious enhancement of the detection probability in a Rayleigh slowly
fading multipath channel compared to the scheme in [35].

- 9 -
1.3 Objectives
It has been shown that the communication system proposed by Sofwan and Barkat [1]
using smart antennas and adaptive thresholding CA-CFAR processing has comparable
detection performance as the smart antennas system proposed by Wang and Kwon [35]
in a homogeneous environment. In a non-homogeneous environment, in the presence of
multipath and MAI signals, the detection performance of both systems in [35] and in [1]
with CA-CFAR processing is seriously degraded. To remedy to this situation, the
trimmed mean (TM) CFAR was detector was suggested in [1], and consequently the
system performance improved substantially and thus showed robustness in a more
realistic. In today’s mobile communication, the environment is non-homogeneous with
the presence of both multipath and MAI signals.
The robustness of the communication system proposed in [1] suggests the
consideration of even other robust CFAR processors based on order statistics.
In this thesis, we consider the system proposed in [1] while using the CMLD-
CFAR as an adaptive threshold in a Rayleigh slowly fading multipath communication
channel. The CMLD-CFAR is one of the order statistics CFAR processors that has
proved to be robust in non-homogeneous environments with multiple interfering signals
[13-14]. As mentioned earlier, in the TM-CFAR the ordered cells of reference window
are trimmed or censored from both the upper and the lower end, while in the CMLD-
CFAR the ordered cells are censored only from the upper end. So the CMLD-CFAR can
be considered as a special case from the TM-CFAR.
In the system, the transmitted signals are received by all elements of the smart
antenna and go through the LMS adaptive processor. Then, the output from the LMS
processor undergoes CMLD-CFAR processing in order to make a cell synchronization
- 10 -
decision. In the CMLD-CFAR, the outputs from the reference cells are rank-ordered
according to their magnitude and the highest cells which correspond to multipath
replicas and multiple access interferences are censored to avoid unnecessary high
thresholds, while the other remaining cells are used to compute the estimate of the
background power level which will be used as the adaptive threshold. This will be
explained in more detail in the next chapter.
In [1], expressions for the conditional probability density functions of the aligned
and the non-aligned hypotheses at the output of the LMS were developed. Based on
these expressions, the probability of false alarm of the proposed system that consider the
TM-CFAR was derived and the detection performance has been simulated to show the
robustness of the system in combating MAI and multipath signals in non-homogeneous
environment. In this thesis, we will use those probability density functions of the LMS
output in deriving closed form expressions for the probability of false alarm, the
probability of detection, and the mean acquisition time for the proposed system. Then
we study how efficient is the proposed system in a Rayleigh slowly fading multipath
channel. The effect of employing all elements of the smart antenna on the PN
acquisition performance compared to the AAP processor considered in [27] will also be
investigated. The detection and the mean acquisition time performances will also be
studied in terms of computer simulations under various design parameters.
And we would like to point out that, part of this research work (the derivation of
the probability of false alarm and some obtained results for the detection performance)
has been published as a research paper [38] in IEEE International Conference on High
Performance Computing and Communications (IEEE-HPCC 2012), Liverpool, UK, June
2012.

- 11 -
1.4 Organization of the Thesis
The rest of the thesis is organized as follows. Chapter 2 provides the necessary
preliminaries of spread spectrum communication, code division multiple access
(CDMA), PN code acquisition for direct sequence receiver, adaptive thresholding
CFAR processing, and smart antenna.
In Chapter 3, we present the communication system under consideration for
wireless wideband communication. We present a detailed analysis of the proposed
system while we derive closed form expressions for the probability of false alarm, the
probability of detection, and the mean acquisition time. An in-depth analysis of the
MATLAB simulations results on the performance of the system is presented along with
our conclusions.
In Chapter 4, we present a summary of the work done in this thesis plus some
suggestions for future research work.

- 12 -
Chapter 2
Spread Spectrum Communication,
Adaptive Thresholding CFAR Detection,
and Smart Antenna
2.1 Introduction
2.2 Spread Spectrum
2.3 Code Division Multiple Access
2.4 PN Code Acquisitions for Direct Sequence Receiver
2.5 Adaptive Thresholding CFAR Detection
2.6 Smart Antenna System
Summary
In this chapter, we present the necessary theoretical background information for the
research topic under consideration. The major topics needed are spread spectrum
communications, adaptive thresholding CFAR detection and smart antenna. Hence,
we first give an overview on spread spectrum communication and code division
multiple access (CDMA). Then, PN code acquisition in direct sequence CDMA
receivers is discussed. The concepts of signal detection and adaptive thresholding
constant false alarm rate (CFAR) processing are then presented. We conclude the
chapter with a section on smart antennas.

- 13 -
2.1 Introduction
Wireless communication systems are one of the fast growing technologies and are
becoming increasingly important in many fields of our daily life. Wireless
communications rely on multiple access techniques to share the limited frequency
spectrum between users. Multiple access communications determine the way signals of
multiple senders share the spectrum with no or low interference, so the receivers are
able to distinguish the senders' signals. The most common used multiple access
techniques are: frequency division multiple access (FDMA), time division multiple
access (TDMA), and code division multiple access (CDMA).
In FDMA, the available frequency spectrum is divided into several disjoint
frequency bands which are assigned to each individual user as shown in Fig. 2-1(a). So,
all users can transmit simultaneously (i.e., at the same time) using these small
bandwidth channels. On the other hand, TDMA divides the transmission time into a
series of repeating fixed time intervals called frames which are composed of a number
of time slots as shown in Fig. 2-1(b). Each slot is assigned to one user, so he/she is
allowed to either transmit or receive in this time period of the frame. The users transmit
sequentially using all the available bandwidth. In FDMA/TDMA, each user is supplied
with certain resource, frequency/time slot, which is disjoint from those of any other
user. A completely different approach is CDMA which does not require allocation of
disjoint frequency or time resources to each user. Instead the system allocates all
resources to all users as shown in Fig. 2-1(c). Unique channels are created by assigning
each user a unique code sequence that is uncorrelated with other users' codes. [39-40]

- 14 -
Fig. 2-1: The multiple access techniques: (a) FDMA, (b) TDMA, and (c) CDMA.
CDMA is the most popular modulation technique in spread spectrum wireless
communications.
2.2 Spread Spectrum
Over the years, with the development of mobile phones, spread spectrum
communication has become more and more popular. Spread spectrum systems have
been developed in the mid-1950’s for military communications. The primary purposes
of these systems were to:
- Hide the presence of the signal,
- Protect the signal from eavesdropping, and
- Provide a high resistance against strong intentional interferences (jamming).
Later it was realized that this technique provides powerful advantages, such as:
- Anti-interference,
- Multiple users access communications,
- High resolution ranging, and
- Accurate universal timing.
- 15 -
This benefits other civilian communication systems such the cellular mobile
communications, timing and positioning systems, and some specialized applications in
satellites. [39-40]
2.2.1 What is the Spread Spectrum?
In [40] spread spectrum communication is defined as: “Spread spectrum is a means of
transmission in which the signal occupies a bandwidth in excess of the minimum
necessary to send the information; the band spread is accomplished by means of a code
which is independent of the data, and a synchronized reception with the code at the
receiver is used for despreading and subsequent data recovery”. From this definition we
see that the spreading operation over a large bandwidth is done by using an independent
code sequence (called PN code sequence). The resulting wideband signal will be hard to
jam since it occupies a large band of frequencies embedded in noise as compared to
narrowband signals; in addition it will be hard to detect its presence. To despread the
received signal, the receiver needs to use a synchronized version of the PN code
sequence. Fig. 2-2 shows a block diagram of the spread spectrum communication
system. [41-42]
Fig. 2-2: Spread spectrum system.

- 16 -
2.2.2 Pseudo Noise Code Sequences
The PN code sequence or sometimes called pseudo random sequence is a noise-like (but
deterministic) signal that is used for bandwidth spreading. It is a sequence of 1's and 0's
called chips with a chip rate higher than the data signal's bit rate. This code sequence is
generated satisfying the following properties [42-43]:
(i) It is a periodic signal known to the transmitter and the receiver.
(ii) Its autocorrelation function has properties similar to the white noise
signal, it has sharp autocorrelation peak (for that it is named pseudo
noise). This property will help in the synchronization process.
(iii) It should be balanced, that is the difference between the number of 's
and 's in each period should be at most one. With poor balance
property, spikes will be seen in the spectrum so the signal will be easily
detectable.
Using this code sequence for spreading, the baseband narrowband signal becomes
wideband and appears noise-like. There are many types of the PN code sequence, for
example: m-sequence code, Gold code, and Hadamard-Walsh code. But it is important
to select the appropriate code because the type and length of the PN code sequence set
the bounds on the communication system capability [43].
2.2.3 Types of Spread Spectrum
Many spread spectrum technologies are currently available, the direct sequence (DS)
spread spectrum and the frequency hopping (FH) spread spectrum are the most
commonly used spread spectrum techniques. Both generate wideband signals controlled
by the PN code sequences. But they differ in the way of employing those codes in the

- 17 -
spreading operation and how the resulted spreading signals occupy the large frequency
band. In the following, a description of those types of spread spectrum is given.
Direct Sequence Spread Spectrum
DS spread spectrum communication is the most used modulation technique due its ease
of implementation. The narrowband data signal is spread by multiplying it directly with
the PN code sequence and transmitted after being modulated. Since the chip rate is
higher than the data bit rate, the signal will gain a large bandwidth as shown in Fig. 2-3.
If the total signal power is interpreted as the area under the spectral density curve, we
observe that spreading the narrowband signal over a wide bandwidth the signal's power
level (the power spectral density) is reduced and becomes embedded in noise [41- 42].
Fig. 2-3: Direct sequence spreading operation.
The transmitted DS spreading signal occupies the entire large frequency band
continuously and its carrier stays at a fixed frequency. At the receiver, the local PN
code sequence is multiplied with the received wideband signal to despread the received
signal and obtain the original narrowband signal. On the other hand, if for example there

- 18 -
is an interfering jamming signal, the multiplication with the PN code will spread it.
Consequently, the impact the jammer is greatly reduced as shown in Fig. 2-4. This is
one of the main reasons spread spectrum communication is less vulnerable to
interferences [42].
Fig. 2-4: Direct sequence despreading operation [website].
Frequency Hopping Spread Spectrum
In FH spread spectrum, the spreading over a wide bandwidth is not achieved by
widening the total signal power of the narrowband signal as in direct sequence, but it is
achieved instead by hopping from frequency to another frequency at regular time
intervals within the large frequency band as shown in Fig. 2-5. The PN code sequence,
in this case, is used to shift the carrier frequency of the narrowband signal in a pseudo
random manner [42]. At the receiver, the synchronized PN code sequence is used to
determine the different carrier frequencies at the different time intervals. The FH spread
spectrum avoids the location of a jamming signal by hopping in short times between a
large set of frequencies. FH does not have the same degree of jamming resistance as DS
spread spectrum. When there is a jamming signal in a frequency to which the signal will
hop to it, a collision will occur and the data will be lost [41].

- 19 -
Fig. 2-5: Frequency hopping spread spectrum [website].
2.3 Code Division Multiple Access
In direct sequence code division multiple access (DS-CDMA) each user will spread his
signal by using a different PN code which is (approximately) orthogonal to the PN
codes of all other users. Therefore, the receiver needs to perform a correlation operation
to detect the signal addressed to a given user. The other users' signals will appear as
noise due to the low cross-correlation property as shown in Fig. 2-6.
Fig. 2-6: DS-CDMA.

- 20 -
In frequency hopping code division multiple access (FH-CDMA), each user will
select one of available frequencies within the wide band channel as a carrier frequency.
The pseudorandom changes of the carrier frequencies randomize the occupancy of a
specific band at any given time, thereby allowing for multiple access over a wide range
of frequencies [39].
The focus will be on DS-CDMA, which is the communication scheme considered
in this thesis, and also it is the most popular scheme in spread spectrum communication.
DS-CDMA Transmitter
A functional block diagram of the DS-CDMA transmitter is shown in Fig. 2.7
.
Fig. 2-7: DS-CDMA transmitter.
The transmitted signal with a data bit rate is first multiplied with
the sender's PN code sequence that has a chip rate which is an
integer multiple of . The effect of multiplication is to spread the baseband bandwidth
of over a large bandwidth . After the spreading process, a
PSK (phase shift keying) modulation is performed on the resulted baseband signal to
transmit a bandpass signal with a pseudorandom phase shift. BPSK (binary PSK) and
- 21 -
the QPSK (quadrature PSK) are commonly used for PSK modulation in practical
systems [43].
DS-CDMA Receiver
To retrieve the data signal , the receiver will perform despreading and
demodulation operations on the received spreading signal. These operations require a
synchronized local PN code sequence (for the despreading operation) and a
synchronized carrier (for the PSK demodulation operation). Therefore, a
synchronization process must be done before and during these two operations.
The need synchronization process is a result of an initial timing and frequency
uncertainty between the transmitter and the receiver for the following reasons [8]:
1. Uncertainty in the range between the transmitter and the receiver, which
translates into uncertainty in the amount of propagation delay.
2. Relative clock instabilities between the transmitter and the receiver, which
results in phase differences between the transmitter and the receiver spreading
signals.
3. Uncertainty of the receiver’s relative velocity with respect to the transmitter,
which translates into uncertainty in a Doppler frequency offset value of the
incoming signal.
4. Relative oscillator instabilities between the transmitter and the receiver, which
results in frequency offset between the incoming PN sequence and the locally
generated sequence.
There are two models for DS-CDMA receivers according to the placement of the
PSK demodulation relative to the despreading process. In the non-coherent receiver, the

- 22 -
despreading of the received signal is performed prior to the PSK demodulation as
shown in Fig. 2-8.
Fig. 2-8: Non-coherent DS-CDMA receiver.
When the despreading process is performed after the PSK demodulation as shown
in Fig. 2-9, the receiver is called a coherent (or synchronous) receiver.
Fig. 2-9: Coherent DS-CDMA receiver.
2.4 PN Code Acquisition for Direct Sequence Receiver
In spread spectrum communications, the locally generated PN code sequence at receiver
must be synchronized with the received PN code sequence to be able to despread the
received signal and detect it. Synchronization must be within a small fraction of chip
duration. Otherwise, due to the orthogonality principle, insufficient signal energy will

- 23 -
reach the receiver data demodulator. Typically, the process of synchronization is
performed in two stages: first, the PN code acquisition stage, and then the PN code
tracking stage. The PN code acquisition is a process of bringing the two PN codes into
coarse time alignment to within a fraction of the chip duration. Once the acquisition
process is achieved, the PN code tracking process is initiated which aims to reducing the
synchronization errors to an acceptable limit for maintaining the two PN codes in fine
synchronism [39, 44].
The PN code acquisition process may be viewed as an attempt to synchronize the
receiver clock to the transmitter clock. Even though extremely accurate clocks are used
in spread spectrum communication systems to reduce the time uncertainty between the
receiver clock and the transmitter clock, the propagation delay in the transmitted signal
through the channel and the propagation effects such as multipath produce uncertainty
at the receiver about the timing (phase) of the received PN code sequence. This time
uncertainty region which is a region of all possible phases of the received PN code
sequence is typically divided into a finite number of cells, where each cell corresponds
to a different phase delay and the receiver must determine which one of the cells is the
phase of the received PN code sequence. So in the initial synchronization (acquisition)
stage, the receiver searches through those potential code phases, each phase is evaluated
or tested by attempting to despread the received signal. If this tested code phase is
correct (i.e. synchronized code phase), despreading of the received signal will occur and
thus it will be detected. Otherwise, in case of incorrect phase, the received signal will
not be despread [39].
The acquisition process can be modeled as a binary hypothesis problem. When
synchronization is achieved we have hypothesis ; otherwise, we have the null

- 24 -
hypothesis in the tested code phase. For the tested code phase in the PN code
acquisition process, the receiver must make a decision based on some criterion in favor
of hypothesis or hypothesis . Detection consists of deciding in favor of the
hypothesis when the tested code phase is truly the synchronized code phase. Also,
deciding in favor of hypothesis when the tested code phase is truly in non-
synchronization situation is a correct rejection. When the receiver makes a decision in
favor of hypothesis , while actually is true, it is called a false alarm. Deciding in
favor of hypothesis when is true is called miss. The probability of the first wrong
decision called the probability of false alarm while the probability of the second
wrong decision called the probability of miss . This terminology is borrowed from
the radar nomenclature [8].
There are several search strategies that can be selected to scan the cells (code
phases) in the uncertainty region for PN code acquisition. The received and local PN
code signals are first multiplied to produce a measure of the correlation between these
two codes. This measure can be obtained by using an active correlator or a passive
matched filter. In the active correlator, the received PN code signal is multiplied with a
continuously running local generated PN code signal and then integrated over a time
interval often called the dwell time to get the correlation measure. In the passive
matched filter, the received PN code signal is convolved with a fixed local PN code
signal. In this configuration, the input continuously slides past the stationary (not
running in time) local PN code until the two are in synchronism. The obtained
correlation measure is then passed to a suitable detector/decision rule to decide whether
the two codes are synchronized or not for the tested code phase. The differences
between the various PN code acquisition schemes depend on the type of detector
(decision strategy) used, and the adopted search strategy which acts on the detector

- 25 -
outputs to make the final decision. Consequently, PN code acquisition schemes can be
classified in different ways based on the detectors and the search strategies. The most
commonly used detector for acquisition in DS-CDMA communication receivers is the
noncoherent detector in which the despreading operation is performed before the carrier
phase synchronization [44].
The time it takes to test a cell for synchronization is called the dwell time and is
approximately equal to the length of the integration time interval in the active correlator.
PN acquisition is achieved by single dwell or multiple dwell detectors. This
classification is based on whether the acceptance of the tested code phase cell as a
synchronized code phase can be made based on a single test (single dwell) or
verification tests must occur before a decision about synchronization is made (multiple
dwell). Depending upon the duration of the dwell time interval relative to the PN code
period, the single dwell time detector can be further classified according to whether they
utilize partial period code (PPC) or full period code (FPC) correlation. In multiple
dwell detectors, the detection of a synchronized code phase cell in the first test
(searching mode) must be followed by multiple tests (verification mode) to make the
final decision about synchronization. The dwell time of the first test is usually much
shorter than the dwell times of verification tests in order to avoid spending a long time
on the rejection of non-synchronized code phase cells. The multiple dwell detectors
differ from one another in the strategies for verification. The verification mode can
employ immediate-rejection logic or non-immediate-rejection logic. In the immediate-
rejection case, the tested cell is immediately rejected as a non-synchronized code phase
cell as soon as a single test in the verification mode tests is failed. The non-immediate-
rejection case uses a majority logic type of decision on the total set of verification mode
tests [3, 44-45].
- 26 -
The adopted criterion for testing cells for synchronization decision can be a factor
that distinguishes one detector from another. Classical approaches using fixed
thresholds may be Bayes criterion, Neyman-Pearson criterion, or some other criterion
[8, 44] which are sensitive to noise power changes and to the number of interferences
and multipath leading to excessive false alarm rates. A suboptimum approach using
adaptive thresholding based on constant false alarm rate (CFAR) computes an adaptive
threshold based on the maximum likelihood estimation of the noise power in the test
cell obtained from the neighboring cells in the reference window while maintaining the
probability of false alarm constant [8]. The concepts of adaptive thresholding CFAR
detection will be explained in the next section.
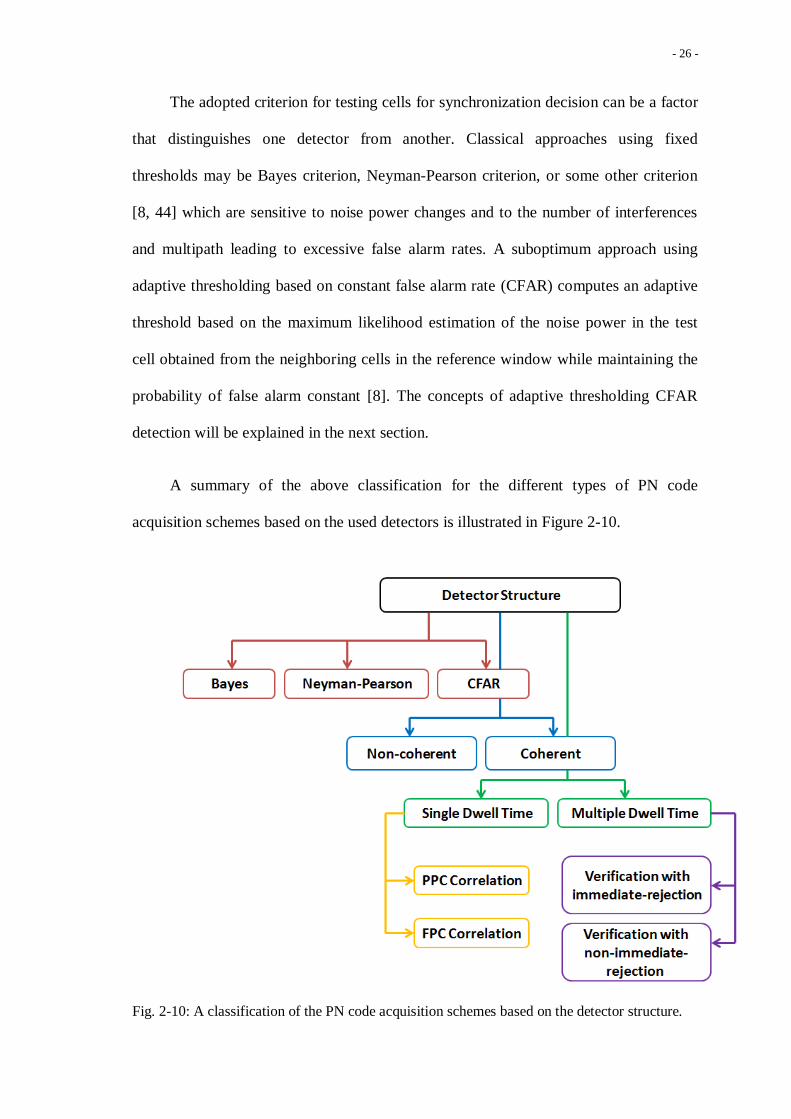
A summary of the above classification for the different types of PN code
acquisition schemes based on the used detectors is illustrated in Figure 2-10.
Fig. 2-10: A classification of the PN code acquisition schemes based on the detector structure.

- 27 -
The PN code acquisition searching procedure can be classified into three methods;
namely, the serial search methods, the parallel search methods, and the hybrid search
methods. The serial search means stepping through the uncertainty region serially; one
uncertainty phase is tested at a time. The advantage of this search method is the
hardware simplicity, but in the case of a long PN sequence it has a long acquisition
time. In contrast, the parallel search method tests all the uncertainty phases
simultaneously. This search method has a fast acquisition time, but for a long PN
sequence the hardware complexity increases dramatically and that is why it is
impractical. As a trade-off between the acquisition time and the hardware complexity,
the hybrid search scheme has been proposed which combines the parallel search with
the serial search in order to cover the whole uncertainty region [2, 7].
2.5 Adaptive Thresholding CFAR Detection
PN code acquisition with a fixed threshold value is unable to adapt to the varying
mobile communications environment and may result in a high false alarm rate and/or
low detection probability. Thus, adaptive thresholding CFAR detection has proved its
robustness in mobile communications environments. The concepts of CFAR processing
are well developed in the field of radar signal detection.
2.5.1 Adaptive CFAR Detection
One of the main goals in radar signal detection systems is to detect the presence of a
target within the area of observation. The received signal is compared to a threshold
value and a target is declared present whenever the signal exceeds the threshold. The
optimal Neyman-Pearson detector requires a complete statistical description of the
received signals and noise. This information may not be available a priori and the
statistics of the received signal may not be stationary (varying with time) [8].

- 28 -
In real radar applications, the problem is to detect targets embedded in noise and
clutter. Clutter is a term applied to any undesired signal to the radar user. The received
signal is usually statistically nonstationary with an unknown variance due changes in the
environment. Consequently, using the optimal Neyman-Pearson detector with a fixed
threshold is no longer valid because it is an extremely sensitive to the total noise
(thermal noise plus clutter) variance. In fact, a small increase in the total noise power
from the design value results in a corresponding increase of several orders of magnitude
in the probability of false alarm. This is illustrated in Fig. 2-11, for a design probability
of false alarm of 10−6
, an increase of only 3 dB in the noise power causes the actual
probability of false alarm to increase by more than 1000, which is intolerable for data
processing, either by a computer or by a human operator. Thus, adaptive thresholding
processing is needed to maintain a constant false alarm rate (CFAR) [8].
Fig. 2-11: Effect of the noise power increase on the probability
of false alarm for a fixed threshold [8].
Finn and Johnson [10] proposed the cell averaging CFAR (CA-CFAR) detector in
which an estimate of the noise environment is obtained from the arithmetic mean of the

- 29 -
output of the reference cells. The reference window consists of reference cells
surrounding the cell under test (CUT), which is generally assumed to be the cell in the
middle of the reference cells. Some adjacent cells to the CUT, called guard cells, are
ignored from the noise estimate in order to avoid any signal energy spill from the CUT
into these adjacent cells which may affect the total noise power estimation. cells
form a lagging window and the other cells form a leading window. Two statistics
and are obtained from the sum of the contents of the leading and the lagging
windows respectively. Then and are combined to obtain the estimate of the
background noise power level as shown in Fig. 2-12. The statistic is then multiplied
by a scaling factor , called the threshold multiplier, to obtain the adaptive threshold for
the design probability of false alarm. Normally, the threshold multipliers are computed
tabulated in a look-up table for the desired probability of false alarm. Then the CUT is
compared with the adaptive threshold to make the decision whether a target is present or
not. The performance of the CA-CFAR detector is optimum in a homogeneous
environment that is when the noise samples of the reference cells are independent and
identically distributed. As the number of reference cells increases, the detection
performance of the CA-CFAR approaches that of the classical Neyman-Pearson
detector which is optimal when the noise power is known [8, 10].
Fig. 2-12: Cell averaging CFAR [8].

- 30 -
In non-homogeneous environments, presence of clutter edge and/or presence of
interfering targets, the performance of the CA-CFAR detector is seriously degraded.
Clutter edge describes a situation where there is an abrupt transition in clutter power
distribution within the reference window, while interfering targets describe a situation
where there are interfering targets within the reference window. In this case, robust
algorithms are needed to estimate the total noise power from the cells surrounding the
CUT.
Clutter Edge model
It is assumed in this case that the total noise power as a function of range can be
represented by step functions as shown in Fig. 2-13 and Fig. 2-14.
Fig. 2-13: Model of a clutter edge where test cell in clear [8].
Fig. 2-14: Model of a clutter edge where test cell in clutter [8].
- 31 -
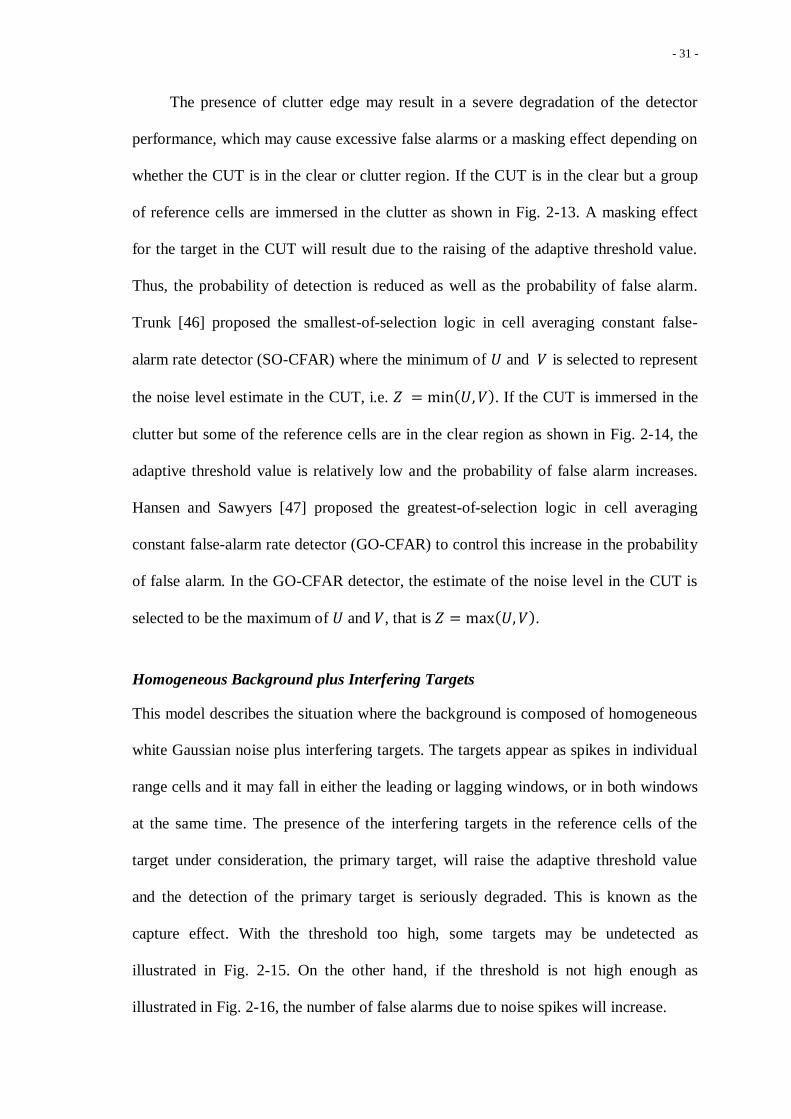
The presence of clutter edge may result in a severe degradation of the detector
performance, which may cause excessive false alarms or a masking effect depending on
whether the CUT is in the clear or clutter region. If the CUT is in the clear but a group
of reference cells are immersed in the clutter as shown in Fig. 2-13. A masking effect
for the target in the CUT will result due to the raising of the adaptive threshold value.
Thus, the probability of detection is reduced as well as the probability of false alarm.
Trunk [46] proposed the smallest-of-selection logic in cell averaging constant false-
alarm rate detector (SO-CFAR) where the minimum of and is selected to represent
the noise level estimate in the CUT, i.e. . If the CUT is immersed in the
clutter but some of the reference cells are in the clear region as shown in Fig. 2-14, the
adaptive threshold value is relatively low and the probability of false alarm increases.
Hansen and Sawyers [47] proposed the greatest-of-selection logic in cell averaging
constant false-alarm rate detector (GO-CFAR) to control this increase in the probability
of false alarm. In the GO-CFAR detector, the estimate of the noise level in the CUT is
selected to be the maximum of and , that is .
Homogeneous Background plus Interfering Targets
This model describes the situation where the background is composed of homogeneous
white Gaussian noise plus interfering targets. The targets appear as spikes in individual
range cells and it may fall in either the leading or lagging windows, or in both windows
at the same time. The presence of the interfering targets in the reference cells of the
target under consideration, the primary target, will raise the adaptive threshold value
and the detection of the primary target is seriously degraded. This is known as the
capture effect. With the threshold too high, some targets may be undetected as
illustrated in Fig. 2-15. On the other hand, if the threshold is not high enough as
illustrated in Fig. 2-16, the number of false alarms due to noise spikes will increase.

- 32 -
Fig. 2-15: Threshold too high [8].
Fig. 2-16: Threshold not high enough [8].
To alleviate such problems, many CFAR detectors have been proposed in the
literature [11-23]. The CMLD-CFAR, the TM-CFAR, and the OS-CFAR detectors have
been stated in Chapter 1 are all examples of CFAR processing for this model.

- 33 -
Clutter Edge and Spikes
This model describes a situation where there is a transition in the clutter power
distribution and interfering targets are presence in the reference window as illustrated in
Fig. 2-17.
Fig. 2-17: The clutter edge and spikes model [8].
When both interfering targets and clutter edge are present in the reference
window of the CUT, Himonas and Barkat [17] have proposed the generalized two-level
censored mean level detector (GTL-CMLD) which uses an automatic censoring
algorithm of the unwanted samples in order to compute the appropriate adaptive
threshold level.
Non-Gaussian Noise
This model describes the situation that certain types of clutters are represented by non-
Gaussian distributions, such as sea clutter, land clutter, and weather clutter. The log-
normal, Weibull, and gamma distributions have been used to represent envelope-
detected non-Gaussian clutter distributions.

- 34 -
2.5.2 Adaptive CFAR thresholding for the PN code acquisition
For adaptive PN acquisition in CDMA communication systems, the correlator outputs
are sent serially into a shift register of length 1cN . The first register represents the
CUT which contains the correlator output of the current examined phase while the cN
registers represent the cells of reference window containing the outputs of the previous
cN phases. The contents of the reference cells are used to get a statistic to represent the
power-level estimate of the background noise, which is then multiplied by a constant
scale factor to achieve the desired probability of false alarm as shown Fig. 2-18 [8].
Fig. 2-18: Adaptive PN code acquisition detector
2.6 Smart Antenna Systems
The technology of smart antennas for mobile communications has received enormous
interest worldwide during the last few years. It might seem that smart antenna is a new
technology; but in fact, the fundamental principles upon which it is based have been
applied in defense related systems since World War II. As a result of the emergence of
powerful low cost digital signal processors, general purpose processors and application
- 35 -
specific integrated circuits (ASICs), as well as innovative software based signal
processing algorithms; smart antennas have become practical for commercial use [48-
49].
2.6.1 What is the Smart Antenna System?
A smart antenna system is an array of antenna elements with a digital signal processing
(DSP) unit that automatically optimizes its radiation or/and reception pattern in
response to its signal environment in order to emphasize signals of interest and to
minimize interfering signals. Having an adaptive pattern is the property that
distinguishes smart antennas from the fixed antennas which have a fixed pattern.
Using a fixed antenna in base stations has some disadvantages; most of the base
station's power is wasted in radiation in other directions than toward the intended user.
Also, this radiated power in the other directions will be considered as interference by
other users. Smart antennas exploit the idea that interferers rarely have the same
geographical location as the user. So, by maximizing the antenna gain in the desired
direction and simultaneously placing minimal radiation pattern in the directions of the
interferers, the quality of the communication link can be significantly improved. Using
smart antennas will lead to a much more efficient use of the power and spectrum,
increasing the useful received power as well as reducing interference [48, 50].
To easily understand the functionality of a smart antenna system, an example from
the reality is given. There is a similarity between the idea of a smart antenna system and
the human auditory system. Let us imagine some people carrying on a conversation and
there is a blind person. We will find this person has the capability of determining the
location of the speaker as he moves. This is because the voice of the speaker arrives at

- 36 -
each ear at a different time, so the brain can compute the direction of the speaker from
the time differences or delays received by the two ears. Afterwards, the brain adds the
strength of the voice signals from each ear, so as to focus on the sound of the computed
direction. Moreover, if there are many people talking simultaneously, the brain has the
ability to enhance the received signal from the speaker of interest and attenuate
unwanted interferers so the person can concentrate on one conversation at a time as
shown in Fig. 2-19. By using antennas instead of the ears and a digital signal processor
instead of the brain, the smart antenna system works in the same way [51].
Fig. 2-19: Human auditory function [51].
2.6.2 Architecture of the Smart Antenna System
In this section, we give an overview of the architecture of a smart antenna system for
reception and transmission of signals as shown in Fig. 2-20. It consist of multiple
antenna elements, a DSP unit, which can be divide into a beamforming network and a
signal processing unit, and a radio unit. The array of antennas consists of antenna
elements. The antenna in the telecommunication systems can be defined as the device
through which, in the receiving mode, radio frequency (RF) energy is coupled from the
outside world to the receiver and from transmitter to the outside world in the
transmission mode. These antenna elements can be arranged in various physical

- 37 -
arrangements such as linear, circular, and rectangular. The radio unit consists of down-
conversion chains and an analog-to-digital (A/D) conversion unit following each
antenna element [51].
Fig. 2-20: Reception part of the smart antenna system [51].
The received signal at the different antenna elements is down-converted to
baseband and digitized. It is multiplied with complex weights which adjust its phase
or/and its amplitude and then all weighted signals are combined as a one input to the
remaining part of the receiver. The optimum weights are computed by the signal
processing unit which applies an adaptive beamforming algorithm, which will be
explained in the next section. These optimum weights will determine the optimum
antenna pattern in the uplink direction [51].
The transmission part of a smart antenna system is similar to the reception part as
shown in the Fig. 2-21. The radio unit consists of a digital-to-analog (D/A) converter
and the up-converter chains for each antenna elements. In the beamforming network, the
signal is weighted by the complex weights after it has been split into branches. These

- 38 -
weights are computed by the signal-processing unit to form the optimum radiation
pattern in the downlink direction [51].
Fig. 2-21: Transmission part of a smart antenna.
2.6.3 Adaptive Beamforming Algorithms
Adaptive beamforming algorithms provide smart antenna systems with the unique
ability to alter the radiation and reception pattern characteristics (main beam direction,
nulls, sidelobe level, and beamwidth). They calculate the weights for each antenna
element of the array in order to optimize some properties of the received signal. Many
algorithms include optimization procedures based upon certain criteria. The most
popular optimization criteria are: (1) maximum signal-to-interference plus- noise ratio
(SINR) and (2) squared function based criteria such as mean square error (MSE), (3)
minimum variance (MV), and (4) maximum likelihood (ML) [51-52].
There are two main strategies for the adaptive beamforming algorithms. The first
strategy is based on the assumption that part of the desired signal is already known
through the use of a training sequence. By comparing the known signal with the
- 39 -
received signal, the weights are adjusted to optimize the selected criteria such as
minimization of the MSE between the known and the received signals. This way, the
beam pattern can be adjusted to null the interferers. This approach optimizes the signal-
to-interference ratio (SIR), and is applicable to non-line-of-sight (NLOS) environments.
Since the weights are updated according to the incoming signals, not only the
interference is reduced but the multipath fading is also mitigated. In the second strategy
there is no need for the training sequence, it is based on identifying the direction of
arrival (DOA) of the received signals firstly by using one of the DOA estimation
methods such MUSIC (MUltiple SIgnal Classification) and ESPRIT (Estimation of
Signal Parameters via Rotational Invariant Techniques) among many others. The
beamforming process is done by adjusting the weights to direct the main beam toward
the desired user and nulls toward interfering signals. In practical scenarios such as
NLOS environments, where there are many local scatterers close to the users and the
base station, this strategy may turn out to be deficient because there are too many DOAs
due to multipath, and the algorithms are more likely to fail in properly detecting them
[51].
2.6.4 Types of the Smart Antenna Systems
Smart antenna systems can be classified into two main categories based on how they
produce their beam pattern; switched beam as shown in Fig. 2-22 (a) or adaptive array
as shown in Fig. 2-22 (b).

- 40 -
Fig. 2-22: Coverage pattern: (a) switched beam, (b) adaptive array [50].
Switched Beam System
The switched beam system is the simplest smart antenna system. Multiple fixed beams
are formed by a beamforming network then the beam giving the strongest received
signal is selected. Such type of smart antenna system detects the signal strength,
chooses from one of the available beams, and as the user moves it switches from one
beam to another as shown in Fig. 2-23. The overall goal of this system is to increase the
gain according to the location of the user [49, 51].
Fig. 2-23: Switched beam smart antenna system [51].
In terms of radiation patterns, the switched beam system is an extension of the
current cellular sectorization method as each macro-sector is further subdivides into
several micro-sectors. Each micro-sector contains a predetermined fixed beam pattern

- 41 -
with the greatest sensitivity located in the center of the beam and less sensitivity
elsewhere [50].
Adaptive Array System
The adaptive array system is the most advanced smart antenna systems. This type of
smart antenna systems continuously adjusts and changes its beam pattern to enhance the
reception of the desired signal while minimizing interference through using signal
processing algorithms. It directs the main beam toward the pilot signal and the signal of
interest (SOI), while the side lobes and the nulls of the beam pattern are placed in the
direction of the interferers or signals not of interest (SNOIs). The beam can be steered
toward a desired direction by applying phase weighting on the outputs of the array
elements and can be shaped by amplitude and phase weighting [49, 51].
In general both systems direct the beam (main lobe) toward the direction of the
desired signal and attempt to minimize and reject the interference signals, but the
adaptive array system does that in an efficient manner. Since the beams are fixed and
predetermined in the switched beam system, the strength of the desired signal varies as
the user moves through the active beam. The signal strength can degrade rapidly as the
user moves towards the far azimuth edges of a beam. The switched beam system is not
only unable to direct the maximum of the main lobe toward the desired signal, but it
also shows inability to fully reject interference signals and distinguish between the
desired signal and interfering ones as shown in see Fig. 2-24. It suppresses interference
arriving from directions away from the active beam. But if the interfering signal is at
approximately the center of the active beam and the user is away from the center of the
beam, the interfering signal will be enhanced far more than the desired signal so the
quality for the signal is degraded. On the other hand, the adaptive array system has the
ability to control the overall beam pattern and for that it offers substantial performance

- 42 -
advantages over the passive switched beam system. As mentioned previously, this
system has the ability to locate and track users and interferences signals and
dynamically adjust the antenna beam pattern to enhance reception while minimizing
interferences. As shown in Fig. 2-24, it chooses a more accurate placement, thus
providing greater signal enhancement [49, 51].
Fig. 2-24: Switched beam and adaptive array beams in the presence of interference signals [51].
Both types of smart antenna systems provide significant gains over conventional
sectorized systems in the low interference environment. However in the environment
with a significant level of interference, the interference rejection capability of the
adaptive array system provides significantly more coverage than either the conventional
or switched beam systems, see Fig. 2-25 [51].
Fig. 2-25: Switched beam and adaptive array coverage in low/significant interference environment [51].

- 43 -
2.6.5 The Advantages of the Smart Antenna Systems
The main impediments to high performance wireless communications are the
interference from other users (co-channel interference), and the multipath signals that
cause the inter-symbol interference (ISI) and signal fading. As explained earlier, smart
antenna exploits the idea that the desired signal and multipath and interference signals
typically arrive at the receiver from different directions. So by directing the radiation
pattern toward the desired users and trying to placing nulls in the directions of all
unwanted interference, the useful received signal level will be increased and the
interference level will be lowered which leads to increasing the SIR. Also by using
multiple antennas, more signal energy will be captured which can be combined to
improve the signal-to-noise ratio (SNR) [49, 53].
The introduction of smart antenna in wireless communication has a large impact
on the performance of these communication systems. In the following some of the
benefits that will be gained from employing smart antenna in wireless communication:
- Reducing Multipath Effects: by focusing the beam on the intended user, the ISI
effect due to the multipath propagation is mitigated [51].
- Capacity Increase: In densely populated areas, the interference from other users
is the main source of noise in the communication system. These co-channel
interferences limit the wireless communication capacity, which is defined as the
number of users which can be serviced by the system. Since smart antenna can
reduce the co-channel interference, the system capacity will be increased [48,
53].
- Range Increase: In rural and sparsely populated areas, an increase of the range
of coverage by a base station is an important issue. Since smart antenna is more

- 44 -
directive than traditional sector or omnidirectional antennas, increasing the range
is possible [48].
- Security: another added benefit for the directivity feature of a smart antenna is
the security. Using a smart antenna makes it more difficult to tap a connection.
Because to successfully tap a connection the intruder must be positioned in the
same direction as the user as seen from the base station [48].
- Others Services: also due to the spatial directivity feature of smart antennas, it
becomes possible to have access to spatial information about the users. This
information can be used to estimate the positions of the users which will help in
services such as emergency calls and location specific billing [48].

- 45 -
Chapter 3
Communication System Model
and Analysis
3.1 Introduction
3.2 Communication System Model
3.3 System Analysis
3.4 Results and Discussions
Summary
In this chapter, we describe the proposed wireless communication system which
was first introduced by Sofwan and Barkat in [1], and which adopts smart antenna
and adaptive thresholding CFAR detection. The CMLD-CFAR processor is
considered for CDMA PN acquisition. We derive closed form mathematical
expressions for the probability of false alarm, the probability of detection, and the
mean acquisition time. The performance of the considered wideband
communication system is investigated and analyzed. Simulation results show that
the system under consideration is robust in a real multipath environment.

- 46 -
3.1 Introduction
In [1], Sofwan and Barkat proposed a novel idea of using smart antennas and adaptive
thresholding CFAR detection for PN acquisition in wireless DS-CDMA communication
systems in a slowly fading multipath and multiple access interference channel
environment. They considered the trimmed mean constant false alarm rate (TM-CFAR)
detector for PN acquisition. In [35] a system utilizing an LMS algorithm for adaptive
beamforming and a fixed threshold with smart antenna was proposed for wireless
communication. They showed that smart antenna shorten the acquisition time and
improve the detection probability as compared to a single antenna element. In [37],
Puska et al. considered an approach where the direction of arrival (DOA) estimation and
beamforming of the incoming signal are combined with a fixed threshold detector for
code acquisition in a spread spectrum communication system. They showed that the
mean acquisition time achieved by DOA estimation is shorter than that achieved by
fixed beamforming.
As mentioned earlier, in a real mobile communication environment with multipath
and multiple access interference, and due to variations in the received power caused by
the influence and mobility, adaptive CFAR thresholding techniques are preferred. [54]
suggested the use of a of an adaptive acquisition processor (AAP) for a known number
of interferers, which they called excision cells. The processor in [54] is actually the
CMLD proposed in [13]. Mathematical expressions for the probabilities of detection
and false alarm were given in [27].
In this thesis we consider the communication system with smart antennas
proposed in [1], but using instead a CMLD-CFAR adaptive thresholding processor. The
CMLD-CFAR detector proved to be robust in an environment with multiple interfering

- 47 -
signals [13-14]. In addition, it was shown in [1] that the performance of the proposed
communication system using the classical cell-averaging CFAR detection is equivalent
to the system proposed in [35] in the presence of multipath and multiple access
interference without resorting to robust order statistic CFAR detectors. In addition, [35]
did not consider multiple access interference. The channel model assumed is a Rayleigh
slowly fading multipath and multiple access interference communication channels.
Closed form expressions for the probability of false alarm, the probability of detection,
and the mean acquisition time are derived. Then the performance of the PN acquisition
is investigated and analyzed for different design parameters of the communication
system under consideration.
3.2 Communication System Model
The block diagram of the proposed PN acquisition system for wideband communication
is shown in Fig. 3-1. The system consists of a smart antenna with antenna elements;
each antenna element followed by a correlator that correlates the received PN code
sequence with the locally generated PN code sequence. The outputs of the M correlators
serve as inputs to the LMS processor to update the smart antenna's weight vector. After
getting the optimum weight vector, the spatial correlation outputs from the LMS are fed
into the CMLD-CFAR processor, which is a tapped delay line, to set the threshold
adaptively in order to make a final decision about whether there is acquisition or not.
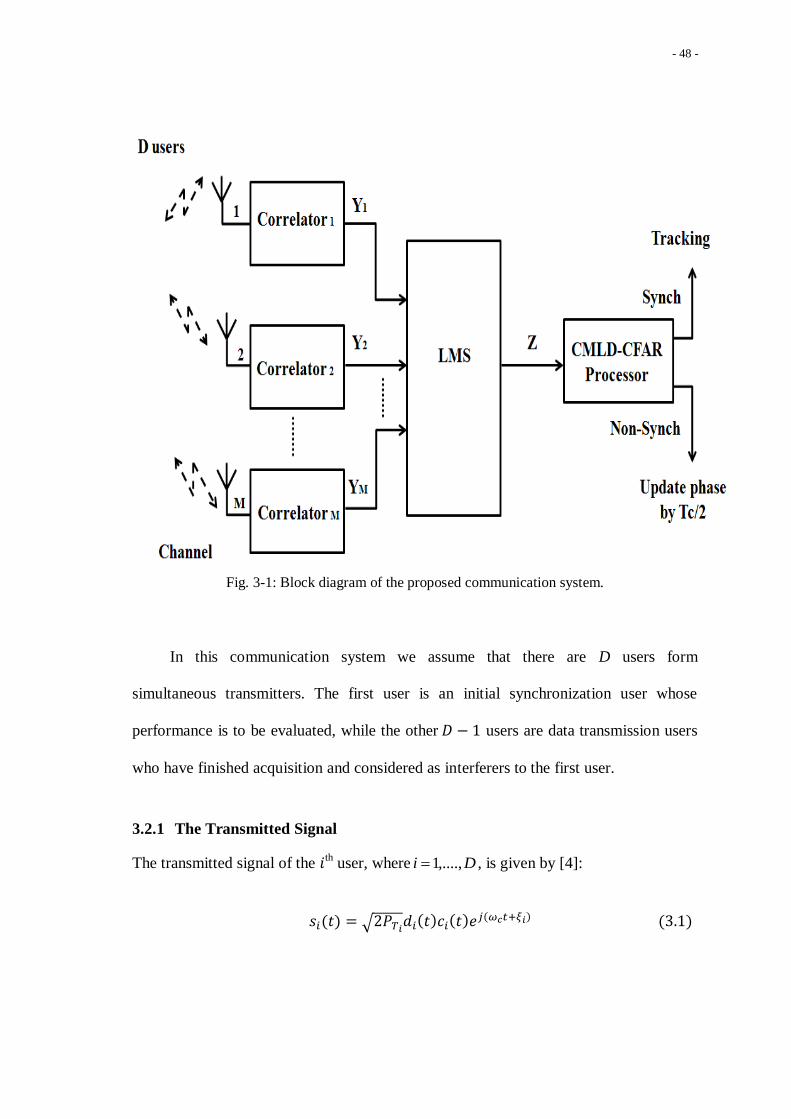
- 48 -
Fig. 3-1: Block diagram of the proposed communication system.
In this communication system we assume that there are D users form
simultaneous transmitters. The first user is an initial synchronization user whose
performance is to be evaluated, while the other users are data transmission users
who have finished acquisition and considered as interferers to the first user.
3.2.1 The Transmitted Signal
The transmitted signal of the th user, where Di ,....,1 , is given by [4]:

- 49 -
where is the transmitted power of the th
signal, is the data signal, is the PN
code spreading sequence, is the angular carrier frequency, and is the phase of the
th modulator from the transmitter. It is assumed that no data signal is sent during the
acquisition process (i.e. ).
3.2.2 The Communication Channel Model
The user signals are sent through a communication channel assumed to be a Rayleigh
slowly fading multipath channel. The communication channel model considered
consists of tapped delay lines that correspond to the number of resolvable multipath
with amplitude and phase 1,....,0 Ll , as shown in Fig. 3-2. are
independent and identically distributed (i. i. d.) Rayleigh random variables with a
probability density function (pdf) [1]:
Fig. 3-2: Tapped delay line model of the frequency-selective channel.
where
, and is the Rayleigh fading channel power. The phases
are independent and identically distributed random variables uniformly distributed
in . The fading amplitude is assumed to be constant during an observation
interval but changes from one interval to another independently.

- 50 -
3.2.3 The Antenna Array Elements
The receiving antenna array is a uniform linear array (ULA) antenna consists of
identical elements spaced apart, where and is the wavelength of the
carrier transmitted signal. Hence, the response vector of the antenna array to the first
user signal can be expressed as [51]:
where is the array vector of antenna, is the DOA angle of the desired signal,
and denotes transpose. The antenna considers a zero-beam spread angle model. LMS
is the adaptive array antenna algorithm which will be used to adapt iteratively its weight
vector to the array response vector. The vector array response is not a main concern in
this thesis.
3.2.4 The Received Signal
Taking into account the effect of multipath, the received signal for the mth
antenna
element of the array is given in (3.4) [55], where . It consists of the signal
from the first user, multiple access interferences from the others, and an AWGN .
is the received signal power of the first user during initial synchronization, is the
average received power of the interfering signal, is the relative time delay associated
with the asynchronous communication channel model, is

- 51 -
phase in the demodulator of the receiver which are independent and identically
distributed random variables uniformly distributed on the interval , and is the
chip duration.
3.2.5 The Correlator
The correlator for the PN code acquisition that follows the mth
antenna element in the
system is shown in Fig. 3-3. The received signal is first down-converted into in-phase (
I ) and quadrature phase ( Q ) components. These components are then multiplied by the
locally generated PN code cc NjjTtc ,...,1,0,)2/( ( cN represent the reference
window size), and integrated over dwell time interval cD RT seconds, where R is the
correlation length integer, to yield respectively the I and Q branch components
and , which are squared and summed to give the correlator output
,
. The output
will be a high correlation value when the current
delay of the local PN code (i.e. tested code phase) is a synchronized code phase cell
with which the local PN code sequence is aligned with any of the multipath signals of
the first user ( 1H hypothesis). Otherwise, it will be a negligible value due to the non-
alignment case ( 0H hypothesis).
Fig. 3-3: Correlator consists of in-phase (I) and quadrature-phase (Q) components.

- 52 -
Due the Gaussian nature of and
, and under the hypothesis for a
given , the will has a non-central Chi-square distribution with two degrees of
freedom. The pdf of can be written as [4, 8]:
where is the normalized non-central metric given by
, is the zeroth-
order modified Bessel function of the first kind, and is the variance which is given
by [4]:
represents the average received power of the interfering signal to the signal power of
the first user ratio and is defined as SI PP /β , while cS represents the chipSNR / and
is given by 0/ NPTS scc .
Under the hypothesis, the will has a non-central Chi-square distribution
with two degrees of freedom and its pdf is given as [4, 8]:
Since
, then after some
mathematical manipulations the pdf of the output under the aligned hypothesis is
given by [34]:

- 53 -
where
.
3.2.6 The Least Mean Square Processor
The outputs from the correlators are inputs to the LMS
processor as shown in the following figure.
Fig. 3-4: The LMS processor.
The LMS algorithm computes iteratively the optimum weight vector in order to
obtain a spatial correlation output that achieve the minimum MSE between the desired
value and the LMS processor output. The weighting of the LMS processor maximizes
the output by adapting the weights directly proportional to the step
size parameter. The step size is assumed to be for achieving convergence.
Moreover, the optimum weight is assumed to be achieved when the power of the
desired signal equals to . Thus, the value of the error signal that is used by the LMS
processor to adjust the weights adaptively in the iteration is
, where and are vectors of the correlator outputs and weights
respectively. The iterative procedure of LMS processor is given by [1]:

- 54 -
Once the minimum MSE is attained, then this weight vector is used to generate
the spatial correlation output . In the aligned hypothesis, it is assumed that the DOA of
the desired signal can be located optimally by the smart antenna and the pdf of the
under the aligned hypothesis is given as [1]:
While under the non-aligned hypothesis, it is assumed that the smart antenna
tracks in a different angle than the desired signal and the pdf of is given as [1]:
3.2.7 The CMLD-CFAR Processor
The outputs of the LMS processor are serially fed into a shift register of length
as shown in Fig. 3-5. The first register, denoted as , stores the current output of the
LMS processor. The following registers, denoted by are the
reference cells. First, are ranked in ascending order according to their magnitude
to form the ordered samples , where
represent the order statistics of the samples. Then the k largest ranked cells are
censored, where k is number of cells that result from the alignment of the first user
multipath signals, and the remaining ones are combined to yield an estimate of the
background noise level U.

- 55 -
Fig. 3-5: CMLD-CFAR processor.
After that the U value is scaled by the threshold multiplier T to achieve the
design false alarm probability. If 0Z is larger than the threshold TU , a PN code
acquisition is declared, and the tracking loop is triggered. Otherwise, the acquisition
scheme shifts the locally generated PN code phase and the search continue until a
correct PN code phase is found.
3.3 System Analysis
In this section, we derive closed form expressions for the probability of false alarm, the
probability of detection, and the mean acquisition time in order to study and analyze the
PN acquisition performance of the proposed system.

- 56 -
3.3.1 The Probability of False Alarm
As shown in Chapter 2, the probability of false alarm is the probability that a correlation
of a non-synchronized tested code phase pass the threshold value. It is given as:
where is the moment generation function (MGF) of the estimate and
The ordered samples , are not i.i.d. random variables even
when the original samples , are i.i.d. random variables. However,
since that the i.i.d. samples are exponentially distributed, the following
transformation to random variables results in independent quantities
[15]:
. .
. .
It is known that the pdf of order statistics of random variables ,…, is given
as [56]:
where is the cumulative distribution function. So the pdf of is:
In the case of an exponential distribution the distributions of , ,
are identical to the first order statistic of random variables ,
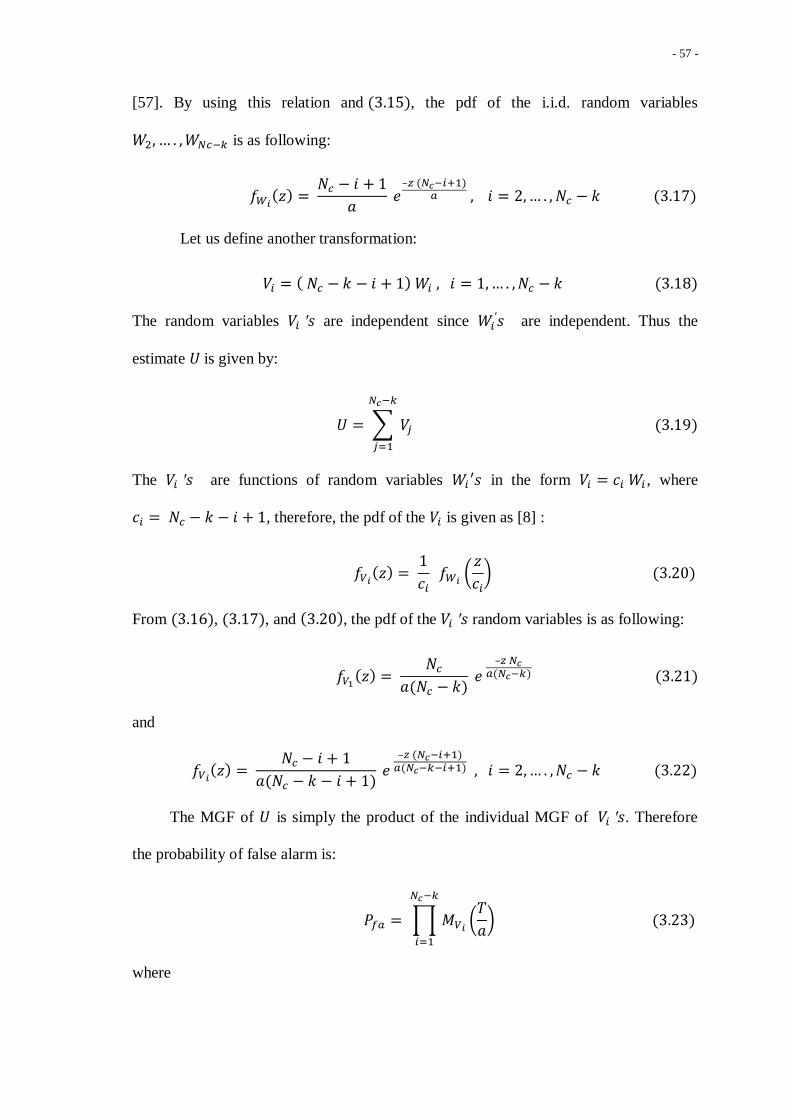
- 57 -
[57]. By using this relation and , the pdf of the i.i.d. random variables
is as following:
Let us define another transformation:
The random variables are independent since are independent. Thus the
estimate is given by:
The are functions of random variables in the form , where
, therefore, the pdf of the is given as [8] :
From , , and , the pdf of the random variables is as following:
and
The MGF of is simply the product of the individual MGF of . Therefore
the probability of false alarm is:
where

- 58 -
and
and
3.3.2 The Probability of Detection
The presence of the multipath signals with the synchronization signal of the first user
implies that there exist more than one possible synchronized code phase cells (offsets)
in the uncertainty region. The probability of detection of the high correlation value that
results of an alignment of the local PN code with any of the multipath signal under the
current tested code phase is given by:
where is the MGF of the estimate and
is deduced in the
same manner as and thus is given by:
where
and

- 59 -
3.3.3 The Mean Acquisition Time
The mean acquisition time is an important measure of the PN acquisition system
performance. The acquisition time is the amount of time that elapses prior to acquisition
i.e. locating the synchronization cell [3]. To derive the mean acquisition time ( ), the
signal flow graph technique or sometimes called the state transition diagram is
commonly used. In the following we will briefly introduce the state transition diagram
for modeling the serial search acquisition process, and then the mean acquisition time of
the proposed system is derived.
The serial search acquisition process can be modeled using the state transition
diagram which is composed of a number of states or nodes connected by branches as
shown in Fig. 3-6. The number of states used to model the process is a states,
where of these states represent the non-synchronization cells ( code phase
offsets) while one state (the th) is the collective state , thus any synchronization
cells ( code phase offsets) are included in this state. In addition to these states of
phase offsets, the remaining two states are: the False Alarm (FA) state which can be
reached from any of the states and the correct Acquisition (ACQ) state which just
can be directly reached from the th state. The states are sorted in a circular
arrangement with indices ( ) corresponding to the th offset code
position to the right of the correct synchronization position . [3]

- 60 -
Fig. 3-6: The circular state transition diagram.
The searching process can start at any one of the states, according to some a
priori distribution ( ) which reflects the designer's confidence about the
initial relative position of the codes. The branches are assigned gains or sometimes
called transfer functions which contain information about the delays that may occur
during the transition between two states as follows: is the gain of the branch
leading from the state to the ACQ state; is the gain of the branch connecting
with state or node while is the gain of the branch connecting any other two
successive nodes ( . The transition from state to state
can be performed without reaching the FA state when the examined state showed it is
a non-synchronization cell or the transition happened after first reaching the FA state
when the examined state ( cell) give a false high correlation value, then the process
passes from FA state to node to complete the searching process [3, 45].
After the serial search acquisition process has been modeled by the state transition
diagram, is derived from an expression of a generation or transfer function

- 61 -
that is obtained from the state transition diagram. For our system, we used the
following assumptions to derive :
A uniform prior distribution which means that each node has the same
probability for starting the search,
.
The processing time of the LMS and the CMLD-CFAR does not affect the
derivation of the mean acquisition time.
We have used as a value of advancing the step size. So, the number of
positions (cells of code phase offsets) to be tested is , where the
represent the total number of chips in the uncertainty region of seconds.
Therefore, will be equal to , where is the number of
synchronization cells (each resolvable path will contribute two synchronization
cells).
The transfer functions , and of the state transition diagram are
derived as follow:
The transition from state to state can happen directly without reaching the
FA state, this event will take a time equal to the dwell time interval with
probability , or the transition after accessing the FA state occurs with
probability . After the dwell time interval taken for a wrong decision, there is
a penalty time for accessing the FA state and returning back to the search mode.
We assume it is a constant time and equal to . Let denote a unit-delay
variable and let the power of denote the time delay, then the function
can be expressed as [3]:

- 62 -
The collective state will have synchronization cells, see Fig. 3-7. If
is the probability of detection of cell within the collective
state, the function is given by [45]:
or can be written as :
where
.
Fig. 3-7: The H1 state.
The function , which represents failure to recognize one of the
cells as a synchronization cell is given by [45]:

- 63 -
For the single dwell serial search acquisition process with a uniform prior
distribution, is given by [3]:
The mean acquisition time is computed to be [3]:
When there is only one absorbing state which is the ACQ state. will then be [3]:
Substituting Equations (3.31), (3.33) and (3.34) into (3.37), can be written as:
3.4 Results and Discussions
In this section we present the MATLAB simulation results obtained of the wireless
communication system considered in a Rayleigh slowly fading multipath channel.

- 64 -
3.4.1 Probability of Detection
For the simulation, the design probability of false alarm , the correlation
length integer of the dwell time interval is set at value and the number of
reference cells is , unless otherwise stated. The values of these simulation
parameters are same to what have been used in [1] and also they are used in many
papers for simulation purpose. The threshold multiplier value is readily obtained from
the expression of the probability of false alarm given in ( . The interfering signals
in the reference window are a result of multipath signals, MAI signals or a combination
of them and for simulation the power of these simulated interfering signals is selected
relative to the main signal power which is expressed by (the average received power
of the interfering signal to the signal power of the first user ratio).
It has been shown in [1] that the system proposed in [35] has the same
performance as the system under consideration employing a smart antenna and an
adaptive thresholding CA-CFAR processing with reference cells. Fig. 3-8
shows that the detection performance of the system under consideration using CA-
CFAR processing is seriously degraded in the presence of interfering signals. We
observe that excision of interfering signals from the reference cells before estimating the
noise power level improves the probability of detection. This is the essence the CMLD-
CFAR detector.
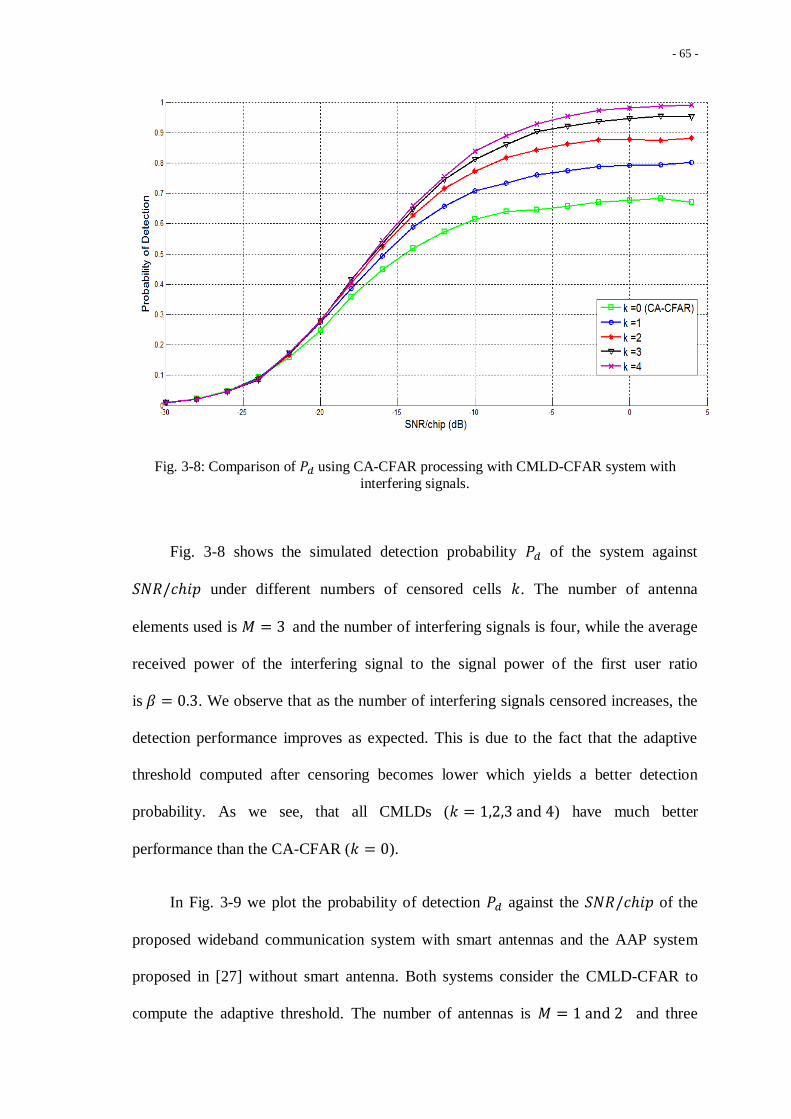
- 65 -
Fig. 3-8: Comparison of using CA-CFAR processing with CMLD-CFAR system with
interfering signals.
Fig. 3-8 shows the simulated detection probability of the system against
under different numbers of censored cells . The number of antenna
elements used is and the number of interfering signals is four, while the average
received power of the interfering signal to the signal power of the first user ratio
is . We observe that as the number of interfering signals censored increases, the
detection performance improves as expected. This is due to the fact that the adaptive
threshold computed after censoring becomes lower which yields a better detection
probability. As we see, that all CMLDs ( ) have much better
performance than the CA-CFAR ( ).
In Fig. 3-9 we plot the probability of detection against the of the
proposed wideband communication system with smart antennas and the AAP system
proposed in [27] without smart antenna. Both systems consider the CMLD-CFAR to
compute the adaptive threshold. The number of antennas is and three

- 66 -
interfering signals are assumed present and censored before computation of the adaptive
threshold.
Fig. 3-9: Comparison of between the proposed system with and the APP
system.
We observe that both systems have equivalent detection performance when
. However, once we have two antenna elements, the detection performance is seriously
improved, which shows clearly the effect of employing a smart antenna with more than
one antenna elements in increasing the received signal power and thereby improving the
detection performance.
In the Fig. 3-10, the detection performance is shown for and
antenna elements. Three interfering signals are assumed present and censored before the
computation of the adaptive threshold. As expected, the detection performance
improves significantly as the number of antenna elements increases. This is due to the
nature of smart antenna which has the capability of improving signal power gain,

- 67 -
combating MAI signals, and reducing multipath fading as mentioned earlier. We also
observe that as the number of antenna elements becomes greater than , we start
reaching saturation.
Fig. 3-10: Effect of the number of antenna elements on the detection performance.
Fig. 3-11 shows the detection probabilities of the proposed system with
different number of antenna elements and for different numbers of censored cells. The
number of antenna elements in the first system is , while in the second system
is . The number of interfering signals is three with . We observe that as
the number of antenna elements increases, the probability of detection improves as
expected. It should be noted though that the detection performance in the presence of
two interfering signals when and , is better than the case with and
case, which is the case with no interfering signals, and for all values.
We also observe a capture effect on the detection probability as it cannot reach
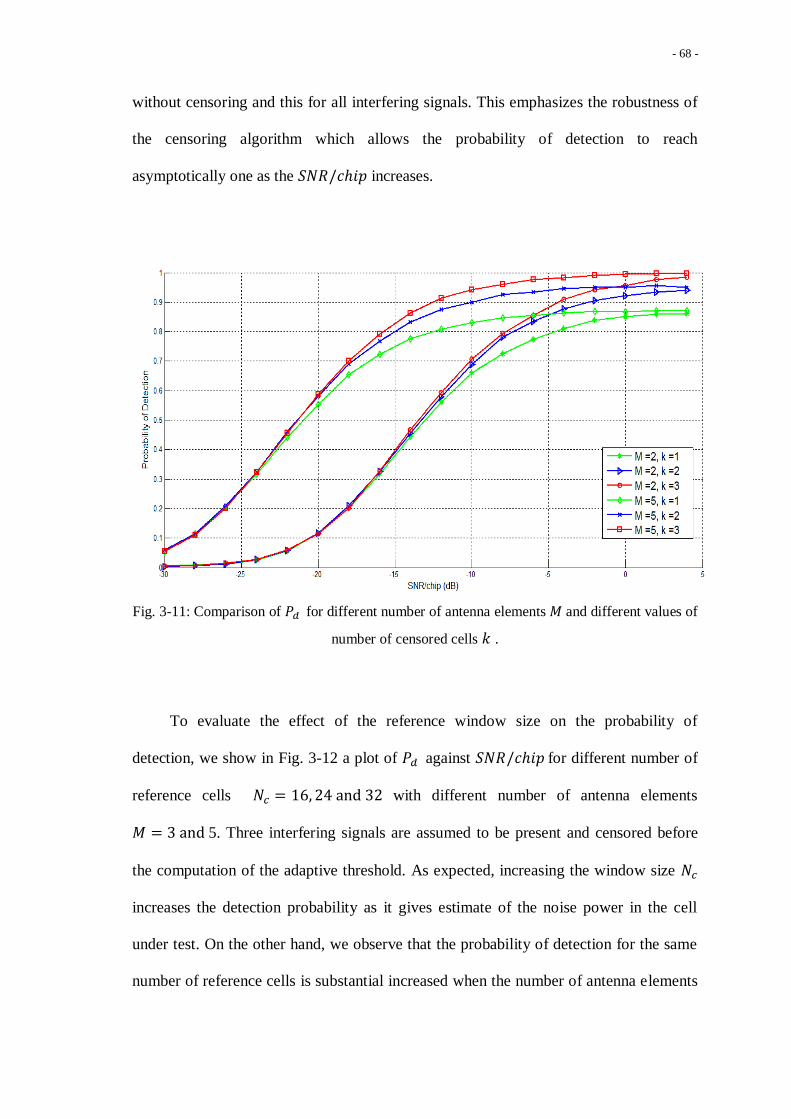
- 68 -
without censoring and this for all interfering signals. This emphasizes the robustness of
the censoring algorithm which allows the probability of detection to reach
asymptotically one as the increases.
Fig. 3-11: Comparison of for different number of antenna elements and different values of
number of censored cells .
To evaluate the effect of the reference window size on the probability of
detection, we show in Fig. 3-12 a plot of against for different number of
reference cells with different number of antenna elements
5. Three interfering signals are assumed to be present and censored before
the computation of the adaptive threshold. As expected, increasing the window size
increases the detection probability as it gives estimate of the noise power in the cell
under test. On the other hand, we observe that the probability of detection for the same
number of reference cells is substantial increased when the number of antenna elements

- 69 -
is increased from 3 to 5. This indicates that the effect of the number of the smart
antenna elements on the received signal power is much more pronounced on the
probability of detection than the number of cells used in estimating the noise power. It
also justifies the idea of combining both adaptive thresholding based on order statistics
and censoring of interfering signals, and smart antenna.
Fig. 3-12: Effect of the number of reference cells on the detection performance.
To investigate the effect of the correlation length integer on the probability of
detection, a plot of against for different values of ( and
12) is shown in Fig. 3-13. The number of reference cells is , the number of
antenna elements is , and three cells are assumed to have interfering signals
which are censored before the computation of the adaptive threshold. We observe that
increasing the correlation length integer enhance the detection performance.

- 70 -
Fig. 3-13: Effect of the correlation length integer on the detection performance.
3.4.2 Mean Acquisition Time
In this section, the mean acquisition time of the proposed system is evaluated. We
consider a PN code sequence of length 1023 chips with a rate of .
Consequently, the length of the uncertainty region for the serial search mode is 2046
test positions. The probability of false alarm is set to and the penalty time
factor . The correlation length integer of the dwell time interval is set at value
and the number of reference cells is unless otherwise stated. In Fig.
3-14, we plot against for different number of antenna elements
and . The number of received multipath signals is two and three multipath
cells are assumed to be in the reference window, which are censored before the
computation of the adaptive threshold. The figure shows that as the number of antenna
elements increase, decreases. We also observe a large improvement in from
the single antenna element case.

- 71 -
Fig. 3-14: Effect of the number of antenna elements on the .
Under same conditions and for a system that use two antenna elements, the effect
of increasing the correlation length integer on the mean acquisition time is shown in
Fig. 3-15. As the increase from to and , decreases. We note the
sensitivity of decrease as the correlation length increases and the
increases.

- 72 -
Fig. 3-15: Effect of the correlation length integer on .
- 73 -
Chapter 4
Conclusion
4.1 Summary and Conclusions
4.2 Suggestions for Future Work
Summary
In this chapter, a summary of the research work is given with some conclusions
drawn from the obtained results. Some suggestions for future research work will
be made.

- 74 -
4.1 Summary and Conclusions
Efficient PN code acquisition is a significant requirement for wireless wideband DS-
CDMA communication receivers. Achieving a reliable PN acquisition in today’s
varying mobile environments in the presence of multipath and MAI signals is a
challenge. That is, acquiring the PN code sequence both quickly and accurately is an
important requirement for high quality communication.
In this thesis, we considered an efficient adaptive single dwell serial PN code
acquisition scheme for a wideband wireless communication system that uses smart
antenna and adaptive thresholding CMLD-CFAR detection in a Rayleigh slowly fading
multipath communication channel. The signal is received by all antenna elements of a
smart antenna. The smart antenna uses an iterative adaptive LMS algorithm to adjust its
weight for better signal reception of the desired signal while minimizing the effect of
multipath and interferences. Then a synchronization cell decision is made based on
adaptive thresholding CFAR processing. We derived closed form expressions for the
probability of false alarm, the probability of detection, and the mean acquisition time for
the wideband communication system considered. Then we investigated the performance
of the system in terms of PN acquisition in a Rayleigh slowly fading multipath channel.
The effect of employing all antenna elements of the smart antenna, the detection, and
the mean acquisition time on the PN acquisition performances have been studied in
terms of computer simulations under different design parameters.
We have shown that employing all smart antenna elements improved the detection
performance and the mean acquisition time of the PN code acquisition. We have also
shown that increasing the window size and the correlation length integer improve the
detection performance. The mean acquisition time was found to decrease as the
- 75 -
correlation length integer increased. Hence, the simulation results presented showed the
robustness of the proposed communication system with smart antenna and adaptive
thresholding CFAR processing for wideband communication in a Rayleigh slowly
fading multipath channel.
4.2 Suggestions for Future Research Work
It is evident from the results obtained that employing adaptive CMLD CFAR processing
with smart antennas in spread spectrum communication improves the PN code
acquisition performance in Rayleigh slowly fading multipath communication channels
compared to the CA-CFAR. The proposed wireless communication system for PN code
acquisition can be further investigated with different CFAR processors and for other PN
code acquisition search mechanisms.

- 76 -
Appendix
MATLAB Codes
1. MATLAB Code for the Function of the Probability of False Alarm.
2. MATLAB Code for the Simulation of the Probability of Detection.
3. MATLAB Code for the Simulation of the Mean Acquisition Time.
Summary
In this appendix we present the MATLAB codes that are used to obtain the simulation
results.

- 77 -
1. MATLAB Code for the Function of the Probability of False Alarm
% ======================================================= %
% The function of the probability of false alarm equation
% ======================================================= %
function Pfa = RT_Pfa_CMLD (Thresh, Nc, k)
% This function return the probability of false alarm Pfa
% based on the equation 3-21
%
%INPUTS
% Thresh is the threshold multiplier
% Nc is the reference window size
% k is the number of censored cells
%
% create a matrix to store the moment generation function MGF
MgfV=repmat(0,1,Nc-k);
% to compute the MGF of the V's random variables
for i=1:(Nc-k)
if i==1
MgfV1=(Nc./((Nc-k).* (Thresh + ( Nc ./ (Nc -k)))));
MgfV(i)=MgfV1;
end
if i>=2
MgfVi=((Nc-i+1)./(Nc-k-i+1))./(((Nc-i+1)./(Nc-k-
i+1))+Thresh);
MgfV(i)=MgfVi;
end
end
% the Pfa is the product of the MGF's
Pfa=prod(MgfV);
end

- 78 -
2. MATLAB Code for the Simulation of the Probability of Detection.
% ======================================== %
% The simulation of detection probability
% ======================================== %
%
% this code for computing the simulated probability of
%detection
clear;
clc;
%
% Simulation Parameters
%
Nc = 24; % number of cells in the reference window
Pfa = 10^-3; % the design Pfa
noI=3; % the number of interfering signals, it is assumed to
be known
k= 3; % number of censored cells
R=512; % the correlation length integer
M=2; % number of antenna elements
beta=0.3; %represents the average received power of the
%interfering signal to the signal power of the
%first user ratio
% To get the threshold multiplier T for the design Pfa using
the Pfa equation
f=@(T) (Pfa - RT_Pfa_CMLD(T, Nc, k));
T=fzero(f,[-1, 100]);
SNRdb=[-30:2:5]; % for plotting in db
runs=10000; %number of runs for each SNR value
for i=1:length(SNRdb) % for a range of SNR value for the CUT
H1_count=0; % counter of H1
SNR(i)=(10^(SNRdb(i)/10))* 0.5625*R*M;
I= beta*SNR(i);
for j=1:runs %for each SNR value a 10,000 run will be
% made to compute the Pd

- 79 -
% 1- add the interference samples in the reference window
interf_samples = exprnd(M*(1+(M*I)),1,noI);%generate it
window_samples(1:noI)= interf_samples; % add it to the
window
% 2- add the noise only samples in the reference window
noise_samples=exprnd(M,1,Nc-noI); % generate it
window_samples(noI+1:Nc)= noise_samples; % add it to the
window
% order the content of the window
window_samples = sort(window_samples);
%the reference window after censoring from the upper end
window_samples = window_samples(1:Nc-k);
% transform the contents to iid R.V.
ref_win(1)= (Nc-k)*window_samples(1);
for w=2:Nc-k
ref_win(w)=(Nc-k-w+1)*(window_samples(w)-
window_samples(w-1));
end
U=sum(ref_win); % the estimate of noise level
Z=T*U; % the adaptive threshold
% the CUT under the H1 assumption
CUT = exprnd(M*(1+(M*SNR(i))),1,1);
if CUT>Z % compare the CUT with the threshold
H1_count=H1_count+1;
end
end
Pd(i)=H1_count/runs; % the Pd
end
%for plotting graph
hold on;
grid on;
plot(SNRdb,Pd,'-*r')
xlabel(['SNR/chip (dB)'], 'FontSize', 14)
ylabel(['Probability of Detection'],'FontSize',14);

- 80 -
3. MATLAB Code for the Simulation of the Mean Acquisition Time.
% ============================================ %
% The simulation of mean acquisition time MAT
% ============================================ %
%
% this code for computing the MAT of the simulated Pd
clear;
clc;
%
% Simulation Parameters
%
Nc = 24; % number of cells in the reference window
Pfa = 10^-3; % the design Pfa
noI=3; % the number of interfering signals, it is assumed to
be known
k= 3; % number of censored cells
R=128; % the correlation length integer
M=2; % number of antenna elements
beta=0.5; %represents the average received power of the
% interfering signal to the signal power of the
% first user ratio
% the following is the parameters of the MAT
L=2; % number of multipaths in the uncertainty region
N=2*L; % number of H1 cells in the H1 collective state
PN_U_chips= 1023; % the PN length is assumed to be 1023
chips
%the number of chips in the uncertainty region is assumed to
be all PN chips
q=2*PN_U_chips; %number of code phases to be tested is 2046
v=1+(q-N); % number of states in the flow graph
penalty=1000; % penalty factor
PN_chip_rate= 1*10^6; % the chip rate is set to 1 Mega chips
per one sec
Tc=1/PN_chip_rate; % chip time
dwell_time = R*Tc; % dwell time
% to get the threshold multiplier value for the design Pfa
f=@(T) (Pfa - RT_Pfa_CMLD(T, Nc,k));
T=fzero(f,[-0.5, 100]);

- 81 -
SNRdb=[-30:2:-10]; % for plotting in db
runs=10000; %number of runs for each SNR value
for i=1:length(SNRdb) % for a range of SNR value for the CUT
H1_count=0; % counter of H1
SNR(i)=(10^(SNRdb(i)/10))* 0.5625*R*M;
I= beta*SNR(i);
for j=1:runs %for each SNR value a 10,000 run will be
% made to compute the Pd
% 1- add the interference samples in the reference window
interf_samples = exprnd(M*(1+(M*I)),1,noI); % generate it
window_samples(1:noI)= interf_samples; % add it to the window
% 2- add the noise only samples in the reference window
noise_samples=exprnd(M,1,Nc-noI); % generate it
window_samples(noI+1:Nc)= noise_samples; % add it to the
window
% order the content of the window
window_samples = sort(window_samples);
% the reference window after censoring from the upper end
window_samples = window_samples(1:Nc-k);
% transforms the contents to iid R.V.
ref_win(1)= (Nc-k)*window_samples(1);
for w=2:Nc-k
ref_win(w)=(Nc-k-w+1)*(window_samples(w)-
window_samples(w-1));
end
U=sum(ref_win); % the estimate of noise level
Z=T*U; % the adaptive threshold
% the CUT under the H1 assumption
CUT = exprnd(M*(1+(M*SNR(i))),1,1);

- 82 -
References
if CUT>Z % compare the CUT with the threshold
H1_count=H1_count+1;
end
end
Pd(i)=H1_count/runs; % the Pd
% for computing the MAT
sigma1 =0;
for jj=1:N
fact=1;
for ii=1:jj-1
fact= fact*(1-Pd(i));
end
sigma1 = sigma1+(jj*Pd(i)*fact);
end
Fact=1;
for jj=1:N
Fact= Fact*(1-Pd(i));
end
sigma2 =0;
for jj=1:N
fact=1;
for ii=1:jj-1
fact= fact*(1-Pd(i));
end
sigma2 = sigma2+(Pd(i)*fact);
end
%Now the MAT is computed using the equation 3-36
MAT(i) = ((2*sigma1 + 2*N*Fact + (v-1)*(1+penalty*Pfa)*(2-
sigma2))/(2*sigma2))*dwell_time;
MAT(i) = MAT(i)*10^3; % converting to ms
end
%for plotting graph
hold on;
grid on;
plot(SNRdb,MAT,'-*b')
xlabel(['SNR/chip (dB)'], 'FontSize', 14)
ylabel(['mean acquisition time (msec)'],'FontSize',14);

- 83 -
References
[1] A. Sofwan and M. Barkat, "PN code acquisition Using Smart antennas and
adaptive thresholding trimmed-mean CFAR processing for CDMA
communication," in Spring World Congress on Engineering and Technology
(SCET2012), Xi'an, China, 2012.
[2] W. Zhuang, "Noncoherent hybrid parallel PN code acquisition for CDMA
mobile communications," IEEE Transactions on Vehicular Technology, vol. 45,
pp. 643-656, 1996.
[3] A. Polydoros and C. Weber, "A unified approach to serial search spread-
spectrum code acquisition--Part I: General Theory," IEEE Transactions on
Communications, vol. 32, pp. 542-549, 1984.
[4] L.-L. Yang, and L. Hanzo, "Serial acquisition of DS-CDMA signals in multipath
fading mobile channels," IEEE Transactions on Vehicular Technology, vol. 50,
pp. 617-628, 2001.
[5] E. A. Sourour and S. C. Gupta, "Direct-sequence spread-spectrum parallel
acquisition in a fading mobile channel," IEEE Transactions on Communications,
vol. 38, pp. 992-998, 1990.
[6] R. R. Rick and L. B. Milstein, "Parallel acquisition in mobile DS-CDMA
systems," IEEE Transactions on Communications, vol. 45, pp. 1466-1476, 1997.
[7] A. Van Der Meer and R. Liyana-Pathirana, "Performance analysis of a hybrid
acquisition system for DS spread spectrum," in TENCON 2003. Conference on
Convergent Technologies for Asia-Pacific Region, vol.1, pp. 121-125, 2003.
[8] M. Barkat, Signal Detection and Estimation, 2nd
Edition, Artech House, Boston,
MA. 2005.
[9] C.-J. Kim, H.-J. Lee, and H.-S. Lee, "Adaptive acquisition of PN sequences for
DSSS communications," IEEE Transactions on Communications, vol. 46, pp.
993-996, 1998.
[10] H. M. Finn and R. S. Johnson, "Adaptive detection mode with threshold control
as a function of spatially sampled clutter-level estimates," RCA Review, vol. 29,
pp. 414-464, 1968.
[11] H. Rohling, "Radar CFAR thresholding in clutter and multiple target situations,"
IEEE Transactions on Aerospace and Electronic Systems, vol. AES-19, pp. 608-
621, 1983.
[12] C. M. Cho and M. Barkat, "Moving ordered statistics CFAR detection for
nonhomogeneoud backgrounds", IEE Proceedings part F, Radar and Signal
Processing, vol. 140, pp284-290, 1993.
[13] J. T. Rickard and G. M. Dillard, "Adaptive detection algorithms for multiple-
target situations," IEEE Transactions on Aerospace and Electronic Systems, vol.
AES-13, pp. 338-343, 1977.
- 84 -
[14] J. A. Ritcey, "Performance analysis of the censored mean-level detector," IEEE
Transactions on Aerospace and Electronic Systems, vol. AES-22, pp. 443-454,
1986.
[15] P. P. Gandhi and S. A. Kassam, "Analysis of CFAR processors in
nonhomogeneous background," IEEE Transactions on Aerospace and
Electronic Systems, vol. 24, pp. 427-445, 1988.
[16] M. Barkat, H. D. Himonas, and P. K. Varshney, "CFAR detection for multiple
target situations", IEE Proceedings, Part F, Radar and Signal Processing, vol.
136, No. 5, pp. 193-210, 1989.
[17] S. D. Himonas and M. Barkat, "Automatic censored CFAR detection for
nonhomogeneous environments", IEEE Transactions on Aerospace and
Electronic Systems, vol. AES-28, No. 1, pp. 286-304, 1992.
[18] M. E. Smith and P. K. Varshney, "Intelligent CFAR processor based on data
variability, " IEEE Transactions on Aerospace and Electronic Systems, vol.
AES-36, No. 3, pp. 837-847, 2000.
[19] A. Farrouki and M. Barkat, "Automatic censoring CFAR detector based on
ordered data variability for nonhomogeneous environments", IEE Procedings,
Radar Sonar and Navigation, vol. 152, pp. 43-51, 2005
[20] T.-T.V. Cao, "Constant false-alarm rate algorithm based on test cell
information" IET Radar Sonar and Navigation, vol. 2, No. 3, pp. 200-213, 2008.
[21] X.W. Meng, "Comments on constant false-alarm rate algorithm based on test
cell information", IET Radar Sonar and Navigation, vol. 3, No. 6, pp. 646-649,
2009.
[22] R. Zhang, W. Sheng, and X. Ma, "Improved switiching CFAR detector for non-
homogeneous environments", Signal Processing, vol. 93, pp. 35-48, 2013.
[23] S. Erfanian and V. T. Vakili, "Introducing switching ordered statistics CFAR
type I in different radar environments", EURASIP Journal on Advances in
Signal Processing, vol. 2009, pp. 1-11, 2009.
[24] J. J. Jen, A study of CFAR implementation cost and performance tradeoffs in
heterogeneous environments, Master thesis, Department of electrical and
computer engineering, California State Polytechnic University, Pomona, 2011
[25] S. Benkrinah and M. Barkat, "An adaptive acquisition using order statistic
CFAR in DS-CDMA serail search for a multipath Rayleigh fading channel",
Proceedings of the Third IEEE International Conference on Systems, Signals
and devices, Tunisia, 2005.
[26] S. Benkrinah, M. Barkat, M. Benslama, A. Benmeddour, and R. Bekhakhecha,
"Adaptive acquisition of PN sequence in nonfading AWGN channels", African
Physical Review, vol. 2, pp. 120-122, 2008.
[27] C.-J. Kim, "Adaptive acquisition of PN code in multipath fading mobile
channels," Electronics Letters, vol. 38, pp. 135-137, 2002.
[28] Y. Song and G. Hu, "Adaptive acquisition of PN code using excision CFAR
detector in multipath fading mobile channels," Electronics Letters, vol. 40, pp.
338-339, 2004.

- 85 -
[29] M. Barkat, "A modified CFAR detector", Proceedings of the 22nd
Annual
Conference on Information Sciences and Systems, Princeton University, New
Jersey, pp. 605-610, 1988.
[30] M. Katz, J. Linatti, and S. Glisic, "A comapartive study of code acquisition
using antenna diversity and beamforming techniques", IEEE Seventh
International Symposium on Spread Spectrum techniques and Applications, vol.
1, pp. 223-227, 2002.
[31] H. Krouma and M. Barkat, "An adaptive threshold double-dwell systems with
antenna diversity for DS-CDMA acquisition", in UAE Forum on
Telecommunication Research, Sharjah, UAE, 2006.
[32] H. Krouma, M. Barkat, K. Kemih, M. Benslama, and Y. Yacine, "Performance
analysis of an adaptive threshold hybrid double-dwell systems with antenna
diversity for acquisition in DS-CDMA systems", International Journal of
Information Technilogy, vol. 4, No.1, pp. 75-84, 2008.
[33] H. Kwon, L. Song, S. Y. Kim, and S. Yoon, "Noncoherent constant false alarm
rate schemes with receive diversity for code acquisition under homogeneous and
nonhomogeneous fading circumstances", IEEE Transactions on Vehicualr
Technology, vol. 56, pp. 2108-2120, 2007.
[34] R. Bekhakhecha, M. Barkat, and S. Alshebeili, "Adaptive acquisition of a PN
code using OS-CFAR detection and antenna diversity for a multipath Rayleigh
fading channel,"in International Conference on Computer and Communication
Engineering, Malaysia, 2006.
[35] B. Wang and H. M. Kwon, "PN code acquisition using smart antenna for spread-
spectrum wireless communications. I," IEEE Transactions on Vehicular
Technology, vol. 52, pp. 142-149, 2003.
[36] B. Wang and H. M. Kwon, "PN code acquisition for DS-CDMA systems
employing smart antennas .II," IEEE Transactions on Wireless Communications,
vol. 2, pp. 108-117, 2003.
[37] H. Puska, H. Saarnisaari, J. Linatti, and P. Lilja "Serial search code acquisition
using smart antennas with single correlator or matched filter," IEEE
Transactions on Communications, vol. 56, pp. 299-308, 2008.
[38] N. Alhariqi, M. Barkat and A. Sofwan, "Serial PN Acquisition Using Smart
Antenna and Censored Mean Level CFAR Adaptive Thresholding for a
DS/CDMA Mobile Communication," Proceedings of the IEEE 14th
International Conference on High Performance Computing and
Communications (HPCC 2012), pp. 1193-1198, Liverpool, UK, June 2012.
[39] K. S. Zigangirov, Theory of Code Division Multiple Access Communication, 1st
Edition, Wiley-IEEE Press, 2004.
[40] R. Pickholtz, D. L. Schilling, and L. B. Milstein, "Theory of Spread-Spectrum
Communications--A Tutorial," IEEE Transactions on Communications, vol. 30,
pp. 855-884, 1982.
[41] D. Campana and P. Quinn, "Spread-spectrum communications," IEEE
Potentials, vol. 12, pp. 13-16, 1993.
[42] D. Prabakaran. (2005) Spread-Spectrum Technology and its Application,
Electronics for you.

- 86 -
[43] I. J. Meel, "Spread Spectrum (SS) introduction,"De Nayer Institut, Belgium,
1999.
[44] M. K. Simon, J. K. Omura, R. A. Scholtz, and B. K. Levitt, Spread Spectrum
Communications Handbook, McGraw-Hill, 2002.
[45] D. Torrieri, Principles of Spread-Spectrum Communication Systems, 1st Edition,
Springer, Boston, 2005.
[46] G. V. Trunk, "Range resolution of targets using automatic detection", IEEE
Transactions on Aerospace and Electronic Systems, vol. AES-14, pp.750-755,
1978.
[47] V. G. Hansen and J. H. Sawyers, "Detectability loss due to greatest of
selectionin a cell averaging CFAR", IEEE Transactions on Aerospace and
Electronic Systems, vol. AES-16, pp.115-118, 1980.
[48] P. H. Lehne and M. Pettersen, "an overview of smart antenna technology for
mobile communications systems," IEEE Communications Surveys, vol. 2, 1999.
[49] S. Bellofiore,C. A. balanis, J. Foutz, and A. S. Spanias "Smart-antenna systems
for mobile communication networks. Part 1. Overview and antenna design,"
IEEE Antenna's and Propagation Magazine, vol. 44, pp. 145-154, 2002.
[50] I. Stevanovi´c, A. Skrivervik and J. R. Mosig, "Smart Antenna Systems for
Mobile Communications," 2003.
[51] C. A. Balanis and P. I. Ioannides, Introduction to Smart Antennas, 1st Edition,
Morgan & Claypool, 2007.
[52] A. O. Boukalov and S. G. Haggman, "System aspects of smart-antenna
technology in cellular wireless communications-an overview," IEEE
Transactions on Microwave Theory and Techniques, vol. 48, pp. 919-929, 2000.
[53] R. K. Jain,S. Kativar, and N. K. Agrawal "Smart Antenna for Cellular Mobile
Communication," VSRD International Journal of Electrical, Electronics &
Communication Engineering, vol. 1, pp. 530-541, 2011.
[54] C.-J. Kim, T.-W. Hwang, H.-J. Lee, and H.-S. Lee, "Acquisition of PN code
with adaptive threshold for DS/SS communications", Electronics Letters, vol.33,
no.16, pp.1352-1354, 1997 .
[55] Y. S. Song, H. M. Kwon, and B. J. Min, "Computationally efficient smart
antennas for CDMA wireless communications", IEEE Transactions on
Vehicular Technology, vol. 50, pp.1613-1238, 2000.
[56] H. A. David and H. N. Nagaraja, Order Statistics, 3rd
Edition,Wiley, New
Jersey, 2003.
[57] U. Kamps and U. Gather, " Characteristic Properties of Generalized Order
Statistics From Exponential Distributions ", Applicationes Mathematicae,
pp.383-391, 1997.