pnnl os3300 alpha/beta monitoring system software … · pnnl os3300 alpha/beta monitoring system...
TRANSCRIPT
PNNL-15623
PNNL OS3300 Alpha/Beta Monitoring System Software and Hardware Operations Manual Rev. 0 JM Barnett CJ Duchsherer January 2006 Prepared for the U.S. Department of Energy under Contract DE-AC05-76RL01830
DISCLAIMER This report was prepared as an account of work sponsored by an agency of the United States Government. Neither the United States Government nor any agency thereof, nor Battelle Memorial Institute, nor any of their employees, makes any warranty, express or implied, or assumes any legal liability or responsibility for the accuracy, completeness, or usefulness of any information, apparatus, product, or process disclosed, or represents that its use would not infringe privately owned rights. Reference herein to any specific commercial product, process, or service by trade name, trademark, manufacturer, or otherwise does not necessarily constitute or imply its endorsement, recommendation, or favoring by the United States Government or any agency thereof, or Battelle Memorial Institute. The views and opinions of authors expressed herein do not necessarily state or reflect those of the United States Government or any agency thereof. PACIFIC NORTHWEST NATIONAL LABORATORY operated by BATTELLE for the UNITED STATES DEPARTMENT OF ENERGY under Contract DE-AC05-76RL01830 Printed in the United States of America Available to DOE and DOE contractors from the Office of Scientific and Technical Information,
P.O. Box 62, Oak Ridge, TN 37831-0062; ph: (865) 576-8401 fax: (865) 576-5728
email: [email protected] Available to the public from the National Technical Information Service, U.S. Department of Commerce, 5285 Port Royal Rd., Springfield, VA 22161
ph: (800) 553-6847 fax: (703) 605-6900
email: [email protected] online ordering: http://www.ntis.gov/ordering.htm
This document was printed on recycled paper.
(9/2003)

PNNL-15623
PNNL OS3300 Alpha/Beta Monitoring System Software and Hardware Operations Manual January 2006 Prepared for the U.S. Department of Energy under Contract DE-AC05-76RL01830 Pacific Northwest National Laboratory Richland, WA 99352

PNNL OS3300 Alpha/Beta Monitoring System Software and Hardware Operations Manual Rev. 0
January 2006 iii
Summary
This Pacific Northwest National Laboratory (PNNL) OS3300 Alpha/Beta Monitoring System Software and Hardware Operations Manual describes how to install and operate the software and hardware on a personal computer in conjunction with the EG&G Berthold LB150D continuous air monitor. Included are operational details for the software functions, how to read and use the drop-down menus, how to understand readings and calculations, and how to access the database tables.


PNNL OS3300 Alpha/Beta Monitoring System Software and Hardware Operations Manual Rev. 0
January 2006 v
Acknowledgements
The PNNL OS3300 Alpha/Beta Monitoring System and this manual are the result of tremendous commitment from the following staff members who have committed their time and effort to the development, programming, testing, and authoring of the software and/or this manual.
• Brad P. Atencio
• J. Matthew Barnett
• Brad C. Barfuss
• Dorothy M. Carrell
• Greg L. Carter
• David D. Douglas
• Cheryl J. Duchsherer
• Daniel L. Edwards
• Michelle L. Johnson
• Daniel R. Sisk
• Edward Stapleton


PNNL OS3300 Alpha/Beta Monitoring System Software and Hardware Operations Manual Rev. 0
vii
Contents
TUSummary UT ...................................................................................................................................................... iii
TUAcknowledgementsUT ....................................................................................................................................... v
TU1.0 UT TUIntroduction UT....................................................................................................................................... 1.1 TU1.1 UT TUFormatting ConventionsUT .......................................................................................................... 1.1 TU1.2 UT TUTerms and DefinitionsUT ............................................................................................................. 1.1 TU1.3 UT TUAbbreviations, Acronyms, and InitialismsUT .............................................................................. 1.2
TU2.0 UT TUInstallation UT ........................................................................................................................................ 2.1 TU2.1 UT TUPNNL OS3300 Software InstallationUT ...................................................................................... 2.1
TU2.1.1 UT TUInstalling PNNL OS3300 SoftwareUT ............................................................................... 2.1 TU2.1.2 UT TUUninstalling PNNL OS3300 SoftwareUT .......................................................................... 2.2
TU2.2 UT TUDatabase Installation UT................................................................................................................ 2.2 TU2.2.1 UT TUInstalling PNNL OS3300 Software DatabaseUT ............................................................... 2.2 TU2.2.2 UT TUUninstalling PNNL OS3300 Software DatabaseUT........................................................... 2.2
TU2.3 UT TUHardware Installation UT............................................................................................................... 2.2 TU2.3.1 UT TULabMaster UPU
TMUPU Card Installation UT ...................................................................................... 2.2
TU2.3.2 UT TULabMaster UPU
TMUPU and Breakout Box Cable ConnectionsUT .................................................... 2.3
TU3.0 UT TUSoftware Operation UT ........................................................................................................................... 3.1 TU3.1 UT TUGeneral Operations Information UT .............................................................................................. 3.1
TU3.1.1 UT TUInformation FlowUT........................................................................................................... 3.1 TU3.2 UT TUAlpha/Beta Monitor Status Screen DescriptionUT....................................................................... 3.3
TU3.2.2 UT TULast MeasurementsUT........................................................................................................ 3.4 TU3.2.3 UT TUStatus BarUT ...................................................................................................................... 3.6
TU3.3 UT TUPNNL OS3300 Main Screen OperationsUT ................................................................................. 3.6 TU3.3.1 UT TUFile Drop-Down Menu UT .................................................................................................. 3.6 TU3.3.2 UT TUAcquire Drop-Down Menu UT ........................................................................................... 3.7 TU3.3.3 UT TUParameters Drop-Down MenuUT....................................................................................... 3.8 TU3.3.4 UT TUAlarms Drop-Down MenuUT .......................................................................................... 3.11 TU3.3.5 UT TUView Drop-Down Menu UT.............................................................................................. 3.14 TU3.3.6 UT TUUtilities Drop-Down Menu UT ......................................................................................... 3.17 TU3.3.7 UT TUAbout Drop-Down Menu UT ............................................................................................ 3.28
TU4.0 UT TUParameters and CalculationsUT ............................................................................................................. 4.1 TU4.1 UT TUParametersUT................................................................................................................................ 4.1
TU4.1.1 UT TURaw AlphaUT..................................................................................................................... 4.1 TU4.1.2 UT TURaw Beta + GammaUT ...................................................................................................... 4.1 TU4.1.3 UT TURaw BetaUT ....................................................................................................................... 4.1

PNNL OS3300 Alpha/Beta Monitoring System Software and Hardware Operations Manual Rev. 0
January 2006 viii
TU4.1.4 UT TURaw GammaUT .................................................................................................................. 4.1 TU4.1.5 UT TUAlpha and Beta Stack Activity UT ...................................................................................... 4.1 TU4.1.6 UT TUAlpha and Beta Sample ConcentrationUT ......................................................................... 4.2
TU4.2 UT TUData StorageUT ............................................................................................................................ 4.2 TU4.2.1 UT TUFilter Data TableUT............................................................................................................ 4.2 TU4.2.2 UT TUQuality Assurance TableUT ............................................................................................... 4.3 TU4.2.3 UT TURaw Data Long CountUT................................................................................................... 4.4 TU4.2.4 UT TURaw Data Short CountUT................................................................................................... 4.4 TU4.2.5 UT TUCalibration DataUT ............................................................................................................ 4.5 TU4.2.6 UT TUThe Pseudo-Coincidence Calculation UT ........................................................................... 4.5
TU4.3 UT TUSetting Background Count TimesUT............................................................................................ 4.7 TU4.4 UT TUGeneral Statistics Discussion for Calculating Total Counts for Specific ErrorUT ....................... 4.7
TU5.0 UT TUTheory of Operation UT ......................................................................................................................... 5.1 TU5.1 UT TUAlpha Activity UT ......................................................................................................................... 5.1
TU5.1.1 UT TUPseudo-Coincidence Counting UT ...................................................................................... 5.1 TU5.2 UT TUBeta Activity UT............................................................................................................................ 5.4 TU5.3 UT TUCalculation of Rate Factors (MUBUa UBU and M UBUb UBU) and Pseudo-Coincidence Factors (F UBUa UBU and F UBUb UBU) UT ......... 5.5
TU6.0 UT TUSoftware MaintenanceUT ...................................................................................................................... 6.1 TU6.1 UT TUSoftware Development RequirementsUT ..................................................................................... 6.1 TU6.2 UT TUReloading InstructionsUT ............................................................................................................. 6.1 TU6.3 UT TUMaintenance Schedules and ProceduresUT .................................................................................. 6.2
TU7.0 UT TUReferencesUT......................................................................................................................................... 7.1

PNNL OS3300 Alpha/Beta Monitoring System Software and Hardware Operations Manual Rev. 0
January 2006 ix
Figures
TUFigure 3.1. Illustration of Short and Long CountsUT .................................................................................... 3.2
TUFigure 3.2. Main Screen―Alpha/Beta Monitor Status Screen UT ................................................................. 3.3
TUFigure 3.3. Main Screen Drop-Down MenusUT............................................................................................ 3.6
TUFigure 3.4. Fail Threshold Settings Screen UT ............................................................................................... 3.8
TUFigure 3.5. Preferences/Source Parameters Dialogue Box UT ....................................................................... 3.9
TUFigure 3.6. Alarm Settings Dialogue Box UT............................................................................................... 3.11
TUFigure 3.7. Relay Setup Screen UT............................................................................................................... 3.13
TUFigure 3.8. Filter Data Log Screen UT.......................................................................................................... 3.15
TUFigure 3.9. Select Dialogue Box UT ............................................................................................................. 3.15
TUFigure 3.10. Source Check Dialogue Box UT............................................................................................... 3.18
TUFigure 3.11. Source Check Status Box UT ................................................................................................... 3.19
TUFigure 3.12. Alpha Plateau Measurement WindowUT ................................................................................ 3.21
TUFigure 3.13. Beta Plateau Complete Window and GraphUT ....................................................................... 3.22
TUFigure 3.14. Completed Background MeasurementsUT .............................................................................. 3.23
TUFigure 3.15. Alpha Efficiency Measurement WindowUT ........................................................................... 3.25
TUFigure 3.16. Completed Pseudo-Coincidence Count WindowUT ............................................................... 3.26
TUFigure 3.17. Count Time WindowUT .......................................................................................................... 3.27
TUFigure 3.18. Change Filter Windows in Order of Operation UT .................................................................. 3.28
TUFigure 4.1. Counts Distribution Example UT ................................................................................................. 4.7
PNNL OS3300 Alpha/Beta Monitoring System Software and Hardware Operations Manual Rev. 0
January 2006 x
Tables
TUTable 2.1. LabMaster UPU
TMUPU BNC ConnectionsUT .............................................................................................. 2.3
TUTable 3.1. Alarm Indicator DefinitionsUT ..................................................................................................... 3.4
TUTable 3.2. Last MeasurementsUT .................................................................................................................. 3.5
TUTable 3.3. CAM Status Messages and DefinitionsUT ................................................................................... 3.6
TUTable 3.4. Relay Output DescriptionsUT ..................................................................................................... 3.13
TUTable 3.5. Filter Log File Parameter TitleUT .............................................................................................. 3.16
TUTable 4.1. Filter Data TableUT ...................................................................................................................... 4.3
TUTable 4.2. Quality Assurance TableUT.......................................................................................................... 4.3
TUTable 4.3. RawDataUT................................................................................................................................... 4.4
TUTable 4.4. Raw Data Short Count UT ............................................................................................................. 4.5
TUTable 6.1 Analog Output Troubleshooting ChecklistUT ............................................................................... 6.2

PNNL OS3300 Alpha/Beta Monitoring System Software and Hardware Operations Manual Rev. 0
January 2006 1.1
1.0 Introduction
The alpha/beta stack monitoring system is controlled by a personal computer (PC) and measures alpha and beta radioactivity in real time. The sampling system consists of a rake-style sample probe located inside the stack, the sample transport line, and an EG&G Berthold LB150D continuous air monitor (CAM) with alpha/beta pseudo-coincidence counting capability. Air is routed from the stack sample probe through the EG&G Berthold LB150D CAM where alpha, beta, and gamma radioactivity are measured with a triple counter tube stack of thin-window, large-area, proportional counters located directly above the sample filter. The system also provides readings on man-made alpha and beta radioactive particulate concentrations. This manual describes how to install and operate the Pacific Northwest National Laboratory (PNNL) OS3300 Alpha/Beta Stack Monitoring System software on a PC when connected to a LB150D CAM.
1.1 Formatting Conventions Software menus are bolded in this manual. At times, the words “Menu 1|Menu 2” are used to tell the user to select Menu 1 and then, from a drop-down menu, select the option labeled Menu 2. Clickable buttons and field names on screens are in italics. Text in message boxes, such as “Enter your name,” is surrounded by quotation marks.
1.2 Terms and Definitions A/B sample flow The sample alpha/beta air flow through the LB150D CAM where
particulates are deposited on an S-class 8-inch glass fiber filter.
alpha spill The ratio of alpha counts in the beta channel to counts in the alpha channel when an alpha source is present. The alpha spill is expressed as a percent.
artificial activity Whether from beta emitters or alpha emitters, this term refers to any radioactivity that is not naturally occurring, i.e., the radioactivity of real concern. Examples of “artificial” alpha emitters are P
239PPu, P
235PU, and P
241PAm;
some “artificial” beta emitters are P
60PCo and P
32PP.
beta spill The ratio of beta counts in the alpha channel to counts in the beta channel when a beta source is present. The beta spill is expressed as a percent.
concentration The radionuclide activity per unit volume of air.
integral Usually used in reference to or as the record of total released or measured radioactivity.
isokinetic sampling A technique for sampling airborne particulates in which the air stream entering the sampling device has a velocity equal to that of the gas stream just ahead of the sampling port/nozzle of the collector resulting in a collection efficiency of unity.
LB150D A thin-window, large-area, proportional counter (detector), which collects and analyzes radioactivity deposited on an 8-inch-diameter filter paper.
PNNL OS3300 Alpha/Beta Monitoring System Software and Hardware Operations Manual Rev. 0
January 2006 1.2
LabMaster P
TMP An ORTECP
®P multi-function input/output PC card, which includes the
counter/timers for collecting data from the LB150D CAM.
natural activity Whether from beta emitters or alpha emitters, this term refers to any radioactivity that results from natural sources, principally particulate daughters of radon and thoron. This activity interferes with the measurement of artificial activity.
pseudo-coincidence
True coincidence counting occurs when two decays arise from the same nuclear event within a source (i.e., when an atom of radioactive material decays, it emits two radiations at the same time). The two decays are not separated in time. In this application, pseudo-coincidence counting appears to be the term applied to decays emitted by isotopes in transient equilibrium where the radiations are separated by a very short period of time. Glenn Knoll refers to this as delayed coincidence in Radiation Detection and Measurement (Knoll 2000).
stack flow The air flow in the stack.
1.3 Abbreviations, Acronyms, and Initialisms BNC Bayonet Neill Concelman—electrical cable connector Bq Becquerel CAM continuous air monitor CD compact disc cfm cubic feet per minute cpm counts per minute cps counts per second F Ba B alpha factor F Bb B beta factor ISA Industry Standard Architecture I/O input/output kscf kilo-standard cubic feet M P
3P cubic meters
M Ba B correction factor for alpha activity calculations M Bb B correction factor for beta activity calculations μ Micro μCi micro-curie μCi/ml micro-curies per milliliter μs Microsecond PC personal computer PNNL Pacific Northwest National Laboratory PNNL OS3300 PNNL OS3300 Alpha/Beta Stack Monitoring System Ps pseudo-coincidence count rate PsBo B low pseudo-coincidence QA quality assurance scfm standard cubic feet per minute

PNNL OS3300 Alpha/Beta Monitoring System Software and Hardware Operations Manual Rev. 0
January 2006 1.3
S/N serial number V volt

PNNL OS3300 Alpha/Beta Monitoring System Software and Hardware Operations Manual Rev. 0
January 2006 2.1
2.0 Installation
The PNNL OS3300 Alpha/Beta Stack Monitoring System (PNNL OS3300) software runs in the WindowsP
®P environment and interacts with the LabMasterP
TMP data acquisition PC card to obtain raw counts
from the detectors in the LB150D CAM. The LabMaster P
TMP data acquisition PC card and drivers must be
installed before installing the alpha/beta monitoring program. The monitoring program also interacts with Microsoft AccessP
®P, and the user should install the Access 2000P
®P or earlier version before installing the
monitoring software.
2.1 PNNL OS3300 Software Installation This section describes the processes for installing and uninstalling the PNNL OS3300 software.
2.1.1 Installing PNNL OS3300 Software
To install the PNNL OS3300 software, follow the steps below. 1. Insert the compact disc (CD) into the CD drive of the computer (typically Drive D).
2. From the WindowsP
®P Start menu, select Run.
3. Click the Browse button and change to the CD drive from the dialogue box.
4. Double-click the file named Setup.EXE.
5. After returning to the Run dialogue box, click OK, and the setup program will begin.
6. The software can be installed on any drive in any directory on the computer. Select the default drive and directory (C:\Program Files\OS3300) when prompted (this directory may need to be created before installation).
7. When complete, the program will indicate if the installation was successful. The software generates the following data files that are saved to the C:\Program Files\OS3300 directory: • event files • source check • plateau • background • efficiency • pseudo-coincidence.
Note: The computer does not need to be rebooted after installation is complete.

PNNL OS3300 Alpha/Beta Monitoring System Software and Hardware Operations Manual Rev. 0
January 2006 2.2
2.1.2 Uninstalling PNNL OS3300 Software
The PNNL OS3300 software can be uninstalled with the “Add/Remove Programs” icon in the Windows P
®P
Control Panel. Select the PNNL OS3300 software from the list shown in the Control Panel. The database will not be automatically deleted when removing the software.
2.2 Database Installation This section describes the processes for installing and uninstalling the PNNL OS3300 software database.
2.2.1 Installing PNNL OS3300 Software Database
After the PNNL OS3300 software is installed, the database for the alpha/beta measurement data needs to be copied from the installation disk to the computer, as follows: 1. Insert the CD into the CD drive of the computer (typically Drive D).
2. From the WindowsP
®P Start menu, select Programs|Windows Explorer P
®P.
3. Click on the CD icon for the computer in the left-hand pane of the dialogue box.
4. Click the file named AlphaBeta97.mdb in the right-hand pane of the dialogue box.
5. Copy the file from the CD (Edit|Copy menu) to the C:\ISEMS\ISEMSDBS directory (this directory may need to be created before installation).
6. Close Windows Explorer P
®P.
The database is typically installed in directory C:\ISEMS\ISEMSDBS, but can also be installed in any directory. If the database is stored in a directory other than C:\ISEMS\ISEMSDBS, the program must be directed to the database location. See the section on Select Database for instructions on how to change the database location if this is warranted.
2.2.2 Uninstalling PNNL OS3300 Software Database
If removal of the database is required, the operator must manually delete it from the computer with Windows Explorer P
®P.
2.3 Hardware Installation This section describes the processes for installing the LabMaster™ Card and connecting the LabMaster™ and breakout box with cables,
2.3.1 LabMaster P
TMP Card Installation
Before collecting data, the LabMasterP
TMP input/output (I/O) card must be installed in the PC. A detailed
description of the installation procedure is in the LabMaster P
TMP manual. To summarize:
1. Open the computer case (consult PC documentation).
2. Locate an available industry standard architecture (ISA) slot. Note: The LabMaster P
TMP is an ISA
board, and the PC must have ISA slots to use this card. 3. Remove the screw in the slot and the blanking panel from the PC (if installed).
PNNL OS3300 Alpha/Beta Monitoring System Software and Hardware Operations Manual Rev. 0
January 2006 2.3
4. Insert the LabMaster P
TMP firmly in the slot and reinsert the screw to hold the card in place.
2.3.2 LabMaster P
TMP and Breakout Box Cable Connections
Connect the 68-pin ribbon-cable between the LabMasterP
TMP I/O card and the breakout box. This supplies
the LabMaster P
TMP with easy-to-connect Bayonet Neill Concelman—electrical cable connector (BNC),
screw terminals, and the 9-pin “D” connector for making the hardware connections. The LabMaster P
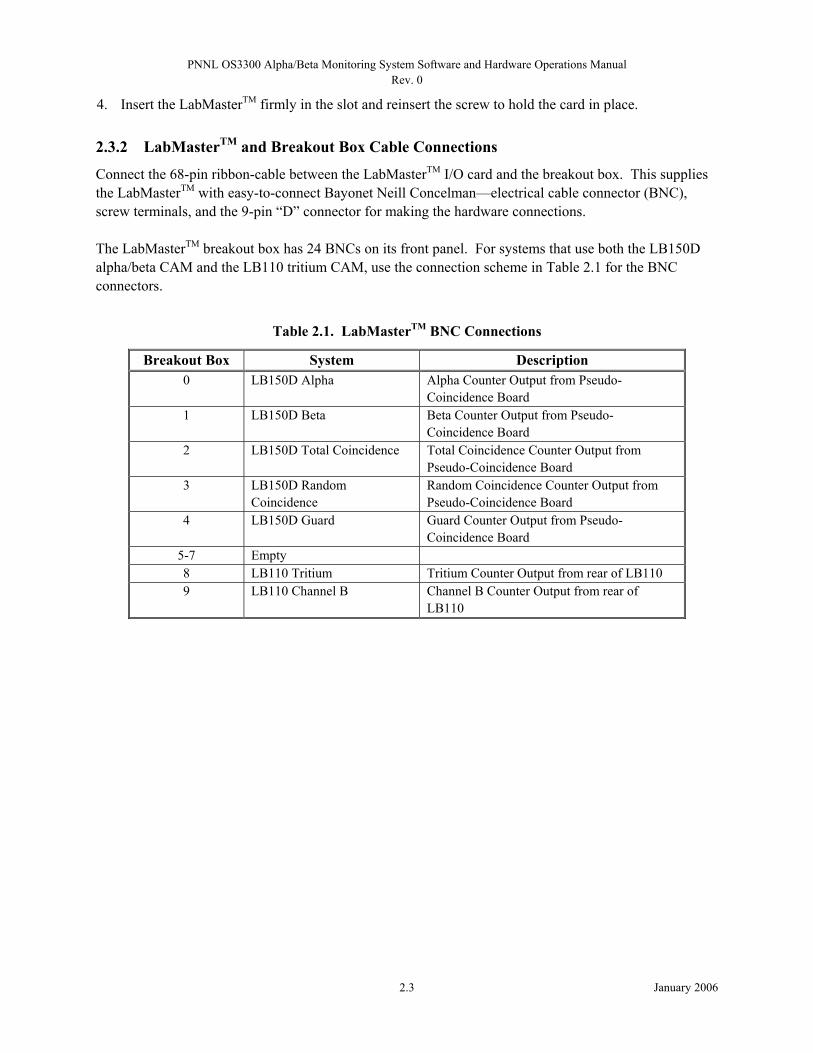
TMP breakout box has 24 BNCs on its front panel. For systems that use both the LB150D
alpha/beta CAM and the LB110 tritium CAM, use the connection scheme in Table 2.1 for the BNC connectors.
Table 2.1. LabMaster P
TMP BNC Connections
Breakout Box System Description 0 LB150D Alpha Alpha Counter Output from Pseudo-
Coincidence Board 1 LB150D Beta Beta Counter Output from Pseudo-
Coincidence Board 2 LB150D Total Coincidence Total Coincidence Counter Output from
Pseudo-Coincidence Board 3 LB150D Random
Coincidence Random Coincidence Counter Output from Pseudo-Coincidence Board
4 LB150D Guard Guard Counter Output from Pseudo-Coincidence Board
5-7 Empty 8 LB110 Tritium Tritium Counter Output from rear of LB110 9 LB110 Channel B Channel B Counter Output from rear of
LB110
PNNL OS3300 Alpha/Beta Monitoring System Software and Hardware Operations Manual Rev. 0
January 2006 3.1
3.0 Software Operation
The software for PNNL OS3300 provides several functions controlled through the PC environment. Those functions are: • Collect data at regular intervals. • Calculate activities and concentrations from data collected. • Display data and alarm conditions. • Run calibration utilities. Each of these functions is discussed in the following sections.
3.1 General Operations Information This section describes the process of information flow, including short and long count calculations.
3.1.1 Information Flow
In very general terms, the LB150D CAM collects pulses, and the output of the detected pulses is stored as either an alpha or a beta pulse. The pseudo-coincidence board determines in which bin the counts will be stored. The signals are sent through BNC cables from the detectors to the breakout box and then to the LabMaster P
TMP data acquisition card through a 68-pin cable. The LabMasterP
TMP card contains groups of
counters and associated timers. When instructed by the software, a group of counters will collect the number of pulses from the LB150D over a period of time equal to the user-selected short count time. After each short count period has expired, the PNNL OS3300 software requests the time and number of counts from the LabMaster P
TMP card, increases the count time by one short time interval, and restarts the
measurement process. The software uses the counts and time values from the LabMaster P
TMP card to
calculate the concentration of radioactive material from the alpha and beta pulses during the count period and adds that to the running total. This process is repeated until a long count time is reached. After each long count time, the software stores the values of concentration and activity to a database along with other relevant information (such as the raw counts from the LabMaster P
TMP card).
During each short count time, the software checks the concentration value against the alarm limit. If the alarm limit is exceeded, the software automatically changes the long count time to the short count time for faster data integration. Upon returning to a non-alarm state, the long count time is returned to the user-defined value. Optionally, during the short count time, the raw and calculated data can be stored in a separate database table for reconstructing each long measurement data set.
3.1.2 Data Collection
In very general terms, the CAM collects count rate data from the detectors for periods of time (set by the user) and then calculates the alpha and beta activity collected on the filter paper for that time period. Two time periods are used; they are referred to as the short count and the long count (Figure 3.1). A long count time consists of an integral multiple of short count periods. See Section 3.3.6.6, Count Times, for a detailed discussion of appropriate time periods for the short count and long count.

PNNL OS3300 Alpha/Beta Monitoring System Software and Hardware Operations Manual Rev. 0
January 2006 3.2
Illustration of Short and Long Counts
1 2 3 4 5 6 7 8 Time Interval
Short Count
Long Count
Illustration of Short Count Alarm
Initial ly, the long count is set at five short count periods . When concentration alarm occurs after three short count periods, the long count is adjusted to end at the same time as the short count that triggered the alarm. After abbreviated long counts are complete and there is no longer an alarm, the long count interval reverts to original value (5 short count periods in this example).
Long Count: Activity calculated and updated on screen Activity alarm is checked at the end of each long count. The data are written to Raw Data table of the database.
Short Count: Concentration calculated and updated on screen Concentration and fail alarms checked at end of each short count Data written to Raw Data Short Count table of the database
Figure 3.1. Illustration of Short and Long Counts
3.1.2.1 Short Count Calculations
At the end of each short count, the PNNL OS3300 software obtains the average and gross (uncorrected) alpha and beta count rates from the LabMasterP
TMP card. The LabMasterP
TMP card is a PC-slotted card that
interacts with the LB150D CAM. The background is subtracted from each count rate, and then the estimated counts from radon progeny on the filter are subtracted. The resulting net count rates are used to calculate the total alpha and beta concentrations present on the filter. The total alpha and beta concentrations calculated during the previous short count time are then subtracted. The final result is a net alpha and beta concentration that is accumulated on the filter during the lapsed short count period. The net alpha and beta activity is divided by the sample flow volume, and the resulting concentration is compared to the concentration alarm set point. If the calculated value exceeds the concentration alarm set point, the associated circular indicator on the computer screen turns yellow, and selected alarm relays are activated. When the concentration alarm set point is exceeded, the CAM will also initiate a shortened long count equal to the same length as the short count (Figure 3.2). This allows the CAM to calculate and compare both concentration and activity to the alarm set points each time interval. If the integrated activity and concentration do not exceed alarm set points, the long count time is restored to its previous value, and the CAM begins counting again with the first short count of the long count cycle. If the user has selected the option to save data to the short count table in the database, data are written to the database at the end of the short count.

PNNL OS3300 Alpha/Beta Monitoring System Software and Hardware Operations Manual Rev. 0
January 2006 3.3
Important: The system adopted at PNNL uses a gleaner program to publish CAM data to a web page. The gleaner program pulls data from the short count table, so for PNNL applications, the user must select the option to save data to the short count table.
Figure 3.2. Main Screen―Alpha/Beta Monitor Status Screen
3.1.2.2 Long Count Calculations
At the end of each long count, the PNNL OS3300 software sums the net alpha and beta activity calculated during each short count time. The result is the net alpha and beta activity collected on the filter paper during the lapsed long count period. This result is compared to the integral alarm set points. If the calculated activity exceeds the alarm set point, the associated circular alarm indicator on the computer screen turns red (Section 3.2), and the long count time is set to the short count time. At the end of each long count, the software writes the measured values and calculated results to the database. The user does not have the option to disable storing long count data to the database.
3.2 Alpha/Beta Monitor Status Screen Description This section describes the alarm indicators, the last measurements, and the status bar.

PNNL OS3300 Alpha/Beta Monitoring System Software and Hardware Operations Manual Rev. 0
January 2006 3.4
3.2.1 Alarm Indicators
The status screen has three alarm indicators that provide the status of the system components. The color green indicates normal status (Figure 3.2). Red indicates an alarm condition for the specified component. Alarm indicators for alpha and beta activity have a third state, yellow, which indicates that the concentration during a short measuring period was above the alarm limit. Table 3.1 provides a description for each alarm indicator.
Table 3.1. Alarm Indicator Definitions
Alarm Meaning Indicator Green Yellow Red
Alpha Radiation Level
Normal operating status The alpha concentration measured at the end of a short count was above the alpha concentration alarm set point.
Either the alpha integral activity or concentration was above its respective alarm set point at the end of a long count.
Beta Radiation Level
Normal operating status The beta concentration measured at the end of a short count was above the beta concentration alarm set point.
Either the beta integral activity or concentration was above its respective alarm set point at the end of a long count.
CAM Status Normal operating status The CAM status indicator only turns red and does not turn yellow under any conditions.
Any combination of the following: 1. Communications lost
to the LabMaster P
TMP
I/O card. 2. Alpha, beta/gamma,
or gamma count rate less than fail threshold setting.
3.2.2 Last Measurements
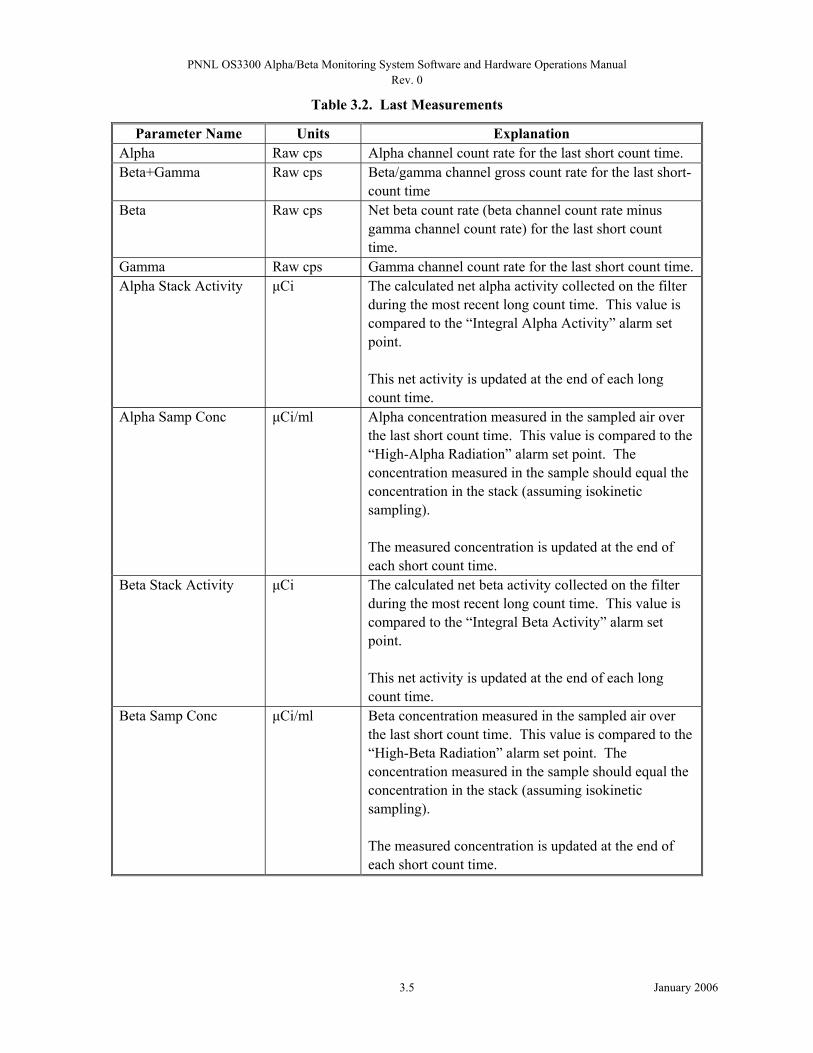
The main screen also shows indicators for the last readings made by the system for several important parameters. These parameters, listed in Table 3.2, are updated at regular intervals. Units for each of these parameters are shown on the screen as well.
PNNL OS3300 Alpha/Beta Monitoring System Software and Hardware Operations Manual Rev. 0
January 2006 3.5
Table 3.2. Last Measurements
Parameter Name Units Explanation Alpha Raw cps Alpha channel count rate for the last short count time. Beta+Gamma Raw cps Beta/gamma channel gross count rate for the last short-
count time Beta Raw cps Net beta count rate (beta channel count rate minus
gamma channel count rate) for the last short count time.
Gamma Raw cps Gamma channel count rate for the last short count time. Alpha Stack Activity μCi The calculated net alpha activity collected on the filter
during the most recent long count time. This value is compared to the “Integral Alpha Activity” alarm set point. This net activity is updated at the end of each long count time.
Alpha Samp Conc μCi/ml Alpha concentration measured in the sampled air over the last short count time. This value is compared to the “High-Alpha Radiation” alarm set point. The concentration measured in the sample should equal the concentration in the stack (assuming isokinetic sampling). The measured concentration is updated at the end of each short count time.
Beta Stack Activity μCi The calculated net beta activity collected on the filter during the most recent long count time. This value is compared to the “Integral Beta Activity” alarm set point. This net activity is updated at the end of each long count time.
Beta Samp Conc μCi/ml Beta concentration measured in the sampled air over the last short count time. This value is compared to the “High-Beta Radiation” alarm set point. The concentration measured in the sample should equal the concentration in the stack (assuming isokinetic sampling). The measured concentration is updated at the end of each short count time.

PNNL OS3300 Alpha/Beta Monitoring System Software and Hardware Operations Manual Rev. 0
January 2006 3.6
3.2.3 Status Bar
The status bar, on the bottom of the main screen, provides 1) the CAM status (e.g., channel failure), 2) countdown timers, in seconds, for the short count and the long count, and 3) the current time and date. Stack flow rates are set in the Alarm Settings menu (Section 3.3.4). If the CAM has multiple failure alarms, only the most recent failure alarm is displayed. Just above the status bar, the stack and sample flow rates are displayed in cubic feet per minute (cfm). (This status bar is not displayed when normal counting has been stopped.) Table 3.3 explains the messages that appear in the status bar.
Table 3.3. CAM Status Messages and Definitions
CAM Status Message Explanation “Counting” Normal operating mode “Alpha Channel Failure #cps” “Beta Channel Failure #cps” “Gamma Channel Failure #cps”
Count rates are lower than fail threshold setting
“Detectors Stopped” Detectors are not counting “Counting to acquire operating parameters” Start-up count running (one minute)
3.3 PNNL OS3300 Main Screen Operations This section explains the menu functions of the PNNL OS3300 software. It also explains the menu selections starting with the options under the File menu and proceeding across the menu bar to the right (Figure 3.3).
Figure 3.3. Main Screen Drop-Down Menus
3.3.1 File Drop-Down Menu
The following two options are available under the File menu: • Print Setup allows you to set up the printer if one is connected to the computer. • Exit closes the alpha/beta monitor program.

PNNL OS3300 Alpha/Beta Monitoring System Software and Hardware Operations Manual Rev. 0
January 2006 3.7
3.3.2 Acquire Drop-Down Menu
The options under the Acquire menu are used to start and stop the alpha/beta system counters (i.e., data acquisition). When the acquisition is stopped, the Utilities menu becomes available. The following options are available under the Acquire menu: • Start • Stop. Only one button is enabled at a time: Stop when acquiring data, and Start when data acquisition is stopped.
3.3.2.1 Start
The Start option starts the routine data collection from the LB150D CAM. The real-time display and data acquisition can be stopped by clicking on Acquire|Stop. If data are being actively collected, the software will warn the operator that closing the real-time display will terminate the current counting and offer the option to cancel this operation.
3.3.2.2 Stop
When the Stop option is selected, data from the LB150D CAM is retrieved from the LabMasterP
TMP card,
activities and concentrations are calculated, and the results are stored to the database. To restart the counting, the operator must select Start from the Acquire menu. The counting status is provided on the bottom-left corner of the display screen. In the stopped mode, the Utilities menu is available, and the count time can be set. To restart data acquisition, select the Acquire|Start option. Note: The stack monitoring system uses a commercial hardware/software monitoring system called Watchdog. The Watchdog program monitors both the PNNL OS3300 and PNNL OS3700 stack monitoring software programs for system lockups by verifying time stamps on the database files produced. If one or the other of the software programs does not successfully provide a new record in a specified amount of time, Watchdog assumes the system has locked up and executes a hard reboot of the system. All necessary programs are maintained in the startup menu so the reboot will restart all necessary stack monitoring programs. Note: Because the Watchdog program triggers on unsuccessful database entries from the software programs, pause the Watchdog program before stopping the counting process on the PNNL OS3300 software. Once the interface with the PNNL OS3300 software is complete, the Watchdog program will need to be restarted. Note: Watchdog has an active icon (shaped like a human heart) that will palpitate when the program is running. The icon is located in the bottom right-hand corner of the computer screen in the system tray. By clicking on the icon, an interactive window will appear where the program can be paused and/or resumed.
PNNL OS3300 Alpha/Beta Monitoring System Software and Hardware Operations Manual Rev. 0
January 2006 3.8
3.3.3 Parameters Drop-Down Menu
The options under the Parameters menu are used to set the operating options and values for the program. The following options are available under the Parameters menu: • Fail Threshold Settings • Preferences • Select Database.
3.3.3.1 Fail Threshold Settings
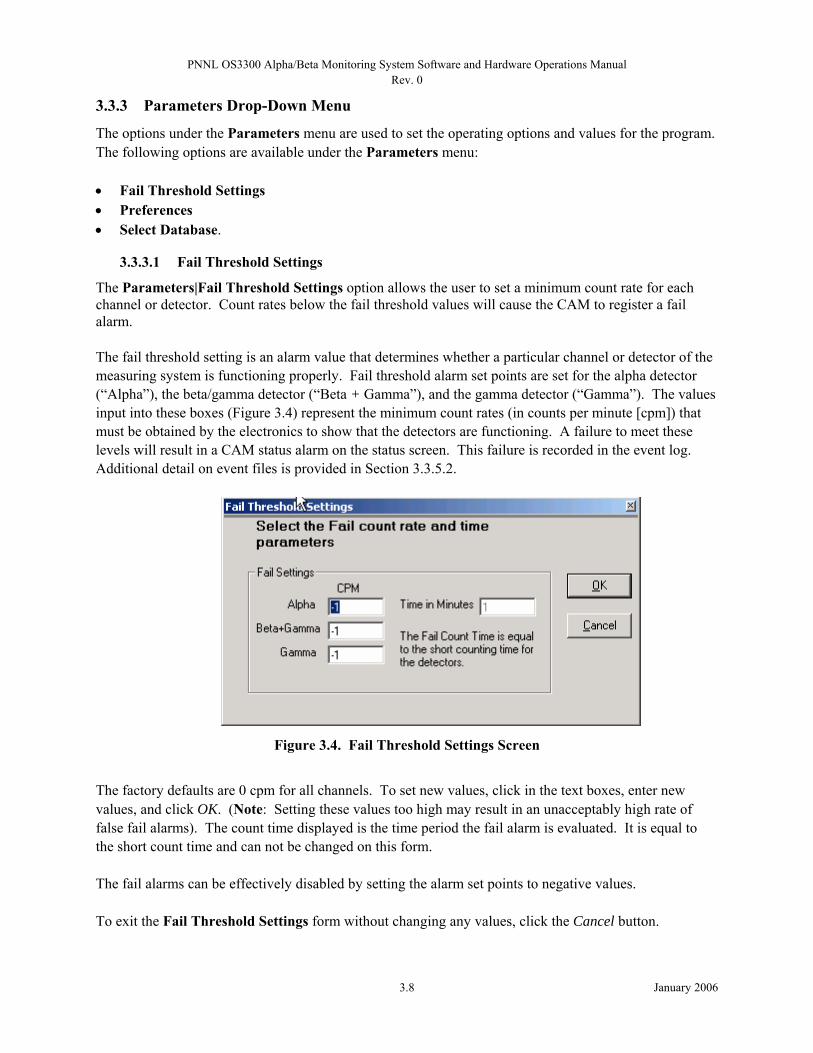
The Parameters|Fail Threshold Settings option allows the user to set a minimum count rate for each channel or detector. Count rates below the fail threshold values will cause the CAM to register a fail alarm. The fail threshold setting is an alarm value that determines whether a particular channel or detector of the measuring system is functioning properly. Fail threshold alarm set points are set for the alpha detector (“Alpha”), the beta/gamma detector (“Beta + Gamma”), and the gamma detector (“Gamma”). The values input into these boxes (Figure 3.4) represent the minimum count rates (in counts per minute [cpm]) that must be obtained by the electronics to show that the detectors are functioning. A failure to meet these levels will result in a CAM status alarm on the status screen. This failure is recorded in the event log. Additional detail on event files is provided in Section 3.3.5.2.
Figure 3.4. Fail Threshold Settings Screen
The factory defaults are 0 cpm for all channels. To set new values, click in the text boxes, enter new values, and click OK. (Note: Setting these values too high may result in an unacceptably high rate of false fail alarms). The count time displayed is the time period the fail alarm is evaluated. It is equal to the short count time and can not be changed on this form. The fail alarms can be effectively disabled by setting the alarm set points to negative values. To exit the Fail Threshold Settings form without changing any values, click the Cancel button.
PNNL OS3300 Alpha/Beta Monitoring System Software and Hardware Operations Manual Rev. 0
January 2006 3.9
3.3.3.2 Preferences
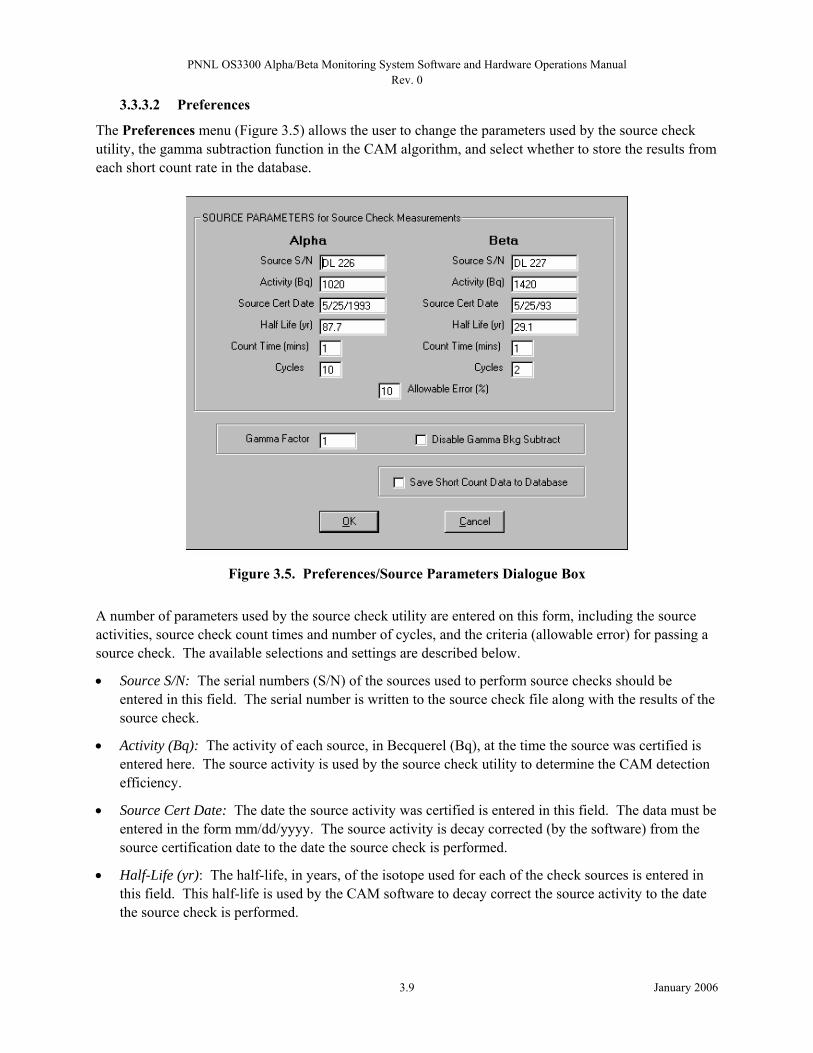
The Preferences menu (Figure 3.5) allows the user to change the parameters used by the source check utility, the gamma subtraction function in the CAM algorithm, and select whether to store the results from each short count rate in the database.
Figure 3.5. Preferences/Source Parameters Dialogue Box
A number of parameters used by the source check utility are entered on this form, including the source activities, source check count times and number of cycles, and the criteria (allowable error) for passing a source check. The available selections and settings are described below.
• Source S/N: The serial numbers (S/N) of the sources used to perform source checks should be entered in this field. The serial number is written to the source check file along with the results of the source check.
• Activity (Bq): The activity of each source, in Becquerel (Bq), at the time the source was certified is entered here. The source activity is used by the source check utility to determine the CAM detection efficiency.
• Source Cert Date: The date the source activity was certified is entered in this field. The data must be entered in the form mm/dd/yyyy. The source activity is decay corrected (by the software) from the source certification date to the date the source check is performed.
• Half-Life (yr): The half-life, in years, of the isotope used for each of the check sources is entered in this field. This half-life is used by the CAM software to decay correct the source activity to the date the source check is performed.
PNNL OS3300 Alpha/Beta Monitoring System Software and Hardware Operations Manual Rev. 0
January 2006 3.10
• Count Time (mins): When the source check utility is run, several counts are completed. The count time for each count is equal to the value entered in this field. The number of counts is set by the parameter Cycles. The detection efficiency reported when the source check utility is completed is the average detection efficiency for all cycles.
• Cycles: When the source check utility is run, several count cycles are completed. The number of count cycles is determined by the value entered in this field.
• Allowable Error %: The allowable error sets the criteria for passing a source check. If the detection efficiency measured during the source check utility is within X% of the detection efficiency measured during calibration, the CAM passes the source check. The value of X is set in this field.
• Gamma Factor: The gamma factor is a compensation factor used when the gamma background detector and the beta detector are different sizes or have different sensitivities. The measured count rate in the gamma channel is subtracted from the beta/gamma channel count rate to reduce the effects of gamma background from external sources of gamma radiation (Equation 3.1). The default gamma factor is one, indicating that the two detectors are of equal sensitivity. Experience or testing may produce a slightly different factor. The gross beta count rate is calculated as follows:
))(()( grossgrossgross RateCountGammaFactorGammaRateCountGammaBetaRateCountBeta −+=
(3.1) • Disable Gamma Bkg Subtract. If testing is required for a more accurate factor, a check box is
provided to disable the gamma background subtraction. The default state of the check box is unchecked. If the Disable Gamma Bkg Subtract box is checked, Equation 3.2 is used to calculate the gross beta count rate.
)( grossgrossnet RateCountGammaBetaRateCountBeta += (3.2)
• Save Short Count Data to Database. When checked, results calculated at the end of each short count
are saved to the database (Section 4.2). The user should be aware that this will grow the size of the database considerably faster.
Clicking the OK button will save the parameters to the WindowsP
®P registry and implement the changes on
the next counting cycle. To exit the Parameters form without changing any values, click the Cancel button.
3.3.3.3 Select Database
Upon installation, the database name and path must be entered under Select Database so the program knows where to store the data. This option may also be used if the user changes the name of the database. The software is initially set up to store data in an Access database titled, AlphaBeta97.mdb. If the database is renamed, the user must use the Parameters|Select Database option to direct the PNNL OS3300 software to the new database file location.

PNNL OS3300 Alpha/Beta Monitoring System Software and Hardware Operations Manual Rev. 0
January 2006 3.11
3.3.4 Alarms Drop-Down Menu
The Alarms menu allows the user to configure the CAM alarms. The following options are available under the Alarms menu: • Settings • Relay Setup.
3.3.4.1 Settings
The Alarm|Settings option is used to set alarm levels for the alpha beta control system (Figure 3.6). Although eight alarms are listed, the system uses only four to trigger alarms: High Alpha Radiation, High Beta Radiation, Integral Alpha Activity, and Integral Beta Activity. The fixed flow rate parameters shown on this form are used to enter sample and stack flow rates into the system. The remaining two parameters (High Stack Flow Rate and High A/B Sampler Flow Rate) are disabled for the PNNL OS3300 software.
Figure 3.6. Alarm Settings Dialogue Box
To change a setting, click in a text box and enter a new value. When all new values are set, click the OK button. To exit without changing any values, click the Cancel button. Once the alarm set points are entered, these values are stored in the software and used to trip the appropriate alarms, for example, a stack monitoring annunciator alarm panel. The concentration alarms (High Alpha Radiation and High Beta Radiation) are tripped if the concentration measured during a short count time exceeds the alarm set point. This alarm is non-latching.
PNNL OS3300 Alpha/Beta Monitoring System Software and Hardware Operations Manual Rev. 0
January 2006 3.12
After the concentration alarm is tripped and the concentration released during the following short count time is below the concentration alarm set point, the alarm indicator on the status screen will return to green. If the alarm is tripped during the short count time, the alarm indicator on the main screen will turn yellow, and the long count time will be set equal to the short count time. If, at the end of the long count time, the concentration still exceeds the alarm set point or if the integral alarm is tripped, the alarm indicators on the main screen will turn red. Default values for high alpha radiation and high beta radiation alarms are 100 and 200 μCi/ml, respectively. These alarms typically are tripped before the integral activity alarms because integral activity alarms are only checked at the end of the long count time. The user should determine what is appropriate for the particular installation and enter those values here. Avoid entering values that are too restrictive; this can result in numerous false positives. The integral activity alarms (Integral Alpha Activity and Integral Beta Activity) are tripped when the net activity released out the stack during the long count time exceeds the alarm set point. If the net activity released during the long count time exceeds the integral activity alarm set point, the radiation level alarm indicator on the status screen will turn red. The net activity, in μCi, released out the stack is calculated by multiplying the net activity collected on the filter by the ratio of the stack flow rate and the sample flow rate shown in Equation 3.3.
))(( ,, RateFlowSample
RateFlowStackActivityActivity filternetstacknet = (3.3)
Like the concentration alarm, the integral activity alarm is non-latching. If the integral activity alarm is tripped (alarm indicator is red), and the net activity released during the following long count time is below the integral activity alarm set point, the alarm indicator on the status screen will return to green. The Fixed Stack Flow Rate and Fixed Sample Flow Rate display the fixed flow rates used by the PNNL OS3300 software to calculate flow volumes, concentrations, and net stack activity. These values may be edited by the user. On the PNNL OS3300 system, the stack flow rates will be updated with actual measured flow rate numbers from periodic stack velocity traverses. Note: The user should take care when adjusting the fixed flow rates because these will affect the concentration and net activity calculations of the CAM. Note: Changing the fixed flow rates on this screen does not change the actual flow rate of the system.
3.3.4.2 Alarm Relay Setup
There are six user-programmable alarm relays for this system, and Figure 3.7 shows the setup screen for these relays. Each relay can be programmed to function as a result of any combination of possible alarms. The alarm options are listed in the left-hand pane of the screen. If more than one option is programmed to a single relay (such as CAM Function and Beta High Rad. in relay five shown below), the signal uses an either/or logic. If either alarm is tripped, the relay will be energized. Table 3.4 provides alarm relay output descriptions.

PNNL OS3300 Alpha/Beta Monitoring System Software and Hardware Operations Manual Rev. 0
January 2006 3.13
Figure 3.7. Relay Setup Screen
To add an alarm option to a relay, highlight the alarm (by clicking on it) in the Alarm Options box on the left and then click the appropriate Add to Relay numbered button in the middle of the screen to add it to the relay. Each function can be assigned to any number of relays simultaneously. To remove a specific item from a relay, highlight the alarm option in the box on the right (by clicking on the alarm name) and click Remove Selected Items. All other alarm options will remain unchanged. To delete all the alarm options for all the relays, click Clear All Items. When the relay channels are set as desired, click OK. Once OK is clicked, the new relay settings are applied. To exit without changing the relay channels, click the Cancel button.
Table 3.4. Relay Output Descriptions

PNNL OS3300 Alpha/Beta Monitoring System Software and Hardware Operations Manual Rev. 0
January 2006 3.14
Function Name Description CAM Function One or more detector count rates were at or below the failure threshold or the
software was not able to communicate with the data acquisition hardware. Alpha Fail The detector count rate was at or below the failure threshold. Beta+Gamma Fail The detector count rate was at or below the failure threshold. Gamma Fail The detector count rate was at or below the failure threshold. Alpha High Rad. The net alpha activity is above the integral alpha activity threshold or
concentration is above concentration threshold. Beta High Rad. The net beta activity is above the integral beta activity threshold or
concentration is above concentration threshold. Sample Low Flow Sample flow rate (scfm) is below the minimum acceptable flow rate. Stack Low Flow Stack flow rate (scfm) is below the minimum acceptable flow rate. High Alpha Integral The net alpha activity is above the integral alpha activity threshold. High Beta Integral The net beta activity is above the integral beta activity threshold. Sample High Flow Sample flow rate (scfm) has exceeded the maximum acceptable flow rate. Stack High Flow Stack flow rate (scfm) has exceeded the maximum acceptable flow rate.
3.3.5 View Drop-Down Menu
The following options are available under the View menu: • Filter Log • Event Files.
3.3.5.1 Filter Log
The Filter Log menu option provides a means for viewing the start and end dates for each filter and for saving to disk the detailed emissions data associated with each filter. The filter log (Figure 3.8) is a table in the database (Section 4.2) that keeps track of information produced when a filter is changed. Each filter used by the CAM is assigned a unique number (listed as FilterNum in the filter log). The date and time the filter is installed are logged as the StartDate, and the date and time the filter are removed are logged as the EndDate. The start and end dates are used to identify specific entries in the CAM database that correspond to the time a specific filter was used.

PNNL OS3300 Alpha/Beta Monitoring System Software and Hardware Operations Manual Rev. 0
January 2006 3.15
Figure 3.8. Filter Data Log Screen
From the filter data log screen (Figure 3.8), the operator can save all long count data and calculations associated with a single filter to a file for archival purposes. The Save Data button will prompt the user for a filter number (Figure 3.9). The filter numbers are in the left-hand column labeled FilterNum. The user is then prompted to provide a name and location for the text file. Data collected after each long count during that filter’s run time are copied from the database to the text file.
Figure 3.9. Select Dialogue Box
Table 3.5 summarizes the data saved to the text file in the order they appear.

PNNL OS3300 Alpha/Beta Monitoring System Software and Hardware Operations Manual Rev. 0
January 2006 3.16
Table 3.5. Filter Log File Parameter Title
Parameter Title in Filter Log File Explanation Date The date the values were logged into the database A-stk-Act The alpha activity released to the stack during the long
count time (μCi) B-stk-Act The beta activity released to the stack during the long
count time (μCi) Stk-Flo-Rate The stack flow rate during the long count time
(standard cubic feet per minute [scfm]) Stk-Flo-Tot The total flow through the stack since the last filter
change (kilo-standard cubic feet [kscf]) AB-Flo-Rate The flow rate through the alpha/beta sampler (cfm) Sample-Total The total volume of air sampled by the alpha/beta
sampler since the last filter change (mP
3P)
Raw-Time The time the values were logged into the database
3.3.5.2 Event Files
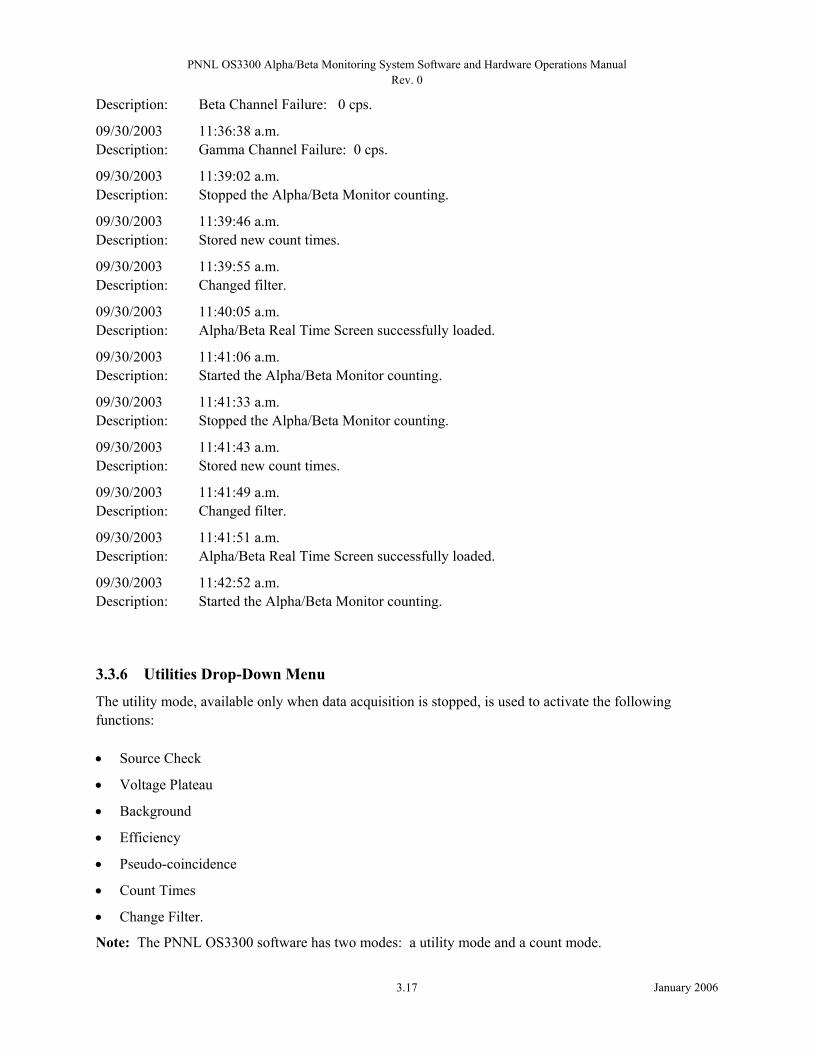
The Event Files menu provides a means for viewing and printing the event log file(s) generated by the PNNL OS3300 software. The event log is a daily file containing information about alarms that occur, user changes to the parameters, and the system status. This log is meant to maintain status reports on the system as a whole. For every software transaction a user makes, a brief description of each event, including the time, date, and action taken, is provided. The filename format is YYMMDD.log where • YY are the last two digits of the year the file was created • MM is the number corresponding to the month the data was created • DD is the day the data were created. After selecting the file to be opened and clicking Open, Windows Notepad P
®P will open the selected file.
From here, the user can review the data and save them to other locations if necessary. The following list provides an example of an event log table. 09/30/2003 Description:
09/30/2003 Description:
09/30/2003 Description:
09/30/2003 Description:
09/30/2003
11:28:29 a.m. Alpha/Beta monitor successfully started.
11:28:29 a.m. Alpha/Beta Real Time Screen successfully loaded.
11:29:30 a.m. Started the Alpha/Beta Monitor counting.
11:36:38 a.m. Alpha Channel Failure: 0 cps.
11:36:38 a.m.
PNNL OS3300 Alpha/Beta Monitoring System Software and Hardware Operations Manual Rev. 0
January 2006 3.17
Description:
09/30/2003 Description:
09/30/2003 Description:
09/30/2003 Description:
09/30/2003 Description:
09/30/2003 Description:
09/30/2003 Description:
09/30/2003 Description:
09/30/2003 Description:
09/30/2003 Description:
09/30/2003 Description:
09/30/2003 Description:
Beta Channel Failure: 0 cps.
11:36:38 a.m. Gamma Channel Failure: 0 cps.
11:39:02 a.m. Stopped the Alpha/Beta Monitor counting.
11:39:46 a.m. Stored new count times.
11:39:55 a.m. Changed filter.
11:40:05 a.m. Alpha/Beta Real Time Screen successfully loaded.
11:41:06 a.m. Started the Alpha/Beta Monitor counting.
11:41:33 a.m. Stopped the Alpha/Beta Monitor counting.
11:41:43 a.m. Stored new count times.
11:41:49 a.m. Changed filter.
11:41:51 a.m. Alpha/Beta Real Time Screen successfully loaded.
11:42:52 a.m. Started the Alpha/Beta Monitor counting.
3.3.6 Utilities Drop-Down Menu
The utility mode, available only when data acquisition is stopped, is used to activate the following functions: • Source Check
• Voltage Plateau
• Background
• Efficiency
• Pseudo-coincidence
• Count Times
• Change Filter.
Note: The PNNL OS3300 software has two modes: a utility mode and a count mode.
PNNL OS3300 Alpha/Beta Monitoring System Software and Hardware Operations Manual Rev. 0
January 2006 3.18
3.3.6.1 Source Check
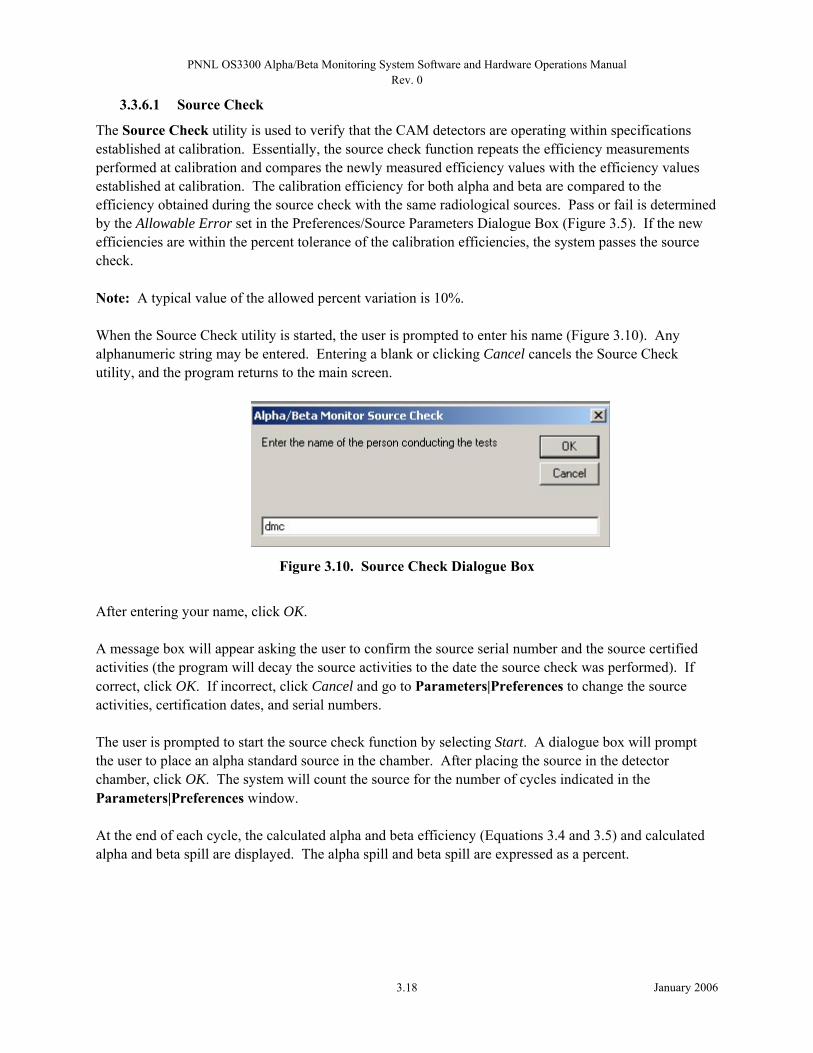
The Source Check utility is used to verify that the CAM detectors are operating within specifications established at calibration. Essentially, the source check function repeats the efficiency measurements performed at calibration and compares the newly measured efficiency values with the efficiency values established at calibration. The calibration efficiency for both alpha and beta are compared to the efficiency obtained during the source check with the same radiological sources. Pass or fail is determined by the Allowable Error set in the Preferences/Source Parameters Dialogue Box (Figure 3.5). If the new efficiencies are within the percent tolerance of the calibration efficiencies, the system passes the source check. Note: A typical value of the allowed percent variation is 10%. When the Source Check utility is started, the user is prompted to enter his name (Figure 3.10). Any alphanumeric string may be entered. Entering a blank or clicking Cancel cancels the Source Check utility, and the program returns to the main screen.
Figure 3.10. Source Check Dialogue Box
After entering your name, click OK. A message box will appear asking the user to confirm the source serial number and the source certified activities (the program will decay the source activities to the date the source check was performed). If correct, click OK. If incorrect, click Cancel and go to Parameters|Preferences to change the source activities, certification dates, and serial numbers. The user is prompted to start the source check function by selecting Start. A dialogue box will prompt the user to place an alpha standard source in the chamber. After placing the source in the detector chamber, click OK. The system will count the source for the number of cycles indicated in the Parameters|Preferences window. At the end of each cycle, the calculated alpha and beta efficiency (Equations 3.4 and 3.5) and calculated alpha and beta spill are displayed. The alpha spill and beta spill are expressed as a percent.

PNNL OS3300 Alpha/Beta Monitoring System Software and Hardware Operations Manual Rev. 0
January 2006 3.19
)(
60/)()(.dpsActivitySourceAlphacorrecteddecay
cpmgAvgAlphaBkcpsAlphaEffAlpha −= (3.4)
where Alpha Source Activity is the source activity entered in the preferences form, and AvgAlphaBkg is the average alpha background measured in the background utility.
)(
60/)()]()([.
dpsActivitySourceBetacorrecteddecaycpmAvgBetaBkgcpsGammaBetacpsBeta
EffBeta−+−
= (3.5)
where Beta Source Activity is the source activity entered in the preferences form, and AvgBetaBkg is the average beta background measured in the background utility. The count time for each cycle and the total remaining time for the source check are displayed on the main screen’s status bar as the short count time and the long count time, respectively. At the end of all count cycles, the average detection efficiency is calculated (Figure 3.11).
Figure 3.11. Source Check Status Box
If the average measured detection efficiency is not within the limits (i.e., the Allowable Limits % in the Preferences/Source Parameters dialogue box) established in the Parameters|Preferences window, the software will indicate that the CAM has failed the source check. If the CAM fails the alpha source check, the dialogue box will state that the alpha source check has failed and will present the user with the options to Retry or Cancel. Retry will take the user back to the beginning of the alpha source routine. Cancel
PNNL OS3300 Alpha/Beta Monitoring System Software and Hardware Operations Manual Rev. 0
January 2006 3.20
will cancel the alpha source check, and the dialogue box will be displayed asking the user if he wants to run the beta source check. The box includes the option to OK or Cancel. Cancel completely exits the source check routine. Upon exiting the source check form, the source check results (including failures) are written to the file “C:\Program Files\OS3300\Source Check mm-dd-yyyy.txt” where mm-dd-yyyy is the month, day, and year the source check was performed. If multiple source checks are performed on the same day, the results are appended to the end of the file like the following example. Alpha Source Check performed on: 9/26/02 By: kk Cycle Alpha Eff. Spillover ----- ------------------- 1 .24 100.00 ----- ------------------- Average: 0.2428 1. PASSED! Beta Source Check performed on: 9/26/02 By: kk Cycle Beta Eff. ----- ---------- 1 0.2007 ----- ---------- Average: 0.2007 Calibration Efficiency ≡ 0.445, FAILED!
3.3.6.2 Voltage Plateau
Caution: Changing the high-voltage setting voids instrument calibration. The high-voltage plateau should not be run unless the instrument is being calibrated. This utility runs a high-voltage plateau to aid the selection of an appropriate high-voltage for each detector: alpha and beta. The gamma plateau is not performed because the same voltage setting is used for both gamma and beta because the gamma detector is located directly behind the beta detector. Because of the gamma detector’s location, both the beta and gamma detectors measure the same gamma field. The same voltage bias that is across the beta detector is also applied to the gamma detector. This is ideal because it will help eliminate differences between the two detectors and reduce the need for a gamma subtraction factor other than one, or unity. A high-voltage plateau establishes the relationship between the detectors’ operating high voltage and its detection efficiency. During calibration, the optimum voltage is found because it is important to know the detectors’ counting rates and efficiencies as a function of the voltage supplied. Once the operating voltage has been selected, the manufacturer recommends conducting annual voltage plateaus to verify detector stability. First, the user must select Acquire|Stop. Under Utilities, select Voltage Plateau and then either the Alpha or Beta option from the drop-down menu. A dialogue box will appear after the user makes a selection (e.g., see Figure 3.12, which depicts the alpha plateau measurement window).
PNNL OS3300 Alpha/Beta Monitoring System Software and Hardware Operations Manual Rev. 0
January 2006 3.21
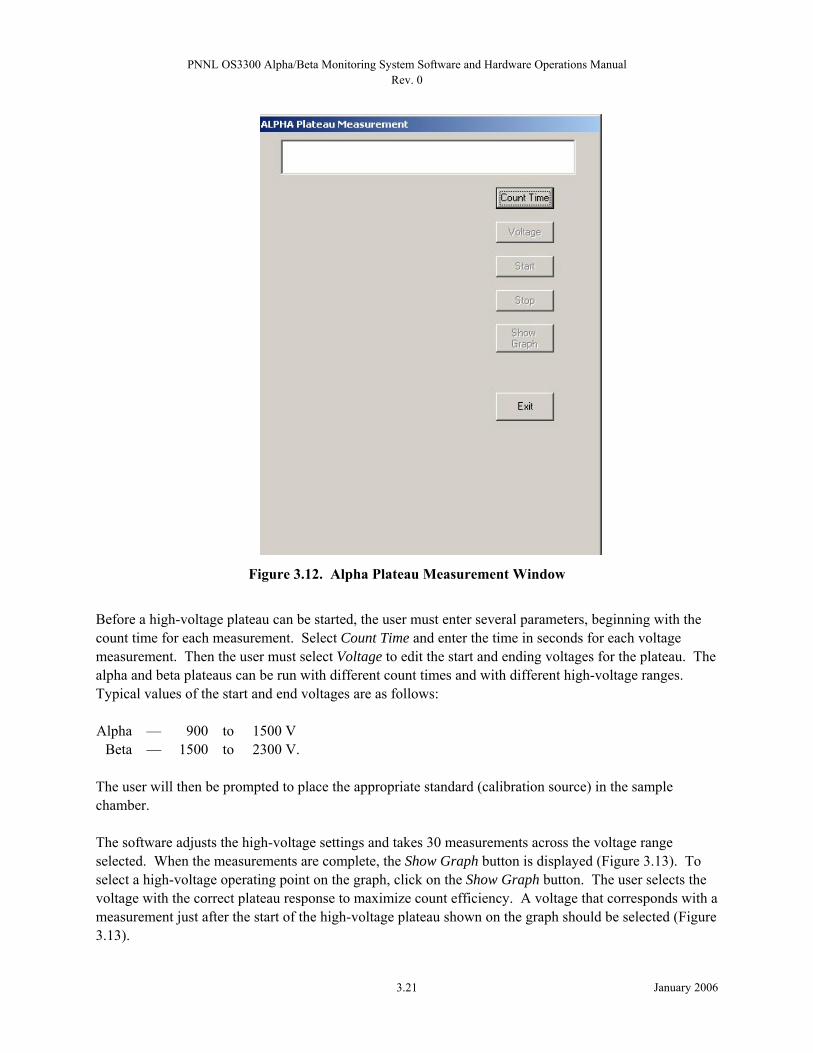
Figure 3.12. Alpha Plateau Measurement Window
Before a high-voltage plateau can be started, the user must enter several parameters, beginning with the count time for each measurement. Select Count Time and enter the time in seconds for each voltage measurement. Then the user must select Voltage to edit the start and ending voltages for the plateau. The alpha and beta plateaus can be run with different count times and with different high-voltage ranges. Typical values of the start and end voltages are as follows: Alpha — 900 to 1500 V
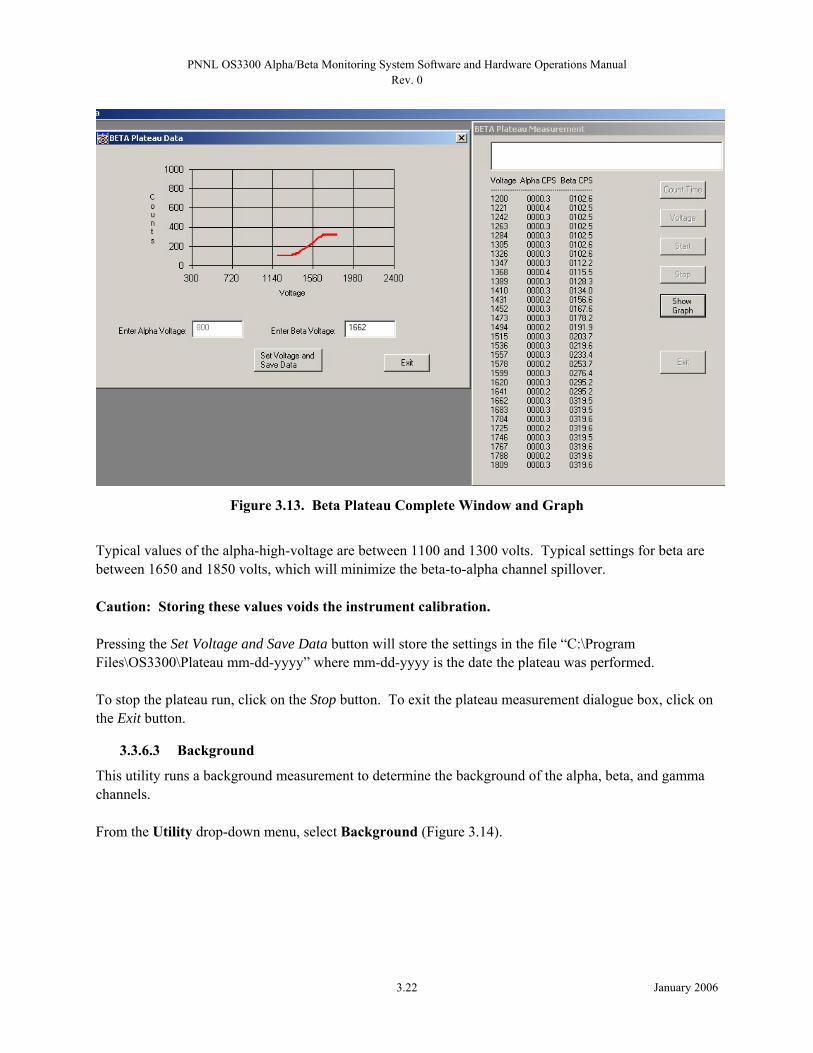
Beta — 1500 to 2300 V. The user will then be prompted to place the appropriate standard (calibration source) in the sample chamber. The software adjusts the high-voltage settings and takes 30 measurements across the voltage range selected. When the measurements are complete, the Show Graph button is displayed (Figure 3.13). To select a high-voltage operating point on the graph, click on the Show Graph button. The user selects the voltage with the correct plateau response to maximize count efficiency. A voltage that corresponds with a measurement just after the start of the high-voltage plateau shown on the graph should be selected (Figure 3.13).
PNNL OS3300 Alpha/Beta Monitoring System Software and Hardware Operations Manual Rev. 0
January 2006 3.22
Figure 3.13. Beta Plateau Complete Window and Graph
Typical values of the alpha-high-voltage are between 1100 and 1300 volts. Typical settings for beta are between 1650 and 1850 volts, which will minimize the beta-to-alpha channel spillover. Caution: Storing these values voids the instrument calibration. Pressing the Set Voltage and Save Data button will store the settings in the file “C:\Program Files\OS3300\Plateau mm-dd-yyyy” where mm-dd-yyyy is the date the plateau was performed. To stop the plateau run, click on the Stop button. To exit the plateau measurement dialogue box, click on the Exit button.
3.3.6.3 Background
This utility runs a background measurement to determine the background of the alpha, beta, and gamma channels. From the Utility drop-down menu, select Background (Figure 3.14).
PNNL OS3300 Alpha/Beta Monitoring System Software and Hardware Operations Manual Rev. 0
January 2006 3.23
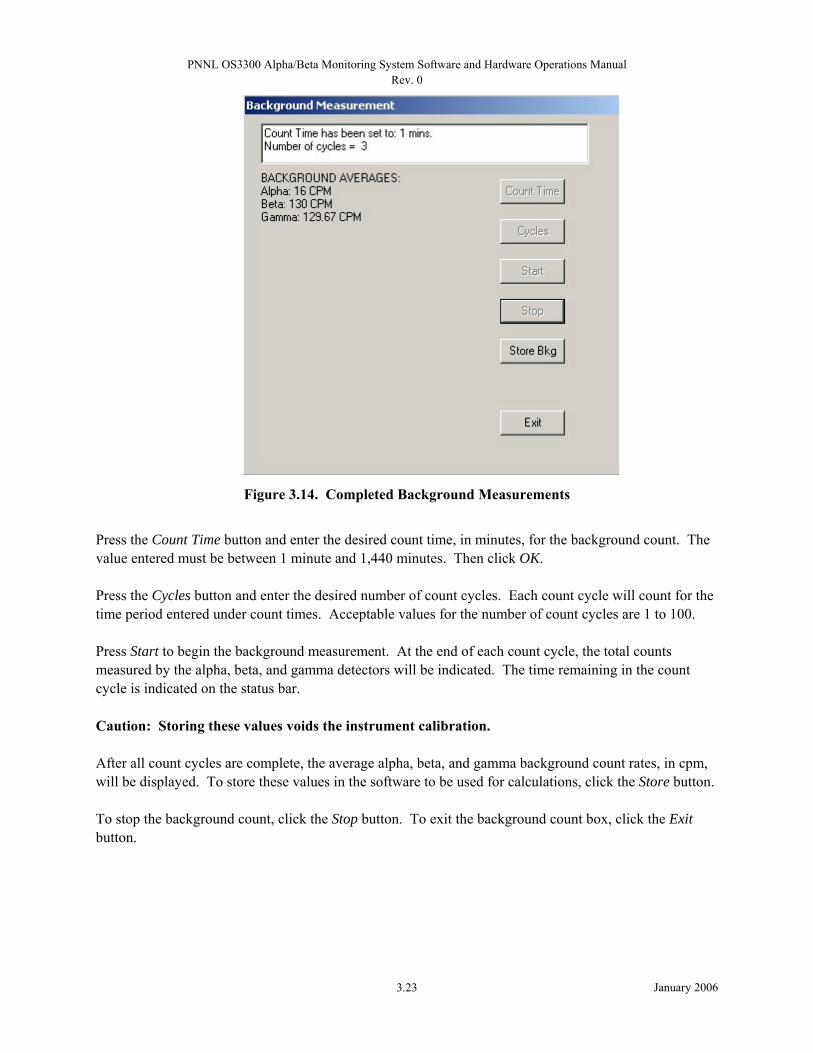
Figure 3.14. Completed Background Measurements
Press the Count Time button and enter the desired count time, in minutes, for the background count. The value entered must be between 1 minute and 1,440 minutes. Then click OK. Press the Cycles button and enter the desired number of count cycles. Each count cycle will count for the time period entered under count times. Acceptable values for the number of count cycles are 1 to 100. Press Start to begin the background measurement. At the end of each count cycle, the total counts measured by the alpha, beta, and gamma detectors will be indicated. The time remaining in the count cycle is indicated on the status bar. Caution: Storing these values voids the instrument calibration. After all count cycles are complete, the average alpha, beta, and gamma background count rates, in cpm, will be displayed. To store these values in the software to be used for calculations, click the Store button. To stop the background count, click the Stop button. To exit the background count box, click the Exit button.

PNNL OS3300 Alpha/Beta Monitoring System Software and Hardware Operations Manual Rev. 0
January 2006 3.24
3.3.6.4 Efficiency
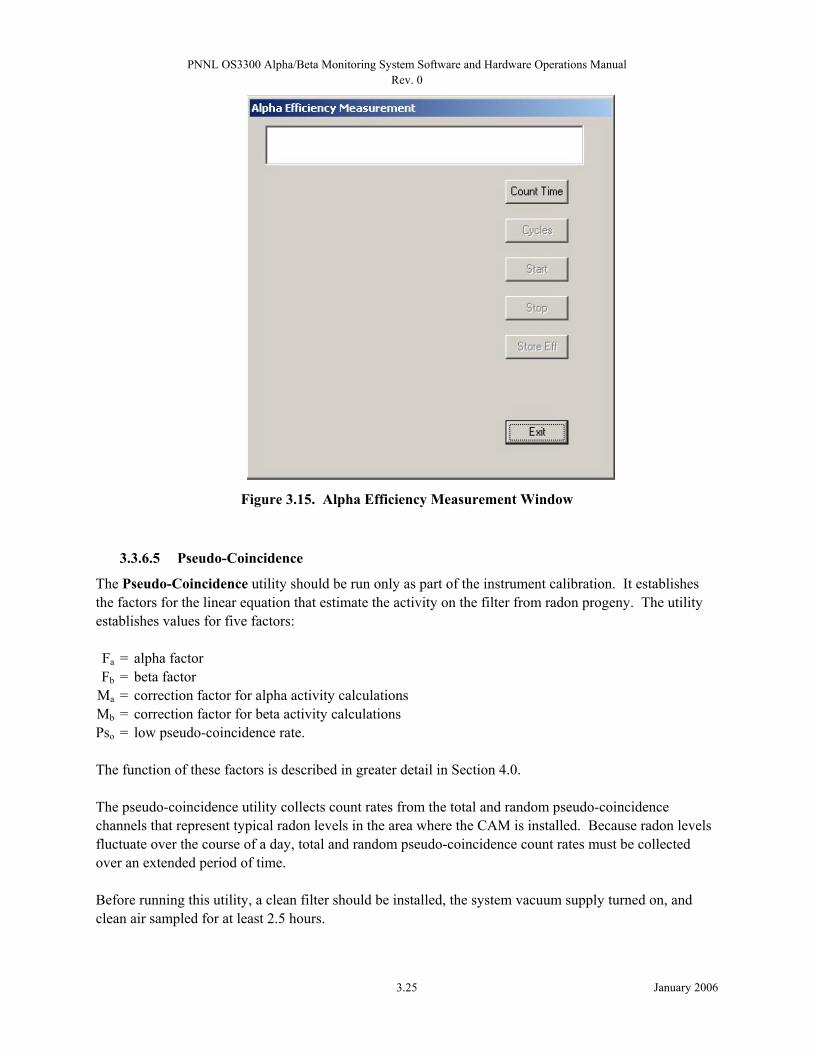
This utility calculates the detection efficiency of the alpha and beta detectors and should be run only as part of the instrument calibration. Caution: Storing these values voids the instrument calibration. From the Utility drop-down menu, select Efficiency and either Alpha (Figure 3.15) or Beta. Click the Count Time button. Enter the desired count time, in minutes, for the efficiency count. The value entered must be between 1 minute and 1,440 minutes. Then click OK. Next, click the Cycles button. Enter the desired number of times the count will cycle. Each cycle will count for the time period under Count Time. Acceptable values for the number of count cycles are from 1 to 100. Press Start to begin the detection efficiency measurement. A message box appears confirming the source serial number and activity. If information is correct, click OK; if incorrect, click cancel and update the source information by selecting Parameters|Preferences (enter correct source parameters in the dialogue box and click OK). Click OK on the second message box once the source is placed in the chamber. The status box will indicate when each efficiency measurement is completed and provide an average efficiency at the end of the counting. To save the efficiency, click the Store Eff. Button. A dialogue box will appear requesting confirmation of storing the values. To stop the efficiency detection count, click the Stop button. To exit the Efficiency Count box, click the Exit button. Alpha efficiency is calculated by subtracting the average alpha background stored in the registry after running the background utility from the alpha channel raw counts and dividing that result by the source activity. Beta efficiency is calculated by subtracting the average beta background stored in the registry from the beta channel raw counts and dividing that result by the source activity. Gamma background (signal from gamma detector) is subtracted from the beta signal when doing the beta efficiency.
PNNL OS3300 Alpha/Beta Monitoring System Software and Hardware Operations Manual Rev. 0
January 2006 3.25
Figure 3.15. Alpha Efficiency Measurement Window
3.3.6.5 Pseudo-Coincidence
The Pseudo-Coincidence utility should be run only as part of the instrument calibration. It establishes the factors for the linear equation that estimate the activity on the filter from radon progeny. The utility establishes values for five factors: F Ba B = alpha factor F Bb B = beta factor
M Ba B = correction factor for alpha activity calculationsM Bb B = correction factor for beta activity calculations PsBo B = low pseudo-coincidence rate. The function of these factors is described in greater detail in Section 4.0. The pseudo-coincidence utility collects count rates from the total and random pseudo-coincidence channels that represent typical radon levels in the area where the CAM is installed. Because radon levels fluctuate over the course of a day, total and random pseudo-coincidence count rates must be collected over an extended period of time. Before running this utility, a clean filter should be installed, the system vacuum supply turned on, and clean air sampled for at least 2.5 hours.

PNNL OS3300 Alpha/Beta Monitoring System Software and Hardware Operations Manual Rev. 0
January 2006 3.26
From the Utility drop-down menu, select Pseudo-Coincidence. Press the Count Time button. Enter the desired count time, in minutes, for each count. The value entered must be between 60 minutes and 300 minutes. Then click OK. Press the Cycles button. Enter the desired number of count cycles. Each count cycle will count for the time period entered under count times. The range of values for the number of count cycles is 10 to 100. Press Start to begin the pseudo-coincidence measurement. The time remaining in the count cycle is indicated on the status bar. After each count cycle finishes, the cycle number and count rates for the alpha, beta, and pseudo-coincidence are displayed on the screen (Figure 3.16). Caution: Storing the pseudo-coincidence results voids the instrument calibration. After all count cycles are finished, the screen below is displayed. To store these values in the registry, press Store Ps-Coin. To stop the pseudo-coincidence count, click the Stop button. To exit the pseudo-coincidence count box, click the Exit button (Figure 3.16).
Figure 3.16. Completed Pseudo-Coincidence Count Window

PNNL OS3300 Alpha/Beta Monitoring System Software and Hardware Operations Manual Rev. 0
January 2006 3.27
3.3.6.6 Count Times
The second mode for PNNL OS3300 software is a count mode. The main count time used in data acquisition is set in the Utility menu. Click on Count Times to enter the desired time, in minutes. For convenience, if only the short count time is entered and the user then clicks OK, the long count time will automatically be set to six times the short count time. Otherwise, the user will need to enter the short count time and then enter an integer multiple of the short count time for the long count time prior to clicking OK. The short count and long count times do not have to be integer values, but this is not recommended; only the multiple between the short count time and the long count time must be an integer. For example, if the short count is set at 3 minutes, the long count needs to be set at 6, 9, 12, or any multiple of 3. After the desired minutes have been entered correctly, clicking OK will result in a message that states the count times you have entered will take effect after acquisition is restarted; otherwise, a message to re-enter appropriate values results. Clicking on Cancel will exit the Count Times window without making any changes (Figure 3.17).
Figure 3.17. Count Time Window
3.3.6.7 Change Filter
The Change Filter function must be performed when an operator needs to change the 8-inch-diameter filter in the CAM. Performing this function accomplishes two goals: it resets the counter for the data acquisition and makes an entry in the filter log. When it is time to change a filter, the user needs to click on Acquire|Stop and select the Utilities|Change Filter. The operator will be prompted to verify because this will reset the current activity integration (Figure 3.18). By clicking Yes, another dialogue box will appear instructing the user to bypass the flow through the detector and change the filter in the LB150D drawer. After doing so, click OK to finish the procedure. New information is automatically recorded to the filter log.

PNNL OS3300 Alpha/Beta Monitoring System Software and Hardware Operations Manual Rev. 0
January 2006 3.28
Figure 3.18. Change Filter Windows in Order of Operation
3.3.7 About Drop-Down Menu
Selecting About provides the user information on the PNNL OS3300 software.
PNNL OS3300 Alpha/Beta Monitoring System Software and Hardware Operations Manual Rev. 0
January 2006 4.1
4.0 Parameters and Calculations
The software performs a number of calculations. This section provides the algorithms used in the software code to display the results of the monitoring system.
4.1 Parameters This section describes raw alpha, raw beta + gamma, raw beta, and raw gamma parameters. The alpha and beta stack activity and the alpha and beta sample concentration are also described.
4.1.1 Raw Alpha
The parameter “RAW CPS-Alpha” displayed on the main screen is the count rate measured from the alpha detector (in cps) during the last short count time (Figure 3.2).
4.1.2 Raw Beta + Gamma
The parameter “RAW CPS-Beta+Gamma” displayed on the main screen is the count rate (in cps) measured from the beta detector during the last short count time. The measured count rate includes interference from gamma radiation (Figure 3.2).
4.1.3 Raw Beta
The parameter “RAW CPS-Beta” displayed on the main screen is the calculated net count rate (in cps) of the beta detector for the last short count time. The displayed value is the difference between the “Beta+Gamma” value and the “Gamma” value (Figure 3.2).
4.1.4 Raw Gamma
The parameter “RAW CPS-Gamma” displayed on the main screen is the count rate (in cps) measured from the gamma detector during the last short count time. The gamma detector is located directly behind the beta detector, so it measures, essentially, the same gamma field as the beta detector. The signal from the gamma detector is subtracted from the signal of the beta detector when “Gamma Bkg Subtract” is enabled (Figure 3.2).
4.1.5 Alpha and Beta Stack Activity
The parameter “Alpha-Stack Activity” (μCi) is the net activity released through the stack during the last long count time (Figure 3.2). This value is compared to the Integral Alpha Activity alarm set point. The value is calculated by summing the net alpha activity measured over each short count time and then scaling the result to obtain the activity released from the stack (Equation 4.1).
meSampleVolu
eStackVolumiityAlphaActivackAlphaActSt
countsshortnum
net
*)(0 ⎥⎦
⎤⎢⎣⎡
=∫
(4.1)

PNNL OS3300 Alpha/Beta Monitoring System Software and Hardware Operations Manual Rev. 0
January 2006 4.2
The parameter “Beta-Stack Activity” (μCi) is the net beta activity released during the last long count time (Figure 3.2). This value is compared to the Integral Beta Activity alarm set point. The value is calculated by summing the net beta activity measured over each short count time and then scaling the result to obtain the activity released from the stack (Equation 4.2).
meSampleVolu
eStackVolumityBetaActivickBetaActSta
countsshortnum
net
*)(0 ⎥⎦
⎤⎢⎣⎡
=∫
(4.2)
4.1.6 Alpha and Beta Sample Concentration
The concentration of alpha activity in the sample is calculated by dividing the net alpha activity measured during the most recent short count time by the sample volume. Assuming isokinetic sampling, the concentration in the sample should equal the concentration in the stack. The concentration is measured in real time, meaning the measurement is calculated to show the delta change in counts by subtracting the previous counts from the current total to arrive at the most recent short count’s concentration. “Alpha Samp Conc” (μCi/ml) is the alpha concentration measured over the last short count time (Figure 3.2). This value is compared to the High-Alpha Radiation alarm set point. “Beta Samp Conc” (μCi/ml) is the beta concentration measured over the last short count time (Figure 3.2). This value is compared to the High-Beta Radiation alarm set point.
4.2 Data Storage The database has four tables: • FilterData • Quality Assurance (QA) Table • RawData • RawDataShortCount. Other data storage includes: • Calibration Data • Pseudo-Coincidence Calculation
4.2.1 Filter Data Table
The filter data table contains the start and end dates for each filter. This database table contains the same information as the filter log, which can be viewed from the normal operation window. Table 4.1 provides filter data descriptions.

PNNL OS3300 Alpha/Beta Monitoring System Software and Hardware Operations Manual Rev. 0
January 2006 4.3
Table 4.1. Filter Data Table
Filter Data Description FilterNum Sequential number assigned to each filter by the database StartDate Date and time the filter was installed in the CAM EndDate Date and time the filter was removed from the CAM
4.2.2 Quality Assurance Table
The quality assurance (QA) table provides a duplicate record of the parameter values stored in the registry and used by the PNNL OS3300 software during calculations (Table 4.2). These values are stored in the QA table for the user’s convenience. When values for various parameters are measured or calculated, they are written to both the QA table and the registry. When the PNNL OS3300 software is started, the values used by the program are read only from the registry (not from the QA table). Editing the QA table will not affect CAM operation because these values are not read from the QA table.
Table 4.2. Quality Assurance Table
QA Identifications QAID Sequential number assigned to each filter by the database AlphaEff Alpha efficiency (cps/Bq) BetaEff Beta efficiency (cps/Bq) AlphaBKG Alpha background (cps) BetaBKG Beta background (cps) AlphaVolt High-voltage setting for alpha detector (V) BetaVolt High-voltage setting for beta detector (V) F Ba B Alpha factor F Bb B Beta factor M Ba B Correction factor for alpha activity calculations M Bb B Correction factor for beta activity calculations PsBo B Lowest pseudo-coincidence count rate (cps) EffDate Date the last efficiency measurement was performed BetaPlatDate Date the beta plateau was performed AlphaPlatDate Date the alpha plateau was performed BKGDate Date the background measurements were performed PCDate Date the pseudo-coincidence factors were set Spillover Alpha spill measured by the efficiency utility. Spillover is the ratio of
beta channel counts to alpha channel counts with only an alpha source present. Spillover is expressed as a fraction
GammaBKG Background measured on the gamma detector (cps)

PNNL OS3300 Alpha/Beta Monitoring System Software and Hardware Operations Manual Rev. 0
January 2006 4.4
4.2.3 Raw Data Long Count
The RawData table stores the results of each long count time (Table 4.3).
Table 4.3. RawData
Parameter Name Units Description RawIndex Unitless Unique identifier assigned by the database AlphaStackAct μCi The alpha activity measured during the last long count time BetaStackAct μCi The beta activity measured during the last long count time CAMStatus Unitless Reserved StackFlowRate cfm Flow rate through the stack. This value is set by the user on the
Alarm|Settings screen. The CAM does not measure the actual flow rate.
StackFlowTotal kscf Total volume of air through the stack since the last filter change SampFlowRate cfm Flow rate of air sampled from the stack and passed through the
alpha/beta CAM. This value is set by the user on the Alarm|Settings SCREEN. The CAM does not measure the actual flow rate
SampleFlowTotal mP
3P Total volume of air sampled by the alpha/beta CAM during the
last long count time RawDate mm/dd/yyy Date information was written to the database RawTime hr:min:sec Time information was written to the database QAID Unitless The identification number of QA data in use at the time this
record was written. Obtained from the QA Table AlphaRAW Counts Total counts of the alpha channel during the last long count time BetaRAW Counts Total counts of the beta channel during the last long count time PCTotRAW Counts Total counts of the pseudo-coincidence channel during the last
long count time PCRandomRAW Counts Total counts of the random pseudo-coincidence channel during
the last long count time CountTime Seconds Long count time in seconds GammaRAW Counts Total counts of the gamma channel during the last long count time
(referred to in some places as the guard channel)
4.2.4 Raw Data Short Count
The RawData Short Count table stores the results of each short count time (Table 4.4).

PNNL OS3300 Alpha/Beta Monitoring System Software and Hardware Operations Manual Rev. 0
January 2006 4.5
Table 4.4. Raw Data Short Count
Parameter Name Units Description RawIndex Unitless Unique identifier AlphaSampConc μCi/ml The alpha concentration measured during the last short count
time BetaSampConc μCi/ml The beta concentration measured during the last short count time StackFlowRate cfm Flow rate through the stack. This value is set by the user on the
Alarm|Settings screen. The CAM does not measure the actual flow rate.
StackFlowTotal kscf Total volume of air through the stack during short count time. SampFlowRate cfm Flow rate of air sampled from the stack and passed through the
alpha/beta CAM. This value is set by the user on the Alarm|Settings screen. The CAM does not measure the actual flow rate.
SampleFlowTotal mP
3 P Total volume of air sampled by the alpha/beta CAM during the
last short count RawDate mm/dd/yyy
y Date information was written to the database
RawTime hr:min:sec Time information was written to the database QAID Unitless The identification number of the QA data in use at the time this
record was written (see QA Table) AlphaRAW Counts Total alpha counts for last short count time BetaRAW Counts Total beta counts for last short count time PCTotRAW Counts Total pseudo-coincidence channel counts for last short count
time PCRandomRAW Counts Total random pseudo-coincidence channel counts for last short
count time CountTime Seconds Time elapsed since last long count time (short count time
multiplied by the number of short count times elapsed since last long count time)
GammaRAW Counts Total gamma counts for last short count time
4.2.5 Calibration Data
Parameters generated during calibration and during CAM operation are stored in the WindowsP
®P registry
(C:\OS3300) and/or the database QA table. Upon running the PNNL OS3300 software, the program will retrieve parameter values from the registry (not from the database). A printed copy of the post calibration registry entries should be maintained to recover from system crashes and/or corrupt files. If the user suspects the calibration data have become corrupt, he should contact the calibration technicians to determine if the calibration is still valid.
4.2.6 The Pseudo-Coincidence Calculation
At the end of the pseudo-coincidence utility, the low pseudo-coincidence factor (Ps Bo B) is set equal to the lowest measured pseudo-coincidence count rate (Ps) (Equation 4.3).

PNNL OS3300 Alpha/Beta Monitoring System Software and Hardware Operations Manual Rev. 0
January 2006 4.6
randomtotal PsPsPs −= (4.3)
where Ps is the net pseudo-coincidence count rate, PsBtotal B is the count rate of the total pseudo-coincidence count rate channel, and PsBrandomB is the count rate of the random pseudo-coincidence count rate channel. During the pseudo-coincidence utility, the filter factor (FBk B) can be assumed to be equal to one if the filter has been installed, and the CAM has operated for at least 2.5 hours before running the pseudo-coincidence utility. Radioactivity on the filter from non-natural sources is calculated with Equation 4.4.
37000*
*1***)60
(
EffPs
PsPsMFFPs
CC
A o
oK
bkgtot
art
⎟⎟⎠
⎞⎜⎜⎝
⎛ −+−−
= (4.4)
where A Bart B = Non-natural activity (alpha or beta) accumulated on the air filter, μCi CBtot B = Total counts from radioactivity on the filter, cps CBbkg B = Background counts, cpm Ps = Pseudo-coincidence rate corrected for random events (determined during each short
measuring time), cps PsBo B = Smallest (or lowest) pseudo-coincidence rate, cps F Bk B = Correction factor for filter change, unitless M = Rate factor (MBa B and M Bb B), unitless F = Pseudo-coincidence factor (F Ba B and F Bb B), unitless Eff = Detection efficiency (set during calibration), cps/Bq 37000 = Conversion factor for correcting Bq to μCi (37000 Bq/μCi). When the pseudo-coincidence utility is run, radon is the only expected radioactivity that accumulates on the filter. Consequently, the calculated result for ABart B should be zero. Also, the filter is installed for at least 2.5 hours before the pseudo-coincidence utility is run, so FBk B equals one. Substituting 0 for ABart B and 1 for F Bk B reduces the equation to Equation 4.5.
⎟⎟⎠
⎞⎜⎜⎝
⎛ −+=−
o
obkgtot Ps
PsPsMFPs
CC *1**
60 (4.5)
Results are stored in the WindowsP
®P registry (C:\OS3300) instead of a database, and the program retrieves
necessary information from the registry (not from the database). A printed copy of the post pseudo-coincidence registry entries should be maintained to recover from system crashes and/or corrupt files. If the user suspects the calibration data have become corrupt, he should contact the calibration technicians to determine if the calibration is still valid.

PNNL OS3300 Alpha/Beta Monitoring System Software and Hardware Operations Manual Rev. 0
January 2006 4.7
4.3 Setting Background Count Times To have a 1% error with background measurements, the background count time needs to be set so that 10,000 counts will be measured in the set time. For example, if the background count time is 1 minute and 100 counts are measured in that time, then 100 cycles with each cycle being 1 minute are needed to measure a total of 10,000 counts.
4.4 General Statistics Discussion for Calculating Total Counts for Specific Error
Radioactive decay and other nuclear reactions are randomly occurring events and must therefore be described quantitatively in statistical terms. Not only is there constant change in the activity of a specific sample because of the half-life of the nuclide(s), but there is also a fluctuation in the decay rate of a particular sample from one instant to the next because of the random nature of radioactive decay. However, if the number of atoms that decay during a particular time period is plotted against the number of times each result was obtained, a bell curve with a normal distribution centered on the average number of events per time period would be obtained (Figure 4.1).
Normal Distribution
-0.010
0.010.020.030.040.050.06
0 20 40 60 80 100 120
Number of Counts
Prob
abili
ty o
f Get
ting
That
Man
y C
ount
s
Figure 4.1. Counts Distribution Example
The total area under the curve represents all measurements. Limits may be placed symmetrically above and below the mean value so that the majority of data (area) lie in between. This banded area represents the chance or possibility that a single new observation would have a value lying between the upper and lower limits. These limits are referred to as the “standard deviation about the mean.” One standard deviation, 1σ, is defined as the area between the upper and lower limits representing 68% of the total area. Therefore, the standard deviation is a measure of the dispersion of randomly occurring events about the mean, and 1σ represents the 68% confidence limit (i.e., there is a 68% confidence level that the measured value will be within the defined range). Similarly, 2σ, two standard deviations, represent the 96% confidence limit. Often, the standard deviation is approximated by the Poisson distribution and is given in Equation 4.6:
PNNL OS3300 Alpha/Beta Monitoring System Software and Hardware Operations Manual Rev. 0
January 2006 4.8
n≡σ (4.6) where σ is the standard deviation, and n is the number of counts observed during the time interval. When n ≥ ~20, the Poisson and normal distributions nearly coincide. Therefore, the relative error can be calculated with Equation 4.7.
nerror 1
≡ (4.7)
where error is the relative error of the observation, and n is the number of counts observed during the time interval. The relative error depends on the total number of counts taken and can be made smaller by counting for longer times to obtain more counts (e.g., if n=10,000, the relative error is 1%). The interested reader is referred to any number of books with a section on radiation statistics, including Radiation Detection and Measurement (Knoll 2000) and Atoms, Radiation, and Radiation Protection (Turner 1986).

PNNL OS3300 Alpha/Beta Monitoring System Software and Hardware Operations Manual Rev. 0
January 2006 5.1
5.0 Theory of Operation
This section provides PNNL equations to calculate alpha and beta activity.
5.1 Alpha Activity This section develops the equation used by the PNNL OS3300 software to calculate alpha activity from non-natural sources on the stack CAM filter. The PNNL OS3300 software calculates two values related to the alpha activity: integrated alpha activity out the stack since the filter was last changed and the concentration of alpha activity in the volume of air passed through the sampler. Alpha activity reported by the PNNL OS3300 software is the alpha activity, accumulated on the filter, from non-natural sources of radioactivity. It is calculated with Equation 5.1.
37000∗−
= −−
EffCC
A radonatotaart (5.1)
where A Bart B = Non-natural alpha activity, μCi CBa-tot B = Total count rate in the alpha channel, cps CBa-radon B = Alpha count rate from radon progeny accumulated on the filter, cps Eff = Detection efficiency (set during calibration), unitless 37000 = Conversion factor for correcting Bq to μCi (37000 Bq / μCi). The count rate from radon progeny collected on the filter (CBa-radon B) is measured with a pseudo-coincidence circuit, which counts the number of beta disintegrations that are accompanied, within a brief time period, by an alpha disintegration.
5.1.1 Pseudo-Coincidence Counting
The radon ( P
222PRn) and thoron (P
220PRn) decay chains decay by alpha emission to very short half-life isotopes
that decay by alpha and beta emissions. In the P
222PRn decay chain, the decay of P
214PBi (a beta emitter) is
followed by the decay of P
214PPo (an alpha emitter with a half-life of 164 μs). Because the half-life of P
214PPo
is 164 μs and because the definition of half-life states that half the atoms decay within one half-life, there is a 50% probability that any particular P
214PBi decay will be accompanied, within 164 μs, by a P
214PPo decay.
Similarly, in the thoron (P
220PRn) decay chain, the decay of P
212PBi (a beta emitter) is followed the decay of
P
212PPo (an alpha emitter with a 0.3 μs half-life). Using the same argument as in the previous paragraph,
50% of the P
212PBi decays are accompanied, within 0.3 μs, by a P
212PPo decay. Within the 164 μs window
while 50% of the P
214PPo (from the radon decay chain) decays following a P
214PBi beta emission, essentially
all P
212PPo atoms from the thoron decay chain will have decayed by alpha emission. Because P
212PBi decays
to an alpha emitter only 64% of the time, only 64% of the P
212PBi decays will be accompanied by an alpha
emitter within 164 μs (again, the 164-μs window is from the radon decay scheme).
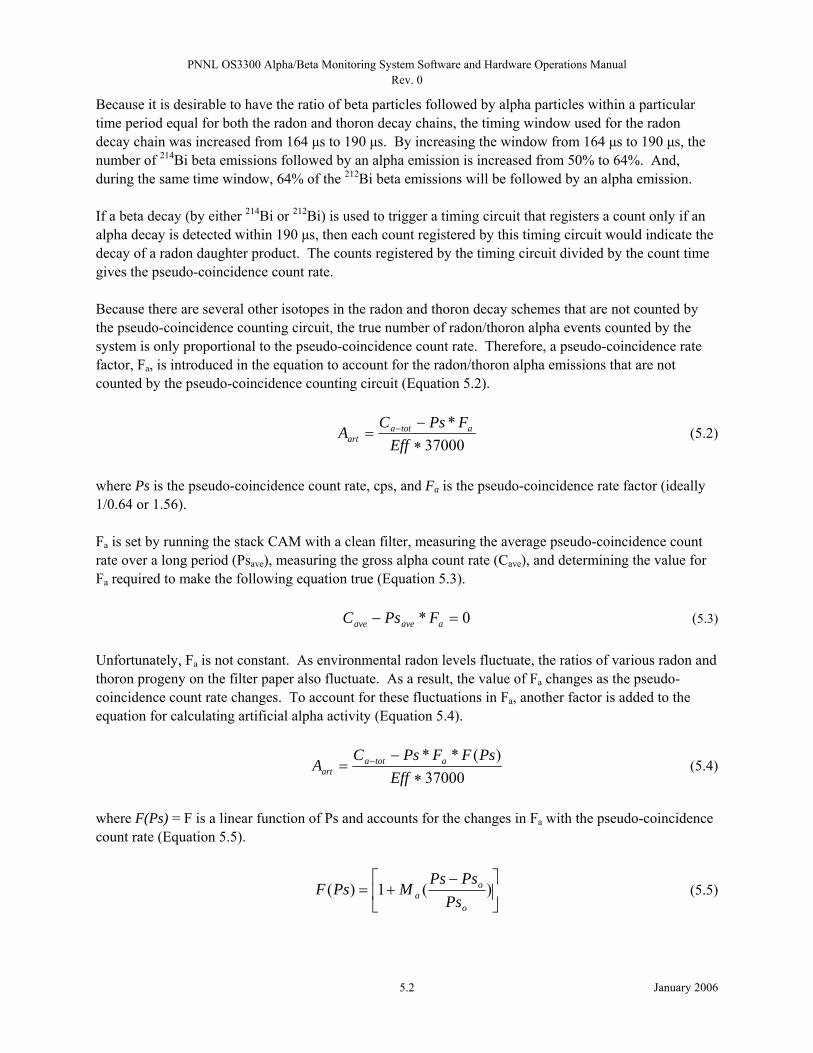
PNNL OS3300 Alpha/Beta Monitoring System Software and Hardware Operations Manual Rev. 0
January 2006 5.2
Because it is desirable to have the ratio of beta particles followed by alpha particles within a particular time period equal for both the radon and thoron decay chains, the timing window used for the radon decay chain was increased from 164 μs to 190 μs. By increasing the window from 164 μs to 190 μs, the number of P
214PBi beta emissions followed by an alpha emission is increased from 50% to 64%. And,
during the same time window, 64% of the P
212PBi beta emissions will be followed by an alpha emission.
If a beta decay (by either P
214PBi or P
212PBi) is used to trigger a timing circuit that registers a count only if an
alpha decay is detected within 190 μs, then each count registered by this timing circuit would indicate the decay of a radon daughter product. The counts registered by the timing circuit divided by the count time gives the pseudo-coincidence count rate. Because there are several other isotopes in the radon and thoron decay schemes that are not counted by the pseudo-coincidence counting circuit, the true number of radon/thoron alpha events counted by the system is only proportional to the pseudo-coincidence count rate. Therefore, a pseudo-coincidence rate factor, FBa B, is introduced in the equation to account for the radon/thoron alpha emissions that are not counted by the pseudo-coincidence counting circuit (Equation 5.2).
37000
*∗−
= −
EffFPsC
A atotaart (5.2)
where Ps is the pseudo-coincidence count rate, cps, and F Ba B is the pseudo-coincidence rate factor (ideally 1/0.64 or 1.56). F Ba B is set by running the stack CAM with a clean filter, measuring the average pseudo-coincidence count rate over a long period (PsBave B), measuring the gross alpha count rate (CBave B), and determining the value for F Ba B required to make the following equation true (Equation 5.3). 0* =− aaveave FPsC (5.3) Unfortunately, FBa B is not constant. As environmental radon levels fluctuate, the ratios of various radon and thoron progeny on the filter paper also fluctuate. As a result, the value of FBa B changes as the pseudo-coincidence count rate changes. To account for these fluctuations in FBa B, another factor is added to the equation for calculating artificial alpha activity (Equation 5.4).
37000
)(**∗
−= −
EffPsFFPsC
A atotaart (5.4)
where F(Ps) = F is a linear function of Ps and accounts for the changes in F Ba B with the pseudo-coincidence count rate (Equation 5.5).
⎥⎦
⎤⎢⎣
⎡ −+= )(1)(
o
oa Ps
PsPsMPsF (5.5)

PNNL OS3300 Alpha/Beta Monitoring System Software and Hardware Operations Manual Rev. 0
January 2006 5.3
where F(Ps) = F is a linear function of Ps and accounts for the changes in F Ba B with the pseudo-coincidence count rate (Equation 5.5), MBa B is the alpha rate factor, unitless, and PsBo B is the lowest pseudo-coincidence count rate, cps. The PNNL OS3300 software calculates M Ba B and F Ba B with linear regression. A detailed description of the calculation is described in Section 5.3.
5.1.2 Time Required for Radon Progeny to Reach Equilibrium
Lastly, one more factor must be added to the equation for calculating non-natural alpha activity. When a fresh filter is installed in the CAM, there is essentially no activity present on the filter. As air is drawn through the filter, radon progeny begin to accumulate. However, it takes time for the radon progeny to decay and for the isotopes counted by the pseudo-coincidence counting circuit to reach equilibrium. The time required for the radon progeny to reach transient equilibrium is accounted for with a filter factor (F Bk B) that is equal to 1.25 immediately after the filter is changed and decreases linearly to 1.0 over the first 2.5 hours of filter use. After the filter has been installed for 2.5 hours, the filter factor is equal to 1.0 until the filter is changed again. The final equation for calculating non-natural alpha activity on the filter paper is in Equation 5.6.
37000*
*1***
EffPs
PsPsMFFPsC
A o
oakatota
art
⎟⎟⎠
⎞⎜⎜⎝
⎛ −+−
=−
(5.6)
where F BkB is the correction factor for filter change, unitless. Equation 5.6 calculates the total activity collected on the air filter, which is synonymous with the total activity in the volume of air sampled from the stack. Because there may be an artificial alpha background from materials in the sample chamber, etc., the alpha background measured at the time of calibration is subtracted from the total alpha signal. In this case, the alpha background is not the background from radon or other naturally occurring alpha emitters; it is from alpha emitters that are inherent to the system (e.g., alpha-emitting contaminants in the construction materials) (Equation 5.7).
37000*
*1***)60
(
EffPs
PsPsMFFPs
CC
A o
oaka
bkgatota
art
⎟⎟⎠
⎞⎜⎜⎝
⎛ −+−−
=
−−
(5.7)
where CBa-bkg B is the alpha background measured during calibration, cpm. The PNNL OS3300 software calculates the beta activity that is released through the stack by multiplying the beta activity on the filter by the ratio of the total volume of air through the stack to the total volume of air through the sampler (Equation 5.12).

PNNL OS3300 Alpha/Beta Monitoring System Software and Hardware Operations Manual Rev. 0
January 2006 5.4
[ ]CimeSampleVolueStackVolumAA artityStackActiv μ⎟⎟⎠
⎞⎜⎜⎝
⎛= * (5.8)
5.2 Beta Activity This section provides the equation used to calculate beta activity collected on the filter from non-natural sources. The activity from non-natural sources is calculated with Equation 5.9.
37000∗
−−= −−
EffCCC
B gammaradonbtotbart (5.9)
where B Bart B = Beta activity from man-made sources, μCi CBb-tot B = Total count rate in the beta channel, cps CBb-radon B = Count rate in the beta channel from radon progeny collected on the filter, cps CBgamma B = Count rate in the beta channel from ambient gamma radiation that contributed to the
beta count rate, cps Eff = Detection efficiency (set during calibration) 37000 = conversion factor for correcting Bq to μCi (37000 Bq / μCi). The gamma contribution to the count rate of the beta channel is measured in a shielded “guard” detector. Because the sensitivities of the beta detector and shielded gamma detector may be different (i.e., in identical fields, the two detectors may have slightly different responses), a gamma factor is used to make the following equation (Equation 5.10) balance. GKCgamma ∗= (5.10)
where G is the count rate in the gamma channel, cps, and K is the gamma factor. Following the example of the alpha activity development, the beta activity is then determined from Equation 5.11.
37000*
*1***)60
(
Eff
GKPs
PsPsMFFPs
CC
B o
obkb
bkgbtotb
art
∗−⎟⎟⎠
⎞⎜⎜⎝
⎛ −+−−
=
−−
(5.11)
where CBb-bkg B is the Beta background measured during calibration, cpm. The PNNL OS3300 software calculates the beta activity that is released through the stack by multiplying the beta activity on the filter by the ratio of the total volume of air through the stack to the total volume of air through the sampler (Equation 5.12).

PNNL OS3300 Alpha/Beta Monitoring System Software and Hardware Operations Manual Rev. 0
January 2006 5.5
[ ]CimeSampleVolueStackVolumBB artityStackActiv μ⎟⎟⎠
⎞⎜⎜⎝
⎛= * (5.12)
5.3 Calculation of Rate Factors (M BaB and M BbB) and Pseudo-Coincidence Factors (FBaB and F BbB)
This section describes the method used by the PNNL OS3300 software to calculate appropriate values for the alpha and beta rate factors (MBa B and M Bb B), and the alpha and beta pseudo-coincidence factors (FBa Band F Bb B). The use of these variables in the alpha and beta activity calculations is described in Sections 3.1 and 3.2. For clarity, and because the alpha and beta factors are calculated in an identical manner, only the variables M Ba B and F Ba B are used in this discussion. However, the calculations are identical for MBb B and F Bb B. Before the PNNL OS3300 software can calculate MBa B and F Ba B, a clean filter must be installed in the CAM, and the CAM must run for at least 2.5 hours. No artificial activity can be present in the air supply during this utility. Because no artificial activity is present, the calculated artificial activity should be 0 (Equation 5.13).
37000*
*1***0
EffPs
PsPsMFFPsC
o
oakatota ⎟⎟
⎠
⎞⎜⎜⎝
⎛ −+−
=−
(5.13)
Because the filter is installed for at least 2.5 hours before this calculation is performed, FBk B equals one, and the equation can be reduced to the following (Equation 5.14):
⎟⎟⎠
⎞⎜⎜⎝
⎛ −+=−
o
oaatota Ps
PsPsMFPsC *1** (5.14)
The PNNL OS3300 software calculates M Ba B and F Ba Bwith linear regression in the following manner. First, assuming no artificial activity (because the CAM ran with a clean filter for at least 2.5 hours before this calculation is performed), Equation 5.14 becomes Equation 5.15:
⎥⎦
⎤⎢⎣
⎡ −+∗∗−= − )(10
o
oaatota Ps
PsPsMFPsC (5.15)
Rearranging the terms results in Equation 5.16:
aaao
aatota FMFPs
FMPs
PsC
∗−+∗
∗=− (5.16)
Comparing Equation 5.16 to the typical linear relation

PNNL OS3300 Alpha/Beta Monitoring System Software and Hardware Operations Manual Rev. 0
January 2006 5.6
bxmy +∗= , results in the following associations (Equation 5.17):
Ps
Cy tota−= , Psx = ,
o
aa
PsFM
m∗
= , aaa FMFb ∗−= (5.17)
The problem then reduces to measurement of total activity, in the absence of artificial activity, and the associated net pseudo-coincidence count rate with corresponding minimum PsBo B. With these measured values, the desired parameters can be determined from Equations 5.18 and 5.19:
oa PsmbF ∗+= (5.18) and
a
oa F
PsmM
∗= (5.19)
PNNL OS3300 Alpha/Beta Monitoring System Software and Hardware Operations Manual Rev. 0
January 2006 6.1
6.0 Software Maintenance
This section describes the requirements for software development, reloading instructions, and maintenance schedules and procedures.
6.1 Software Development Requirements The PNNL OS3300 software was developed with Microsoft Visual Basic 6.0 Professional EditionP
®P for
32-bit Development. As a 32-bit development system, the PNNL OS3300 software is designed to run in the Windows 2000 P
®P or Windows NT P
®P operating environments.
Questions or requests for modifying the source code for the PNNL OS3300 software should be directed to the following: Pacific Northwest National Laboratory P.O. Box 999, Mail Stop J2-25 Richland, WA 99352
6.2 Reloading Instructions If the operating software for the PNNL OS3300 becomes corrupt, fails to function properly, or otherwise needs to be re-installed, the following procedure may be used to perform the necessary setup: 1. Copy the following files to a floppy diskette:
• AlphaBeta97.mdb (The database with all data stored) • C:\OS3300\YYMMDD.LOG (location of log files).
2. Start the WindowsP
®P Control Panel.
3. Double-click the Add/Remove Software option.
4. Select the OS3300 option in the dialogue box.
5. Click the Add/Remove button to remove the software.
6. Click Yes on the confirmation that you want to remove the software.
7. Exit the Control Panel when the software has been removed.
8. Select the Start|Run option of the Windows® operating system.
9. Click Browse.
10. Change to the D:\ drive or applicable drive for a CD in “My Computer.”
11. Double-click the Setup icon in this folder.
12. Click OK from the Run dialogue box.
13. Accept the defaults of the OS3300 setup screens.
14. Click OK when the OS3300 setup has been successfully completed.

PNNL OS3300 Alpha/Beta Monitoring System Software and Hardware Operations Manual Rev. 0
January 2006 6.2
15. Optionally, the PNNL OS3300 software can be added to the Windows® Startup group so each time the Operating System starts, the software will automatically start.
6.3 Maintenance Schedules and Procedures There are six relay outputs controlled by the software. These relays are controlled by a connection to the 25-pin D connector on the LabMaster P
TMP breakout board. These outputs (numbers one through six) are
programmable from the software. Two additional digital outputs are present on the 25-pin D connector, but are not currently used by the software. If any of these relays do not operate correctly (i.e., alarms when there is no alarm or fails to alarm when the level is reached), follow the steps in Table 6.1. If the checklist fails to remedy the problem, contact the factory for further assistance.
Table 6.1 Analog Output Troubleshooting Checklist
Step Procedure If there is a problem, take this next step. 1 Check the ribbon cable connections at
the LabMaster P
TMP card on the rear of
the computer.
Reconnect if loose. Repair damaged connector (e.g., bent or broken pins).
2 Check electrical terminations in the breakout box.
Reconnect loose cables. Repair damaged connector.

PNNL OS3300 Alpha/Beta Monitoring System Software and Hardware Operations Manual Rev. 0
January 2006 7.1
7.0 References
Knoll GF. 2000. Radiation Detection and Measurement, Third Edition. John Wiley & Sons, New York. Turner JE. 1986. Atoms, Radiation, and Radiation Protection, First Edition. Pergamon Press Inc., New York.