pocket rta ultra edition - 4pockets.com - best pda … · changing fft settings pocket rta uses a...
TRANSCRIPT
Pocket RTA Ultra
Pocket RTA Ultra is a highly portable real-time sound analyzer for your PC and Pocket PC. Pocket RTA has many features which can only be found in much more expensive sound analysis software, providing accurate graphical feedback for amateur hi-fi enthusiasts, A/V engineers / installers and electricians. Pocket RTA samples sounds picked up by the built-in microphone or external microphone and then applies a Fourier Transform to the samples to obtain a frequency spectrum. The result is an accurate representation of the sampled sound broken down into its frequency components.
RTA Basics By default Pocket RTA sets the FFT size to 1024 bytes, which means it captures 1024 samples from the microphone before each frequency analysis. At a sample frequency of 8KHz this gives a theoretical distance between consecutive FFT points (resolution) as 8000 / 1024 = 7.8125Hz, and 44100 / 1024 = 43.066Hz at 44.1Khz. So as you can see lowering the sample rate actually reduces the range of frequencies we can detect, but increases accuracy or resolution. This will be explained in more detail later in this documentation.
Another point worth noting is that the maximum frequency that can be analyzed is half that of the sample frequency. This is because each cycle of a sound requires two values, one high and one low in order to generate sound. This is often referred to as the Nylquist frequency. Technical Stuff In order to make best use of this software it is a good idea to understand the concepts behind sound analysis. Pocket RTA samples blocks of data from the microphone and analyses each block using a process called Fast Fourier Transformation in order to determine the frequency spectrum for display. The size of these blocks and the speed at which the data is sampled are all factors controlled by you and influence the speed and accuracy of the final display. Sample Rate - This is the speed at which data is sampled, and is an important factor in determining the range of frequencies that can be displayed. A sample rate of 44Khz would require Pocket RTA to process 44100 bytes of data per second. Because it takes at least two values to create a modulating wave (one high, one low) the maximum frequency you can measure is half that of the sample frequency.

FFT Size - This represents the amount of data we pass to the Fast Fourier algorithm in order to calculate the frequency spectrum. The smaller the FFT size the faster the screen update but with less accurate the results. The larger the FFT size the more accurate the results. Setting this value excessively high would result in it taking more time to gather and process the data and lead to a very unresponsive display. The diagram below represents a series of bins into which the FFT algorithm sorts frequencies during the analysis process. As mentioned earlier if we are sampling data at 44Khz then the maximum measurable frequency is 22Khz. The number of pots is controlled by the FFT size so the more pots the better resolution of each pot. It is this relationship between FFT Size and Sample Frequency which determine the overall resolution of the results. If we are using an FFT size = 2K, then each pot will lie at sample frequency / FFT size intervals as follows:- Resolution = 44100 / 2048 = 21.53Hz
Pocket RTA updates the display every time it receives 'FFT Size' bytes worth of data. You can calculate how long between screen updates as follows:- At 44 KHz sample rate 44100 bytes = 1000ms 512bytes = 1000 * (512 / 44100) = 11.6ms Pocket RTA finally converts the contents of the resulting pots into something more meaningful in order to compare on frequency against another (i.e. decibels).

Changing FFT Settings Pocket RTA uses a default FFT size of 1024 bytes, which might be fine for most applications, but if you require greater accuracy then you should try increasing this setting. The thing to remember is that the more data the FFT processes the more accurate the results but the slower the display. If we only need a rough estimation of frequency then a slower, more responsive display might be preferable.
Press the ‘FFT’ button on the toolbar and then select ‘Settings’ from the popup menu. The FFT Parameters menu will now appear allowing you to configure the FFT Size and Sample Rate.
FFT Settings
RESOLUTION = SAMPLE FREQUENCY / FFT SIZE
TIME CONSTANT = 1000 / RESOLUTION As you can see in the above formulas, both resolution and the time needed to process the data are directly related to the sample frequency and the FFT buffer size. Specifying a low sample frequency and a small buffer size will provide the fastest update but at the expense of accuracy. Decibel Levels - What are they? The decibel (abbreviated as dB) is a logarithmic expression of the ratio between two signals. A decibel is one-tenth of a Bel, a seldom-used unit named for Alexander Graham Bell, inventor of the telephone. A decibel is a ratio, so its absolute value is not really significant. It is just a way of saying one sound is N times louder than another sound. Decibels are calculated using the following formula:-
dB = 20 * log10 (S1 / S2) where S1 is the input signal and S2 is the smallest possible input signal that can be measured. Pocket RTA samples sounds using 16 bit sampling which means there are 65535 distinguishable voltage levels. The maximum dB level measurable is therefore 20*log(65535/1) = 96 dB. By definition an input signal which is as loud as the maximum possible input level has a decibel value of 0db. Any signal which is less than the maximum input is displayed as a negative value on the display. For convenience Pocket RTA therefore displays db values in the range of 0 to -100db. Input Level Pocket RTA gives a constant readout of the input signal using a segmented LED display at the top of the display. A textual readout in decibels is also provided to display the instantaneous peak volume. You should assume a value of 0dB to indicate that clipping has occurred and the sampled sound was distorted in some way.
To the right of the input level is the close button which can be used to exit the program.
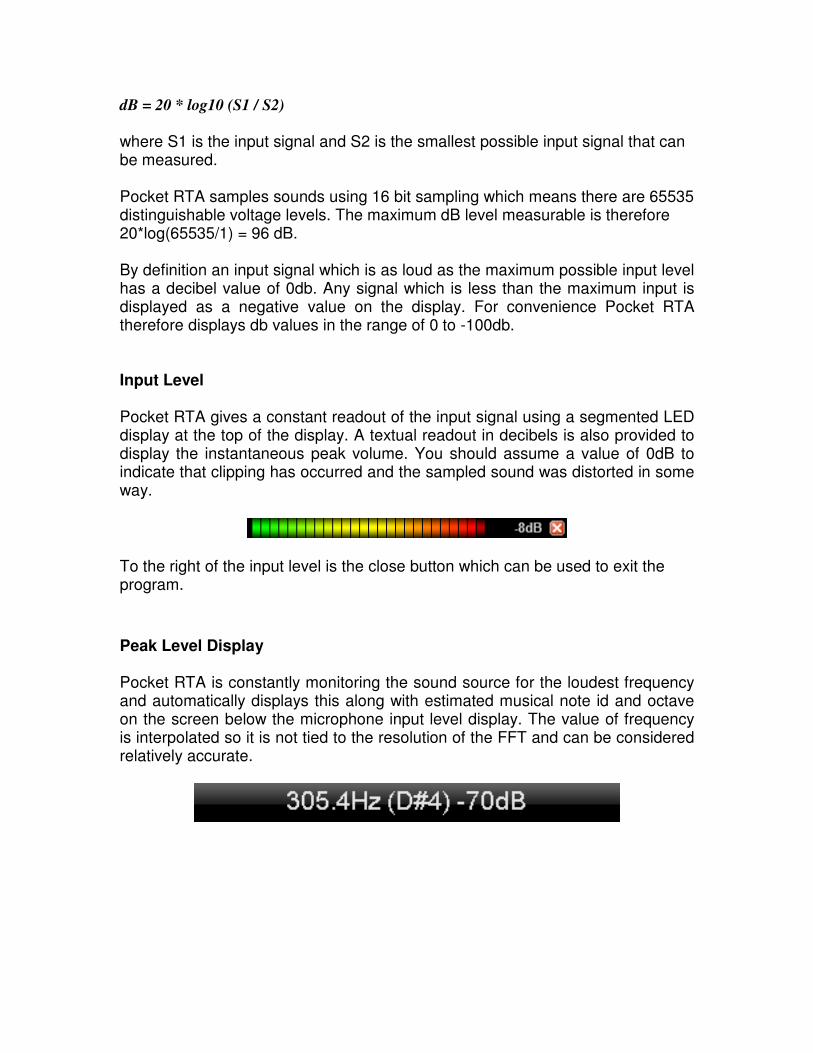
Peak Level Display Pocket RTA is constantly monitoring the sound source for the loudest frequency and automatically displays this along with estimated musical note id and octave on the screen below the microphone input level display. The value of frequency is interpolated so it is not tied to the resolution of the FFT and can be considered relatively accurate.

Narrow band Linear and Logarithmic Display Modes
The Linear and Log display modes are the most useful methods of frequency discrimination. The Linear display plots signal strength against frequency using a linear scale. The downside to this sort of display is that frequencies that fall in range of the human ear tend to be concentrated around the bottom of the display. The Log or Logarithmic display is better suited for analyzing data of a musical nature as the frequencies of consecutive notes are themselves logarithmic. In this mode the distance between consecutive notes is equidistant.
Linear Display Log Display
Scrolling and Zooming You can zoom in or out of a graph you need to use the +/- zoom buttons at the top right of the display. Press the ‘+’ button to zoom in and the ‘–‘ button to zoom out. You can zoom up to 250 times the standard resolution.
Once zoomed in you can scroll the display left of right using the ‘<’ and ‘>’ buttons at the top left of the display. Tap and hold the buttons for continuous scrolling.

Obtaining Accurate Signal Levels Tap and hold in the graphing area to display the signal level for that particular point on the graph. When you do this you will notice a both horizontal and vertical lines appear which you can drag around the screen to display an accurate reading at any given frequency location. If the FFT size is set at 512, then there will be a maximum of 512 locations at which you can obtain readings.
Oversampling (Averaging) This function is used to help make the display more stable and easier to read. It works by taking the average value over a given number of FFT frames. As a general rule, the more jumpy and unstable the trace, the more oversampling is required. Note however that increasing the number of averages also causes real-time displays to respond more slowly.
To change the oversampling setting press the ‘FFT’ button on the toolbar, then select ‘Oversampling’ from the popup menu. You can choose anything from 2 up to 64 times averaging from the popup menu. An alternative to oversampling is smoothing, which will be discussed later in this manual. It uses neighboring samples from the same frame to achieve similar results. This is especially useful for captured impulses.
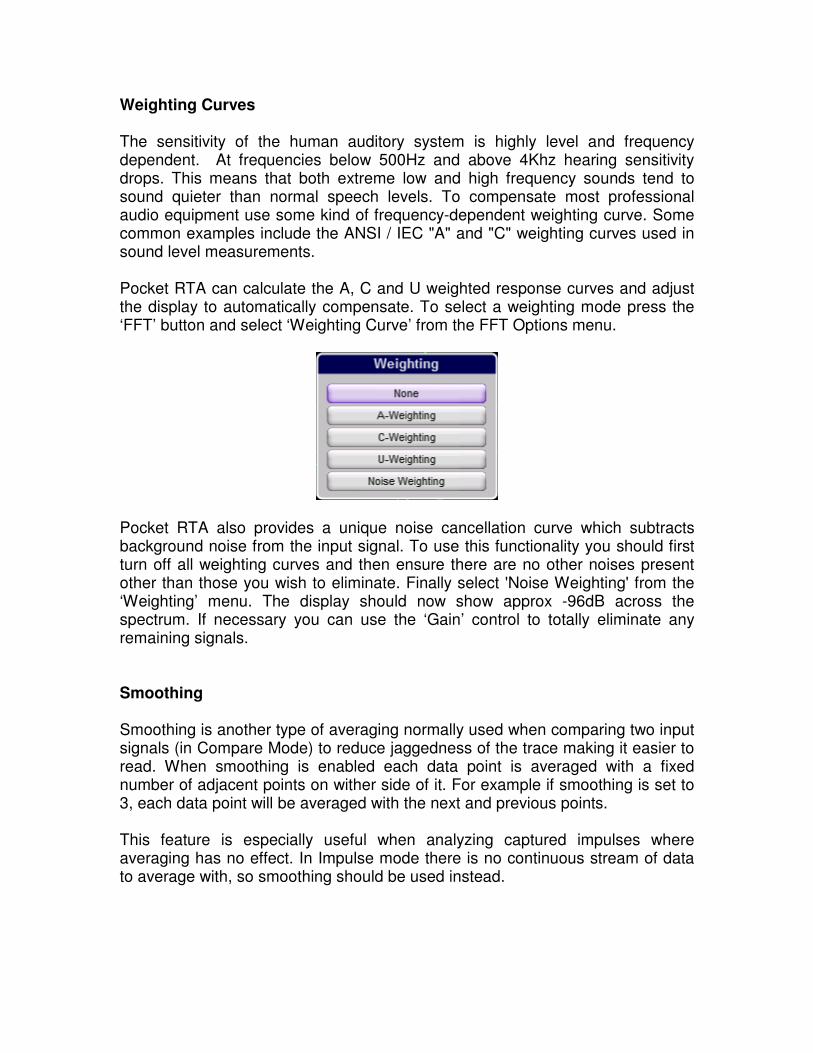
Weighting Curves The sensitivity of the human auditory system is highly level and frequency dependent. At frequencies below 500Hz and above 4Khz hearing sensitivity drops. This means that both extreme low and high frequency sounds tend to sound quieter than normal speech levels. To compensate most professional audio equipment use some kind of frequency-dependent weighting curve. Some common examples include the ANSI / IEC "A" and "C" weighting curves used in sound level measurements. Pocket RTA can calculate the A, C and U weighted response curves and adjust the display to automatically compensate. To select a weighting mode press the ‘FFT’ button and select ‘Weighting Curve’ from the FFT Options menu.
Pocket RTA also provides a unique noise cancellation curve which subtracts background noise from the input signal. To use this functionality you should first turn off all weighting curves and then ensure there are no other noises present other than those you wish to eliminate. Finally select 'Noise Weighting' from the ‘Weighting’ menu. The display should now show approx -96dB across the spectrum. If necessary you can use the ‘Gain’ control to totally eliminate any remaining signals. Smoothing Smoothing is another type of averaging normally used when comparing two input signals (in Compare Mode) to reduce jaggedness of the trace making it easier to read. When smoothing is enabled each data point is averaged with a fixed number of adjacent points on wither side of it. For example if smoothing is set to 3, each data point will be averaged with the next and previous points. This feature is especially useful when analyzing captured impulses where averaging has no effect. In Impulse mode there is no continuous stream of data to average with, so smoothing should be used instead.
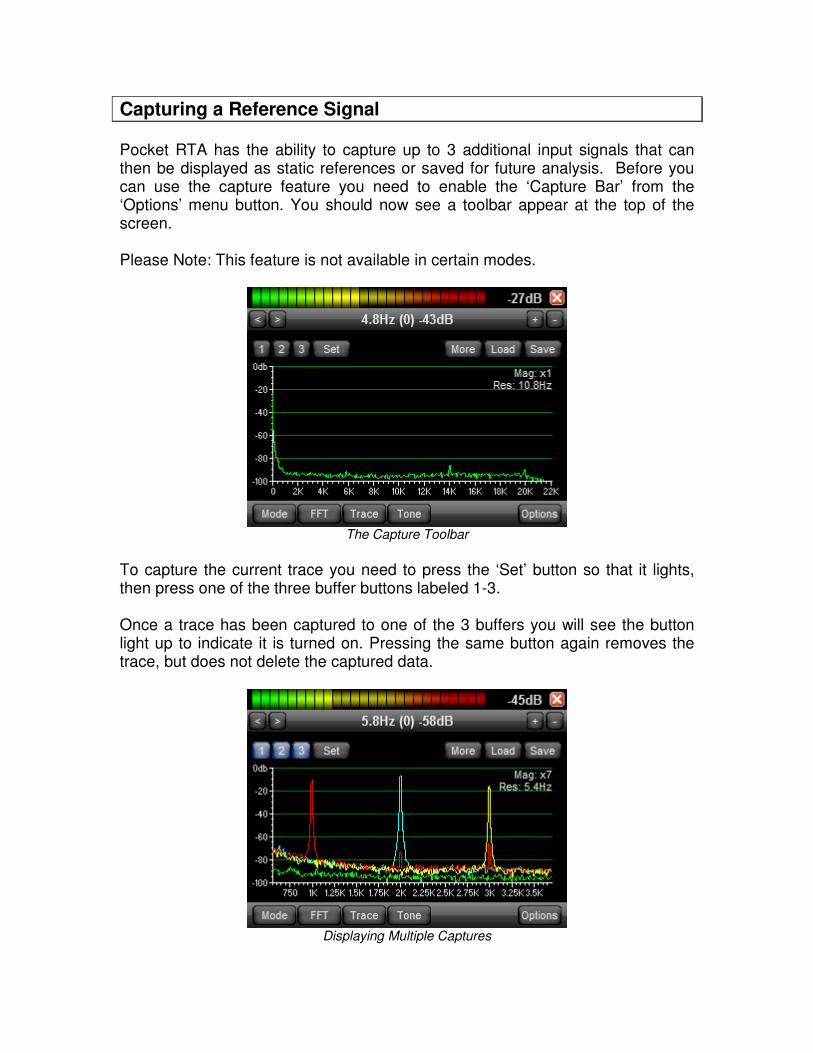
Capturing a Reference Signal Pocket RTA has the ability to capture up to 3 additional input signals that can then be displayed as static references or saved for future analysis. Before you can use the capture feature you need to enable the ‘Capture Bar’ from the ‘Options’ menu button. You should now see a toolbar appear at the top of the screen. Please Note: This feature is not available in certain modes.
The Capture Toolbar
To capture the current trace you need to press the ‘Set’ button so that it lights, then press one of the three buffer buttons labeled 1-3. Once a trace has been captured to one of the 3 buffers you will see the button light up to indicate it is turned on. Pressing the same button again removes the trace, but does not delete the captured data.
Displaying Multiple Captures

Saving Captures Traces You can ‘Load’ and ‘Save’ this captured data to file using the relevant buttons on the capture toolbar. All 3 capture buffers and their ON/OFF status are stored on file and can be recalled at any time. Capture Options The ‘More’ button has other options associated with the captured data. If you press this button the Capture Options menu will appear as below.
Capture Options
Capture Max This option allows you to capture the maximum sound levels over a period of time. If you select this option you will be prompted with a menu asking which of the three capture buffers to use.
Capture begins once a capture buffer is selected from the menu. To turn OFF this feature simply select ‘Compare Max’ again from the capture options menu.
Note: This is an alternative to LEQ capture mode which is discussed in the section on the SPL display mode.
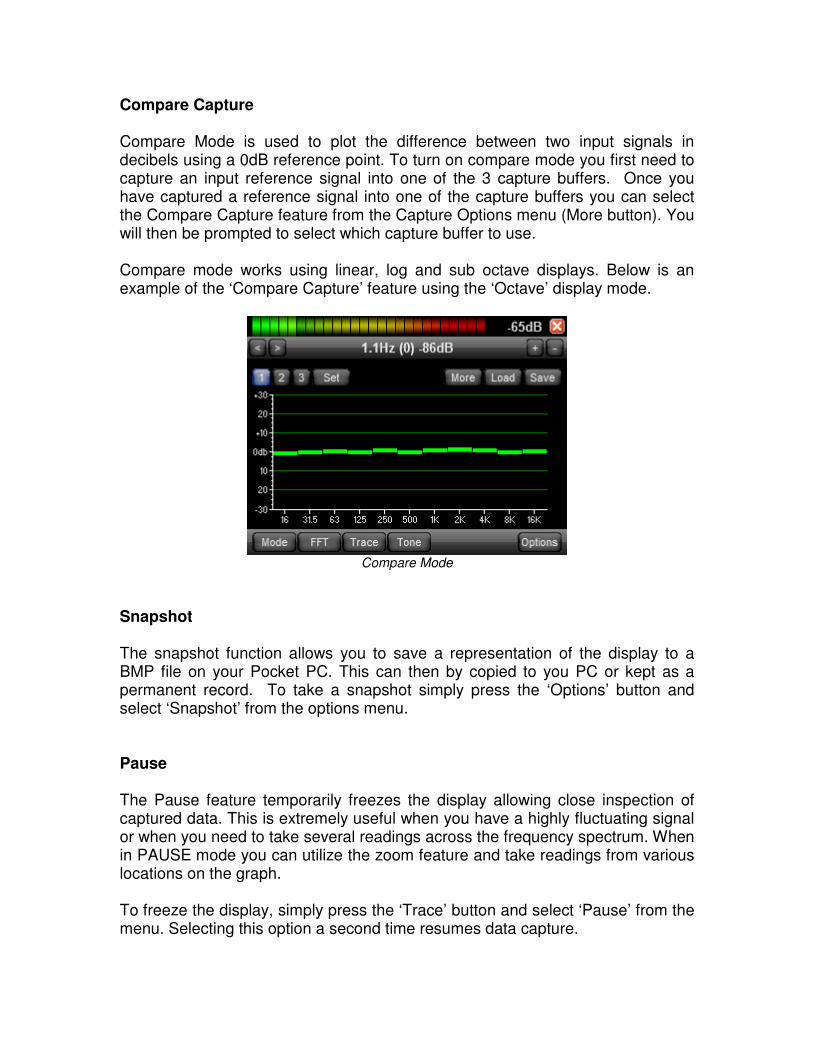
Compare Capture Compare Mode is used to plot the difference between two input signals in decibels using a 0dB reference point. To turn on compare mode you first need to capture an input reference signal into one of the 3 capture buffers. Once you have captured a reference signal into one of the capture buffers you can select the Compare Capture feature from the Capture Options menu (More button). You will then be prompted to select which capture buffer to use. Compare mode works using linear, log and sub octave displays. Below is an example of the ‘Compare Capture’ feature using the ‘Octave’ display mode.
Compare Mode
Snapshot The snapshot function allows you to save a representation of the display to a BMP file on your Pocket PC. This can then by copied to you PC or kept as a permanent record. To take a snapshot simply press the ‘Options’ button and select ‘Snapshot’ from the options menu. Pause The Pause feature temporarily freezes the display allowing close inspection of captured data. This is extremely useful when you have a highly fluctuating signal or when you need to take several readings across the frequency spectrum. When in PAUSE mode you can utilize the zoom feature and take readings from various locations on the graph. To freeze the display, simply press the ‘Trace’ button and select ‘Pause’ from the menu. Selecting this option a second time resumes data capture.
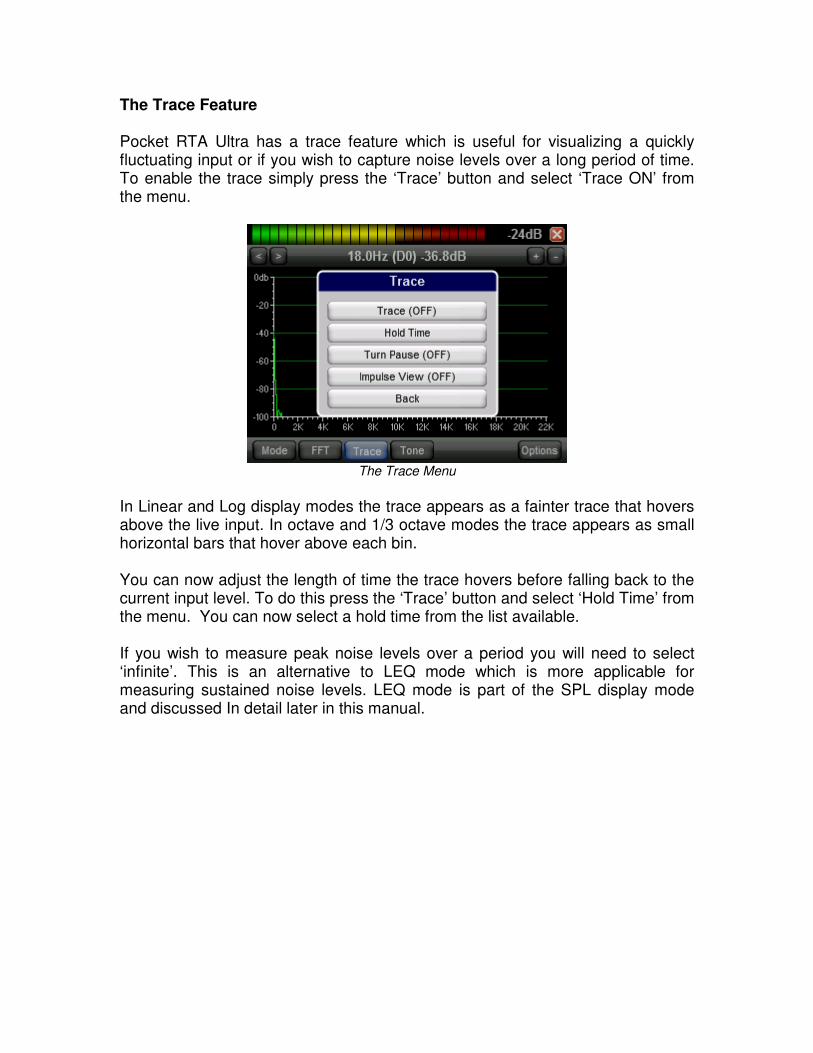
The Trace Feature Pocket RTA Ultra has a trace feature which is useful for visualizing a quickly fluctuating input or if you wish to capture noise levels over a long period of time. To enable the trace simply press the ‘Trace’ button and select ‘Trace ON’ from the menu.
The Trace Menu
In Linear and Log display modes the trace appears as a fainter trace that hovers above the live input. In octave and 1/3 octave modes the trace appears as small horizontal bars that hover above each bin. You can now adjust the length of time the trace hovers before falling back to the current input level. To do this press the ‘Trace’ button and select ‘Hold Time’ from the menu. You can now select a hold time from the list available. If you wish to measure peak noise levels over a period you will need to select ‘infinite’. This is an alternative to LEQ mode which is more applicable for measuring sustained noise levels. LEQ mode is part of the SPL display mode and discussed In detail later in this manual.
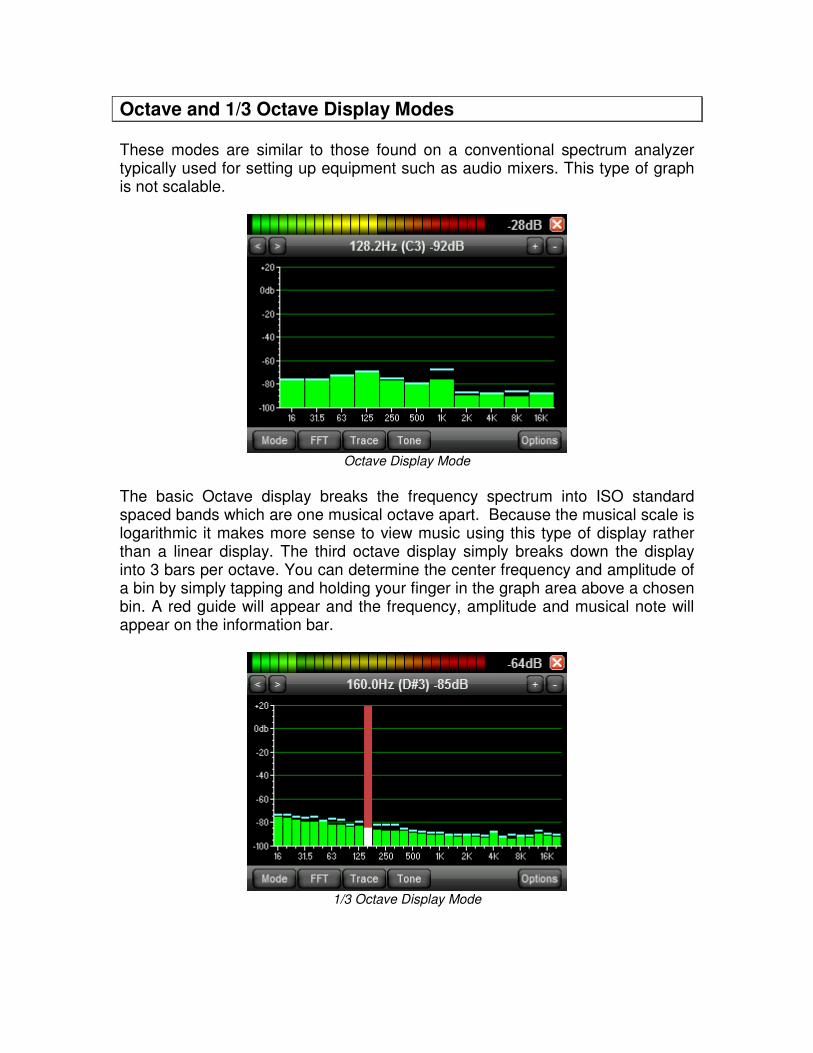
Octave and 1/3 Octave Display Modes These modes are similar to those found on a conventional spectrum analyzer typically used for setting up equipment such as audio mixers. This type of graph is not scalable.
Octave Display Mode
The basic Octave display breaks the frequency spectrum into ISO standard spaced bands which are one musical octave apart. Because the musical scale is logarithmic it makes more sense to view music using this type of display rather than a linear display. The third octave display simply breaks down the display into 3 bars per octave. You can determine the center frequency and amplitude of a bin by simply tapping and holding your finger in the graph area above a chosen bin. A red guide will appear and the frequency, amplitude and musical note will appear on the information bar.
1/3 Octave Display Mode
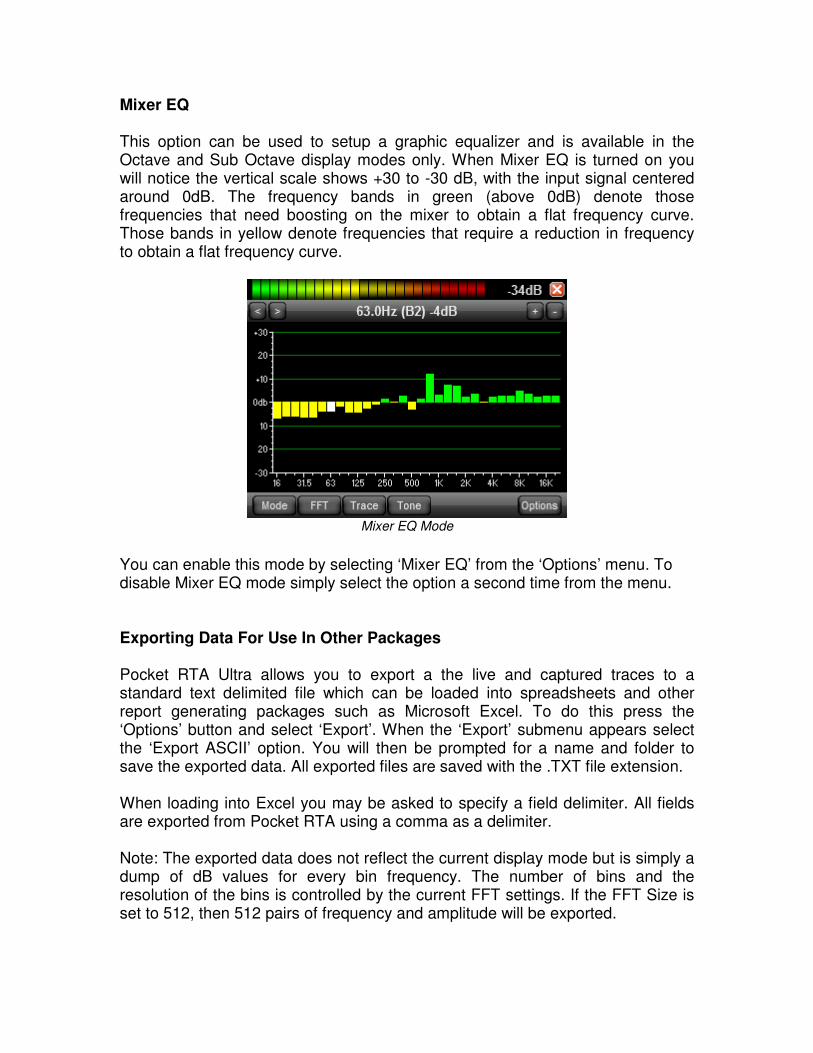
Mixer EQ This option can be used to setup a graphic equalizer and is available in the Octave and Sub Octave display modes only. When Mixer EQ is turned on you will notice the vertical scale shows +30 to -30 dB, with the input signal centered around 0dB. The frequency bands in green (above 0dB) denote those frequencies that need boosting on the mixer to obtain a flat frequency curve. Those bands in yellow denote frequencies that require a reduction in frequency to obtain a flat frequency curve.
Mixer EQ Mode
You can enable this mode by selecting ‘Mixer EQ’ from the ‘Options’ menu. To disable Mixer EQ mode simply select the option a second time from the menu. Exporting Data For Use In Other Packages Pocket RTA Ultra allows you to export a the live and captured traces to a standard text delimited file which can be loaded into spreadsheets and other report generating packages such as Microsoft Excel. To do this press the ‘Options’ button and select ‘Export’. When the ‘Export’ submenu appears select the ‘Export ASCII’ option. You will then be prompted for a name and folder to save the exported data. All exported files are saved with the .TXT file extension. When loading into Excel you may be asked to specify a field delimiter. All fields are exported from Pocket RTA using a comma as a delimiter. Note: The exported data does not reflect the current display mode but is simply a dump of dB values for every bin frequency. The number of bins and the resolution of the bins is controlled by the current FFT settings. If the FFT Size is set to 512, then 512 pairs of frequency and amplitude will be exported.
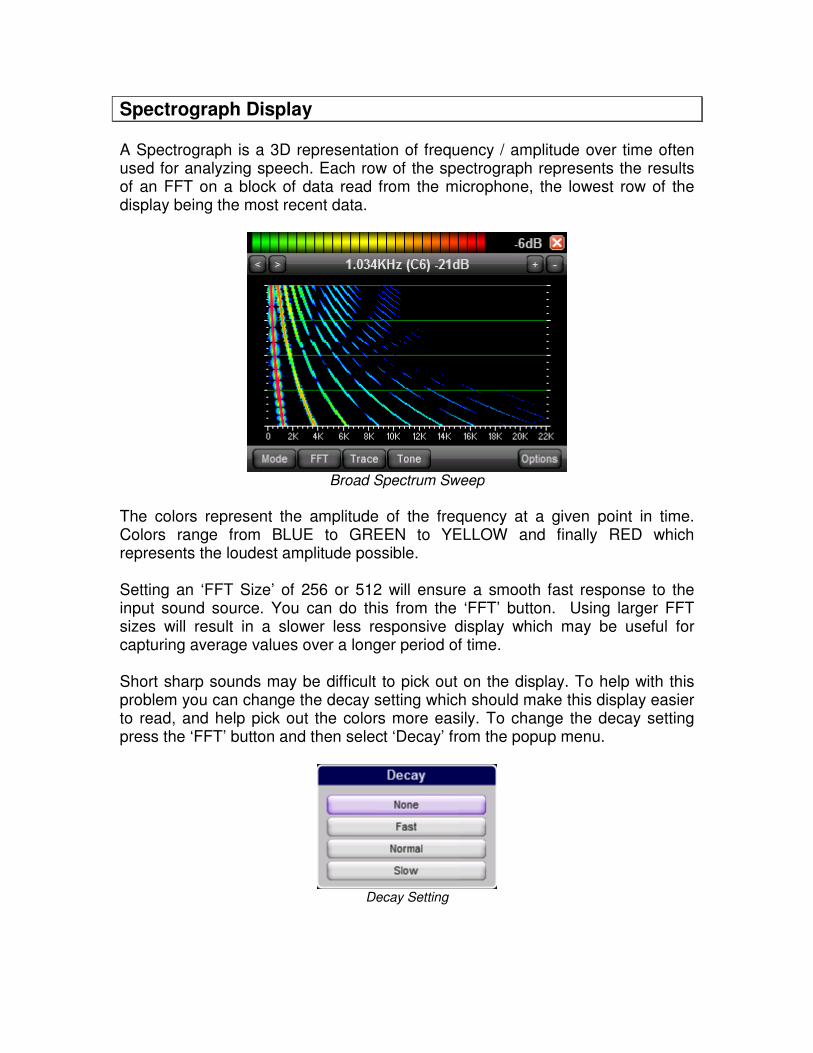
Spectrograph Display A Spectrograph is a 3D representation of frequency / amplitude over time often used for analyzing speech. Each row of the spectrograph represents the results of an FFT on a block of data read from the microphone, the lowest row of the display being the most recent data.
Broad Spectrum Sweep
The colors represent the amplitude of the frequency at a given point in time. Colors range from BLUE to GREEN to YELLOW and finally RED which represents the loudest amplitude possible. Setting an ‘FFT Size’ of 256 or 512 will ensure a smooth fast response to the input sound source. You can do this from the ‘FFT’ button. Using larger FFT sizes will result in a slower less responsive display which may be useful for capturing average values over a longer period of time. Short sharp sounds may be difficult to pick out on the display. To help with this problem you can change the decay setting which should make this display easier to read, and help pick out the colors more easily. To change the decay setting press the ‘FFT’ button and then select ‘Decay’ from the popup menu.
Decay Setting
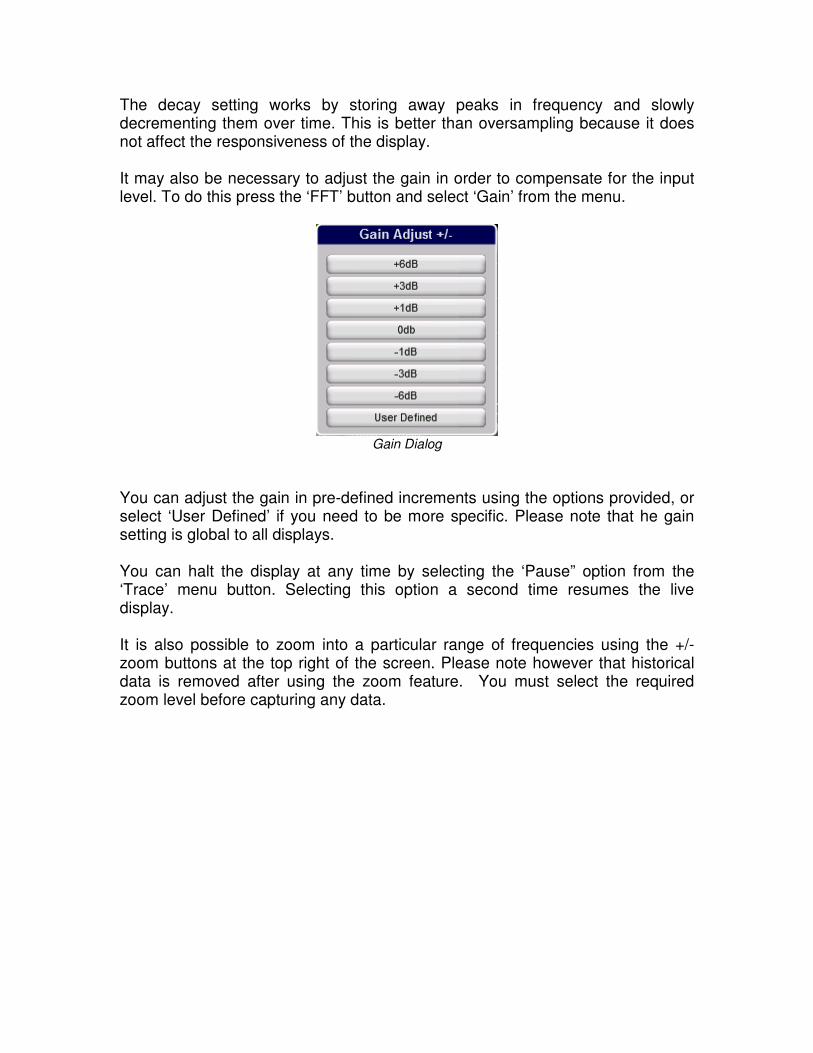
The decay setting works by storing away peaks in frequency and slowly decrementing them over time. This is better than oversampling because it does not affect the responsiveness of the display. It may also be necessary to adjust the gain in order to compensate for the input level. To do this press the ‘FFT’ button and select ‘Gain’ from the menu.
Gain Dialog
You can adjust the gain in pre-defined increments using the options provided, or select ‘User Defined’ if you need to be more specific. Please note that he gain setting is global to all displays. You can halt the display at any time by selecting the ‘Pause” option from the ‘Trace’ menu button. Selecting this option a second time resumes the live display. It is also possible to zoom into a particular range of frequencies using the +/- zoom buttons at the top right of the screen. Please note however that historical data is removed after using the zoom feature. You must select the required zoom level before capturing any data.
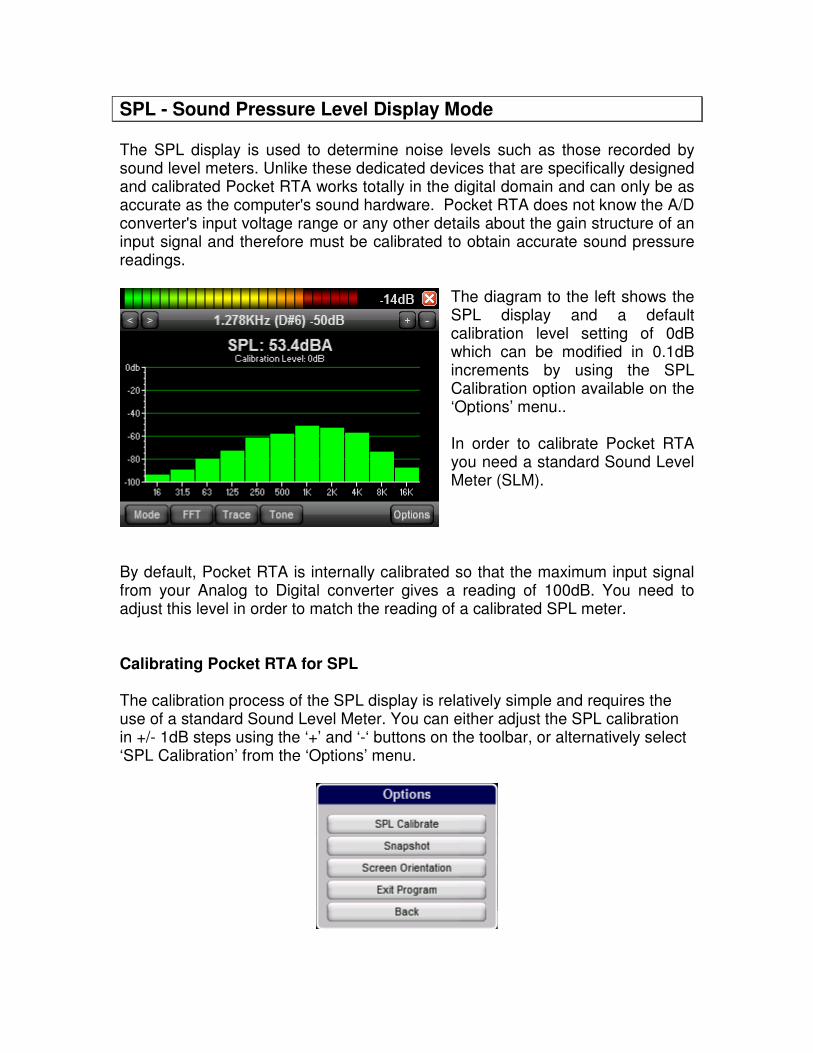
SPL - Sound Pressure Level Display Mode The SPL display is used to determine noise levels such as those recorded by sound level meters. Unlike these dedicated devices that are specifically designed and calibrated Pocket RTA works totally in the digital domain and can only be as accurate as the computer's sound hardware. Pocket RTA does not know the A/D converter's input voltage range or any other details about the gain structure of an input signal and therefore must be calibrated to obtain accurate sound pressure readings.
The diagram to the left shows the SPL display and a default calibration level setting of 0dB which can be modified in 0.1dB increments by using the SPL Calibration option available on the ‘Options’ menu.. In order to calibrate Pocket RTA you need a standard Sound Level Meter (SLM).
By default, Pocket RTA is internally calibrated so that the maximum input signal from your Analog to Digital converter gives a reading of 100dB. You need to adjust this level in order to match the reading of a calibrated SPL meter. Calibrating Pocket RTA for SPL The calibration process of the SPL display is relatively simple and requires the use of a standard Sound Level Meter. You can either adjust the SPL calibration in +/- 1dB steps using the ‘+’ and ‘-‘ buttons on the toolbar, or alternatively select ‘SPL Calibration’ from the ‘Options’ menu.

The SPL calibration display allows you to adjust the calibration level in 0.1dB increments until the Pocket RTA readout matches that of the SLM. Please Note: SPL is only as accurate as the hardware you are running on so it is it is not possible to achieve results which are as good as a dedicated SPL meter. A typical Pocket PC internal microphone is not as sensitive to extreme low and high frequencies as dedicated hardware, so should be considered as a good approximation. Using SPL If the sound source contains short bursts of sound or you are interested in peak readings then set ‘Oversampling’ to Off and ‘Decay’ to Fast. This is roughly what you would expect from a SLM set to SLOW mode. Set ‘Oversampling’ to 16 or higher to obtain the equivalent of an SLM set to FAST mode. By default 'A Weighting' is selected when you enter SPL mode. A weighting is used for checking noise levels whereas 'C Weighting' is used for measuring levels of musical material. LEQ Mode LEQ is probably most commonly referred to as Equivalent Continuous Sound Level. It is defined as the notional sound pressure level which, if maintained constant over a given time, delivers the same amount of acoustic energy at some point as the time-varying sound pressure level would deliver at the same point and over the same period of time. Put simply it simply averages SPL over a specified period of time. Whilst in SPL Mode, select ‘LEQ’ from the ‘Options’ menu and the display should look something like the image below.
SPL in LEQ Mode
Once LEQ mode is activated you will notice the ‘Start’ and ‘Reset’ buttons at the top of the screen. You will also see the current SPL levels displayed in YELLOW in the display area. Press the ‘Start’ button to begin the logging process and the clock will begin counting up from 0:00:00. As time progresses the current LEQ values for each band will appear in green within the graphing area. You can precisely measure the LEQ level of any frequency band be tapping and holding on a particular band. Press the ‘Stop’ button to end logging. You can freely start and stop the clock as often as you like whilst taking readings. Finally press ‘Reset’ to reset the clock. Selecting ‘LEQ’ a second time from the ‘Options’ menu will exit this mode and return to normal the SPL view. LEQ mode is also cancelled when changing to other display modes.
NOTE: It is also possible to enable the trace feature, setting the hold time to INFINATE in order to capture the maximum SPL levels, whilst at the same time as gathering LEQ values.
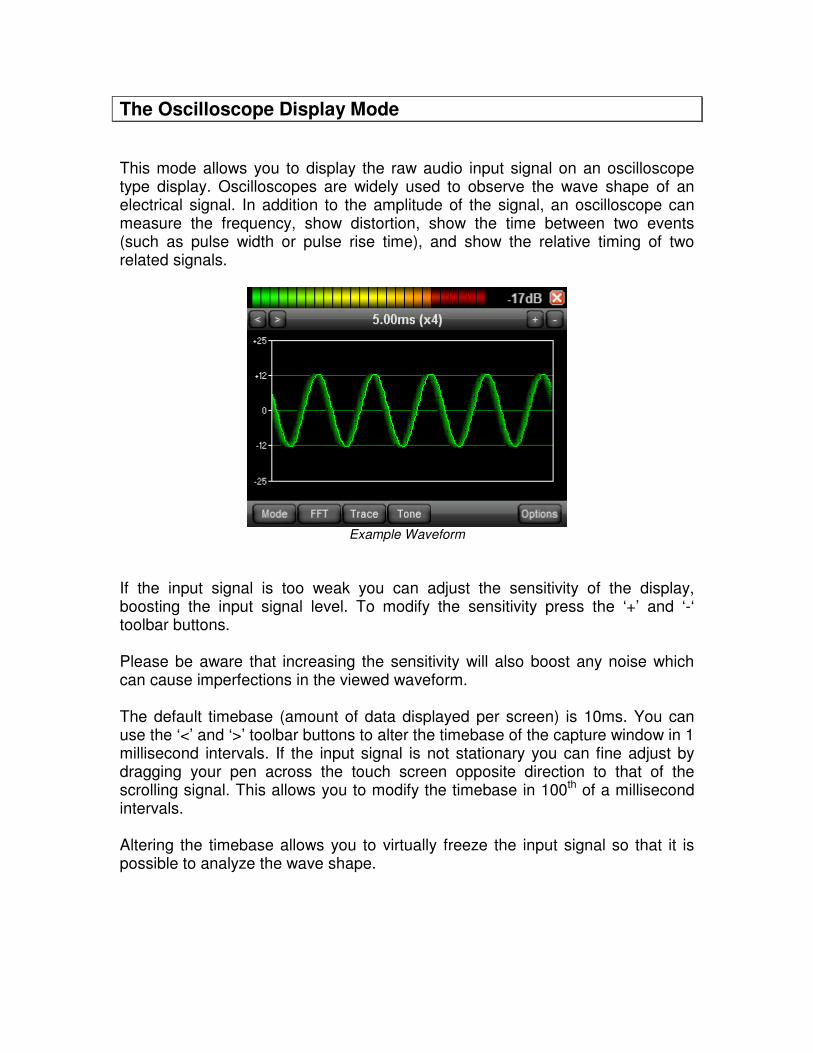
The Oscilloscope Display Mode This mode allows you to display the raw audio input signal on an oscilloscope type display. Oscilloscopes are widely used to observe the wave shape of an electrical signal. In addition to the amplitude of the signal, an oscilloscope can measure the frequency, show distortion, show the time between two events (such as pulse width or pulse rise time), and show the relative timing of two related signals.
Example Waveform
If the input signal is too weak you can adjust the sensitivity of the display, boosting the input signal level. To modify the sensitivity press the ‘+’ and ‘-‘ toolbar buttons. Please be aware that increasing the sensitivity will also boost any noise which can cause imperfections in the viewed waveform. The default timebase (amount of data displayed per screen) is 10ms. You can use the ‘<’ and ‘>’ toolbar buttons to alter the timebase of the capture window in 1 millisecond intervals. If the input signal is not stationary you can fine adjust by dragging your pen across the touch screen opposite direction to that of the scrolling signal. This allows you to modify the timebase in 100th of a millisecond intervals. Altering the timebase allows you to virtually freeze the input signal so that it is possible to analyze the wave shape.

Screen Modes
Pocket RTA Ultra allows you to rotate the screen so that the program can run in normal, rotated and even inverted modes. To do this select ‘Screen Orientation’ from the ‘Options’ menu. On the Pocket PC you will be asked to choose between Normal, Rotate Left, Rotate Right and Inverted modes. The PC version allows you to actually specify a screen resolution rather than an orientation.
PC Version in wide screen mode
In every other respect the PC version of Pocket RTA Ultra is the same as that of the Pocket PC version.
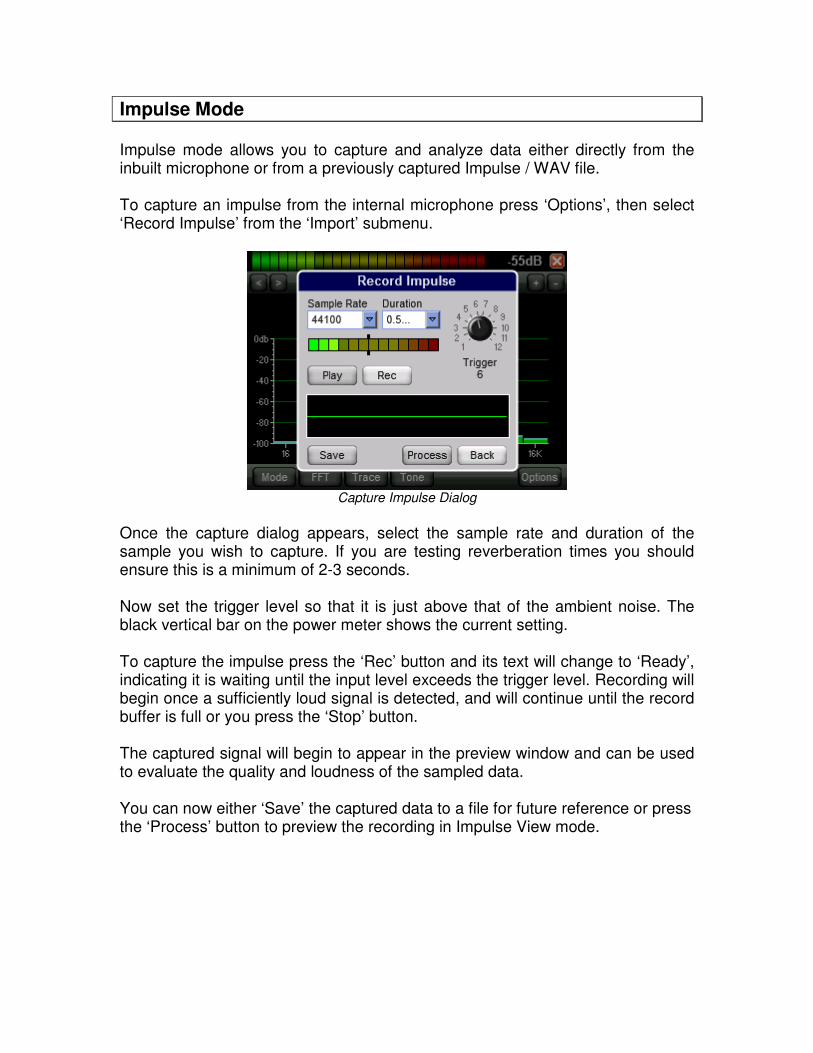
Impulse Mode Impulse mode allows you to capture and analyze data either directly from the inbuilt microphone or from a previously captured Impulse / WAV file. To capture an impulse from the internal microphone press ‘Options’, then select ‘Record Impulse’ from the ‘Import’ submenu.
Capture Impulse Dialog
Once the capture dialog appears, select the sample rate and duration of the sample you wish to capture. If you are testing reverberation times you should ensure this is a minimum of 2-3 seconds. Now set the trigger level so that it is just above that of the ambient noise. The black vertical bar on the power meter shows the current setting. To capture the impulse press the ‘Rec’ button and its text will change to ‘Ready’, indicating it is waiting until the input level exceeds the trigger level. Recording will begin once a sufficiently loud signal is detected, and will continue until the record buffer is full or you press the ‘Stop’ button. The captured signal will begin to appear in the preview window and can be used to evaluate the quality and loudness of the sampled data. You can now either ‘Save’ the captured data to a file for future reference or press the ‘Process’ button to preview the recording in Impulse View mode.

Impulse Data in SPL Mode
The above image shows the captured data displayed at the top of the SPL screen, and you can freely change between modes whilst the Impulse View is active. The Impulse data is split into slices which are governed by the current FFT Size settings. Each slice can be analyzed by tapping in the sample preview window, or by pressing the ‘<’ (previous) and ‘>’ (next) slice buttons to the left and right of the preview. The ‘+’ and ‘-‘ buttons can be used to zoom in and out of the preview. When analyzing data in this fashion there are a few things you need to know.
1) You cannot change the FFT sample rate whilst in Impulse mode because the sample rate is governed by the sample data itself.
2) Averaging has no effect in this mode, so values will fluctuate when moving from one slice to another. To combat this you can use the ‘Smoothing’ option if you wish.
3) Select ‘Impulse View (ON/OFF)’ from the ‘Trace’ menu in order to return to standard live viewing modes.
You can freely switch between ‘Impulse View’ and ‘Live View’ and the captured data will remain in memory.
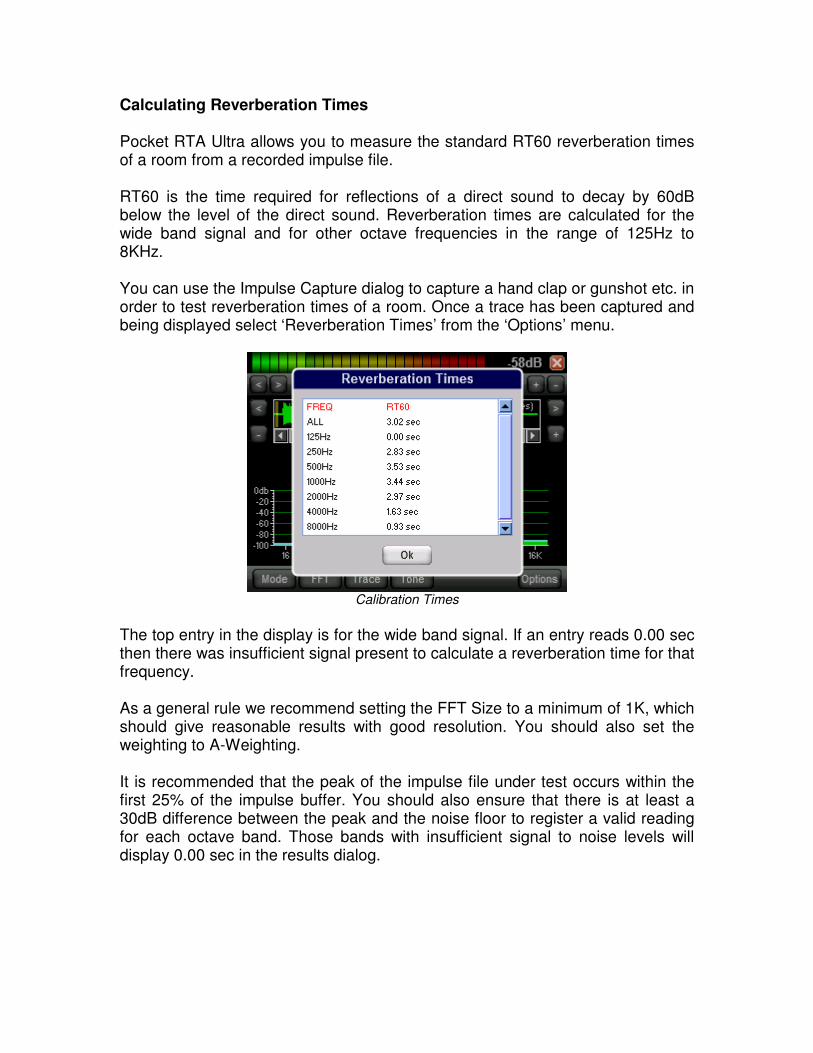
Calculating Reverberation Times Pocket RTA Ultra allows you to measure the standard RT60 reverberation times of a room from a recorded impulse file. RT60 is the time required for reflections of a direct sound to decay by 60dB below the level of the direct sound. Reverberation times are calculated for the wide band signal and for other octave frequencies in the range of 125Hz to 8KHz. You can use the Impulse Capture dialog to capture a hand clap or gunshot etc. in order to test reverberation times of a room. Once a trace has been captured and being displayed select ‘Reverberation Times’ from the ‘Options’ menu.
Calibration Times
The top entry in the display is for the wide band signal. If an entry reads 0.00 sec then there was insufficient signal present to calculate a reverberation time for that frequency. As a general rule we recommend setting the FFT Size to a minimum of 1K, which should give reasonable results with good resolution. You should also set the weighting to A-Weighting. It is recommended that the peak of the impulse file under test occurs within the first 25% of the impulse buffer. You should also ensure that there is at least a 30dB difference between the peak and the noise floor to register a valid reading for each octave band. Those bands with insufficient signal to noise levels will display 0.00 sec in the results dialog.
Calibrating Pocket RTA Ultra
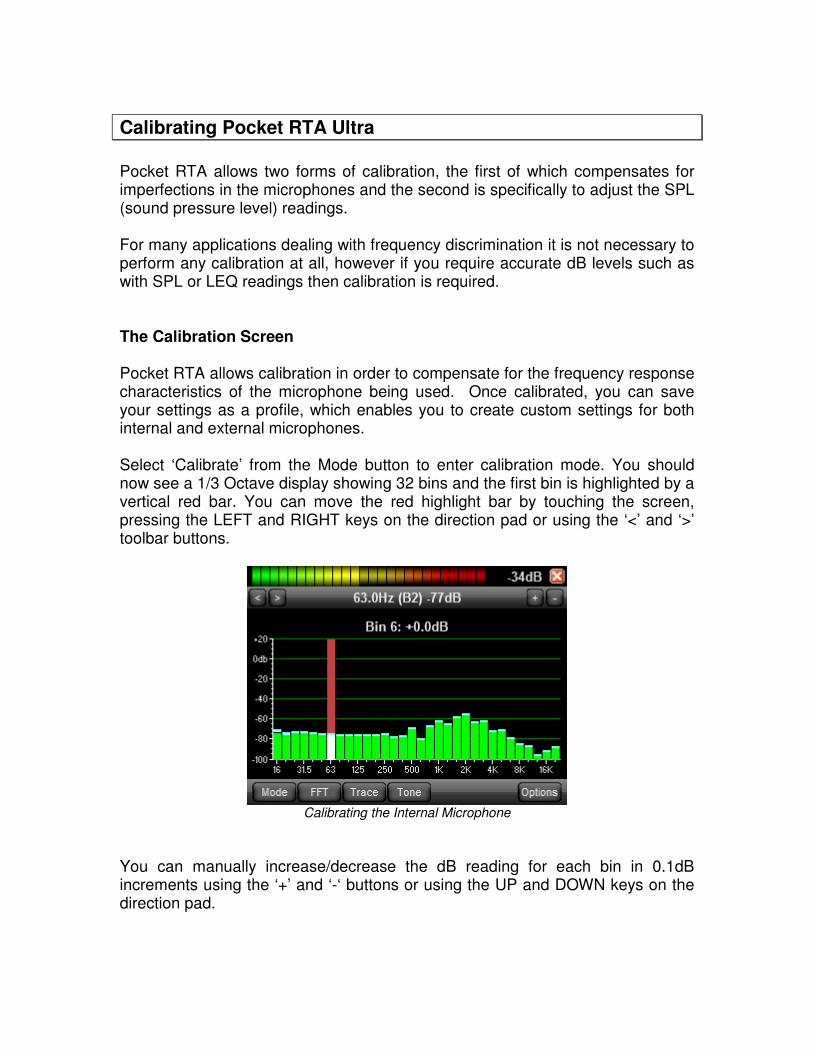
Pocket RTA allows two forms of calibration, the first of which compensates for imperfections in the microphones and the second is specifically to adjust the SPL (sound pressure level) readings. For many applications dealing with frequency discrimination it is not necessary to perform any calibration at all, however if you require accurate dB levels such as with SPL or LEQ readings then calibration is required. The Calibration Screen Pocket RTA allows calibration in order to compensate for the frequency response characteristics of the microphone being used. Once calibrated, you can save your settings as a profile, which enables you to create custom settings for both internal and external microphones. Select ‘Calibrate’ from the Mode button to enter calibration mode. You should now see a 1/3 Octave display showing 32 bins and the first bin is highlighted by a vertical red bar. You can move the red highlight bar by touching the screen, pressing the LEFT and RIGHT keys on the direction pad or using the ‘<’ and ‘>’ toolbar buttons.
Calibrating the Internal Microphone
You can manually increase/decrease the dB reading for each bin in 0.1dB increments using the ‘+’ and ‘-‘ buttons or using the UP and DOWN keys on the direction pad.

Calibrating the Microphone To properly calibrate Pocket RTA requires a pink noise sound source. Pink noise is used because it contains equal energy in each octave band and in theory should product a flat trace on the display. In practice imperfections in the microphones frequency response mean this is unlikely and some adjustment will be required. The idea is to boost or cut frequencies in such a way as to obtain a flat response curve from the calibrated sound source. In order to perform good calibration at the lower end of the frequency scale requires large FFT Sizes of 4 or 8K. If the FFT Size is too low, no FFT data will fall within range of these lower bins. In such cases the values for the bin are interpolated using values above and below the bin in question. Attempting to boost / cut these bins may not give satisfactory results. You can avoid this situation by specifying a higher FFT size. Please also note that even when calibrated, frequency readings below 100Hz and above 12KHz are not going to be very accurate due to the quality and size of the internal microphone. Auto Calibration It is time consuming and fiddly to manually adjust individual bins in order to obtain a flat frequency response. For this reason we have introduced an ‘Auto Calibration’ feature. Select 'Auto Calibrate' from the 'Options' button to enter auto calibration mode. You will be prompted to place the device near a calibrated pink noise generator and press ‘Continue’ to begin.
Auto Calibration of Linear and Log displays.
Pocket RTA will first boost/cut all bins so that the average of all the bins is 0dB, and then begin a fine adjustment phase which could take up to a minute before the trace settles down at 0dB. Any bin that is within 5dB of the calibration zone will be colored green, any bin outside of this will be colored yellow. After a period of time the trace should settle down and all bins will turn green. If calibration was successful you should see a calibration complete message appear. If not, you need to manually exit calibration mode once you are happy that calibration is as good as it gets. To do this select ‘End Calibration’ from the ‘Options’ menu. Reset Calibration. You can remove the calibration settings at any time and restore to default settings by selecting ‘Reset Calibration’ from the ‘Options’ button. You can also select ‘Reset Selected Bin’ to default the selected bin to 0dB is performing manual calibration. Saving Calibration Settings The calibration settings are automatically stored once you exit the program. However, you may want to save these along with other FFT settings to a profile for safe keeping. This is especially useful if you want to save calibration data for different microphones. To save / load your calibration and FFT settings use the ‘Load Settings’ and ‘Save Settings’ options from the ‘FFT’ menu. Calibration Mode There are two calibration modes for Pocket RTA Ultra which significantly affects the way the program functions. In general you will want to set the Calibration Mode to ‘Sum’ so that each octave bin represents the total power of the octave. Set the mode to ‘Max’ if you wish each bin to represent peak power. Adjusting the Gain Once you have calibrated your microphones frequency response you may wish to modify the gain so that the Pocket RTA readings match that of your test equipment. You can do this by selecting the ‘Gain’ option from the ‘FFT’ menu.

SPL (Sound Pressure Level) Calibration Once you have performed any necessary microphone calibration, you will need to adjust the SPL calibration so that it matches that of a known source. Pocket RTA works totally in the digital domain and can only be as accurate as the computer's sound hardware. Pocket RTA does not know the A/D converter's input voltage range or any other details about the gain structure of an input signal and therefore must be calibrated to obtain accurate sound pressure readings. By default, Pocket RTA is internally calibrated so that the maximum input signal from your Analog to Digital converter gives a reading of 100db. The calibration process of the SPL display is relatively simple and requires the use of a standard Sound Level Meter. Simply place Pocket RTA in SPL mode and use the ‘+’ and ‘-‘ buttons on the toolbar to adjust the calibration level until the Pocket RTA readout matches that of the SLM. Alternatively you can select ‘SPL Calibration’ from the ‘Options’ menu, and enter an adjustment value from -100 to +100 dB. NOTE: You should always carry out the microphone calibration before calibrating SPL. Readings of SPL obtained from Pocket RTA will never be as accurate as a dedicated pre-calibrated hardware. Due to the internal noise levels of the audio sub-system and the lack of dynamic range you should consider the SPL readings an approximation.
Calibration without a Calibrated Sound Source It is not always necessary to calibrate Pocket RTA if all you are interested in is frequency discrimination, or relative dB measurements. However the calibration feature can certainly be of use to obtain a flat frequency response across the entire frequency range. This is not so much calibrating as background noise elimination. A flat frequency response makes it easier to spot fluctuations of an input signal.

Troubleshooting If you are having problems with a particular feature of Pocket RTA Ultra please consult the list of problems and solutions below. Q: Does my Pocket PC microphone need calibrating? A: This depends on the type of information you are trying to extract from Pocket RTA. If you are purely interested in the frequency of an input signal then you don’t need to perform any sort of calibration. If you need to obtain the difference in decibels between two input signals then again, you do not need to calibrate the microphone. If however you need accurate dB readings, such as with SPL (sound pressure level) or LEQ then calibration is required for accurate results. Without calibration you should consider these readings as approximations. Q: The display update is very unresponsive? A: This is caused by having ‘Oversampling’ or ‘FFT Size’ set too high. Lowering the FFT Size will help with both responsiveness and CPU load, Oversampling is used to average values over a period of time, and has the effect of damping rapidly fluctuating input. You may need to reduce this setting if you are testing signals with a short duration. Q: How can I calibrate both internal and external microphones? A: Pocket RTA Ultra allows you to save calibration settings to a profile which can be loaded whenever you need to switch between microphones. Simply calibrate your microphone, then use the Save and Load Settings options from the FFT menu. This also stores away any changes made to the FFT menu options. Q: I am running Pocket RTA but I can’t see any input signal? A: Try settings a lower FFT size or sample rate. If you have a low specification device it may struggle to process large amounts of data fast enough to keep up with the audio device. Also make sure ‘Impulse View’ isn’t enabled on the ‘Trace’ menu.

Q: How do I analyze a constantly moving signal using the Oscilloscope? A: You need to modify the timebase (measured in milliseconds) so that the waveform becomes visible. You can use the fine adjust feature to stop the scrolling trace. You do this by simply dragging your stylus across the display in the opposite direction to the scrolling trace. Use the Sensitivity to compensate for weak signals. Q: I’ve messed up my display settings, how do I revert back to defaults. A: Deleting the file PREFS.DAT from the installation folder and running the program again will reset all values to default. Q: How do I exit Impulse View A: By selecting the Impulse View (On/Off) option from the ‘Trace’ menu. Most options in Pocket RTA specify the current setting in brackets after the option. ‘Impulse View (ON)’ means that Impulse View is currently ON.

Contact Us
You can obtain sales information and technical support by contacting us directly on one
of the following email addresses.
Technical Support: [email protected]
Sales: [email protected]
Web Site: www.4Pockets.com
Note: We will normally reply to any emails within 24 hours during working hours (not
including bank holidays and weekends).