podoplanin is a negative regulator of th17 · reduced via an sgk1-mediated pathway under...
TRANSCRIPT

Podoplanin is a negative regulator of Th17inflammation
Alyssa N. Nylander, … , David Pitt, David A. Hafler
JCI Insight. 2017;2(17):e92321. https://doi.org/10.1172/jci.insight.92321.
Recent data indicate that there are different subpopulations of Th17 cells that can express aregulatory as opposed to an inflammatory gene signature. The transmembrane glycoproteinPDPN is critical in the development of multiple organs including the lymphatic system andhas been described on T cells in mouse models of autoimmune Th17 inflammation. Here,we demonstrate that unlike in mice, PDPN+ T cells induced under classic Th17-polarizingconditions express transcription factors associated with Th17 cells but do not produce IL-17.Moreover, these cells express a transcriptional profile enriched for immunosuppressive andregulatory pathways and express a distinct cytokine profile compared with potentiallypathogenic PDPN– Th17 cells. Ligation of PDPN by its ligand CLEC-2 ameliorates theTh17 inflammatory response. IL-17 secretion is restored with shRNA gene silencing ofPDPN. Furthermore, PDPN expression is reduced via an Sgk1-mediated pathway underproinflammatory, high sodium chloride conditions. Finally, CD3+PDPN+ T cells are devoidof IL-17 in skin biopsies from patients with candidiasis, a prototypical Th17-driven skindisease. Thus, our data support the hypothesis that PDPN may serve as a marker of anonpathogenic Th17 cell subset and may also functionally regulate pathogenic Th17inflammation.
Research Article Immunology
Find the latest version:
http://jci.me/92321-pdf
1insight.jci.org https://doi.org/10.1172/jci.insight.92321
R E S E A R C H A R T I C L E
Conflict of interest: The authors have declared that no conflict of interest exists.
Submitted: December 15, 2016 Accepted: August 3, 2017 Published: September 7, 2017
Reference information: JCI Insight. 2017;2(17):e92321. https://doi.org/10.1172/jci.insight.92321.
Podoplanin is a negative regulator of Th17 inflammationAlyssa N. Nylander,1,2,3 Gerald D. Ponath,1 Pierre-Paul Axisa,1,3 Mayyan Mubarak,1 Mary Tomayko,4 Vijay K. Kuchroo,5 David Pitt,1 and David A. Hafler1,2,3
1Department of Neurology, 2Interdepartmental Neuroscience Program, 3Department of Immunobiology, and 4Department
of Dermatology, Yale School of Medicine, New Haven, Connecticut, USA. 5Evergrande Center for Immunologic Diseases,
Harvard Medical School, Boston, Massachusetts, USA.
IntroductionT helper 17 (Th17 cells), characterized by the transcription factor RORγt and production of cytokines IL-17A and IL-17F, play an important role in the pathophysiology of autoimmune disease. These diseases result from self-reactive Th1 or Th17 cells that escape mechanisms of central and peripheral tolerance to cause autoimmune tissue inflammation (1). Genome-wide association studies have linked genetic vari-ants in the Th17 pathway to multiple autoimmune diseases, and IL-17 has been identified in the lesions of patients with multiple sclerosis (MS), psoriasis, Sjogren’s syndrome, and inflammatory bowel disease patients (2–5). Additionally, therapeutic agents such as IL-17A inhibitor secukinumab and IL-12/IL-23 inhibitor ustekinumab have been shown to have a strong therapeutic effect on psoriatic disease, further highlighting the importance of Th17 inflammation in the pathogenesis of some autoimmune diseases.
However, it is increasingly clear that there is significant heterogeneity among Th17 cells, and differentia-tion into subtypes with different functional properties may depend on the pathogens, cytokine combinations, or other environmental stimuli to which the cells are exposed. For example, in response to exposure to Can-dida albicans, Th17 cells produce both IL-17 and IFN-γ, while Th17 cells exposed to Staphylococcus aureus pro-duce IL-17 as well as IL-10 (6). Similarly, stimulation with TGF-β3, IL-6, and IL-23 can induce pathogenic Th17 cells that induce experimental autoimmune encephalitis (EAE), a murine autoimmune disease, while cells stimulated with TGF-β1 and IL-6 produce IL-17 but do not induce disease (7). T cell clones isolated from patients with MS express transcriptional profiles that resemble the gene signatures from murine EAE; additionally, MS T cell clones express proinflammatory cytokine profiles that are distinct from the regula-tory cytokines produced by T cell clones from control patients (8). These data suggest that differences in cytokine expression in response to antigen stimulation may underlie disease development and regulation of ongoing inflammation. Finally, recent work has also demonstrated that environmental factors, such as high sodium chloride concentration, can affect the pathogenicity of Th17 cells, as well as the ability of Treg cells to suppress inflammation, via serum glucocorticoid kinase 1–dependent (Sgk1-dependent) pathways (9–11).
Recent data indicate that there are different subpopulations of Th17 cells that can express a regulatory as opposed to an inflammatory gene signature. The transmembrane glycoprotein PDPN is critical in the development of multiple organs including the lymphatic system and has been described on T cells in mouse models of autoimmune Th17 inflammation. Here, we demonstrate that unlike in mice, PDPN+ T cells induced under classic Th17-polarizing conditions express transcription factors associated with Th17 cells but do not produce IL-17. Moreover, these cells express a transcriptional profile enriched for immunosuppressive and regulatory pathways and express a distinct cytokine profile compared with potentially pathogenic PDPN– Th17 cells. Ligation of PDPN by its ligand CLEC-2 ameliorates the Th17 inflammatory response. IL-17 secretion is restored with shRNA gene silencing of PDPN. Furthermore, PDPN expression is reduced via an Sgk1-mediated pathway under proinflammatory, high sodium chloride conditions. Finally, CD3+PDPN+ T cells are devoid of IL-17 in skin biopsies from patients with candidiasis, a prototypical Th17-driven skin disease. Thus, our data support the hypothesis that PDPN may serve as a marker of a nonpathogenic Th17 cell subset and may also functionally regulate pathogenic Th17 inflammation.
2insight.jci.org https://doi.org/10.1172/jci.insight.92321
R E S E A R C H A R T I C L E
Collectively, these data suggest that Th17 subtypes derived from exposures to pathogens, cytokine milieu, or other environmental factors, may mediate distinct immunological functions.
Podoplanin (PDPN, or gp38) is a 36 to 43 kDa type I transmembrane sialomucin-like glycoprotein, with a heavily O-glycosylated extracellular domain and a 9–amino acid cytoplasmic tail (12). It is highly expressed on lymphatic endothelial cells, fibroblastic reticular cells, follicular dendritic cells, alveolar type I epithelial cells, thymic epithelial cells, and kidney podocytes (13–17). Additionally, PDPN has been described on tumor cells of germ cell tumors, squamous cell carcinomas, mesotheliomas, and glioblastoma multiforme (18–22). PDPN upregulation has been reported in keratinocytes treated in vitro with TGF-β, IL-6, IL-22, or IFN-γ, (23) as well as in the synoviocytes, the fibroblast-like mediators of inflammatory tissue destruction, of rheumatoid arthritis patients (24). C-type lectin-like receptor 2 (CLEC-2) is a surface receptor for PDPN that is expressed on dendritic cells, neutrophils, and platelets (25–27). Murine knockouts of PDPN and CLEC-2 have suggested the importance of interaction between these 2 molecules for normal lymph node formation and separation between vascular and lymphatic channels, although work on the downstream cellular signaling required for this activity has primarily focused on the role of signaling through CLEC-2 (28–30). Little is known about the PDPN signaling pathway after engagement with CLEC-2. For example, in epithelial cells it has been shown that PDPN interacts with ezrin, radixin, and moesin family proteins via conserved residues in the cytoplasmic tail, and that increased phosphorylation of ERM proteins exposes actin-binding sites (31–33). However, the role of PDPN in human T cells is unknown.
The presence of PDPN on T cells has recently been reported in mouse models of chronic inflamma-tion. First, in the SKG mouse model for chronic arthritis, PDPN+IL-17A+ T cells were identified in the inflamed joint synovium, and no PDPN-expressing T cells were present in control mice (34). Secondly, in an IL-17-GFP reporter mouse with EAE, PDPN+IL17A+ T cells were found in the brains of diseased mice but not in controls (35). PDPN was identified as a Th17 cell–specific surface molecule when compared with T helper cells polarized to a Th1 phenotype (producing IFN-γ) or a Th2 phenotype (producing IL-4, IL-10, and IL-13) (35, 36). Recently, PDPN expression has also been described in human rheumatoid arthritis synovial tissue samples (37). A mouse model with a CD4+ T cell–specific gene silencing of Pdpn demonstrated that these mice experienced spontaneous EAE with a more severe course, as well as a greater accumulation of CD4+ T cells within the CNS. Additionally, a transgenic mouse model that expressed Pdpn driven by the CD2 promoter exhibited severe peripheral lymphopenia, defects in IL-7–mediated T cell expansion and survival, reduced CD4+ T cell burden in the CNS, and more rapid recovery from EAE (38).
Here, we demonstrate that unlike in mice, PDPN+ T cells induced under classic Th17-polarizing condi-tions express transcription factors associated with Th17 cells but do not produce IL-17. Moreover, these cells express a transcriptional profile enriched for immunosuppressive and regulatory pathways and express a distinct cytokine profile compared with potentially pathogenic PDPN– Th17 cells. Ligation of PDPN by its ligand, CLEC-2, ameliorates the Th17 inflammatory response which is restored with shRNA gene silencing of PDPN. Furthermore, under high sodium chloride (NaCl) conditions, which have previously been shown to be proinflammatory, PDPN expression is reduced via an Sgk1-mediated pathway. Finally, CD3+PDPN+ T cells are devoid of IL-17 in skin biopsies from patients with candidiasis, a Th17-driven skin disease. Thus, our data support the hypothesis that PDPN may serve as a marker of a nonpathogenic Th17 cell subset and may also functionally regulate pathogenic Th17 inflammation.
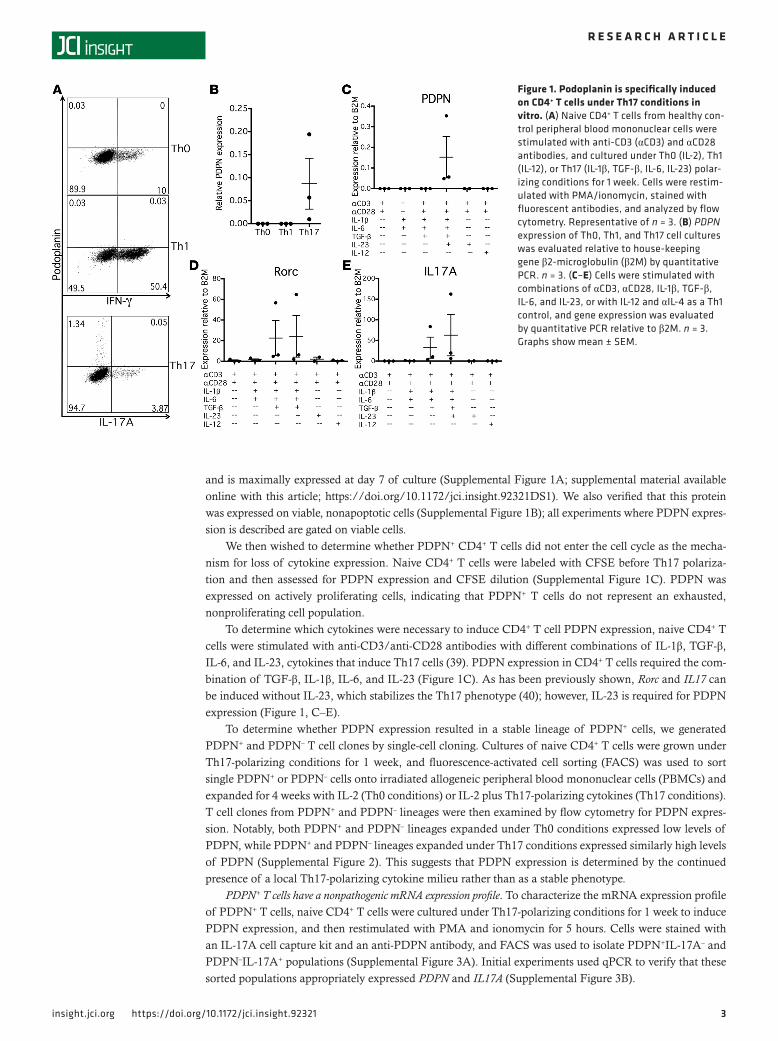
ResultsPodoplanin is induced on T cells under Th17 conditions. We first investigated the conditions necessary for the induction of PDPN expression in a human T cell in vitro system. Naive CD4+ T cells from healthy controls were cultured under Th0-, Th1-, or Th17-polarizing conditions and examined by flow cytometry and quan-titative PCR (qPCR) after 1 week to assess expression of PDPN. Under Th0- and Th1-polarizing conditions, no PDPN expression was observed by qPCR or flow cytometry (Figure 1, A and B). However, under Th17-polarizing conditions a subset of CD4+ cells expressed significant levels of PDPN. We examined the expres-sion of PDPN in relation to cytokine production. Interestingly, despite its induction under Th17-polarizing conditions, PDPN was not expressed on IL-17A–secreting cells, indicating that PDPN+ and IL-17A+ cells were distinct populations (Figure 1A). Additionally, PDPN+ cells did not express IFN-γ (data not shown).
Because PDPN was not expressed on cytokine-secreting CD4+ cells, we examined the kinetics of PDPN expression in relation to cell cycle. A time-course experiment examining PDPN expression by qPCR demon-strated that PDPN is not expressed on CD4+ cells until 4 days of culture under Th17-polarizing conditions
3insight.jci.org https://doi.org/10.1172/jci.insight.92321
R E S E A R C H A R T I C L E
and is maximally expressed at day 7 of culture (Supplemental Figure 1A; supplemental material available online with this article; https://doi.org/10.1172/jci.insight.92321DS1). We also verified that this protein was expressed on viable, nonapoptotic cells (Supplemental Figure 1B); all experiments where PDPN expres-sion is described are gated on viable cells.
We then wished to determine whether PDPN+ CD4+ T cells did not enter the cell cycle as the mecha-nism for loss of cytokine expression. Naive CD4+ T cells were labeled with CFSE before Th17 polariza-tion and then assessed for PDPN expression and CFSE dilution (Supplemental Figure 1C). PDPN was expressed on actively proliferating cells, indicating that PDPN+ T cells do not represent an exhausted, nonproliferating cell population.
To determine which cytokines were necessary to induce CD4+ T cell PDPN expression, naive CD4+ T cells were stimulated with anti-CD3/anti-CD28 antibodies with different combinations of IL-1β, TGF-β, IL-6, and IL-23, cytokines that induce Th17 cells (39). PDPN expression in CD4+ T cells required the com-bination of TGF-β, IL-1β, IL-6, and IL-23 (Figure 1C). As has been previously shown, Rorc and IL17 can be induced without IL-23, which stabilizes the Th17 phenotype (40); however, IL-23 is required for PDPN expression (Figure 1, C–E).
To determine whether PDPN expression resulted in a stable lineage of PDPN+ cells, we generated PDPN+ and PDPN– T cell clones by single-cell cloning. Cultures of naive CD4+ T cells were grown under Th17-polarizing conditions for 1 week, and fluorescence-activated cell sorting (FACS) was used to sort single PDPN+ or PDPN– cells onto irradiated allogeneic peripheral blood mononuclear cells (PBMCs) and expanded for 4 weeks with IL-2 (Th0 conditions) or IL-2 plus Th17-polarizing cytokines (Th17 conditions). T cell clones from PDPN+ and PDPN– lineages were then examined by flow cytometry for PDPN expres-sion. Notably, both PDPN+ and PDPN– lineages expanded under Th0 conditions expressed low levels of PDPN, while PDPN+ and PDPN– lineages expanded under Th17 conditions expressed similarly high levels of PDPN (Supplemental Figure 2). This suggests that PDPN expression is determined by the continued presence of a local Th17-polarizing cytokine milieu rather than as a stable phenotype.
PDPN+ T cells have a nonpathogenic mRNA expression profile. To characterize the mRNA expression profile of PDPN+ T cells, naive CD4+ T cells were cultured under Th17-polarizing conditions for 1 week to induce PDPN expression, and then restimulated with PMA and ionomycin for 5 hours. Cells were stained with an IL-17A cell capture kit and an anti-PDPN antibody, and FACS was used to isolate PDPN+IL-17A– and PDPN–IL-17A+ populations (Supplemental Figure 3A). Initial experiments used qPCR to verify that these sorted populations appropriately expressed PDPN and IL17A (Supplemental Figure 3B).
Figure 1. Podoplanin is specifically induced on CD4+ T cells under Th17 conditions in vitro. (A) Naive CD4+ T cells from healthy con-trol peripheral blood mononuclear cells were stimulated with anti-CD3 (αCD3) and αCD28 antibodies, and cultured under Th0 (IL-2), Th1 (IL-12), or Th17 (IL-1β, TGF-β, IL-6, IL-23) polar-izing conditions for 1 week. Cells were restim-ulated with PMA/ionomycin, stained with fluorescent antibodies, and analyzed by flow cytometry. Representative of n = 3. (B) PDPN expression of Th0, Th1, and Th17 cell cultures was evaluated relative to house-keeping gene β2-microglobulin (β2M) by quantitative PCR. n = 3. (C–E) Cells were stimulated with combinations of αCD3, αCD28, IL-1β, TGF-β, IL-6, and IL-23, or with IL-12 and αIL-4 as a Th1 control, and gene expression was evaluated by quantitative PCR relative to β2M. n = 3. Graphs show mean ± SEM.
4insight.jci.org https://doi.org/10.1172/jci.insight.92321
R E S E A R C H A R T I C L E
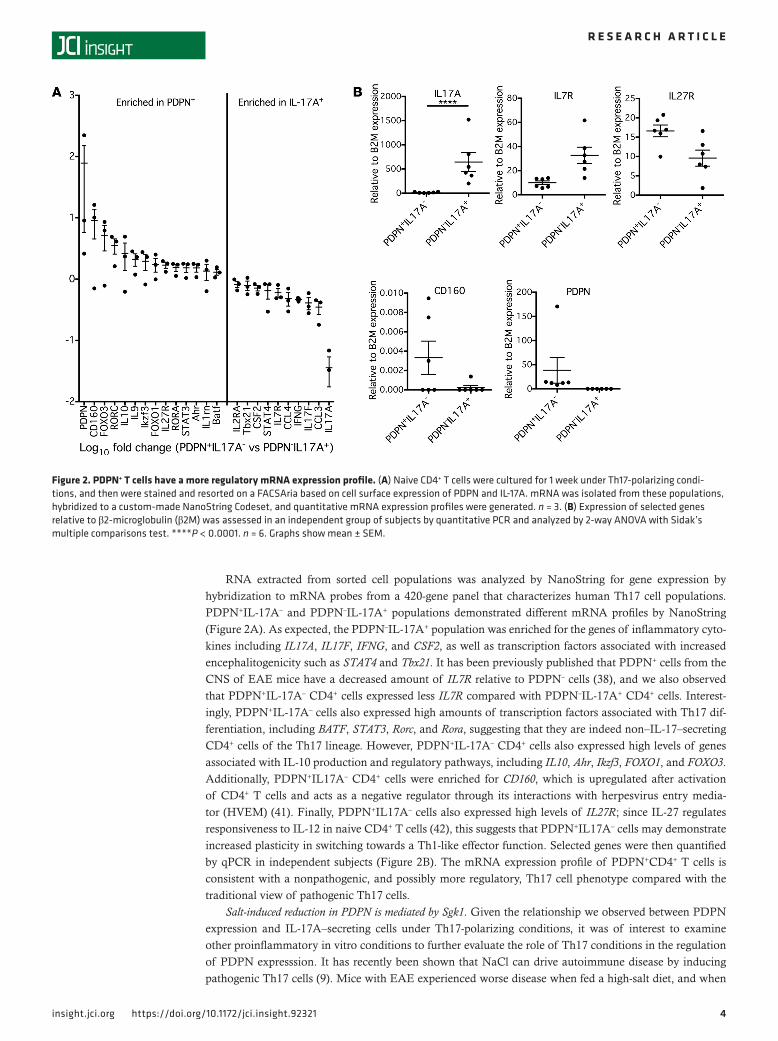
RNA extracted from sorted cell populations was analyzed by NanoString for gene expression by hybridization to mRNA probes from a 420-gene panel that characterizes human Th17 cell populations. PDPN+IL-17A– and PDPN–IL-17A+ populations demonstrated different mRNA profiles by NanoString (Figure 2A). As expected, the PDPN–IL-17A+ population was enriched for the genes of inflammatory cyto-kines including IL17A, IL17F, IFNG, and CSF2, as well as transcription factors associated with increased encephalitogenicity such as STAT4 and Tbx21. It has been previously published that PDPN+ cells from the CNS of EAE mice have a decreased amount of IL7R relative to PDPN– cells (38), and we also observed that PDPN+IL-17A– CD4+ cells expressed less IL7R compared with PDPN–IL-17A+ CD4+ cells. Interest-ingly, PDPN+IL-17A– cells also expressed high amounts of transcription factors associated with Th17 dif-ferentiation, including BATF, STAT3, Rorc, and Rora, suggesting that they are indeed non–IL-17–secreting CD4+ cells of the Th17 lineage. However, PDPN+IL-17A– CD4+ cells also expressed high levels of genes associated with IL-10 production and regulatory pathways, including IL10, Ahr, Ikzf3, FOXO1, and FOXO3. Additionally, PDPN+IL17A– CD4+ cells were enriched for CD160, which is upregulated after activation of CD4+ T cells and acts as a negative regulator through its interactions with herpesvirus entry media-tor (HVEM) (41). Finally, PDPN+IL17A– cells also expressed high levels of IL27R; since IL-27 regulates responsiveness to IL-12 in naive CD4+ T cells (42), this suggests that PDPN+IL17A– cells may demonstrate increased plasticity in switching towards a Th1-like effector function. Selected genes were then quantified by qPCR in independent subjects (Figure 2B). The mRNA expression profile of PDPN+CD4+ T cells is consistent with a nonpathogenic, and possibly more regulatory, Th17 cell phenotype compared with the traditional view of pathogenic Th17 cells.
Salt-induced reduction in PDPN is mediated by Sgk1. Given the relationship we observed between PDPN expression and IL-17A–secreting cells under Th17-polarizing conditions, it was of interest to examine other proinflammatory in vitro conditions to further evaluate the role of Th17 conditions in the regulation of PDPN expresssion. It has recently been shown that NaCl can drive autoimmune disease by inducing pathogenic Th17 cells (9). Mice with EAE experienced worse disease when fed a high-salt diet, and when
Figure 2. PDPN+ T cells have a more regulatory mRNA expression profile. (A) Naive CD4+ T cells were cultured for 1 week under Th17-polarizing condi-tions, and then were stained and resorted on a FACSAria based on cell surface expression of PDPN and IL-17A. mRNA was isolated from these populations, hybridized to a custom-made NanoString Codeset, and quantitative mRNA expression profiles were generated. n = 3. (B) Expression of selected genes relative to β2-microglobulin (β2M) was assessed in an independent group of subjects by quantitative PCR and analyzed by 2-way ANOVA with Sidak’s multiple comparisons test. ****P < 0.0001. n = 6. Graphs show mean ± SEM.

5insight.jci.org https://doi.org/10.1172/jci.insight.92321
R E S E A R C H A R T I C L E
in vitro CD4+ T cells were cultured with an increased concentration of NaCl, they produced increased proinflammatory cytokines, including IL-17A, and had a pathogenic Th17 phenotype. Based on this work, we examined the effect of a high concentration of NaCl on PDPN expression as a model system for patho-genic Th17 disease conditions. Naive CD4+ T cells were cultured for 1 week under Th17 conditions with or without an additional 40 mM NaCl in the media. As has been previously shown, with the addition of NaCl to the media there was an increase in IL-17A production. Interestingly, this was accompanied by significant reductions in PDPN expression (Figure 3, A and B). Multiple individual experiments assessed PDPN and IL-17A expression by flow cytometry, and we observed a negative correlation between the percentage of PDPN+ and IL-17A+ CD4+ T cells, suggesting that PDPN was acting as either a marker of a nonpathogenic Th17 population or was negatively regulating pathways associated with IL-17 and other inflammatory programs (Figure 3C).
It has previously been demonstrated that NaCl induces proinflammatory cytokine secretion mediat-ed through Sgk1, and that loss of Sgk1 abrogates NaCl-mediated Th17 differentiation (10). To determine whether the reduction in PDPN expression was dependent on Sgk1, a lentiviral shRNA construct was used to knock down Sgk1 in cultures of Th17-polarized CD4+ T cells with and without additional NaCl (Figure 3D). Following gene silencing of Sgk1, there was a restoration in PDPN expression by both qPCR and flow cytometry relative to cell cultures that received control shRNA (Figure 3, E and F). PDPN expression was increased by gene silencing of Sgk1 despite the continued presence of NaCl, suggesting that the decrease in PDPN expression is an Sgk1-dependent event. As previously described, Sgk1 gene silencing induced a reduction in IL-17A expression both by flow cytometry and qPCR (Figure 3F and Supplemental Figure 4B).
PDPN/CLEC-2 ligation ameliorates the Th17 inflammatory response. To determine the effect of PDPN liga-tion on Th17 polarization, increasing concentrations of soluble CLEC-2 were added to Th17-polarized cul-tures of naive CD4+ T cells, and proliferation was assessed by CFSE dilution. As increasing concentrations of CLEC-2 were used in the Th17 culture, there was a corresponding increase in cell cycle entry, suggesting that CLEC-2 promotes proliferation in naive CD4+ T cells under Th17-polarizing conditions (Figure 4A).
Figure 3. The reduction in PDPN expression under high salt Th17 conditions correlates with increased IL-17 production and is mediated through Sgk1. (A) Naive CD4+ T cells were cultured for 1 week under Th17 conditions with or without an additional 40 mM NaCl. Flow cytometry plot is representative of n = 15. (B) Frequency of PDPN+ CD4+ T cells under Th17 and Th17 + NaCl conditions was determined by flow cytometry. Analyzed by unpaired 2-tailed t test. n = 10. (C) Linear regression in which each data point represents the percentage of PDPN+ and IL-17A+ CD4+ T cells in a separate culture. (D and E) Sgk1 shRNA or nontarget control shRNA was added to CD4+ T cells and cultured under Th17 or Th17 + NaCl conditions. Gene expression was evaluated by quantitative PCR relative to β2-microglobulin (β2M) on day 4 and 7. Analyzed by 2-way ANOVA. n = 3–4. (F) Expression of PDPN and cytokines shown in representative flow cytometry plot under Th17 + NaCl conditions. n = 4. **P < 0.01, ****P < 0.0001. Graph shows mean ± SEM.

6insight.jci.org https://doi.org/10.1172/jci.insight.92321
R E S E A R C H A R T I C L E
There was also a significant shift in the cytokine profile; with increasing amounts of CLEC-2, there is a corresponding reduction in the percentage of IL-17A+ cells as measured by flow cytometry (Figure 4, B and C). Based on the enrichment of regulatory and IL-10–related genes in the PDPN+ mRNA cell profile, we also examined whether there was a relationship between IL-10 production and CLEC-2 stimulation. When CLEC-2 was added to Th17-polarizing cultures, a significant increase in IL-10 production was observed by ELISA (Figure 4D). IL-10 production was also assessed by flow cytometry at 2 time points under these IL-17–inducing conditions. Although there were increases in IL-10+ cells with CLEC-2 stimulation, the actual percentages of IL-10+ T cells were extremely low (Supplemental Figure 5). This decrease in IL-17A production and increase in IL-10 suggest that CLEC-2/PDPN interaction results in negative regulation of the pathogenic inflammation.
The only described binding partner for CLEC-2 besides PDPN is rhodocytin, a snake venom toxin from the Malayan pit viper (43, 44). However, it is possible that there are other unknown receptors for CLEC-2 through which signaling could lead to a change in Th17 polarization. To determine whether the
Figure 4. CLEC-2 ligation of PDPN reduces IL-17A production and ameliorates the NaCl-driven Th17 response. (A) Naive CD4+ T cells were labeled with CFSE, cultured with increasing concentrations of soluble CLEC-2, and entry into cell cycle was evaluated by CFSE dilution on flow cytometry. Representa-tive of n = 6. (B and C) After 1 week of Th17 culture with varying concentrations of CLEC-2, cytokines were evaluated by flow cytometry. Analyzed by 2-way ANOVA. n = 9. (D) After 1 week of Th17 culture with or without 500 ng/ml CLEC-2, IL-10 was measured by ELISA. Analyzed by Wilcoxon matched-pairs signed-rank 1-tailed test. n = 7. (E) PDPN shRNA or nontarget control shRNA was added to CD4+ T cells and cultured under Th17 conditions with or without CLEC-2, and PDPN expression was measured by flow cytometry. Bolded text and line refer to cells receiving control shRNA, while thin text and line refer to cells that underwent gene silencing with PDPN shRNA. Text indicates percentage of positive cells within gate. Representative of n = 7. (F and G) After PDPN shRNA or control shRNA, gene expression was measured by quantitative PCR relative to β2-microglobulin (β2M) in GFP+ cells. n = 7. Analyzed by Wilcoxon matched-pairs signed-rank 2-tailed test. (H) Naive CD4+ T cells were cultured under Th17 + NaCl conditions with varying amounts of CLEC-2, and cytokine expression was measured by flow cytometry. n = 4. Analyzed by 2-way ANOVA. *P < 0.05, **P < 0.01, ***P < 0.001. Graph shows mean ± SEM.
7insight.jci.org https://doi.org/10.1172/jci.insight.92321
R E S E A R C H A R T I C L E
CLEC-2 effect was specific to PDPN binding, a lentiviral shRNA for PDPN as well as a nontarget control shRNA was used to knock down PDPN expression in CD4+ T cells under Th17 conditions. Both shRNA structures contained a GFP expression construct, and cells that had taken up PDPN or control shRNA were identified and sorted based on GFP expression. Gene silencing of PDPN cell surface expression was confirmed by flow cytometry gating on GFP+ cells (Figure 4E). There was significant reduction in PDPN expression in sorted GFP+ T cells that received PDPN shRNA relative to the nontarget control shRNA (Figure 4F). PDPN gene–depleted CD4+ T cells were incubated with CLEC-2 under Th17-polarizing con-ditions and were sorted by GFP expression to assess cytokine gene expression. As expected, there was a reduction in IL17A in the control shRNA–infected cells in response to CLEC-2. However, the PDPN shR-NA–infected cells did not have a reduction in IL17A in response to CLEC-2, indicating that an interaction between CLEC-2 and PDPN is necessary for the reduction in IL-17 expression (Figure 4G). In separate experiments, when Th17-polarized cultures were incubated with soluble CLEC-2 and then evaluated by flow cytometry to determine which cells CLEC-2 bound, the PDPN+ cells were also CLEC-2+, suggesting that the soluble CLEC-2 is interacting with PDPN+ cells (Supplemental Figure 6).
Finally, to investigate whether CLEC-2/PDPN ligation ameliorated the increased pathogenic gene sig-nature induced by Sgk1 under high NaCl conditions, naive CD4+ T cells were polarized under Th17 condi-tions with or without NaCl with varying concentrations of CLEC-2 and then assessed by flow cytometry and qPCR. Under high salt conditions, there was a significant decrease in the percentage of IL-17A+ cells with increased concentrations of CLEC-2 (Figure 4H), as well as a decrease in GM-CSF and a small non-significant increase in IFN-γ by qPCR (Supplemental Figure 6).
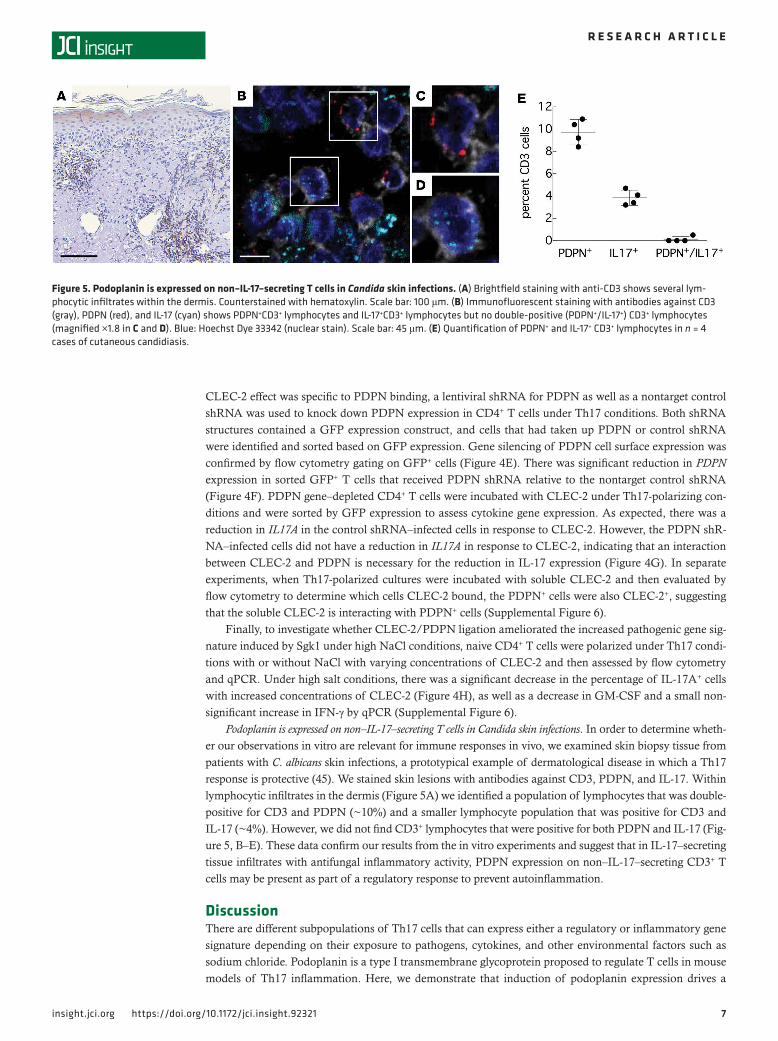
Podoplanin is expressed on non–IL-17–secreting T cells in Candida skin infections. In order to determine wheth-er our observations in vitro are relevant for immune responses in vivo, we examined skin biopsy tissue from patients with C. albicans skin infections, a prototypical example of dermatological disease in which a Th17 response is protective (45). We stained skin lesions with antibodies against CD3, PDPN, and IL-17. Within lymphocytic infiltrates in the dermis (Figure 5A) we identified a population of lymphocytes that was double-positive for CD3 and PDPN (~10%) and a smaller lymphocyte population that was positive for CD3 and IL-17 (~4%). However, we did not find CD3+ lymphocytes that were positive for both PDPN and IL-17 (Fig-ure 5, B–E). These data confirm our results from the in vitro experiments and suggest that in IL-17–secreting tissue infiltrates with antifungal inflammatory activity, PDPN expression on non–IL-17–secreting CD3+ T cells may be present as part of a regulatory response to prevent autoinflammation.
DiscussionThere are different subpopulations of Th17 cells that can express either a regulatory or inflammatory gene signature depending on their exposure to pathogens, cytokines, and other environmental factors such as sodium chloride. Podoplanin is a type I transmembrane glycoprotein proposed to regulate T cells in mouse models of Th17 inflammation. Here, we demonstrate that induction of podoplanin expression drives a
Figure 5. Podoplanin is expressed on non–IL-17–secreting T cells in Candida skin infections. (A) Brightfield staining with anti-CD3 shows several lym-phocytic infiltrates within the dermis. Counterstained with hematoxylin. Scale bar: 100 μm. (B) Immunofluorescent staining with antibodies against CD3 (gray), PDPN (red), and IL-17 (cyan) shows PDPN+CD3+ lymphocytes and IL-17+CD3+ lymphocytes but no double-positive (PDPN+/IL-17+) CD3+ lymphocytes (magnified ×1.8 in C and D). Blue: Hoechst Dye 33342 (nuclear stain). Scale bar: 45 μm. (E) Quantification of PDPN+ and IL-17+ CD3+ lymphocytes in n = 4 cases of cutaneous candidiasis.

8insight.jci.org https://doi.org/10.1172/jci.insight.92321
R E S E A R C H A R T I C L E
more immunosuppressive regulatory T cell program with loss of IL-17 secretion in human CD4+ cells. Ligation of PDPN by its ligand CLEC-2 on CD4+ cells induced under Th17 conditions ameliorates the Th17 inflammatory response. Moreover, under proinflammatory, high NaCl conditions, PDPN expression is reduced via an Sgk1-mediated pathway. Finally, IL-17 secretion is restored with shRNA gene silencing of PDPN. Clinically, CD3+PDPN+ T cells are devoid of IL-17 in skin biopsies from patients with candidiasis, a Th17-driven skin disease. Thus, PDPN expression identifies a nonpathogenic Th17 population and its engagement by CLEC-2 may functionally regulate pathogenic Th17 inflammation.
Th17 cells are a subset of effector helper T cells that produce IL-17A, IL-17F, IL-21, and IL-22 and are characterized by transcription factor RORγt. Th17 cells are increasingly appreciated to have a role in the initiation and pathogenesis of autoimmune disease. This subset can be induced by a combination of the cytokines TGF-β1, IL-1β, and IL-6, which induce the transcription factor RORγt (46), and IL-23 signal-ing through IL-23R is required to stabilize Th17 effector function. Our data show that PDPN expression requires TGF-β1, IL-1β, and IL-6 and the presence of IL-23, which has been shown to induce pathogenicity in Th17 cells via its ability to enhance TGF-β3 expression. TGF-β3 and TGF-β1 signal through the same receptor, TGF-BRII, although their differential signaling through Smad results in more pathogenic cells after exposure to TGF-3 and less pathogenic cells after exposure to TGF-β1 (6). Furthermore, our data show that T cell clones derived from PDPN+ T cells do not stably express PDPN in the absence of Th17-polarizing cytokines. Both the induction and maintenance of PDPN expression thus appear to be dependent on a cyto-kine environment that promotes Th17 polarization.
Based on the EAE model, there is increasing evidence of so-called pathogenic and nonpathogenic Th17 cells with distinct molecular signatures (7, 47, 48). As observed for the pathogenic Th17 cells in EAE, human PDPN+ cells also express high levels of Rorc, BATF, and STAT3, suggesting that they are indeed differenti-ated Th17 cells, as these transcription factors have been demonstrated to be necessary for the development of Th17 cells; IRF4 has also been suggested to be one of the critical genes in regulating RORγt and IL-17 production (49–51). However, unlike murine pathogenic Th17 cells, murine nonpathogenic Th17 cells and human PDPN+ T cells do not express high levels of cytokine genes IL17A, IL17F, CSF2, and IFNG, or high levels of transcription factors STAT4 and Tbx21, which have been associated with increased pathogenicity (52). Human PDPN+ CD4+ cells also have an mRNA signature demonstrating higher levels of genes associ-ated with nonpathogenic Th17 cells, including IL10, IL9, Ikzf3, Ahr, and IL1rn, and several of these genes are involved in the regulation of IL-10 (7). It has been suggested that a decreased ability of T cells to respond to IL-7 through decreased levels of IL7R may contribute to its role as a negative regulator by affecting the maintenance and survival of T effector cells (38), consistent with the lower expression of IL7R we observed on human PDPN+ CD4+ cells.
Given that the gene signatures of pathogenic and nonpathogenic Th17 cells have been previously described in murine EAE with a clear division in the types of genes expressed in each of the mRNA profiles, it is notable that the mRNA profile of PDPN+ CD4+ T cells more closely resembles the profile of nonpathogenic Th17 cells in murine EAE. These data suggest that human PDPN+ cells are a distinct popu-lation that occur within a Th17-polarizing milieu, which may significantly differ from the traditional under-standing of Th17 cells. That is, pathogenic Th17 cells, which produce IL-17, GM-CSF, and IFN-γ can be induced by IL-1β, IL-6, and IL-23, or TGF-β3 and IL-6, while nonpathogenic Th17 cells produce IL-17 as well as IL-10. Although the pathogenic phenotype is associated with autoimmunity in rodent models, these different Th17 cell subsets have also been associated with the clearance of different pathogens, suggesting that each serves a necessary function in vivo (6).
Our data demonstrate that CLEC-2 increases CD4+ T cell proliferation and decreases IL-17 production through a PDPN-dependent mechanism. PDPN has a heavily glycosylated extracellular domain, a single transmembrane domain, and a short 9–amino acid cytoplasmic tail (53). Unlike other negative regulators, including CTLA-4, PD1, TIGIT, and SIRPα, PDPN does not possess an immunoreceptor tyrosine-based inhibitory motif (ITIM) domain on its cytoplasmic tail to mediate intracellular signaling (54, 55). Work in in vitro models suggests that PDPN may associate with integral membrane proteins in order to help medi-ate signaling in fibroblasts. For example, PDPN has been shown to associate with CD44 to promote migra-tion and adhesion, or with CD9 to act as a tumor suppressor in several cancers. However, it is not known if these integral membrane proteins or other intracellular pathways play a role in intracellular signaling in CD4+ T cells in response to ligation of PDPN by CLEC-2, and it is possible that engagement of PDPN may activate multiple downstream mechanisms resulting in Th17 regulation.

9insight.jci.org https://doi.org/10.1172/jci.insight.92321
R E S E A R C H A R T I C L E
The secretion of IL-10 by Th17 cells suggests they may control inflammatory responses to protect tis-sue from the damage associated with chronic inflammation (39, 56). In a transgenic mouse model of forced PDPN expression, cells isolated from the CNS possessed a higher percentage of IL-10+ CD4+ T cells than wild-type mice (38). Recent work also suggests that IL-10 expression is a response to CLEC-2/PDPN inter-action; increases in IL-10 production from unstimulated naive CD4+ T cells were observed after cells were cultured with soluble CLEC-2 for 6 days (57). A similar increase in IL-10 when unstimulated CD4+ T cells were cocultured with CLEC-2–transfected dendritic cells and platelets was also observed. Finally, when resting T cells were incubated with anti-podoplanin antibody and cross-linked with a secondary antibody, there was also a significant increase in IL-10 production. From these experiments and our own data dem-onstrating a significant increase in IL-10 production under Th17-polarizing conditions with a concomitant decrease in IL-17, we can hypothesize that interactions between CLEC-2 and PDPN-expressing T cells result in the production of immunosuppressive IL-10 that may regulate Th17 inflammation.
We recently observed that higher Na+ concentrations increase the inflammatory signatures and poten-tial pathogenicity of the Th17 response via an Sgk1-mediated process (9, 10). Exposure to NaCl also reduc-es the suppressive function of Treg cells (11). Sgk1 is a salt-sensing serine/threonine kinase that has been shown to regulate NaCl transport and homeostasis in multiple cell types, and is increased in T cells when exposed to modest increases in the concentration of NaCl. We demonstrate that the inflammatory milieu induced by high NaCl concentrations decreased PDPN expression under Th17-polarizing conditions and this is an Sgk1-dependent event, as gene silencing of Sgk1 restored PDPN expression; however, we can-not conclude that Sgk1 itself directly regulates PDPN expression, since this may be effected by a down-stream mediator or in response to increased proinflammatory cytokines. Overall, Sgk1 activation leads to increased Th17 cytokine expression, abrogation of Treg suppression, and downregulation of PDPN, suggesting that the murine pathogenic gene signature associated with Sgk1 activation is mediated through multiple pathways. In speculating why NaCl may regulate PDPN expression in vivo, we considered the concentrations of Na+ in the serum and tissue. Blood sodium concentrations are similar to standard cell culture media (approximately 140 mM), although there can be higher salt concentrations (between 160 mM and 250 mM) in lymphoid tissue, the skin, or in the interstitium of organs (58, 59). Thus, migration of Th17 cells into tissues with higher NaCl concentrations may decrease PDPN expression in order to allow the full effector function of these cells at sites of inflammation.
Defects in IL-17–mediated immunity due to germline mutations, including IL-17–related genes such as IL17F and IL17RA, loss-of-function mutations in STAT3, gain-of-function mutations in STAT1, mutations in AIRE, and patients with autoimmune polyendocrinopathy syndrome-1 have been implicated in difficulty in clearing certain types of bacterial and fungal infections (60–62). In particular, individuals with defects in IL-17–mediated immunity often have chronic or repeated mucocutaneous candidiasis, suggesting that an effective Th17 response is essential to controlling commensal C. albicans. Additionally, in vitro work exam-ining pathogen-induced human memory Th17 cells showed that exposure to different antigens resulted in distinct effector functions. For example, S. aureus–specific Th17 cells were shown to produce IL-17 and IL-10 but not IFN-γ, while C. albicans–specific Th17 cells produced IL-17 and IFN-γ but not IL-10 (6). Thus, given the importance of the Th17 response to antifungal immunity, we examined biopsy tissue from patients with cutaneous candidiasis as a model of a Th17-driven inflammatory response in which to explore the relevance of PDPN in clinical disease. We found that PDPN+ T cells were present in the lymphocytic infiltrates in the dermis of patients with cutaneous candidiasis, and these were a distinct population from IL-17A+ T cells in the tissue. Additionally, we examined biopsy tissue from psoriasis plaques as a model of a Th17-mediated autoimmune skin disease (63), and similarly found that distinct PDPN+ and IL-17+ T cells were present in lymphocytic infiltrates (data not shown). These findings are consistent with our in vitro work examining polarized Th17 cells derived from the peripheral blood of healthy controls and provides additional evidence for multiple Th17 cell subsets with complementary roles, including antifungal immunity and regulation to prevent autoinflammation. This work is particularly important for understanding the role that negative regu-lators play in modulating the Th17 inflammatory response in human disease and suggests that PDPN could be a future clinical marker for prognosis or a therapeutic target in immunoregulation.
In summary, we suggest that PDPN+ T cells may be a previously undescribed nonpathogenic and regu-latory Th17 cell subset. PDPN expression is negatively regulated by Sgk1-mediated pathways under condi-tions of high NaCl, and PDPN itself negatively regulates Th17 inflammation through interactions with its ligand CLEC-2. Finally, we demonstrated that PDPN+ T cells are present during the protective Th17
1 0insight.jci.org https://doi.org/10.1172/jci.insight.92321
R E S E A R C H A R T I C L E
inflammatory response against mucocutaneous candidiasis, suggesting the clinical relevance of our in vitro experiments. This work supports the hypothesis that PDPN is a negative regulator on T cells and opens the door for further work that may introduce new therapeutic options with PDPN as a target.
MethodsAntibodies and reagents. Monoclonal antibodies used to stimulate cells include anti-CD3 (UCHT1) and anti-CD28 (CD28.2) (BD Biosciences). Recombinant human IL-2 was used at a concentration of 10 U/ml and was obtained through the AIDS Research and Reference Reagent Program (Division of AIDS, National Institute of Allergy and Infectious Disease, NIH). Cytokines were used at the following concentrations: IL-1β (12.5 ng/ml), IL-6 (25 ng/ml), IL-23 (25 ng/ml), IL-12 (10 ng/ml), anti–IL-4 (5 μg/ml), and were obtained from R&D Systems. TGF-β1 was used at a concentration of 5 ng/ml and was obtained from eBio-science. Flow cytometry antibodies include CD45RO-PE-Cy7 (UCHL1), IL-17A-FITC (eBio64DEC17), PDPN-PE (NZ-1.3), PDPN-APC (NZ-1.3), PDPN-PerCp-Cy5.5 (NZ-1.3) (from eBioscience); CD4-Per-CpCy5.5 (RPA-T4), CD127-APC (HIL-7R-M21), CD25-PE (M-A251), CD45RA-FITC (HI100), annexin V-FITC (from BD); and IFN-AlexaFluor700 (4S.B3) (from BioLegend). Immunohistochemistry antibodies include polyclonal rabbit anti–human CD3 (Agilent Technologies, catalog A045229), rat IgG2a anti–human PDPN (eBioscience, clone NZ-1.3), and monoclonal mouse anti–human IL-17a (Abnova, clone 4K5F6).
Cell purification and sorting. PBMCs were isolated by standard Ficoll-Paque PLUS (GE Healthcare) gradient centrifugation. Total CD4+ T cells were isolated by negative selection (CD4+ T Cell Enrich-ment Kit; Stemcell Technologies) and used for T cell subpopulation isolation. Naive (CD127+CD25–
CD45RA+CD45RO–), memory (CD127+CD25–CD45RA–CD45RO+), or T effector (CD127+CD25–) CD4+ T cells were sorted on a FACSAria to a purity greater than 98% as verified by post-sort analysis.
Cell activation, cell surface and intracellular staining. Cells were cultured in 96-well plates at a concentration of 5 × 10⁵ cells per well in X-VIVO15 media (BioWhittaker Inc.) without normal human serum, unless noted otherwise. Cells were stimulated with plate-bound anti-CD3 at 5 μg/ml for naive T cells or 1 μg/ml for memory T cells and T effectors, and soluble anti-CD28 at 1 μg/ml. Under Th0 conditions, cells were stimulated with IL-2; under Th1 conditions, with IL-12 and anti–IL-4; and under Th17 conditions, with IL-1β, TGF-β, IL-6, and IL-23. Media were supplemented with 40 mM NaCl where indicated. After 7 days, cells were restimulated with PMA (50 ng/ml) and ionomycin (250 ng/ml) (both from Sigma-Aldrich) in the presence of GolgiPlug (BD Biosciences). Staining with a Live/Dead Fixable Dead Cell Stain Kit (Molecular Probes) was performed before fixation to allow gating on viable cells. Cells were stained for 20 minutes at room temperature for cell surface markers. Cells were fixed and made permeable (FoxP3 stain-ing buffer set; eBioscience) and then stained with intracellular antibodies for cytokines. Fluorescence was assessed on a Fortessa flow cytometer (BD Biosciences) and analyzed using FlowJo software (Tree Star). The human IL-17 Secretion Kit was used according to manufacturer instructions (Miltenyi Biotec).
Proliferation assays. Cells were labeled with CFSE (Molecular Probes), and then stimulated as described above. CFSE dilution was assessed after 4 days by flow cytometry.
Quantification of mRNA expression levels. RNA was isolated using the Qiagen RNeasy Micro kit and con-verted to cDNA by reverse transcription with random hexamers and MultiScribe reverse transcriptase (Applied Biosystems). For mRNA gene expression assays, all probes were purchased from Applied Biosystems and the reactions were run on a 7500 Fast Real-Time PCR system (Applied Biosystems). Values are represented as the difference in Ct values normalized to β2-microglobulin as a reference gene for each sample as per the following formula: relative RNA expression = (2–dCt) × 1,000.
NanoString gene expression analysis. RNA was extracted as described above and then hybridized with a cus-tom-made CodeSet according to the manufacturer’s instructions. Barcodes were counted (1,150 fields of view per sample) on an nCounter Digital Analyzer following the manufacturer’s protocol (Nanostring Technologies Inc.). Data were processed using nSolver Analysis Software first by normalization with respect to the geometric mean of the positive control spike counts (provided by the manufacturer) and then with 4 reference genes (Actb, Gapdh, Hprt, and Tubb5). A background correction was done by subtracting the mean plus 2 standard devia-tions of 8 negative control counts (provided by the manufacturer) and eliminating data that were less than 1.
ELISA. Human IL-10 ELISAs were performed with undiluted samples taken on day 7 of Th17-polarizing culture following the manufacturer’s protocol (R&D Duoset).
Single-cell cloning. Cells from healthy controls were cultured under Th17-polarizing conditions as described above for 1 week, and then resorted as single PDPN+ or PDPN– naive and memory CD4+

1 1insight.jci.org https://doi.org/10.1172/jci.insight.92321
R E S E A R C H A R T I C L E
T cells into the wells of a 96-well plate. Clones were expanded for 3 to 4 weeks in X-VIVO15 medi-um (BioWhittaker Inc.) with 5% human serum (Gemini Bio-Products) by stimulation with irradiated autologous PBMCs in the presence of soluble anti-CD3 and anti-CD28 at 1 μg/ml with IL-2 (25 U/ml) (Th0 conditions), or with IL-2 plus IL-1β, TGF-β, IL-6, and IL-23 (Th17 conditions). Cytokines were refreshed on day 10 after stimulation and then every 3 days. Clonal populations were stained for viability and cell surface markers before fixation. Fluorescence was assessed on a Fortessa flow cytom-eter (BD Biosciences).
shRNA-mediated gene silencing. CD4 effector cells (105 cells/well) were stimulated in X-VIVO15 medium with 5% human serum overnight with plate-bound anti-CD3 (1 μg/ml) and soluble anti-CD28 (1 μg/ml). The following day, a GFP-tagged viral construct containing shRNA specific for SGK1 (TRCN0000040175) or PDPN (TRCN0000061925) and a control viral construct (all 3 constructs were from Sigma-Aldrich) were added to the culture at multiplicity of infection equal to 5 with IL-2 plus IL-1β, TGF-β, IL-6, and IL-23 (Th17 conditions). Due to a low rate of infection by the PDPN shRNA construct, cells were resorted based on GFP expression before further analysis. Cells were restimulated with PMA and ionomycin for 4 to 5 hours prior to analysis. Cultures were examined for GFP positivity by flow cytometry. PDPN expres-sion and cytokine production were measured by flow cytometry and qPCR.
CLEC-2 ligation of PDPN. Naive CD4 T cells were polarized under Th17 conditions for 1 week as previ-ously described with the addition of soluble recombinant human CLEC-2 (R&D Systems, 1718-CL-050) at 1 μg/ml unless described otherwise, with or without +40 mM NaCl. CLEC-2 was also added to PDPN shRNA experiments when cytokines were first added to the cultures. After 7 to 8 days in culture, cells were restimulated with PMA and ionomycin for 4 to 5 hours prior to analysis. PDPN expression and cytokine production were measured by flow cytometry and qPCR.
Immunohistochemistry. Formalin-fixed, paraffin-embedded (FFPE) sections were cut at 5 μm thick-ness. After quenching with 0.3% hydrogen peroxide and blocking with normal serum, sections were incubated with primary antibodies overnight, processed with the appropriate biotinylated secondary antibody and avidin/biotin staining kit with diaminobenzidine (Vector ABC HRP Kit and DAB Kit, Vector Laboratories), and counterstained with hematoxylin (64). For fluorescence, sections were incu-bated with fluorescently labeled secondary antibodies and subsequently treated with 0.7% Sudan Black in 70% ethanol to quench autofluorescence. Sections were counterstained with Hoechst Dye 33342 and mounted with VectaShield mounting medium (VectaShield Kit, Vector Laboratories). Adequate controls using isotype control antibodies were performed with each primary antibody. Acquisition and analysis were performed in a double-blinded manner. Statistical analysis was based on expression levels of at least 200 CD3+ cells per case in 4 cases each of psoriasis and cutaneous candidiasis. Brightfield images were acquired with a Leica DM5000 B microscope using a Leica color camera DFC310 Fx and the Leica Application Suite (version 4.2.0) imaging software. Fluorescence images were taken with an UltraVIEW VoX (Perkin Elmer) spinning disc confocal Nikon Ti-E Eclipse microscope. Image acquisition, visual-ization, and quantification were performed using the Volocity 6.3 software (Improvision). Images were processed with ImageJ (NIH) software (65).
Statistics. Statistical analysis was run using Prism (GraphPad Software). Statistical tests are listed in the figure legends, with P values equal to or less than 0.05 being considered significant.
Study approval and patient samples. Peripheral venous blood was obtained from healthy control volun-teers in compliance with Institutional Review Board protocols at Yale University School of Medicine. Leukopaks from anonymous healthy control volunteers were ordered from New York Blood Center (Long Island City, New York, USA). Human skin biopsy tissue was obtained according to Institutional Review Board-approved protocols.
Author contributionsANN designed, performed, and analyzed experiments, and wrote the manuscript. GDP and MM per-formed and analyzed the immunohistochemistry experiments. PPA assisted with designing and performing the IL-10 experiments. MT obtained the candidiasis biopsy samples and designed the immunohistochemis-try experiments. VKK designed and the NanoString primer sets and analyzed the NanoString experiment. DP designed the immunohistochemistry experiments, provided reagents, and wrote the manuscript. DAH designed experiments and wrote the manuscript.

1 2insight.jci.org https://doi.org/10.1172/jci.insight.92321
R E S E A R C H A R T I C L E
AcknowledgmentsWe thank Lesley Devine and Chao Wang for their assistance with FACS, and Patrick Burkett for his assis-tance with performing and analyzing the NanoString experiment. This research was supported by NIH grants P01 AI045757, U19 AI046130, U19 AI070352, and P01 AI039671, the NIH Medical Scientist Training Program Training Grant T32GM007205, and the Nancy Taylor Foundation for Chronic Diseases.
Address correspondence to: David A. Hafler, Yale School of Medicine, 15 York Street, PO Box 208018, New Haven, Connecticut 06520-8018, USA. Phone: 203.785.6351; E-mail: [email protected].
1. Nylander A, Hafler DA. Multiple sclerosis. J Clin Invest. 2012;122(4):1180–1188. 2. Fujino S, et al. Increased expression of interleukin 17 in inflammatory bowel disease. Gut. 2003;52(1):65–70. 3. Kotake S, et al. IL-17 in synovial fluids from patients with rheumatoid arthritis is a potent stimulator of osteoclastogenesis.
J Clin Invest. 1999;103(9):1345–1352. 4. Lock C, et al. Gene-microarray analysis of multiple sclerosis lesions yields new targets validated in autoimmune encephalomy-
elitis. Nat Med. 2002;8(5):500–508. 5. Teunissen MB, Koomen CW, de Waal Malefyt R, Wierenga EA, Bos JD. Interleukin-17 and interferon-γ synergize in the
enhancement of proinflammatory cytokine production by human keratinocytes. J Invest Dermatol. 1998;111(4):645–649. 6. Zielinski CE, et al. Pathogen-induced human TH17 cells produce IFN-γ or IL-10 and are regulated by IL-1β. Nature.
2012;484(7395):514–518. 7. Lee Y, et al. Induction and molecular signature of pathogenic TH17 cells. Nat Immunol. 2012;13(10):991–999. 8. Cao Y, et al. Functional inflammatory profiles distinguish myelin-reactive T cells from patients with multiple sclerosis. Sci Transl
Med. 2015;7(287):287ra74. 9. Kleinewietfeld M, et al. Sodium chloride drives autoimmune disease by the induction of pathogenic TH17 cells. Nature.
2013;496(7446):518–522. 10. Wu C, et al. Induction of pathogenic TH17 cells by inducible salt-sensing kinase SGK1. Nature. 2013;496(7446):513–517. 11. Hernandez AL, et al. Sodium chloride inhibits the suppressive function of FOXP3+ regulatory T cells. J Clin Invest.
2015;125(11):4212–4222. 12. Martín-Villar E, et al. Characterization of human PA2.26 antigen (T1alpha-2, podoplanin), a small membrane mucin induced
in oral squamous cell carcinomas. Int J Cancer. 2005;113(6):899–910. 13. Wetterwald A, et al. Characterization and cloning of the E11 antigen, a marker expressed by rat osteoblasts and osteocytes.
Bone. 1996;18(2):125–132. 14. Farr A, Nelson A, Hosier S. Characterization of an antigenic determinant preferentially expressed by type I epithelial cells in
the murine thymus. J Histochem Cytochem. 1992;40(5):651–664. 15. Farr AG, Berry ML, Kim A, Nelson AJ, Welch MP, Aruffo A. Characterization and cloning of a novel glycoprotein expressed
by stromal cells in T-dependent areas of peripheral lymphoid tissues. J Exp Med. 1992;176(5):1477–1482. 16. Rishi AK, et al. Cloning, characterization, and development expression of a rat lung alveolar type I cell gene in embryonic
endodermal and neural derivatives. Dev Biol. 1995;167(1):294–306. 17. Breiteneder-Geleff S, et al. Podoplanin, novel 43-kd membrane protein of glomerular epithelial cells, is down-regulated in puro-
mycin nephrosis. Am J Pathol. 1997;151(4):1141–1152. 18. Kato Y, Sasagawa I, Kaneko M, Osawa M, Fujita N, Tsuruo T. Aggrus: a diagnostic marker that distinguishes seminoma from
embryonal carcinoma in testicular germ cell tumors. Oncogene. 2004;23(52):8552–8556. 19. Mishima K, et al. Podoplanin expression in primary central nervous system germ cell tumors: a useful histological marker for
the diagnosis of germinoma. Acta Neuropathol. 2006;111(6):563–568. 20. Schacht V, Dadras SS, Johnson LA, Jackson DG, Hong YK, Detmar M. Up-regulation of the lymphatic marker podo-
planin, a mucin-type transmembrane glycoprotein, in human squamous cell carcinomas and germ cell tumors. Am J Pathol. 2005;166(3):913–921.
21. Kimura N, Kimura I. Podoplanin as a marker for mesothelioma. Pathol Int. 2005;55(2):83–86. 22. Shibahara J, Kashima T, Kikuchi Y, Kunita A, Fukayama M. Podoplanin is expressed in subsets of tumors of the central ner-
vous system. Virchows Arch. 2006;448(4):493–499. 23. Honma M, Minami-Hori M, Takahashi H, Iizuka H. Podoplanin expression in wound and hyperproliferative psoriatic epider-
mis: regulation by TGF-β and STAT-3 activating cytokines, IFN-γ, IL-6, and IL-22. J Dermatol Sci. 2012;65(2):134–140. 24. Ekwall AK, et al. The tumour-associated glycoprotein podoplanin is expressed in fibroblast-like synoviocytes of the hyperplastic
synovial lining layer in rheumatoid arthritis. Arthritis Res Ther. 2011;13(2):R40. 25. Colonna M, Samaridis J, Angman L. Molecular characterization of two novel C-type lectin-like receptors, one of which is selec-
tively expressed in human dendritic cells. Eur J Immunol. 2000;30(2):697–704. 26. Kerrigan AM, et al. CLEC-2 is a phagocytic activation receptor expressed on murine peripheral blood neutrophils. J Immunol.
2009;182(7):4150–4157. 27. Acton SE, et al. Podoplanin-rich stromal networks induce dendritic cell motility via activation of the C-type lectin receptor
CLEC-2. Immunity. 2012;37(2):276–289. 28. Bertozzi CC, et al. Platelets regulate lymphatic vascular development through CLEC-2-SLP-76 signaling. Blood.
2010;116(4):661–670. 29. Suzuki-Inoue K, et al. Essential in vivo roles of the C-type lectin receptor CLEC-2: embryonic/neonatal lethality of CLEC-
2-deficient mice by blood/lymphatic misconnections and impaired thrombus formation of CLEC-2-deficient platelets. J Biol Chem. 2010;285(32):24494–24507.
1 3insight.jci.org https://doi.org/10.1172/jci.insight.92321
R E S E A R C H A R T I C L E
30. Schacht V, et al. T1alpha/podoplanin deficiency disrupts normal lymphatic vasculature formation and causes lymphedema. EMBO J. 2003;22(14):3546–3556.
31. Scholl FG, Gamallo C, Vilaro S, Quintanilla M. Identification of PA2.26 antigen as a novel cell-surface mucin-type glycoprotein that induces plasma membrane extensions and increased motility in keratinocytes. J Cell Sci. 1999;112(pt 24):4601–4613.
32. Martín-Villar E, Megías D, Castel S, Yurrita MM, Vilaró S, Quintanilla M. Podoplanin binds ERM proteins to activate RhoA and promote epithelial-mesenchymal transition. J Cell Sci. 2006;119(pt 21):4541–4553.
33. Fehon RG, McClatchey AI, Bretscher A. Organizing the cell cortex: the role of ERM proteins. Nat Rev Mol Cell Biol. 2010;11(4):276–287.
34. Miyamoto Y, et al. Podoplanin is an inflammatory protein upregulated in Th17 cells in SKG arthritic joints. Mol Immunol. 2013;54(2):199–207.
35. Peters A, et al. Th17 cells induce ectopic lymphoid follicles in central nervous system tissue inflammation. Immunity. 2011;35(6):986–996.
36. Jäger A, Dardalhon V, Sobel RA, Bettelli E, Kuchroo VK. Th1, Th17, and Th9 effector cells induce experimental autoimmune encephalomyelitis with different pathological phenotypes. J Immunol. 2009;183(11):7169–7177.
37. Jones GW, et al. Interleukin-27 inhibits ectopic lymphoid-like structure development in early inflammatory arthritis. J Exp Med. 2015;212(11):1793–1802.
38. Peters A, et al. Podoplanin negatively regulates CD4+ effector T cell responses. J Clin Invest. 2015;125(1):129–140. 39. Ghoreschi K, et al. Generation of pathogenic T(H)17 cells in the absence of TGF-β signalling. Nature. 2010;467(7318):967–971. 40. Stritesky GL, Yeh N, Kaplan MH. IL-23 promotes maintenance but not commitment to the Th17 lineage. J Immunol.
2008;181(9):5948–5955. 41. Cai G, Anumanthan A, Brown JA, Greenfield EA, Zhu B, Freeman GJ. CD160 inhibits activation of human CD4+ T cells
through interaction with herpesvirus entry mediator. Nat Immunol. 2008;9(2):176–185. 42. Lucas S, Ghilardi N, Li J, de Sauvage FJ. IL-27 regulates IL-12 responsiveness of naive CD4+ T cells through Stat1-dependent
and -independent mechanisms. Proc Natl Acad Sci U S A. 2003;100(25):15047–15052. 43. Huang TF, Liu CZ, Yang SH. Aggretin, a novel platelet-aggregation inducer from snake (Calloselasma rhodostoma) venom,
activates phospholipase C by acting as a glycoprotein Ia/IIa agonist. Biochem J. 1995;309(pt 3):1021–1027. 44. Shin Y, Morita T. Rhodocytin, a functional novel platelet agonist belonging to the heterodimeric C-type lectin family, induces
platelet aggregation independently of glycoprotein Ib. Biochem Biophys Res Commun. 1998;245(3):741–745. 45. Soltész B, Tóth B, Sarkadi AK, Erdős M, Maródi L. The evolving view of IL-17-mediated immunity in defense against Mucocu-
taneous Candidiasis in humans. Int Rev Immunol. 2015;34(4):348–363. 46. Tesmer LA, Lundy SK, Sarkar S, Fox DA. Th17 cells in human disease. Immunol Rev. 2008;223:87–113. 47. Esplugues E, et al. Control of TH17 cells occurs in the small intestine. Nature. 2011;475(7357):514–518. 48. Yang Y, et al. T-bet is essential for encephalitogenicity of both Th1 and Th17 cells. J Exp Med. 2009;206(7):1549–1564. 49. Schraml BU, et al. The AP-1 transcription factor Batf controls T(H)17 differentiation. Nature. 2009;460(7253):405–409. 50. Yang XO, et al. STAT3 regulates cytokine-mediated generation of inflammatory helper T cells. J Biol Chem.
2007;282(13):9358–9363. 51. Mudter J, et al. IRF4 regulates IL-17A promoter activity and controls RORγt-dependent Th17 colitis in vivo. Inflamm Bowel Dis.
2011;17(6):1343–1358. 52. McWilliams IL, Rajbhandari R, Nozell S, Benveniste E, Harrington LE. STAT4 controls GM-CSF production by both Th1 and
Th17 cells during EAE. J Neuroinflammation. 2015;12:128. 53. Astarita JL, Acton SE, Turley SJ. Podoplanin: emerging functions in development, the immune system, and cancer. Front Immu-
nol. 2012;3:283. 54. Joller N, et al. Cutting edge: TIGIT has T cell-intrinsic inhibitory functions. J Immunol. 2011;186(3):1338–1342. 55. Daëron M, Jaeger S, Du Pasquier L, Vivier E. Immunoreceptor tyrosine-based inhibition motifs: a quest in the past and future.
Immunol Rev. 2008;224:11–43. 56. McGeachy MJ, et al. TGF-β and IL-6 drive the production of IL-17 and IL-10 by T cells and restrain T(H)-17 cell-mediated
pathology. Nat Immunol. 2007;8(12):1390–1397. 57. Agrawal S, Ganguly S, Hajian P, Cao JN, Agrawal A. PDGF upregulates CLEC-2 to induce T regulatory cells. Oncotarget.
2015;6(30):28621–28632. 58. Machnik A, et al. Macrophages regulate salt-dependent volume and blood pressure by a vascular endothelial growth factor-C-depen-
dent buffering mechanism. Nat Med. 2009;15(5):545–552. 59. Go WY, Liu X, Roti MA, Liu F, Ho SN. NFAT5/TonEBP mutant mice define osmotic stress as a critical feature of the lym-
phoid microenvironment. Proc Natl Acad Sci U S A. 2004;101(29):10673–10678. 60. Trautwein-Weidner K, Gladiator A, Nur S, Diethelm P, LeibundGut-Landmann S. IL-17-mediated antifungal defense in the
oral mucosa is independent of neutrophils. Mucosal Immunol. 2015;8(2):221–231. 61. Patel DD, Kuchroo VK. Th17 cell pathway in human immunity: lessons from genetics and therapeutic interventions. Immunity.
2015;43(6):1040–1051. 62. Richardson JP, Moyes DL. Adaptive immune responses to Candida albicans infection. Virulence. 2015;6(4):327–337. 63. Diani M, Altomare G, Reali E. T Helper Cell Subsets in Clinical Manifestations of Psoriasis. J Immunol Res.
2016;2016:7692024. 64. Pitt D, Nagelmeier IE, Wilson HC, Raine CS. Glutamate uptake by oligodendrocytes: Implications for excitotoxicity in multiple
sclerosis. Neurology. 2003;61(8):1113–1120. 65. Schneider CA, Rasband WS, Eliceiri KW. NIH Image to ImageJ: 25 years of image analysis. Nat Methods. 2012;9(7):671–675.