poe 3 data analysis assignment - knightscholar.geneseo.edu
TRANSCRIPT

SUNY GeneseoKnightScholar
Principles of Ecology Sustainability Curriculum
2018
POE 3 data analysis assignmentSuann YangSUNY Geneseo, [email protected]
Follow this and additional works at: https://knightscholar.geneseo.edu/sustainability-curriculum-principles-of-ecology
This work is licensed under a Creative Commons Attribution-Share Alike 4.0 License.
This Open Educational Resource is brought to you for free and open access by the Sustainability Curriculum at KnightScholar. It has been accepted forinclusion in Principles of Ecology by an authorized administrator of KnightScholar. For more information, please contact [email protected].
Recommended CitationYang, Suann, "POE 3 data analysis assignment" (2018). Principles of Ecology. 3.https://knightscholar.geneseo.edu/sustainability-curriculum-principles-of-ecology/3

Instructor Notes
FoodSustainability:Dataanalysisandinterpretationassignment OverviewThis assignment is designed to
2. Evaluatewaystoalleviatetheenvironmentaldegradationthatcanbecausedbyagriculture,including:
a. Interpretingstatisticalresultstoevaluateamethod’seffectiveness.b. Conductingatwo-samplecomparisoninR.
Students will be analyzing a subset of data, modified from Bender and van der Heijden (2015). In this study, Bender and van der Heijden (2015) ask the question “Does enriching the soil microbiota improve soil quality and crop yield?” There can be one or two class periods allotted for this assignment. Students will need to bring their laptops with RStudio on both days. The assignment is introduced at the end of the class prior to the two class periods dedicated to it. For homework, students work on their own to create graphs in R of a common data set. This is facilitated by an online assignment (distributed via course management system, or paper handout) to practice the R syntax. During the next class, students will practice (or learn!) to do a two-sample t-test in R, and interpret those results. Then, each group divides up the remaining data sets among the students in the group. Two options are possible from here: If there is time, each student will then create graphs, conduct a two-sample t-test, and interpret his/her results for his/her data set. Near the end of this class period, the group will compile their results, and discuss whether or not adding soil microbiota is an effective way to improve soil quality and crop yield. Each student submits an individual, written evaluation based on the group discussion for homework that is due at the beginning of the next class period. If there is not an opportunity for students to get started during class on their own data set, then they will write the code for homework (and perhaps try to run it). Then, any troubleshooting will occur in the next class while each person analyzes his/her assigned data set. Compiling and discussing results follow, and students should complete their written evaluation by the end of this class period. Materials
1. Dataset modified from Bender and van der Heijden (2015) provided as “POE 3 soil biota data.csv”
2. Slides of Bender and van der Heijden (2015) question and experimental design, provided as “POE 3 mini-lecture.pptx”
3. Hartvigsen, G. 2014. A Primer in Biological Data Analysis and Visualization Using R. Columbia University Press.
4. R script for visualizing the data and demonstrating how to conduct a t-test, provided as “POE 3 graphs and t-test assignment.r”

Instructor Notes
(endoflastclassbeforebeginningtheassignment)IntroductionAfter exploring the ways in which agriculture can alter decomposition and nutrient cycling, students are introduced to the existence of the variety of sustainable farming practices. One specific method is then investigated:
The group writing will become the group’s hypothesis for the experiment:
In this component of Bender and van der Heijden’s (2015) experiment, they added enriched soil microbiota or reduced microbiota to sterilized soil, and then grew corn in it. The overview for the rest of the assignment is then described to the class, and students begin the Canvas activity.
Onlineactivityforhomework,duenextclassperiodThe purpose of the activity is to prepare students to decide what kind of graphs to draw and what code to write. They upload PDFs of their graphs to a course management system (or printed and turned in at beginning of the next class). Create a quiz or tutorial in your course management system (or make a paper handout) as follows: Preparationsteps:1)Makeaworkingfolder(e.g.,Desktop//Ecology//R_analyses.)2)Next,wewillcreateanRScriptfile.
• Read1.5USINGSCRIPTFILES(pp.19-20)intheHartvigsenPrimer.• OpenRStudio.Fromyourtoolbar,createanRScriptbyclickingonFileàNewFileàR
Script.
Doesincreasingsoilorganismbiodiversityhaveaneffectonsoilquality?
ORGANISMS
Groupindexcard:Howmightsoilorganismslikebacteria,fungi,andsmallinvertebratesaffectsoilquality?
sterilesoil sterilesoil
1. Collectedleachatebelowtheboxafterwatering2. Analyzedleachatefordifferentformsofnitrogen3. Harvestedcornforbiomassmeasurement4. Analyzedcornbiomassfornitrogencontent
Instructor Notes
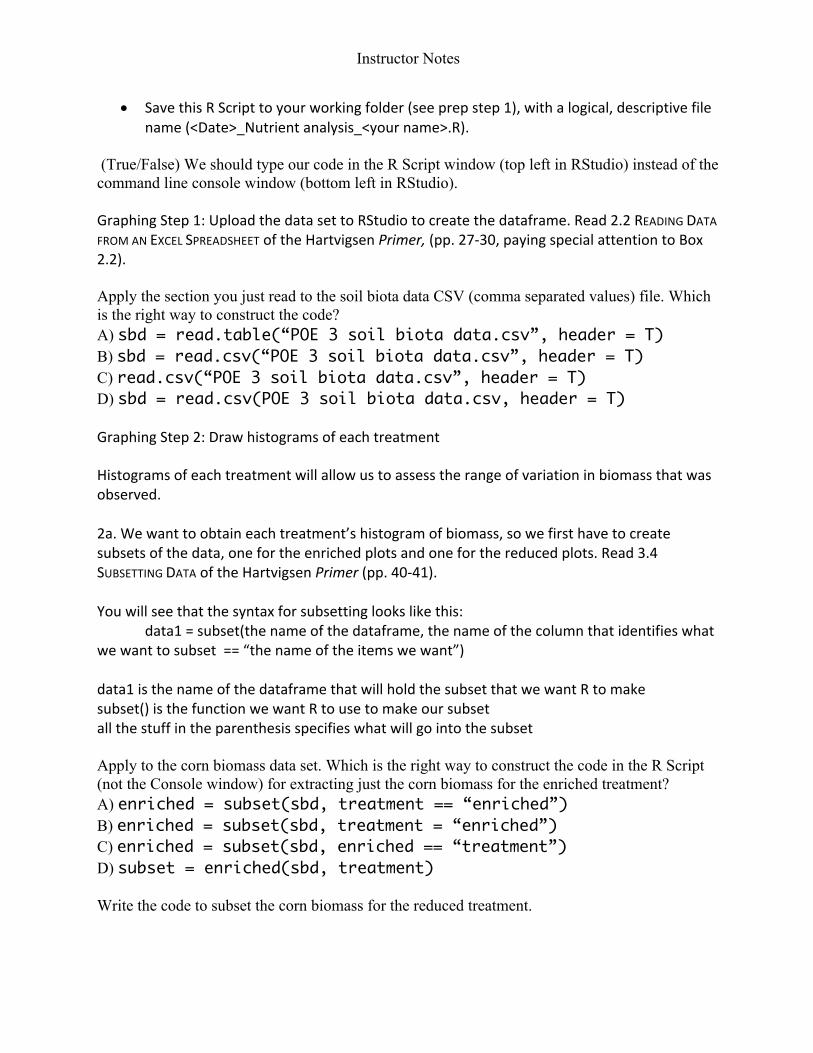
• SavethisRScripttoyourworkingfolder(seeprepstep1),withalogical,descriptivefilename(<Date>_Nutrientanalysis_<yourname>.R).
(True/False) We should type our code in the R Script window (top left in RStudio) instead of the command line console window (bottom left in RStudio). GraphingStep1:UploadthedatasettoRStudiotocreatethedataframe.Read2.2READINGDATAFROMANEXCELSPREADSHEEToftheHartvigsenPrimer,(pp.27-30,payingspecialattentiontoBox2.2). Apply the section you just read to the soil biota data CSV (comma separated values) file. Which is the right way to construct the code? A) sbd = read.table(“POE 3 soil biota data.csv”, header = T) B) sbd = read.csv(“POE 3 soil biota data.csv”, header = T) C) read.csv(“POE 3 soil biota data.csv”, header = T) D) sbd = read.csv(POE 3 soil biota data.csv, header = T) GraphingStep2:Drawhistogramsofeachtreatment Histogramsofeachtreatmentwillallowustoassesstherangeofvariationinbiomassthatwasobserved.2a.Wewanttoobtaineachtreatment’shistogramofbiomass,sowefirsthavetocreatesubsetsofthedata,onefortheenrichedplotsandoneforthereducedplots.Read3.4SUBSETTINGDATAoftheHartvigsenPrimer(pp.40-41).Youwillseethatthesyntaxforsubsettinglookslikethis: data1=subset(thenameofthedataframe,thenameofthecolumnthatidentifieswhatwewanttosubset==“thenameoftheitemswewant”)data1isthenameofthedataframethatwillholdthesubsetthatwewantRtomakesubset()isthefunctionwewantRtousetomakeoursubsetallthestuffintheparenthesisspecifieswhatwillgointothesubset Apply to the corn biomass data set. Which is the right way to construct the code in the R Script (not the Console window) for extracting just the corn biomass for the enriched treatment? A) enriched = subset(sbd, treatment == “enriched”) B) enriched = subset(sbd, treatment = “enriched”) C) enriched = subset(sbd, enriched == “treatment”) D) subset = enriched(sbd, treatment) Write the code to subset the corn biomass for the reduced treatment.
Instructor Notes
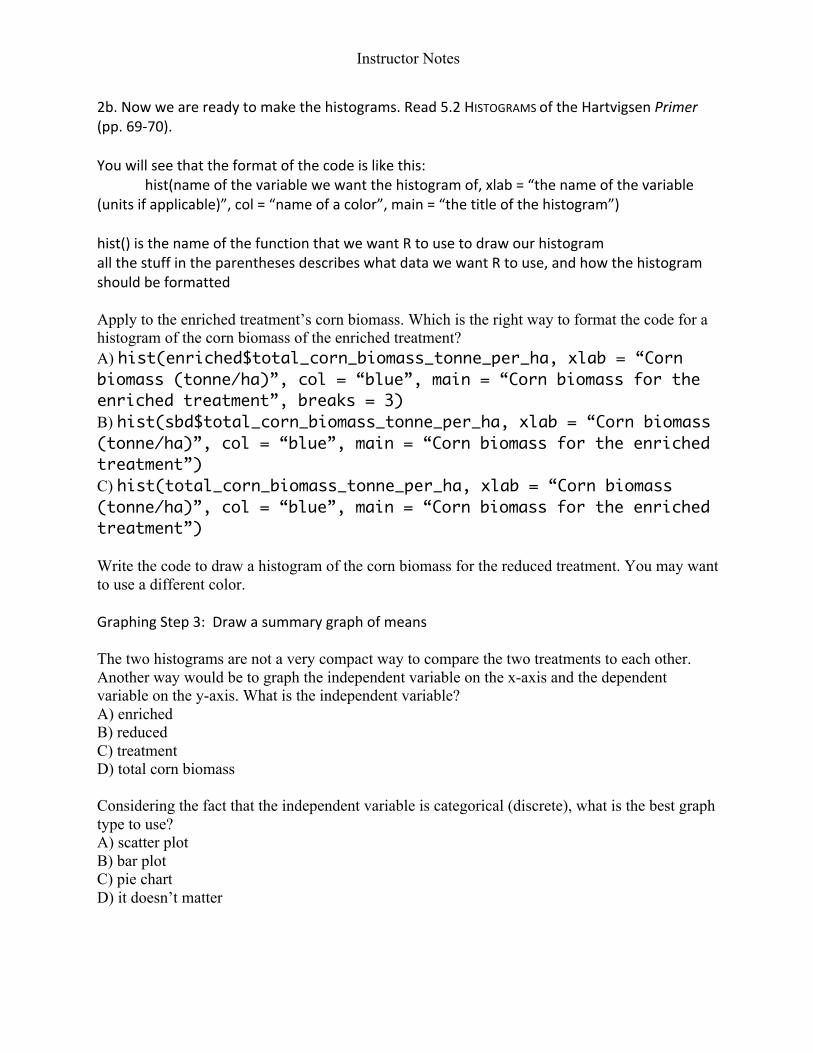
2b.Nowwearereadytomakethehistograms.Read5.2HISTOGRAMSoftheHartvigsenPrimer(pp.69-70).Youwillseethattheformatofthecodeislikethis: hist(nameofthevariablewewantthehistogramof,xlab=“thenameofthevariable(unitsifapplicable)”,col=“nameofacolor”,main=“thetitleofthehistogram”)hist()isthenameofthefunctionthatwewantRtousetodrawourhistogramallthestuffintheparenthesesdescribeswhatdatawewantRtouse,andhowthehistogramshouldbeformatted Apply to the enriched treatment’s corn biomass. Which is the right way to format the code for a histogram of the corn biomass of the enriched treatment? A) hist(enriched$total_corn_biomass_tonne_per_ha, xlab = “Corn biomass (tonne/ha)”, col = “blue”, main = “Corn biomass for the enriched treatment”, breaks = 3) B) hist(sbd$total_corn_biomass_tonne_per_ha, xlab = “Corn biomass (tonne/ha)”, col = “blue”, main = “Corn biomass for the enriched treatment”) C) hist(total_corn_biomass_tonne_per_ha, xlab = “Corn biomass (tonne/ha)”, col = “blue”, main = “Corn biomass for the enriched treatment”) Write the code to draw a histogram of the corn biomass for the reduced treatment. You may want to use a different color. GraphingStep3:Drawasummarygraphofmeans The two histograms are not a very compact way to compare the two treatments to each other. Another way would be to graph the independent variable on the x-axis and the dependent variable on the y-axis. What is the independent variable? A) enriched B) reduced C) treatment D) total corn biomass Considering the fact that the independent variable is categorical (discrete), what is the best graph type to use? A) scatter plot B) bar plot C) pie chart D) it doesn’t matter
Instructor Notes
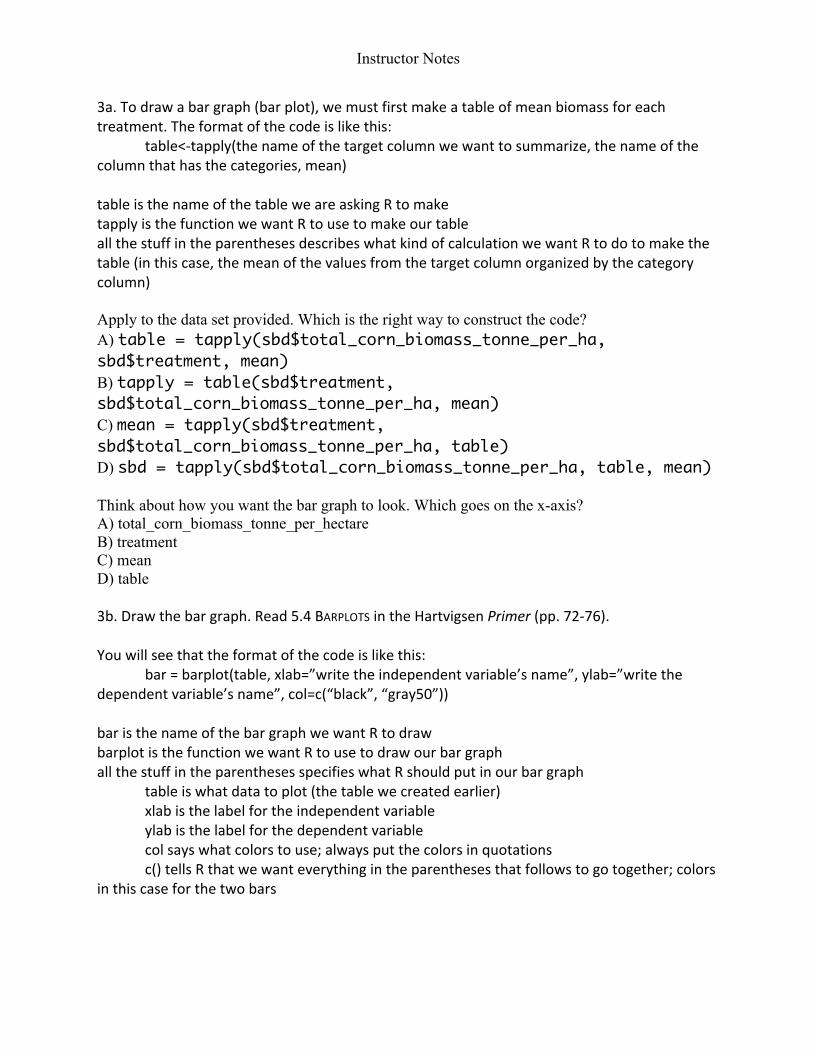
3a.Todrawabargraph(barplot),wemustfirstmakeatableofmeanbiomassforeachtreatment.Theformatofthecodeislikethis: table<-tapply(thenameofthetargetcolumnwewanttosummarize,thenameofthecolumnthathasthecategories,mean)tableisthenameofthetableweareaskingRtomaketapplyisthefunctionwewantRtousetomakeourtableallthestuffintheparenthesesdescribeswhatkindofcalculationwewantRtodotomakethetable(inthiscase,themeanofthevaluesfromthetargetcolumnorganizedbythecategorycolumn) Apply to the data set provided. Which is the right way to construct the code? A) table = tapply(sbd$total_corn_biomass_tonne_per_ha, sbd$treatment, mean) B) tapply = table(sbd$treatment, sbd$total_corn_biomass_tonne_per_ha, mean) C) mean = tapply(sbd$treatment, sbd$total_corn_biomass_tonne_per_ha, table) D) sbd = tapply(sbd$total_corn_biomass_tonne_per_ha, table, mean) Think about how you want the bar graph to look. Which goes on the x-axis? A) total_corn_biomass_tonne_per_hectare B) treatment C) mean D) table 3b.Drawthebargraph.Read5.4BARPLOTSintheHartvigsenPrimer(pp.72-76).Youwillseethattheformatofthecodeislikethis: bar=barplot(table,xlab=”writetheindependentvariable’sname”,ylab=”writethedependentvariable’sname”,col=c(“black”,“gray50”))baristhenameofthebargraphwewantRtodrawbarplotisthefunctionwewantRtousetodrawourbargraphallthestuffintheparenthesesspecifieswhatRshouldputinourbargraph tableiswhatdatatoplot(thetablewecreatedearlier) xlabisthelabelfortheindependentvariable ylabisthelabelforthedependentvariable colsayswhatcolorstouse;alwaysputthecolorsinquotations c()tellsRthatwewanteverythingintheparenthesesthatfollowstogotogether;colorsinthiscaseforthetwobars
Instructor Notes
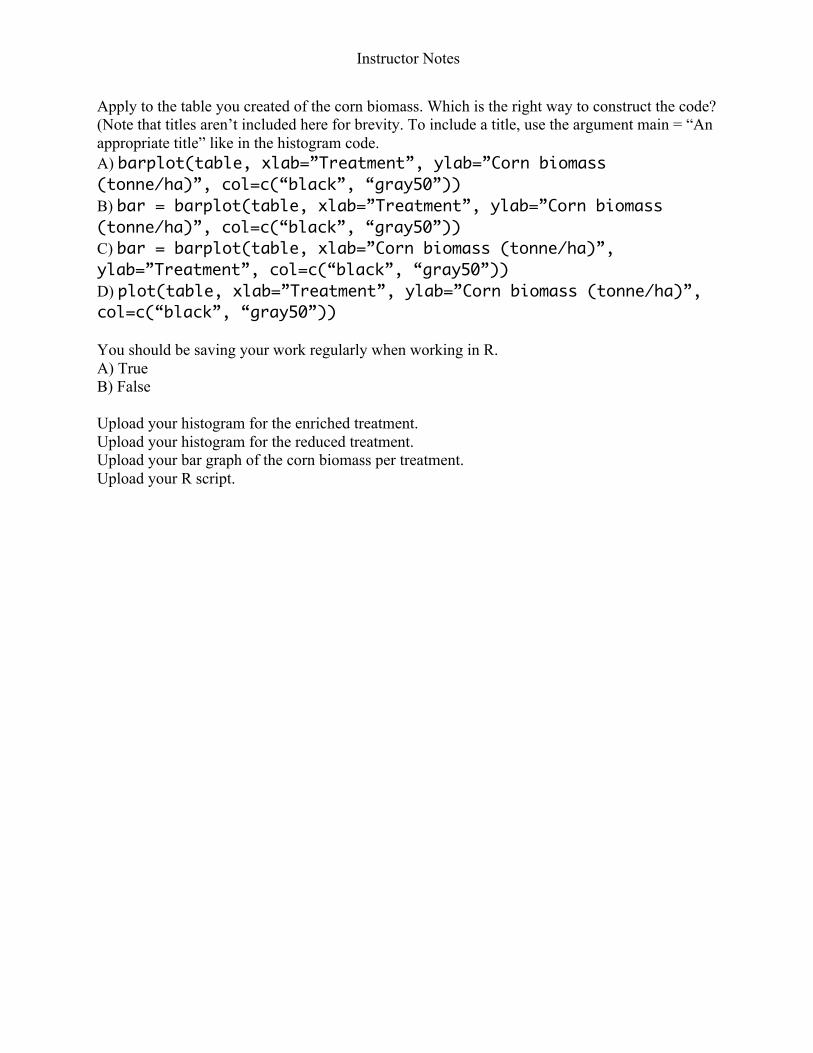
Apply to the table you created of the corn biomass. Which is the right way to construct the code? (Note that titles aren’t included here for brevity. To include a title, use the argument main = “An appropriate title” like in the histogram code. A) barplot(table, xlab=”Treatment”, ylab=”Corn biomass (tonne/ha)”, col=c(“black”, “gray50”)) B) bar = barplot(table, xlab=”Treatment”, ylab=”Corn biomass (tonne/ha)”, col=c(“black”, “gray50”)) C) bar = barplot(table, xlab=”Corn biomass (tonne/ha)”, ylab=”Treatment”, col=c(“black”, “gray50”)) D) plot(table, xlab=”Treatment”, ylab=”Corn biomass (tonne/ha)”, col=c(“black”, “gray50”)) You should be saving your work regularly when working in R. A) True B) False Upload your histogram for the enriched treatment. Upload your histogram for the reduced treatment. Upload your bar graph of the corn biomass per treatment. Upload your R script.

Instructor Notes
(Firstfullclassperiod)t-testStudents will need to bring their laptops and a copy of Hartvigsen’s Primer. After reviewing the histograms and bar graphs generated by the class, students decide whether or not the treatment affects the total corn biomass.
Demonstrate how to conduct a t-test on the corn biomass data:
1. Check the assumptions. (Shapiro-Wilk, H0 is that the data are normal; F-test, H0 is that the variances are equal).
2. Proceed to the t-test. 3. The class interprets the p-value together.
(Homeworkornextclassperiod)JigsawEach group divides up the remaining dependent variables: Total corn N content, total N leaching, organic N leaching, nitrate leaching. They may want to do Total corn N content together first, then split the remaining 3. Group members upload their individual work to a Google Document. A template for this document, for one dependent variable, is provided below. GoogleDocumentTemplate Total Corn Nitrogen Content Analysis Replace this text with the name of the person who completes this section (e.g., by Charles Darwin) Why is this measurement informative for the question we are studying? Replace this text with your answer. Graphs Replace this text with your histograms and bar graph. Make sure your graph axes are labeled appropriately. Include a title and caption (Figure 1a. Blah blah blah. Use Figure 1a, 1b, 1c).
sterilesoil sterilesoil
enriched reduced
Treatment
Cor
n bi
omas
s (to
nne/
ha
010
2030
40
Corn biomass for the enriched treatment
Corn biomass (tonne/ha)
Freq
uenc
y
36 38 40 42 44
0.0
0.5
1.0
1.5
2.0
2.5
3.0
Corn biomass for the reduced treatment
Corn biomass (tonne/ha)
Freq
uenc
y
30 32 34 36 38
01
23
4
Discuss:Whatdoyouconcludeaboutsoilbiotadiversityandcornbiomass?BUTHOWDIFFERENTISDIFFERENTENOUGH?
enriched reduced
Treatment
Cor
n bi
omas
s (to
nne/
ha
010
2030
40
Weneedtodostatistics:Thet-tests comparetwo samples(orgroups)H0:ThemeansofGroupAandBdonotdifferHA:ThemeansofGroupAandBdodiffer
Thet-testproducesap-value:approximatestheprobabilitythatthenullhypothesis(H0)istrue

Instructor Notes
Statistical analysis Statistical hypotheses Null hypothesis: Replace this text with your null hypothesis. Alternative hypothesis: Replace this text with your alternative hypothesis. (Add a sentence to explain why you have chosen Enriched>Reduced, Enriched<Reduced, or Enriched≠Reduced). Is a t-test appropriate to conduct? Assumption Test p-value
Normal distributions Shapiro-Wilk TYPE YOUR P VALUES HERE
Variances are equal F test TYPE YOUR P VALUE HERE Replace this text with your interpretations of the p-values above to answer the question. Fill out the table to report the results from your t-test. t-statistic df p-value
Interpret the results of your t-test statistically. Replace this text with a few sentences that interprets the p-value with respect to your statistical hypotheses. Interpret the results of your t-test biologically. Replace this text with a few sentences that interprets the t-test results with respect to the question we are studying. It may be helpful to review the reason you gave for why this measurement is informative (first question). Finalstep:individualwritingassignmentIndividuals upload their work to the individual assignment space on Canvas:
Using the analyses completed by your group to address the question:
• How effective is enriching soil biota diversity for soil quality and crop yield? Apply your findings to suggest strategies for reducing the impact of agriculture on nutrient cycling.
In your typed, double-spaced response, include and refer to appropriate figures that either you or your group mates made (label with figure numbers and captions) and statistical results (include p-values and mean values). Propose an ecological explanation for what your found. Print (and

Instructor Notes
staple if applicable) and bring to our next class. Include your name, section, and new group number please.
External references are not required, but if you use any, please include citations.
FAQs
1. Some of my group did not finish analyzing their data sets. What do I do? o You could communicate to find out when each person is able to have the work
completed. o You could find out if they need help, and either offer assistance or refer your
group mate to office hours. 2. I'm one of those people who did not finish analyzing my data set, because I'm not sure
what is going on. How can I get help in a timely fashion? o You could contact the instructor or TA. o You could ask one of your group mates for help.
3. Which graphs should I include in my write-up? o You should include the graphs that support the message that you are conveying in
your writing, without redundancy. (Hint: for each dependent variable, the two histograms we drew are equal to their one bar graph)
4. How do I summarize a statistical result? o You want to report a p-value along with the biological interpretation. o You want to be concise. o Good summary: Corn had significantly higher biomass when the soil biota was
enriched compared to when soil biota was reduced (t = 8.0732, df = 14, p<0.0001). (Note, the cutoff for reporting an exact p-value is 0.0001; any smaller than that is written p<0.0001)
o Bad summary: Corn biomass differed in reduced vs. enriched treatments. (Note, this does not communicate what the difference is. Plus, there are no statistical results here.)
o Worse summary: Because p<0.05, I rejected the null hypothesis. (Note, this does not communicate anything at all about the experiment)
GradingrubricComponent Satisfactory (3) Progressing (2) Needs improvement
(1) Structure: organized, few errors
Statistics: p-values reported and interpreted correctly
Figures: graphs support the argument with redundancy
Argument: conclusions are

Instructor Notes
consistent with the statistical results Ecological explanation: mechanisms are biologically correct and relevant

Instructor Notes
References:
Bender SF, van der Heijden MGA (2015) Soil biota enhance agricultural sustainability by improving crop yield, nutrient uptake and reducing nitrogen leaching losses. Journal of Applied Ecology 52(1): 228-239. https://doi.org/10.1111/1365-2664.12351
Bender SF, van der Heijden MGA (2014) Data from: Soil biota enhance agricultural sustainability by improving crop yield, nutrient uptake and reducing nitrogen leaching losses. Dryad Digital Repository. https://doi.org/10.5061/dryad.p5v4g