poland - university of minnesota duluthjvileta/documents/businessforecastreportpolandbmi.pdfswot...
TRANSCRIPT

Published by BUSINESS MONITOR INTERNATIONAL LTD
BUSINESS FORECAST REPORT
Q4 2013www.businessmonitor.com
POLANDINCLUDES 10-YEAR FORECAST TO 2022
The Recovery Has Arrived
ISSN 1745-0667Published by Business Monitor International Ltd.
Copy Deadline: 16 August 2013
2 Business Monitor International Ltdwww.businessmonitor.com
POLAND Q4 2013 P
OLA
ND
– M
AC
RO
EC
ON
OM
IC IN
DIC
ATO
RS
20
12e
201
3f 2
014f
201
5f 2
016f
201
7f 2
018f
201
9f 2
020f
202
1f 2
022f
Nom
inal
GD
P, U
S$b
n [1
]49
8.6
522.
351
1.6
569.
561
6.8
657.
670
5.5
747.
979
9.4
847.
690
2.5
Nom
inal
GD
P, P
LNbn
[2]
1,62
2.1
1,64
9.3
1,71
2.0
1,80
5.9
1,92
7.4
2,05
4.9
2,18
7.2
2,31
2.4
2,45
8.3
2,60
6.3
2,77
5.3
Nom
inal
GD
P, E
UR
bn [2
]39
2.6
392.
740
2.8
463.
051
4.0
548.
058
7.9
623.
366
6.2
706.
375
2.1
GD
P p
er c
apita
, US
$ [2
]13
,048
13,6
6613
,385
14,9
0116
,138
17,2
0818
,470
19,5
8920
,951
22,2
3023
,696
GD
P p
er c
apita
, EU
R [2
]10
,274
10,2
7510
,539
12,1
1513
,448
14,3
4015
,391
16,3
2417
,459
18,5
2519
,746
Rea
l GD
P g
row
th, %
cha
nge
y-o-
y [2
]2.
01.
22.
32.
83.
73.
63.
52.
83.
33.
03.
5
Priv
ate
final
con
sum
ptio
n, %
of G
DP
[2]
60.6
59.9
59.3
58.9
58.8
58.6
58.4
58.0
57.8
57.5
57.4
Priv
ate
final
con
sum
ptio
n, re
al g
row
th %
y-o
-y [2
]1.
10.
01.
32.
03.
53.
33.
02.
03.
02.
53.
3
Gov
ernm
ent fi
nal c
onsu
mpt
ion,
% T
otal
GD
P [2
]17
.617
.517
.417
.617
.617
.617
.617
.717
.817
.917
.9
Gov
ernm
ent fi
nal c
onsu
mpt
ion,
real
gro
wth
% y
-o-y
[2]
-0.8
0.6
2.0
3.6
3.6
3.6
3.6
3.6
3.6
3.6
3.6
Fixe
d ca
pita
l for
mat
ion,
% o
f GD
P [2
]20
.220
.120
.420
.520
.721
.021
.321
.621
.721
.922
.0
Fixe
d ca
pita
l for
mat
ion,
real
gro
wth
% y
-o-y
[2]
2.1
0.8
4.0
3.0
5.0
5.0
5.0
4.0
4.0
4.0
4.0
Pop
ulat
ion,
mn
[3]
38.2
38.2
38.2
38.2
38.2
38.2
38.2
38.2
38.2
38.1
38.1
Une
mpl
oym
ent,
% o
f lab
our f
orce
, eop
[4]
13.0
14.2
12.5
11.5
10.5
8.2
8.0
7.8
7.5
7.5
7.0
Con
sum
er p
rice
inde
x, %
y-o
-y, a
ve [4
]4.
10.
51.
52.
73.
03.
03.
03.
03.
03.
03.
0
Lend
ing
rate
, %, a
ve [5
]8.
58.
08.
08.
08.
08.
08.
08.
08.
08.
08.
0
Cen
tral B
ank
polic
y ra
te, %
eop
[6]
4.25
2.50
2.50
4.00
4.00
4.00
4.00
4.00
4.00
4.00
4.00
Exc
hang
e ra
te P
LN/U
S$,
ave
[7]
3.25
3.16
3.35
3.17
3.12
3.12
3.10
3.09
3.08
3.08
3.08
Exc
hang
e ra
te P
LN/E
UR
, ave
[7]
4.13
4.20
4.25
3.90
3.75
3.75
3.72
3.71
3.69
3.69
3.69
Bud
get b
alan
ce, U
S$b
n [8
]-1
9.3
-20.
6-1
8.4
-18.
3-1
4.9
-13.
3-1
6.8
-23.
6-2
5.1
-26.
6-2
8.2
Bud
get b
alan
ce, %
of G
DP
[8]
-3.9
-4.0
-3.6
-3.2
-2.4
-2.0
-2.4
-3.2
-3.1
-3.1
-3.1
Goo
ds a
nd s
ervi
ces
expo
rts, U
S$b
n [6
]22
3.5
248.
126
7.7
287.
831
1.7
345.
737
6.8
410.
744
7.7
488.
053
1.9
Goo
ds a
nd s
ervi
ces
impo
rts, U
S$b
n [6
]22
4.2
241.
826
0.9
283.
030
6.5
331.
036
0.8
393.
342
8.6
467.
250
9.3
Bal
ance
of t
rade
in g
oods
and
ser
vice
s, U
S$b
n [6
]-0
.66.
36.
84.
85.
214
.716
.017
.519
.020
.722
.6
Bal
ance
of t
rade
in g
oods
and
ser
vice
s, %
of G
DP
[6]
-0.1
1.2
1.3
0.8
0.8
2.2
2.3
2.3
2.4
2.4
2.5
Cur
rent
acc
ount
bal
ance
, US
$bn
[6]
-17.
1-1
3.0
-13.
0-1
5.8
-16.
4-8
.6-1
0.0
-12.
0-1
4.4
-17.
2-2
0.3
Cur
rent
acc
ount
bal
ance
, % o
f GD
P [6
]-3
.4-2
.5-2
.5-2
.8-2
.7-1
.3-1
.4-1
.6-1
.8-2
.0-2
.3
Fore
ign
rese
rves
ex
gold
, US
$bn
[9]
102.
710
5.8
108.
911
2.2
115.
611
9.0
122.
612
6.3
130.
113
0.1
130.
1
Impo
rt co
ver,
mon
ths
[9]
6.4
6.1
5.8
5.5
5.3
5.0
4.7
4.5
4.2
3.9
3.6
Not
es: e
BM
I est
imat
es. f
BM
I for
ecas
ts. S
ourc
es: 1
EU
RO
STA
T/B
MI,
US
$; 2
EU
RO
STA
T/B
MI;
3 0.
0; 4
Cen
tral S
tatis
tical
Offi
ce/B
MI;
5 IM
F; 6
Nat
iona
l Ban
k of
Pol
and/
BM
I; 7
BM
I; 8
BM
I/Min
istry
of F
inan
ce; 9
IM
F/B
MI.
Executive Summary ................................................................................................................................. 5Core Views ......................................................................................................................................................................................5Key Risk To Outlook ......................................................................................................................................................................5
Chapter 1: Political Outlook .................................................................................................................... 7SWOT Analysis .......................................................................................................................................................... 7BMI Political Risk Ratings ........................................................................................................................................ 7Domestic politics ....................................................................................................................................................... 8Economic Slowdown Creates Challenges For Tusk ...................................................................................................................8
While popular support for the Civic Platform-led government has fallen to all time lows, and is now polling lower than opposition party Law and Justice, we maintain our expectation for the government to serve out its term. Improvements in the labour market and economic activity should help to bolster support for the government in the second half of the year, although the razor-thin parliamentary majority remains a challenge.
Long-Term Political Outlook .................................................................................................................................... 9A Maturing Regional Power ...........................................................................................................................................................9
We consider Poland's long-term political risk profile to be on an upward trajectory, reflecting the country's maturing political institutions and greater confidence in the conduct of external affairs. Solid macroeconomic fundamentals underpin our expectation for improvement over the long run. Nevertheless, Poland still faces significant challenges to political stability in its external relations and at home.
Chapter 2: Economic Outlook ............................................................................................................... 13SWOT Analysis ........................................................................................................................................................ 13BMI Economic Risk Ratings ................................................................................................................................... 13Economic Activity ................................................................................................................................................... 14Middle Income Trap Overshadows Recovery ............................................................................................................................14Balance Of Payments .............................................................................................................................................. 16Cyclical Factors Obscure Structural Trend ...............................................................................................................................16
Despite Poland's current account posting its second consecutive surplus, we maintain our forecast for a deficit this year. Although we have revised up our figures slightly to 2.5% of GDP, from a previous forecast of 3.1%, we regard the recent trends as being cyclically driven, and expect the surplus to prove transient once domestic demand recovers towards the end of the year.
Fiscal Policy ............................................................................................................................................................. 18Wider Budget Deficits, But Credibility Intact .............................................................................................................................18
In light of weaker-than-expected government revenues, we have adjusted down our forecast for Poland's fiscal deficit in 2013 and 2014, and now expect the deficit to arrive at 4.0% of GDP and 3.6% of GDP respectively. However, the causes of the wider deficit are primarily cyclical rather than structural, and the government continues to make progress on structural consolidation.
TABLE: MAIN BUDGETARY MEASURES ........................................................................................................................................................... 18
Monetary Policy ....................................................................................................................................................... 19Fiscal Stimulus To Usurp Monetary Easing...............................................................................................................................19
Despite consumer prices heading close to deflationary territory, we do not expect the National Bank of Poland to make any more rate cuts this year, as we believe doing so could further weaken bank profitability by lowering net interest margins, acting as a disincentive to lending and creating tighter lending conditions in practice. The recent round of monetary easing has yet to yield any tangible increases in aggregate demand, and the announcement that the government is planning to increase spending suggests that fiscal stimulus is about to overtake monetary easing as the authorities preferred tool.
Currency Forecast ................................................................................................................................................... 21PLN: Maintaining Medium-Term Bearish Bias ...........................................................................................................................21TABLE: CURRENCY FORECASTS ....................................................................................................................................................................... 21
Chapter 3: 10-Year Forecast .................................................................................................................. 23The Poland Economy To 2022................................................................................................................................ 23
3Business Monitor International Ltd www.businessmonitor.com
Contents

Long-Term Future Looks Bright .................................................................................................................................................23We forecast Polish real GDP growth to average 3.2% between 2013 and 2022, down slightly from 4.0% between 2001 and 2011. Poland is well placed to avoid the pitfalls of the middle income trap and continue benefitting from large catch-up growth with the rich EU economies.
TABLE: LONG-TERM MACROECONOMIC FORECASTS ................................................................................................................................... 23
Chapter 4: Business Environment ........................................................................................................ 27SWOT Analysis ........................................................................................................................................................ 27BMI Business Environment Risk Ratings ............................................................................................................. 27Business Environment Outlook ............................................................................................................................. 28Institutions ............................................................................................................................................................... 28TABLE: BMI BUSINESS AND OPERATION RISK RATINGS .............................................................................................................................. 28TABLE: BMI LEGAL FRAMEWORK RATING ....................................................................................................................................................... 29
Infrastructure ........................................................................................................................................................... 30TABLE: LABOUR FORCE QUALITY ..................................................................................................................................................................... 30TABLE: EMERGING EUROPE – ANNUAL FDI INFLOWS ................................................................................................................................... 31TABLE: TRADE AND INVESTMENT RATINGS .................................................................................................................................................... 32
Market Orientation ................................................................................................................................................... 33TABLE: TOP EXPORT DESTINATIONS .............................................................................................................................................................. 33
Operational Risk ..................................................................................................................................................... 34Pharmaceuticals ...................................................................................................................................................... 35Executive Summary ....................................................................................................................................................................35
Chapter 5: Key Sectors .......................................................................................................................... 35Pharmaceuticals ...................................................................................................................................................... 35TABLE: PRESCRIPTION DRUG MARKET INDICATORS, HISTORICAL DATA AND FORECASTS, 2009-2017 ............................................. 36TABLE: PATENTED DRUG MARKET INDICATORS, HISTORICAL DATA AND FORECASTS, 2009-2017 .................................................... 36TABLE: GENERICS DRUG MARKET INDICATORS, HISTORICAL DATA AND FORECASTS, 2009-2017 ...................................................... 37TABLE: OVER-THE-COUNTER MEDICINE MARKET INDICATORS, HISTORICAL DATA AND FORECASTS, 2009-2017 ............................ 38
Telecommunications ............................................................................................................................................... 39TABLE: MOBILE – HISTORICAL DATA AND FORECASTS ............................................................................................................................... 39TABLE: ARPU – HISTORICAL DATA AND FORECASTS (PLN) ......................................................................................................................... 40TABLE: FIXED LINE – HISTORICAL DATA AND FORECASTS .......................................................................................................................... 41TABLE: INTERNET – HISTORICAL DATA AND FORECASTS ........................................................................................................................... 42
Other Key Sectors ................................................................................................................................................... 43TABLE: POLAND OIL AND GAS SECTOR KEY INDICATORS ........................................................................................................................... 43TABLE: PHARMA SECTOR KEY INDICATORS ................................................................................................................................................... 43TABLE: TELECOMS SECTOR KEY INDICATORS ............................................................................................................................................... 44TABLE: DEFENCE AND SECURITY SECTOR KEY INDICATORS ..................................................................................................................... 44TABLE: INFRASTRUCTURE SECTOR KEY INDICATORS ................................................................................................................................. 44TABLE: FOOD AND DRINK SECTOR KEY INDICATORS ................................................................................................................................... 45TABLE: AUTOS SECTOR KEY INDICATORS ...................................................................................................................................................... 45TABLE: FREIGHT KEY INDICATORS ................................................................................................................................................................... 45
Chapter 6: BMI Global Assumptions .................................................................................................... 47Global Outlook ......................................................................................................................................................... 47Risks Mounting For Emerging Markets ......................................................................................................................................47TABLE: GLOBAL ASSUMPTIONS ........................................................................................................................................................................ 47TABLE: DEVELOPED STATES, REAL GDP GROWTH, % .................................................................................................................................. 48TABLE: BMI VERSUS BLOOMBERG CONSENSUS REAL GDP GROWTH FORECASTS, % .......................................................................... 48TABLE: EMERGING MARKETS, REAL GDP GROWTH, % ................................................................................................................................. 49
4 Business Monitor International Ltdwww.businessmonitor.com
POLAND Q4 2013

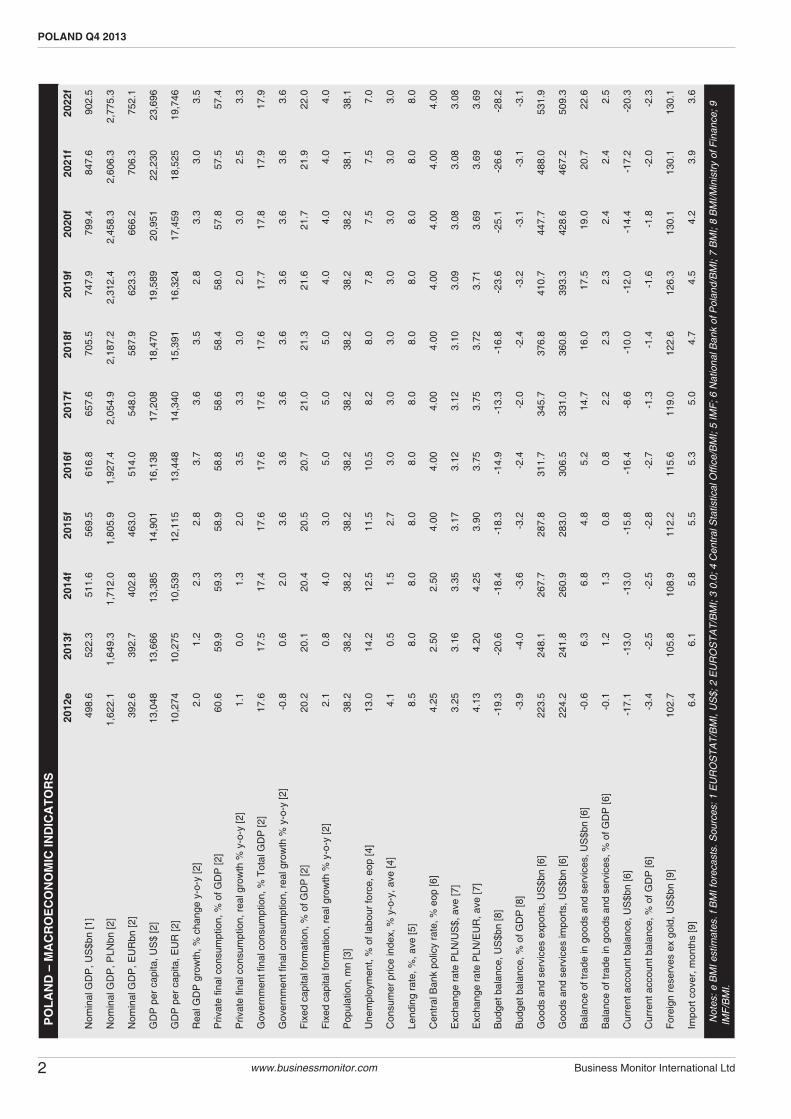
Core Views While we are forecasting relatively robust economic activity over
the medium-term, high unemployment and stagnant real wages will
continue to weigh on real GDP growth.
Poland’s external position remains relatively strong. We forecast
the current account deficit to narrow from 4.3% of GDP in 2011 to
2.5% in 2013 as the economic slowdown reduces import demand.
However, a large stock of foreign-owned government paper and
ongoing private sector deleveraging represent the two major risks
to our sanguine outlook.
We continue to expect the Civic Platform (PO)-led government
to serve out its term. The government won a recent parliamen-
tary vote of confidence, suggesting its parliamentary majority is
safe for the time being. We also believe that the opposition will
struggle to broaden its appeal despite the rising government
unpopularity, limiting its ability to challenge the ruling coalition.
Major Forecast Changes
In light of the disinflationary environment and a sharp deceleration
in domestic demand, we have revised down our fiscal deficit projec-
tions, which we now expect to arrive at 4.0% in 2013 and 3.6% in
2014. Despite our expectations for Poland to miss the EU’s 3.0%
of GDP budget target this year, Poland will likely avoid punishment
under the exceptional growth clause which permits some leeway
on targets due to very low annual growth
Due to weak domestic demand, we have revised our current account
forecasts for 2013, and now expect the current account deficit to
arrive at 2.5% of GDP from a previous forecast of 3.1%.
Low inflation and slowing growth have paved the way for further
monetary easing, and we now forecast 75 basis points of cuts to
the base rate in 2013, bringing it to 2.50% by year-end.
Key Risk To Outlook Although not our core scenario, we highlight the risk of Greece
leaving the euro, potentially leading to a disorderly breakup of the
whole common currency bloc. This would likely push Poland into
recession.
5Business Monitor International Ltd www.businessmonitor.com
Executive Summary


Brief Methodology
7Business Monitor International Ltd www.businessmonitor.com 7Business Monitor International Ltd www.businessmonitor.com
SWOT Analysis
Strengths EU membership and eventual eurozone accession should facilitate
medium-term political stability. The next scheduled general election
is in 2015, giving the Civic Platform (Platforma Obywatelska, PO)-led
coalition space to implement politically painful austerity measures.
Weaknesses The sudden rise in popularity of a radical reformist party such as
Palikot’s Movement shows a growing discontent with traditional
parties and the electorate’s desire for change. Threatened by this,
the governing coalition could be tempted to bow to populist reforms
in an effort to appease the electorate and halt the party’s rise.
Opportunities There is scope for further integration with key Euro-Atlantic institu-
tions, which will elevate Poland’s international profile.
The election of Bronislaw Komorowski (formerly of Civic Platform) as
president provides the coalition with a head of state sympathetic to
the government’s agenda, thereby removing the potential roadblock
of a presidential veto.
Threats The need to undertake deep fiscal consolidation in an effort to bring
the country’s fiscal accounts under control could see support for Civic
Platform start to wane. Indeed, several PO deputies have already
defected.
BMI Political Risk RatingsDonald Tusk’s re-election in late 2011 was the first time since the fall
of communism that a government won a second term, marking an
important achievement for Poland’s maturing democracy. The country
now enjoys broad political stability. Poland’s long-term political risk rat-
ing of 86.4 reflects our expectations that, as long-term economic and
political convergence with the West continues, political conditions will
remain favourable.
Chapter 1: Political Outlook
S-T Political Rank TrendTurkmenistan 82.7 1 =Estonia 80.4 2 =Czech Republic 78.3 3 =Poland 76.5 4 =Kazakhstan 71.5 5 -Russia 71.0 6 =Latvia 71.0 6 =Mongolia 70.4 8 +Lithuania 70.2 9 =Croatia 68.1 10 -Azerbaijan 67.5 11 =Ukraine 67.1 12 +Hungary 66.0 13 =Romania 65.4 14 =Slovakia 65.2 15 =Montenegro 64.8 16 =Georgia 61.5 17 =Uzbekistan 60.8 18 =Turkey 59.2 19 =Armenia 57.1 20 =Slovenia 56.5 21 =Macedonia 56.2 22 =Albania 54.2 23 +Tajikistan 51.9 24 =Belarus 51.7 25 =Serbia 49.8 26 =Bulgaria 49.4 27 -Moldova 44.4 28 =Kosovo 40.4 29 =Kyrgyzstan 36.0 30 -Bosnia-Herzegovina 33.8 31 =Regional ave 62.5 / Global ave 65.2 / Emerging Markets ave 62.6
L-T Political Rank TrendCzech Republic 87.0 1 =Poland 86.4 2 =Estonia 84.8 3 =Slovenia 83.2 4 =Lithuania 79.3 5 =Slovakia 79.2 6 =Latvia 77.1 7 =Hungary 73.9 8 =Croatia 73.2 9 -Bulgaria 73.1 10 =Romania 69.9 11 =Mongolia 67.7 12 +Turkey 65.6 13 =Albania 63.8 14 =Macedonia 63.4 15 =Montenegro 61.5 16 =Kazakhstan 60.3 17 =Armenia 59.6 18 =Russia 57.0 19 =Serbia 55.8 20 =Ukraine 53.0 21 =Turkmenistan 52.6 22 =Bosnia-Herzegovina 51.8 23 =Moldova 51.1 24 =Belarus 50.3 25 =Uzbekistan 50.2 26 =Azerbaijan 49.0 27 =Kosovo 48.3 28 =Georgia 46.8 29 =Tajikistan 42.2 30 =Kyrgyzstan 37.2 31 =Regional ave 64.5 / Global ave 63.1 / Emerging Markets ave 59.5
Domestic politics
Economic Slowdown Creates Challenges For Tusk
BMI VIEWWhile popular support for the Civic Platform-led government has fallen
to all time lows, and is now polling lower than opposition party Law
and Justice, we maintain our expectation for the government to serve
out its term. Improvements in the labour market and economic activity
should help to bolster support for the government in the second half
of the year, although the razor-thin parliamentary majority remains a
challenge.
Poland's Prime Minister Donald Tusk is facing growing chal-
lenges on the domestic front, with recent polling showing support
for his government falling to record lows since taking power
back in November 2007. Poll readings from June show that
support for the Tusk administration fell to just 18% (although
July's poll showed a slight improvement, rising to 25%), from
40% after its re-election in 2011, as the government struggles
to reignite Poland's slowing economy. The administration has
long struggled with a razor- thin majority, and has experienced
two major scandals during its recent terms. The deputy leader of
the Civic Platform (PO)'s coalition partner, the Polish People's
Party (PSL), resigned as agriculture minister after allegations
of corruption in an organisation affiliated to the ministry. The
Polish media have since regularly reported on PSL patronage
within the Ministry for Agriculture. As a result, the opposition
Law and Justice (PiS) party has pulled ahead in opinion polling,
with a recent survey putting support for PiS at 32% against the
ruling Civic Platform at 25%. However, despite its slim major-
ity, we believe that the PO-led government is likely to serve out
its term. The government has clearly lost some support since it
won 39.2% of the vote at the last general election in November
2011, but the PiS will struggle to wrestle the middle ground of
Polish politics from the PO. The PiS relies on a hard-line Catholic
message that fails to resonate with the young and urban, while
its nationalist undertones alienate many.
There are several causes underpinning the slide in the govern-
ment's popularity, including the painful fiscal austerity pro-
gramme implemented by Tusk, including a deeply unpopular
pension reform that raised the retirement age to 67 years (from
65 for men and 60 for women). However, the weak economy
has also played a major role, with the sharpest decline in the
support for the government coinciding with the deceleration
in economic activity and rising unemployment experienced
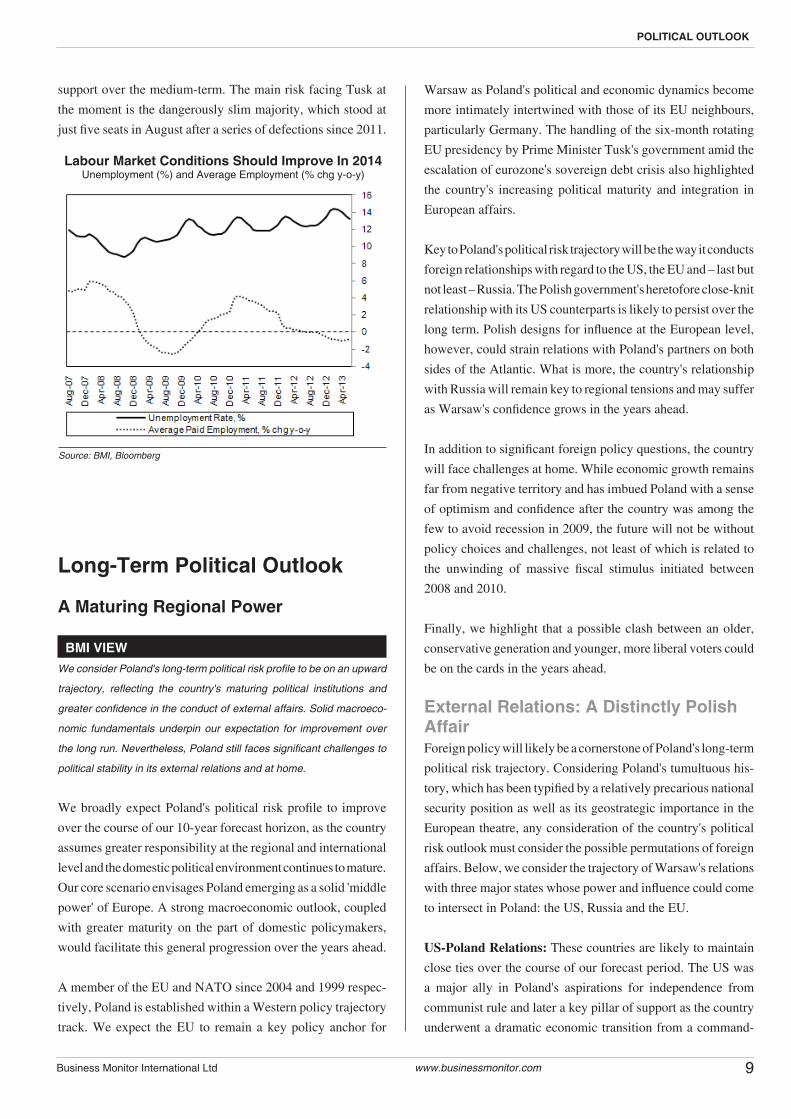
most strongly from Q112 onwards. The labour market remains
a particular source of discontent, with the unemployment rate
reaching 14.4% in February 2013. While headline unemploy-
ment fell to 13.2% in June, the drop was attributable to seasonal
hiring patterns (the data is not seasonally-adjusted) and the year-
on-year trend shows employment continuing to fall in Poland.
We expect the economy to rebound in the second half of the
year, which should help ameliorate Civic Platform's approval
ratings to some extent, although substantial improvements in
labour market conditions will probably be delayed until 2014.
Faced with falling revenues due to weak growth, the govern-
ment's decision to forgo further and instead opt for a wider
budget deficit over the next two years will also help to prop up
8 Business Monitor International Ltdwww.businessmonitor.com
POLAND Q4 2013
Economic Headwinds Have Weakened PO’s Dominance
Opinion Poll: Evaluation of government
Source: CBOS
Opposition Pulls Into LeadPopular support for: (%)
Source: CBOS
support over the medium-term. The main risk facing Tusk at
the moment is the dangerously slim majority, which stood at
just five seats in August after a series of defections since 2011.
Long-Term Political Outlook
A Maturing Regional Power
BMI VIEWWe consider Poland's long-term political risk profile to be on an upward
trajectory, reflecting the country's maturing political institutions and
greater confidence in the conduct of external affairs. Solid macroeco-
nomic fundamentals underpin our expectation for improvement over
the long run. Nevertheless, Poland still faces significant challenges to
political stability in its external relations and at home.
We broadly expect Poland's political risk profile to improve
over the course of our 10-year forecast horizon, as the country
assumes greater responsibility at the regional and international
level and the domestic political environment continues to mature.
Our core scenario envisages Poland emerging as a solid 'middle
power' of Europe. A strong macroeconomic outlook, coupled
with greater maturity on the part of domestic policymakers,
would facilitate this general progression over the years ahead.
A member of the EU and NATO since 2004 and 1999 respec-
tively, Poland is established within a Western policy trajectory
track. We expect the EU to remain a key policy anchor for
Warsaw as Poland's political and economic dynamics become
more intimately intertwined with those of its EU neighbours,
particularly Germany. The handling of the six-month rotating
EU presidency by Prime Minister Tusk's government amid the
escalation of eurozone's sovereign debt crisis also highlighted
the country's increasing political maturity and integration in
European affairs.
Key to Poland's political risk trajectory will be the way it conducts
foreign relationships with regard to the US, the EU and – last but
not least – Russia. The Polish government's heretofore close-knit
relationship with its US counterparts is likely to persist over the
long term. Polish designs for influence at the European level,
however, could strain relations with Poland's partners on both
sides of the Atlantic. What is more, the country's relationship
with Russia will remain key to regional tensions and may suffer
as Warsaw's confidence grows in the years ahead.
In addition to significant foreign policy questions, the country
will face challenges at home. While economic growth remains
far from negative territory and has imbued Poland with a sense
of optimism and confidence after the country was among the
few to avoid recession in 2009, the future will not be without
policy choices and challenges, not least of which is related to
the unwinding of massive fiscal stimulus initiated between
2008 and 2010.
Finally, we highlight that a possible clash between an older,
conservative generation and younger, more liberal voters could
be on the cards in the years ahead.
External Relations: A Distinctly Polish AffairForeign policy will likely be a cornerstone of Poland's long-term
political risk trajectory. Considering Poland's tumultuous his-
tory, which has been typified by a relatively precarious national
security position as well as its geostrategic importance in the
European theatre, any consideration of the country's political
risk outlook must consider the possible permutations of foreign
affairs. Below, we consider the trajectory of Warsaw's relations
with three major states whose power and influence could come
to intersect in Poland: the US, Russia and the EU.
US-Poland Relations: These countries are likely to maintain
close ties over the course of our forecast period. The US was
a major ally in Poland's aspirations for independence from
communist rule and later a key pillar of support as the country
underwent a dramatic economic transition from a command-
9Business Monitor International Ltd www.businessmonitor.com
POLITICAL OUTLOOK
Labour Market Conditions Should Improve In 2014Unemployment (%) and Average Employment (% chg y-o-y)
Source: BMI, Bloomberg

based to market-based economy in the 1990s. The US is likely
to remain key to Poland's historically conditioned aspirations
to secure some form of sovereign guarantee and as a way to
increase the country's influence abroad.
From the perspective of the US, Poland serves as a useful and
staunch ally in Central Europe. Warsaw supported the US's 'War
on Terror' at a much higher level that its Western European
peers, in particular Germany and France, sending troops not
only to Afghanistan but also to Iraq. The May 2011 decision to
base a US F-16 fighter wing in Poland for the first time reflects
the prospect that the US-Polish relationship is a key strategic
consideration for both parties. While Poland clearly represents
the junior partner in the relationship, the US's strategic interests
in a Central European presence, and Polish aspirations towards
an existential security guarantee as well as regional power and
influence, mean that the basic underpinnings of the relationship
are likely to remain in place through the next decade.
Russia-Poland Relations: In stark contrast to the warm rela-
tionship enjoyed with the US, Poland's relationship with Rus-
sia is likely to remain less than rosy over our forecast period.
Historical tensions between the two countries run deep, not least
because of the legacy of Soviet dominance. Nevertheless, our
core scenario envisages Russia-Poland relations becoming more
pragmatic as increased political maturity in Poland translates into
more consistent foreign policy procedures and pronouncements;
this should reduce the likelihood of major diplomatic ructions.
However, considering that we believe the Poland-US relation-
ship will remain well established over the long term, increased
political and military integration with the US could strain ten-
sions with Russia. Moreover, we cannot discount the risk that
Polish lawmakers will attempt to score political points at home
by raising the level of nationalist rhetoric, which would most
likely paint Russia in an antagonistic light.
EU-Poland Relations: Our core scenario for Poland's relation-
ship with Brussels and EU member states envisages continued
cooperation. Parallel to a relatively positive macroeconomic
growth picture and maturing political arena, Poland will likely
enjoy growing influence at the supranational level, eventually
establishing itself as an effective middle power. In particular,
we believe Poland could become one of the leaders of the
'younger' members of the European integration project. While
this may unsettle some of the more established member states
such as Germany and France, Poland's relations with the EU
will most likely remain constructive over our forecast period.
In particular, Poland could have a particularly profound influ-
ence on European-level defence policymaking, considering the
country's vested interest in securing its own borders.
The tone and trajectory of relations with the EU could conversely
present a challenge to Poland's long-term political risk profile. In
particular, the Warsaw-Brussels relationship could be strained
by Poland's attempts to foster closer ties with the US – some-
thing that may place it at odds with major European powers
and may undercut European foreign policy options. Moreover,
and as alluded to above, Poland will likely enjoy increasing
status and influence at the supranational level over the coming
decade – something that will undoubtedly challenge Europe's
traditional dominance by France and Germany. EU immigration
10 Business Monitor International Ltdwww.businessmonitor.com
POLAND Q4 2013
The Hinge Of Europe Regional Map
Source: BMI
Political Risk Outperformer Long-Term Political Risk Rating & Component Scores
(Out Of 100)
Source: BMI

may also come under the spotlight, as the significant flows of
Polish workers into other European nations could come under
increasing scrutiny by foreign politicians hoping to boost their
political popularity at home amid weak domestic economies.
Challenges And Threats To StabilityDomestic Political Maturity: A key question and challenge
for Poland's long-term political outlook will be the level of
maturity shown by both institutions and politicians. Prime Min-
ister Tusk's re-election on October 9, the first re-election of an
incumbent government since the end of communist rule, bodes
well for policy continuity and marks an increased maturity in
the country's political system. We highlight this as a positive
development, as Poland's political landscape remains heavily
fractured along ideological and social lines.
Social Challenges Ahead: Overall, we believe that Poland's
sound macroeconomic fundamentals will most likely keep
disputes over social and economic policy relatively muted.
Poland remains one of the most socially conservative countries
in Europe, with strong Roman Catholic roots as demonstrated
by the near-iconic status enjoyed by the late Pope John Paul II.
In turn, we cannot rule out more divisive social policy issues
coming to the fore, as a relatively benign macroeconomic back-
drop enables voters to increasingly shift their voting preference
formulation along social lines. In such an event, we highlight
that a younger, more liberal class of voters that harbours little
memory of life under communist rule and the movement for
independence could come into conflict with a older and gener-
ally more conservative class. Furthermore, we believe that, as
the country enters a period of fiscal austerity, greater questions
regarding the socially optimal allocation of wealth could come
to the forefront of domestic policy considerations.
Long-Term Political Risk RatingPoland's long-term political risk rating stands at 86.4 out of 100,
according to BMI’s proprietary risk rating system, which ranks
the country 13th out of the 177 countries assessed worldwide.
Moreover, the rating marks Poland as a clear outperformer in
the European space, outranking even the eurozone average of
82.4. The high rating reflects what we see as a well-established
domestic policy trajectory, with Poland scoring particularly well
in 'policy continuity'. Moreover, domestic public policy disputes
as well as issues regarding minority rights are relatively limited,
boding well for the 'characteristics of policy' and 'characteristics
of society' components.
Over the long term, we expect Poland's membership in the EU
to be secure, providing a key policy anchor. To us, the key risk
to Poland's political risk rating over our forecast horizon relates
to how the country adapts to increasing influence in regional
and international affairs. Below, we present a wide range of
scenarios towards 2022. We assign scores for likelihood out
of 10, with 10 being highly likely and 1 being highly unlikely.
Scenarios For Political ChangeScenario One–A European 'Middle Power' Within The EU: As alluded to above, our core scenario entails Poland
establishing itself as an effective 'middle power' of Europe and
achieving greater integration with the EU and its constituent
supranational institutions. Under such a sequence of events, this
would see Poland leveraging its clear economic outperformer
status in the Central and Eastern European space and should
see the country gain increasing influence among its European
peers. Moreover, we expect Poland's young democratic political
culture and institutions to grow more mature over the course of
our forecast period, which should bode well for policy continuity
and implementation. In turn, a more consistent and steady hand
at the wheel of both domestic and foreign policymaking bodes
well for increasing Poland's influence abroad. In terms of foreign
policy specifically, a strong relationship with the US will persist
and Poland will prove adept at handling affairs with Russia.
Likelihood: 8
Scenario Two–Greater Assertiveness At The EU's Expense: Our second possible trajectory entails the country undergoing a
similar increase in confidence regarding its domestic and external
affairs, underpinned by a strong macroeconomic story at home.
However, under this alternative chain of events, the country's
increased assertiveness comes at the expense of good relations
with the EU. Indeed, considering the fundamental way that
Poland's historical insecurity shapes the conduct of its external
affairs, the country may find itself frustrated in its attempts to
find a satisfying security guarantee within the European security
structure. At that point, Warsaw may be forced to adopt a more
assertive foreign policy stance than that of its EU peers in order
to satisfy a sense of self-security, much like it did in backing
the US-led 'War on Terror'. This may strain relations with the
EU, not least in the foreign policy sphere. Furthermore, we
see scope that Poland could forego joining the euro. Indeed,
Poland has already delayed the adoption of the single currency
indefinitely, having originally planned to enter the eurozone
some time in 2012.
Likelihood: 6
11Business Monitor International Ltd www.businessmonitor.com
POLITICAL OUTLOOK

Scenario Three–An Economic Faltering: While our core
scenario for Poland sees economic growth chugging along at an
average rate of 3.2% in real terms over 2013-2022, we cannot
rule out the possibility that macroeconomic expansion falters
and the current optimism surrounding the future of the country
concomitantly wanes. In such an event, we highlight the risk
that a more populist brand of politics takes hold in Poland,
derailing the maturing market-based, liberal policy consensus
that is currently on the ascendancy. This would pose the po-
tential for less consistent domestic policymaking. This could
also derail Poland's aspirations to take on a larger role at the
EU and international level.
Likelihood: 4
Scenario Four–Excessive Assertiveness: While much less
likely, we do see scope that Poland becomes much more asser-
tive in its foreign policy stance. Fiscal austerity and military
retrenchment on both sides of the Atlantic (against the backdrop
of a Russian military modernisation drive) pose the risk that
Warsaw begins to become more bellicose in its rhetoric towards
Russia, which could lead to a deterioration in relations – some-
thing that may make Poland's key allies in the EU and the US
more nervous. Efforts by the US to roll back its presence in
NATO and in Europe could lead to greater assertiveness and
seeking of existential guarantees by Polish politicians. Indeed,
Warsaw was in need of reassurance following the US's decision
in 2009 to scale back an anti-ballistic missile shield based in
Poland while also seeking rapprochement with the Russians.
As mentioned above, Poland's efforts to effect material security
guarantees under the EU framework would also likely fail to
assuage Polish concerns.
While we believe the direct threat of greater Russian assertiveness
over its former satellite states is remote, the fundamental’security
question'-driven nature of Polish foreign policy formation
means that a more bellicose and confrontational Warsaw can-
not be ruled out. While our likelihood rating for this outcome
is low, we caution that, combined with a faltering of Poland's
strong domestic growth story, a swing towards more populist
politics–which would most likely tap latent nationalism–would
raise the probability of this outcome materially.
Likelihood: 2
12 Business Monitor International Ltdwww.businessmonitor.com
POLAND Q4 2013
13Business Monitor International Ltd www.businessmonitor.com
SWOT Analysis
Strengths Integration into the German export machine makes Poland less
exposed to the unwinding macroeconomic headwinds originating
from the eurozone.
A credible and independent central bank continues to bolster eco-
nomic stability and investor confidence.
Weaknesses Investment, a key driver of Poland’s domestic demand story, slowed
in the wake of the 2012 European football championships. However,
investment will recover in mid-2013.
Opportunities Polish manufacturing is moving up the value-added chain as it
integrates into German supply chains, while the economy is also
diversifying as Warsaw emerges as a regional financial hub.
Threats The zloty has increasingly been used as a liquid benchmark for the
wider Central and Eastern Europe region, with any period of financial
distress likely to see the currency overshoot those of the Czech
Republic and Hungary on the downside. This, in turn, will continue
to pose a risk to financial stability.
BMI Economic Risk RatingsPoland’s long-term economic risk rating comes in at a healthy 67.3.
This reflects the nation’s potential for long-run convergence-led growth
bolstered, while its relatively large domestic market provides a measure
of protection against a volatile global economy. Poland fails to score
higher owing to its persistent current account deficits. That said, these
is evidence that these deficits are funding investments to boost the
country’s future productive capacity.
Chapter 2: Economic Outlook
S-T Economy Rank TrendEstonia 74.2 1 -Slovakia 71.5 2 =Russia 71.5 2 -Azerbaijan 67.1 4 =Kazakhstan 67.1 4 =Uzbekistan 63.5 6 +Lithuania 60.8 7 +Latvia 60.4 7 =Slovenia 58.8 9 =Poland 58.3 10 -Romania 57.7 11 =Turkmenistan 57.7 11 -Turkey 55.2 13 -Czech Republic 54.6 14 -Hungary 53.5 15 =Georgia 53.3 16 =Bulgaria 52.9 17 -Croatia 52.7 18 -Armenia 48.5 19 =Mongolia 47.1 20 =Tajikistan 45.6 21 +Moldova 44.4 22 -Serbia 43.8 23 =Albania 42.7 24 =Montenegro 40.6 25 =Macedonia 39.6 26 =Belarus 37.9 27 =Ukraine 37.1 28 -Kosovo 35.2 29 =Bosnia-Herzegovina 30.2 30 =Kyrgyzstan 22.1 31 =Regional ave 53.1 / Global ave 54.3 / Emerging Markets ave 52.5
L-T Economy Rank TrendRussia 72.9 1 -Slovakia 71.6 2 =Poland 67.3 3 -Kazakhstan 66.7 4 =Czech Republic 66.1 5 =Estonia 66.0 6 =Slovenia 65.1 7 =Hungary 61.2 8 =Uzbekistan 61.2 8 =Turkey 61.0 10 -Azerbaijan 60.5 11 =Romania 58.3 12 =Croatia 58.2 13 +Latvia 54.2 14 =Bulgaria 53.4 15 =Turkmenistan 51.5 16 =Lithuania 50.4 17 +Serbia 48.6 18 =Georgia 47.6 19 =Albania 45.7 20 =Montenegro 45.6 21 =Macedonia 44.8 22 =Tajikistan 42.8 23 =Mongolia 42.5 23 -Moldova 42.3 25 =Bosnia-Herzegovina 40.0 26 =Ukraine 38.3 27 =Armenia 38.0 28 =Kosovo 35.0 29 =Kyrgyzstan 30.3 30 =Belarus 15.0 31 =Regional ave 53.0 / Global ave 53.6 / Emerging Markets ave 51.2

Economic Activity
Middle Income Trap Overshadows RecoveryMacro Outlook : Polish economic indicators are showing tenta-
tive signs of improvement, giving weight to our expectations
for a gradual economic rebound to take hold in the second half
of 2013. Nonetheless, we reiterate that the recovery will be
protracted, and primarily led by exports, with domestic demand
unlikely to start showing strong signs of an improvement until
2014. Accordingly, the recovery remains strongly contingent
upon sustained demand from Germany and other key trade
partners. While we are modestly optimistic towards Germany's
economic outlook, we see greater risks emerging from other
European partners such as France, Italy and the Czech Republic,
as well as slowing demand from China.
Nonetheless, our core view is that the economic slowdown has
bottomed, and real GDP growth should arrive around 1.2% in
2013. However, we have downgraded our forecasts for 2014,
forecasting real GDP to grow by 2.3%, from a previous forecast
of 2.7%, and 2.8% in 2015, from a previous forecast of 4.1%
respectively. We see medium-term growth prospects becoming
increasingly challenging in Poland, with growing risks of the
country falling victim to the middle-income trap unless greater
efforts are made to encourage innovation and R&D investment.
Investors should not assume the country will automatically
revert to 4.0%-plus higher real GDP growth rates, particularly
as the lower-end of the manufacturing sector will come under
greater competition from South-Eastern European countries
such as Romania and Turkey.
Real GDP By Expenditure BreakdownPrivate Consumption: While the retail sales index grew 1.8%
y-o-y in June, following average growth of just -0.1% in the
four preceding months, we think a robust recovery in household
consumption this year is still off the cards.
The labour market remains weak, with unemployment continuing
to trend higher over the first half of 2013, and the majority of
the fall in Q213 attributable to seasonal hiring patterns. Weak
household consumption is particularly negative for Poland’s
economic activity prospects relative to other CEE-4 econo-
mies, as Poland is much more heavily reliant upon household
consumption as an engine of growth.
Nonetheless, there are signals that point towards an improve-
ment in 2014. Consumer confidence has started to pick up, with
'consumer confidence towards personal finances over the next 12
months' rising to -11.5 in July, from -18.7 at the start of 2013.
Our expectations for a gradual recovery in exports should see
the labour market start to improve as hiring picks up, and this
should also feed through into improved household consumption.
Government Consumption: In our last quarterly growth up-
date, we suggested that a combination of weaker growth and
lower than expected inflation would drive weaker government
revenues, which without additional adjustments would limit
the room for a major expansion in government spending over
2013 and 2014. This has largely materialised, with revenue
undershoot forcing the government to suspend the legislative
50% public debt-to-GDP ratio limit in order to avoid making
14 Business Monitor International Ltdwww.businessmonitor.com
POLAND Q4 2013
Domestic Demand Still FlatliningReal GDP By Expenditure Selected Components, % chg y-o-y
Source: BMI, NBP
Polish Companies Suffer From Lack Of InnovationInnovation Among Small Companies (10-49 employees) –
Technology Innovation
Source: BMI, NBP, Eurostat
emergency cuts to the budget. While this arguably amounts to
de facto fiscal stimulus, it is unlikely to have any substantial
impact on growth this year as government spending in real
terms will not increase. Furthermore, both the remaining debt
caps at 55% of GDP and 60% of GDP (the latter of which is
constitutionally binding) remain in place, acting as a restraint on
expansionary fiscal policy. We forecast government consump-
tion to contribute just 0.1 percentage points (pp) to headline
real GDP growth in 2013.
Gross Fixed Capital Formation: Fixed investment contracted
by 2.7% y-o-y in the first quarter of 2013, and we expect it to
remain relatively weak over the rest of 2013, before staging a
recovery in 2014. Capacity utilisation in Poland remains low at
just 72.9% in Q213, indicating a fair amount of spare capacity
within goods-producing industries, which will disincentivise
substantial near-term investment. From a longer-term perspec-
tive, we seeing risks to long-term gross fixed capital formation
arising from the lack of private-sector led R&D development
and innovation in Poland. Business R&D spending per capita
(adjusted for purchasing power and chained at 2005 prices) was
substantially lower than any other Central European economy,
according to Eurostat data.
While government R&D spending is higher in Poland than
neighbouring countries, the combined spending on R&D for
Poland in 2010 was just 0.7% of GDP, versus an EU-27 average
of 2.0% of GDP.This is largely due to an inefficient tax relief
structure that incentivises imported R&D over domestically
created innovation. Eurostat data ranks Polish companies as
among the least innovative out of 30 European economies,
beating only Romania. Only 28% of Polish companies imple-
ment any kind of innovation against the EU average of 52%.
The government has set itself a relatively ambitious target of
increasing R&D spending to 1.7% of GDP by 2020. However,
with fiscal restraints currently preventing a substantial increase
in spending, particularly in areas like R&D which typically take
a long-term to yield economic rewards, we remain cautious for
the time being. We would also need to see more tax incentives to
induce the private sector to take a greater role in R&D spending.
Net Exports: Exports slowed slightly in the first quarter of 2013,
growing by just 1.3% y-o-y, from a 3.2% y-o-y in Q412. Second
quarter readings may be relatively weak too, but we expect to
see export growth accelerate in the second half of 2013. Poland's
trade ties with Germany remain the most dominant driver behind
export growth, with 25.1% of Polish exports heading to the
la tter in 2012. Indeed, our above-consensus expectations for
German growth underpin – to a large extent – our forecasts for
an export-led recovery in Poland in 2013. Poland's trade bal-
ance with Germany reached EUR3.6bn in 2012 – the highest
nominal reading on record–although this is likely to decrease
over the medium term as Poland continues to diversify its trade
away from the eurozone's largest economy. Exports to countries
outside of the EU continue to grow at a healthy clip, although
we emphasize that this is from a very low base.
Import growth contracted by 1.7% in the first quarter as lower
demand for intermediate imports combined with weak domestic
demand dragged down the overall import bill. The weak state
of household consumption is liable to keep consumer imports
weak over the coming quarters, which should provide further
support to net exports, feeding through into stronger headline
15Business Monitor International Ltd www.businessmonitor.com
ECONOMIC OUTLOOK
More Private Sector R&D Investment NeededR&D Expenditure By Sector, % total
Source: BMI, Eurostat
Business R&D Spend Lags Regional PeersTotal intramural R&D expenditure (Purchasing Power Standard (PPS)
per inhabitant at constant 2005 prices)
Source: Eurostat

real GDP in 2013.
Risks To OutlookAs we are forecasting an export-driven recovery, our forecasts
our heavily contingent on a sustained recovery in Germany's
manufacturing sector. We are slightly above consensus for Ger-
man real GDP growth in 2013, expecting 0.5% growth against
Bloomberg consensus expectations of 0.4%, although the range
of the survey varies from zero to 1.0% growth indicate substantial
variance in growth expectations. Nonetheless, should German
manufacturing growth disappoint, this would probably shave
a few tenths of a percentage point off our headline real GDP
forecast for Poland.
Balance Of Payments
Cyclical Factors Obscure Structural Trend
BMI VIEW : Despite Poland's current account posting its second consecutive sur-
plus, we maintain our forecast for a deficit this year. Although we have
revised up our figures slightly to 2.5% of GDP, from a previous forecast
of 3.1%, we regard the recent trends as being cyclically driven, and
expect the surplus to prove transient once domestic demand recovers
towards the end of the year.
Poland's current account has moved sharply into surplus for the
second consecutive month in May, driven by a major improve-
ment in the country's visible trade balance.
We have adjusted our forecasts for the current account, and
now expect a deficit equivalent to 2.5% of GDP in 2013, from a
previous forecast of 3.1%. Nonetheless, while central bank head
Marek Belka suggested some of the improvement in the current
account may be sustained, we regard the surplus as primarily
cyclical, and expect the trade surplus to disappear in the second
half of the year, pulling the current account back into deficit.
The narrowing trade surplus has be en driven by weak import
growth, as Poland struggles with the weakest household con-
sumption on record. Imports contracted by 3.2% in year-on- year
16 Business Monitor International Ltdwww.businessmonitor.com
POLAND Q4 2013
Household Consumption Should RecoverTowards Q413
Goods Imports & Exports, six month average (US$mn)
Source: BMI, NBP
Surplus Driven By Trade Account,As Imports Collapse
Current Account Components, US$mn
Source: BMI, NBP
Germany Still Dominates ExportsExports By Destination, % total
Source: BMI, Eurostat
terms in May, while exports grew by 4.5% in the same period,
assisted by a weaker zloty. The services surplus has stayed rela-
tively stable throughout the start of the year, and we expect this
to remain the case over the remainder of the year, forecasting a
surplus equivalent to 1.4% of GDP in 2013 and 1.6% in 2014.
We are also forecasting current transfers (primarily EU funds)
to post a surplus of 1.1% in 2013 and 1.2% in 2014.
There has been speculation among economists that the recent
current account surpluses represent a seismic shift in Poland's
growth model, with the economy shifting away from a house-
hold consumption driven model to an export-driven economy.
While there is undoubtedly room for Poland to increase the
importance of external trade to economic activity, with exports
and imports accounting for 89% of GDP – the lowest of the
CEE-4 economies (the figure is around 180% in Slovakia and
Hungary)–it is slightly misleading to suggest that Poland is
transforming to an export-driven economy. As the chart shows,
every recent period of substantial economic deceleration (2001,
2002, 2005, 2012) has coincided with a marked narrowing on
the current account deficit in Poland, and we see little evidence
to suggest that there are structural rather than cyclical drivers
behind the recent current account surplus. Our expectations
for a recovery in domestic demand towards the end of the year
and throughout 2014 imply recent current account trends will
prove transitory.
Indeed, while we expect the recovery to be export-led in 2013,
we do not expect to see exports aggressively expand their share
of economic activity, as competition from neighbouring econo-
mies and difficulties in ascending the value-chain are likely to
dampen export growth. Indeed, from a longer-term perspective,
the lack of private-sector led R&D development and innovation
in Poland poses a major risk to the manufacturing export base.
Business R&D spending per capita (adjusted for purchasing
power and chained at 2005 prices) was substantially lower than
any other Central European economy, according to Eurostat data
(see 'Middle-Income Trap Overshadows Recovery', July 31).
As a result, the overall trend for the current account remains
the same over our medium-term forecast period, with the deficit
widening again in 2014, and averaging around 3.1% to 2016.
Financial account flows should remain relatively robust, although
foreign direct investment is likely to be smaller than in previ-
ous years. Portfolio inflows to domestic debt markets are also
unlikely to match the volume experienced throughout H212 to
H113. Nonetheless, as one of the stronger-rated sovereigns in
the region, we do not foresee Poland experiencing any major
financing problems over the near-future.
17Business Monitor International Ltd www.businessmonitor.com
ECONOMIC OUTLOOK
Narrowing Of Deficit Is Cyclically-Driven, Not Structurally-DrivenCurrent Account and Real GDP
Source: BMI, NBP
Still Expecting A Deficit By Year-EndVisible Trade and Current Account, US$mn
Source: BMI, NBP
Fiscal Policy
Wider Budget Deficits, But Credibility Intact
BMI VIEW: In light of weaker-than-expected government revenues, we have ad-
justed down our forecast for Poland's fiscal deficit in 2013 and 2014,
and now expect the deficit to arrive at 4.0% of GDP and 3.6% of GDP
respectively. However, the causes of the wider deficit are primarily cy-
clical rather than structural, and the government continues to make
progress on structural consolidation.
We have revised down our forecasts for Poland's fiscal deficit,
as poor growth in the first quarter and lower than expected
inflation are likely to cause revenues to undershoot this year.
While we expected that Poland was unlikely to exit the EU's
Excessive Deficit Procedure in 2013, revenue growth is likely
to arrive even weaker than our original forecasts (see 'Lower
Inflation And Growth Weakening Government Revenues', April
30) We now expect the fiscal deficit to arrive at 4.0% of GDP
in 2013, from a previous forecast of 3.6%, and 3.6% in 2014,
from a previous forecast of 3.2%.
To avoid making last minute cuts which could potentially
choke off the nascent recovery, the government has suspended
Poland's 50 % debt brake rule, which stipulates that if debt-to-
GDP is in excess of 50%, the budget cannot allow the deficit to
grow. Nonetheless, we emphasize that the government remains
one of the most hawkish in the region, and the adjustment is
unlikely to substantially weaken the Poland's credit profile for
several reasons.
18 Business Monitor International Ltdwww.businessmonitor.com
POLAND Q4 2013
Local Government Borrowing Still MarginalPublic Debt By Sector (2012), % total
Source: Ministry of Finance
Close To Debt Brake LevelsPublic Debt, % GDP
Source: BMI, Ministry of Finance
TABLE: MAIN BUDGETARY MEASURESRevenue Expenditure
2013
• Freeze of personal income tax thresholds (+0.1%) • Expenditure rule (including nominal freeze in wage fund) (-0.1%)
• Amendment of the pension reform (-0.1 %)
• Digital dividend (+0.1%) (one-off) • Wage increases for university teachers and soldiers (+0.1%)
• Increase in dividends from state owned
companies (+0.2%) (one-off)
2014
• Maintaining the VAT rates raised temporarily • Expenditure rule (including nominal freeze in wage fund) (-0.1%)
in 2011 (avoiding -0.4%) • Extension of maternity leave (+0.2%)
• Reinstatement of VAT reimbursement on the • Wage increases for university teachers and soldiers (+0.1%)
purchase of cars and fuel (-0.1%) • Reduction in national direct payments to farmers (-0.1%)
• Freeze of PIT thresholds (+0.1%)
Notes: The budgetary impact in the table is the impact reported in the programme, i.e. by the national authorities. A positive sign implies that revenue / expenditure increases as a consequence of this measure. The degree of detail reflects the information made available in the convergence programme and, where available, of a multiannual budget. Source: EU Commission
First, the causes of the wider deficit are primarily cyclical rather
than structural. Indeed, the government continues to make
progress on structural consolidation, which official forecasts
expect to arrive at 2.5% of GDP in 2014, from 5.5% in 2011.
While Poland's finance ministry described the move to suspend
the debt law as ‘strong stimulus’, the move is only ‘stimulus'
in so far as the government will not be pressing ahead with
further cuts to adapt to smaller budget revenues, rather than a
full-scale stimulus package. Second, Poland's fiscal conservatism
is enshrined in the 55% debt/GDP debt brake and 60% debt/
GDP debt brake rules, both of which currently remain in place.
While the government could theoretically lift the 55% debt
brake rule (although we think this outcome is highly unlikely),
the 60% rule is enshrined in Chapter X, Article 216 of Poland's
constitution. Altering the constitution would require at least a
two thirds majority in Poland's lower house.
Public debt levels will continue to rise in Poland, bringing them
close to the second 55% debt brake level which would bar the
next budget from increasing the ratio of central government debt-
to-GDP. Our current forecasts (which are based on public debt
levels calculated using the EU ESA-95 methodology), forecast
public debt to rise to 57.7% of GDP in 2013 – although this would
not contravene the 55% debt law as the Polish government uses
a different methodology which calculates public debt-to-GDP
around three percentage points lower than the EU methodology.
Risks To OutlookWhile we expect government borrowing costs to rise over the
coming quarters, this is primarily due to our expectations for
investors to reallocate capital out of emerging market debt as
US yields begin to rise, rather than an idiosyncratic repricing
of Poland's sovereign risk profile. Overall, government borrow-
ing costs will remain among the lowest in Emerging Europe,
restrained by the country's strong reputation for conservative
fiscal management, and a relatively liquid secondary market
for government bonds.
Monetary Policy
Fiscal Stimulus To Usurp Monetary Easing
BMI VIEW: Despite consumer prices heading close to deflationary territory, we do
not expect the National Bank of Poland to make any more rate cuts this
year, as we believe doing so could further weaken bank profitability
by lowering net interest margins, acting as a disincentive to lending
and creating tighter lending conditions in practice. The recent round of
monetary easing has yet to yield any tangible increases in aggregate
demand, and the announcement that the government is planning to
increase spending suggests that fiscal stimulus is about to overtake
monetary easing as the authorities preferred tool.
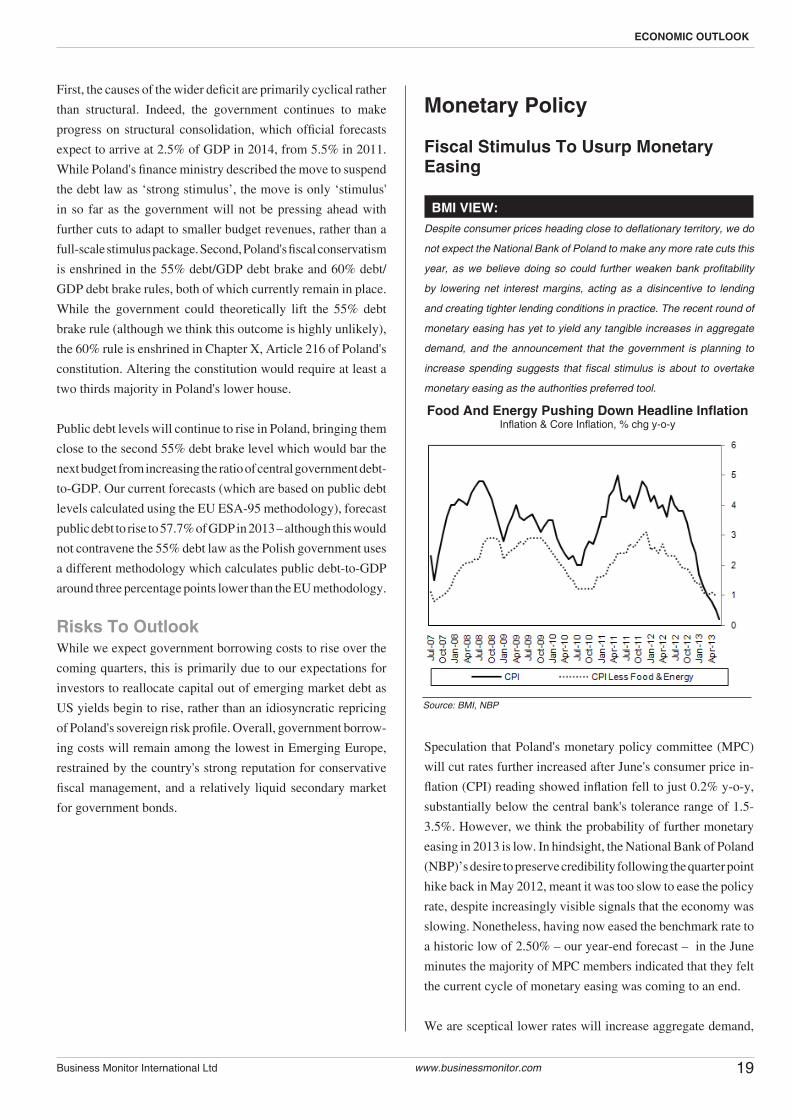
Speculation that Poland's monetary policy committee (MPC)
will cut rates further increased after June's consumer price in-
flation (CPI) reading showed inflation fell to just 0.2% y-o-y,
substantially below the central bank's tolerance range of 1.5-
3.5%. However, we think the probability of further monetary
easing in 2013 is low. In hindsight, the National Bank of Poland
(NBP)’s desire to preserve credibility following the quarter point
hike back in May 2012, meant it was too slow to ease the policy
rate, despite increasingly visible signals that the economy was
slowing. Nonetheless, having now eased the benchmark rate to
a historic low of 2.50% – our year-end forecast – in the June
minutes the majority of MPC members indicated that they felt
the current cycle of monetary easing was coming to an end.
We are sceptical lower rates will increase aggregate demand,
19Business Monitor International Ltd www.businessmonitor.com
ECONOMIC OUTLOOK
Food And Energy Pushing Down Headline InflationInflation & Core Inflation, % chg y-o-y
Source: BMI, NBP

and could actually weaken the banking sector by driving lower
net interest margins (see 'Regional Equity Strategy', July 16).
Furthermore, the recent announcement that the government
is planning to suspend the legal limits on public debt, paving
the way for fiscal stimulus, implies that the authorities have
acknowledged the limitations of monetary policy in boosting
growth. Polish forward rate agreements concur with our assess-
ment, with both the 3x6 and 6x9 contracts implying no further
rate cuts by year-end.
The NBP's senior loan officer survey shows that domestic banks
expect corporate lending standards to tighten over the next quar-
ter, due to both the unfavourable forecasts of macroeconomic
conditions and the cuts in NBP rates. The rate cutting cycle has
been creating pressure on bank net interest margins, acting as a
disincentive to lending, and reducing profitability in an already
challenging economic climate. Polish banks are primarily deposit
funded, indicating a reduced reliance on wholesale funding and
have thus not benefitted particularly from lower interbank rates.
The majority of deposits in the banking sector are fixed term,
meaning that banks are not able to immediately reduce interest
rates on most deposits to offset lower interest rates on loans.
As a result, net interest margins, particularly on floating-rate
loans benchmarked to WIBOR (Poland's interbank lending rate),
have been weakened, which has made banks more reluctant to
lend, thus actually driving a tightening in lending standards to
the corporate sector. As WIBOR is strongly correlated with
the NBP's benchmark rate, we think this will make the MPC
disinclined to cut the benchmark rate any further.
Senior Loan Officer Survey: "If your bank's lending policies
(credit standards or terms) applied to corporate loans and credit
lines have changed over the last three months, please indicate
how the following factors have influenced the changes: NBP's
monetary policy decisions"
Only two out of the ten MPC members voted for a 50 basis point
cut at the last meeting, with even Anna Zielinska-Glebocka,
one of the most dovish MPC members, suggesting that she saw
the optimum rate at somewhere between 2.25-2.50%.As we do
not believe that more rate cuts will stimulate lending, the main
argument for further monetary easing appears to be that doing
so will weaken the currency, providing a boost for domestic
exporters. However, the zloty has already fallen 6.0% against
the euro since December 2012, while the broad REER (BIS
calculation) has weakened by 3.0%. While further weakness
could provide a greater boost to exporters, it will also suppress
domestic demand – already at its weakest on record.
Finance Minister Jan Vincent-Rostowski recently suggested that
the central bank should keep cutting rates, which is logical given
that further cuts could help to minimise government borrowing
costs as it embarks on fiscal stimulus in September, by keeping
yields down on local debt. However, Poland's benchmark rate
is among the lowest in CEE, and we emphasise that further cuts
could trigger capital outflows from non-resident government
bond owners, which could in fact cause government borrow-
ing costs to rise. In summary, we think that potential economic
benefits from further rate cuts are limited, and expect that fiscal
stimulus will overtake monetary policy as a preferred policy
tool to support domestic demand over the remainder of the year.
20 Business Monitor International Ltdwww.businessmonitor.com
POLAND Q4 2013
Rate Cuts Weakening Corporate LendingSenior Loan Officer Survey
Notes: The difference between the percentage of responses “Contributed considerably to the easing of lending policies” and “Contributed somewhat to the easing of lending policies” and the percentage of responses “Contributed considerably to the tightening of lending policies” and “Contributed somewhat to the tightening of lending policies”. A negative index indicates a given factor’s greater contribution to the tightening than to the easing of lending policies. Source: BMI, NBP Senior Loan Officer Survey
Zloty Already WeakenedEURPLN Cross-rate & Broad REER (LHS, inverted scale)
Source: BMI, Bloomberg, BIS

Currency Forecast
PLN: Maintaining Medium-Term Bearish BiasShort-Term Outlook: With no further rate cuts anticipated in
our view, we expect the zloty to range trade around the PLN4.2
0-4.3 0/EUR level over the coming months. Demand for zloty-
denominated debt is weak and is likely to remain so, as rising
US treasury yields keep investors wary of emerging market debt,
which has underperformed so far this year. Nonetheless, demand
for the zloty will remain robust enough to keep it anchored around
current levels. Economic data over the next few months should
point towards a steady, albeit somewhat protracted recovery,
primarily driven by net exports, implying buying pressure on
the zloty should stay relatively stable.
We maintain our original forecast made at the start of the year
for the zloty to average PLN4.2/EUR over the course of 2013,
which has played out relatively well thus far (see 'PLN: Weaker
Outlook Ahead', Jan 22 ).Between January and August, the
zloty averaged PLN 4.19 /EUR, and while depreciatory risks are
present–particularly with the growing possibility of a tapering
of the Federal Reserve's quantitative easing programme over the
coming months, driving US yields higher – we think that the zloty
will trade around the PLN4.2 0/EUR level over most of H213.
On the upside, our core view is that the National Bank of Po-
land’s monetary easing cycle has drawn to an end, with rates
now likely to stay at 2.50% for the rest of the year. Having cut to
historical lows, we think the NBP is unlikely to push ahead with
further cuts, as the easing cycle has already cut into domestic
banks ' profit margins (see 'Fiscal Stimulus To Usurp Monetary
Easing', July 17). Further cuts could also push foreign investors
out of domestic debt, weakening the zloty and raising long-term
borrowing costs. Foreign ownership of domestic government
bonds fell in Q213 for the first quarter since Q411, and with
Polish rates at historical lows, further cuts would further reduce
the relative carry appeal of the zloty. Indeed, one month interest
returns on the zloty are now lower than any other major currency
in Emerging Europe save the Czech koruna, dropping to just
0.23% in August versus 0.4% for the Romania leu and 0.3%
for the Hungarian forint.
Despite weaker demand for government bonds, Poland's current
account should also prove supportive to the zloty over H213. It
posted a surplus for the second consecutive month in May, as
weak domestic demand suppressed imports, helping to boost the
trade account into surplus. With recent PMI readings showing
a recovery in Polish manufacturing and a recovery underway
in German factory orders, this dynamic should hold up over
the coming months, although it will be gradually eroded by the
recovery in domestic demand, which should begin to rebound
21Business Monitor International Ltd www.businessmonitor.com
POLITICAL OUTLOOK
TABLE: CURRENCY FORECASTSSpot 2013f 2014f
PLN/EUR (ave) 4.1394 4.20 4.25
PLN/US$ (ave) 3.1679 3.13 3.35
Benchmark Rate 2.50% 2.50% 2.50%
Source: BMI, Bloomberg
Range-Trading For NowPLN/EUR Exchange Rate, daily
Source: Bloomberg, BMI
Bearish Bias Over Medium-TermEUR/PLN, exchange rate
Source: Bloomberg
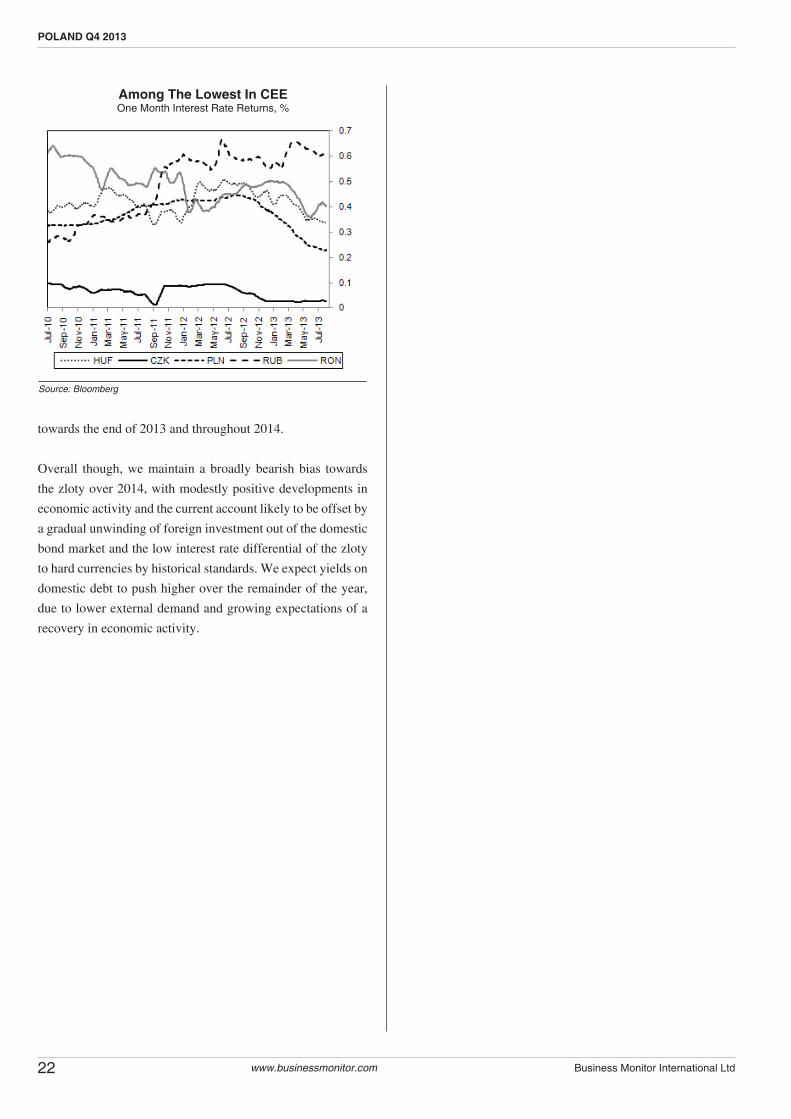
towards the end of 2013 and throughout 2014.
Overall though, we maintain a broadly bearish bias towards
the zloty over 2014, with modestly positive developments in
economic activity and the current account likely to be offset by
a gradual unwinding of foreign investment out of the domestic
bond market and the low interest rate differential of the zloty
to hard currencies by historical standards. We expect yields on
domestic debt to push higher over the remainder of the year,
due to lower external demand and growing expectations of a
recovery in economic activity.
22 Business Monitor International Ltdwww.businessmonitor.com
POLAND Q4 2013
Among The Lowest In CEEOne Month Interest Rate Returns, %
Source: Bloomberg
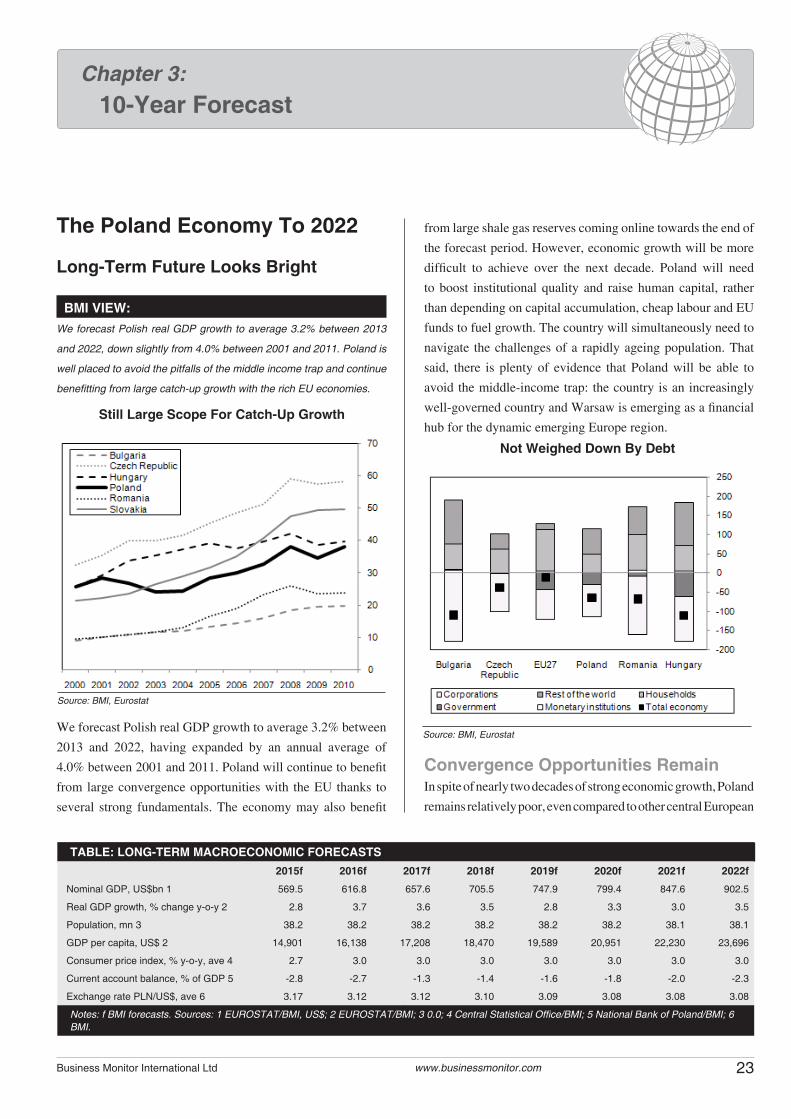
The Poland Economy To 2022
Long-Term Future Looks Bright
BMI VIEW:We forecast Polish real GDP growth to average 3.2% between 2013
and 2022, down slightly from 4.0% between 2001 and 2011. Poland is
well placed to avoid the pitfalls of the middle income trap and continue
benefitting from large catch-up growth with the rich EU economies.
We forecast Polish real GDP growth to average 3.2% between
2013 and 2022, having expanded by an annual average of
4.0% between 2001 and 2011. Poland will continue to benefit
from large convergence opportunities with the EU thanks to
several strong fundamentals. The economy may also benefit
from large shale gas reserves coming online towards the end of
the forecast period. However, economic growth will be more
difficult to achieve over the next decade. Poland will need
to boost institutional quality and raise human capital, rather
than depending on capital accumulation, cheap labour and EU
funds to fuel growth. The country will simultaneously need to
navigate the challenges of a rapidly ageing population. That
said, there is plenty of evidence that Poland will be able to
avoid the middle-income trap: the country is an increasingly
well-governed country and Warsaw is emerging as a financial
hub for the dynamic emerging Europe region.
Convergence Opportunities RemainIn spite of nearly two decades of strong economic growth, Poland
remains relatively poor, even compared to other central European
23Business Monitor International Ltd www.businessmonitor.com
Chapter 3: 10-Year Forecast
Still Large Scope For Catch-Up Growth
Source: BMI, Eurostat
Not Weighed Down By Debt
Source: BMI, Eurostat
TABLE: LONG-TERM MACROECONOMIC FORECASTS 2015f 2016f 2017f 2018f 2019f 2020f 2021f 2022f
Nominal GDP, US$bn 1 569.5 616.8 657.6 705.5 747.9 799.4 847.6 902.5
Real GDP growth, % change y-o-y 2 2.8 3.7 3.6 3.5 2.8 3.3 3.0 3.5
Population, mn 3 38.2 38.2 38.2 38.2 38.2 38.2 38.1 38.1
GDP per capita, US$ 2 14,901 16,138 17,208 18,470 19,589 20,951 22,230 23,696
Consumer price index, % y-o-y, ave 4 2.7 3.0 3.0 3.0 3.0 3.0 3.0 3.0
Current account balance, % of GDP 5 -2.8 -2.7 -1.3 -1.4 -1.6 -1.8 -2.0 -2.3
Exchange rate PLN/US$, ave 6 3.17 3.12 3.12 3.10 3.09 3.08 3.08 3.08
Notes: f BMI forecasts. Sources: 1 EUROSTAT/BMI, US$; 2 EUROSTAT/BMI; 3 0.0; 4 Central Statistical Office/BMI; 5 National Bank of Poland/BMI; 6 BMI.
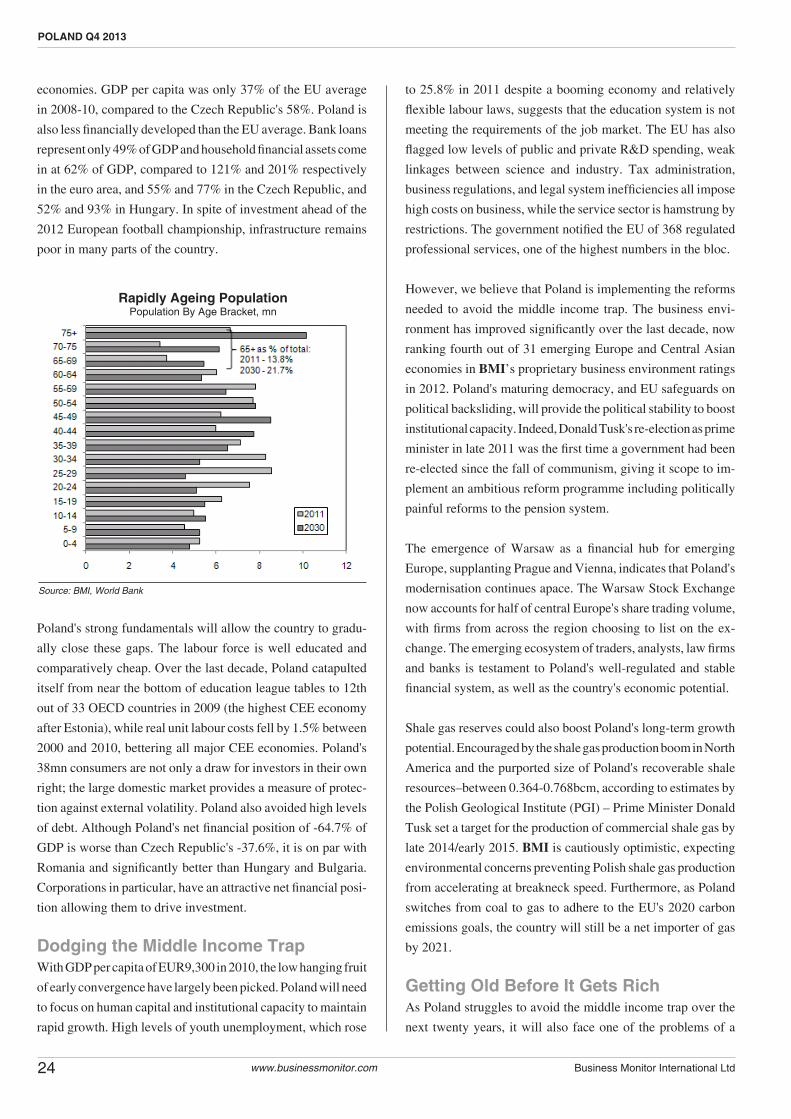
economies. GDP per capita was only 37% of the EU average
in 2008-10, compared to the Czech Republic's 58%. Poland is
also less financially developed than the EU average. Bank loans
represent only 49% of GDP and household financial assets come
in at 62% of GDP, compared to 121% and 201% respectively
in the euro area, and 55% and 77% in the Czech Republic, and
52% and 93% in Hungary. In spite of investment ahead of the
2012 European football championship, infrastructure remains
poor in many parts of the country.
Poland's strong fundamentals will allow the country to gradu-
ally close these gaps. The labour force is well educated and
comparatively cheap. Over the last decade, Poland catapulted
itself from near the bottom of education league tables to 12th
out of 33 OECD countries in 2009 (the highest CEE economy
after Estonia), while real unit labour costs fell by 1.5% between
2000 and 2010, bettering all major CEE economies. Poland's
38mn consumers are not only a draw for investors in their own
right; the large domestic market provides a measure of protec-
tion against external volatility. Poland also avoided high levels
of debt. Although Poland's net financial position of -64.7% of
GDP is worse than Czech Republic's -37.6%, it is on par with
Romania and significantly better than Hungary and Bulgaria.
Corporations in particular, have an attractive net financial posi-
tion allowing them to drive investment.
Dodging the Middle Income TrapWith GDP per capita of EUR9,300 in 2010, the low hanging fruit
of early convergence have largely been picked. Poland will need
to focus on human capital and institutional capacity to maintain
rapid growth. High levels of youth unemployment, which rose
to 25.8% in 2011 despite a booming economy and relatively
flexible labour laws, suggests that the education system is not
meeting the requirements of the job market. The EU has also
flagged low levels of public and private R&D spending, weak
linkages between science and industry. Tax administration,
business regulations, and legal system inefficiencies all impose
high costs on business, while the service sector is hamstrung by
restrictions. The government notified the EU of 368 regulated
professional services, one of the highest numbers in the bloc.
However, we believe that Poland is implementing the reforms
needed to avoid the middle income trap. The business envi-
ronment has improved significantly over the last decade, now
ranking fourth out of 31 emerging Europe and Central Asian
economies in BMI’s proprietary business environment ratings
in 2012. Poland's maturing democracy, and EU safeguards on
political backsliding, will provide the political stability to boost
institutional capacity. Indeed, Donald Tusk's re-election as prime
minister in late 2011 was the first time a government had been
re-elected since the fall of communism, giving it scope to im-
plement an ambitious reform programme including politically
painful reforms to the pension system.
The emergence of Warsaw as a financial hub for emerging
Europe, supplanting Prague and Vienna, indicates that Poland's
modernisation continues apace. The Warsaw Stock Exchange
now accounts for half of central Europe's share trading volume,
with firms from across the region choosing to list on the ex-
change. The emerging ecosystem of traders, analysts, law firms
and banks is testament to Poland's well-regulated and stable
financial system, as well as the country's economic potential.
Shale gas reserves could also boost Poland's long-term growth
potential. Encouraged by the shale gas production boom in North
America and the purported size of Poland's recoverable shale
resources–between 0.364-0.768bcm, according to estimates by
the Polish Geological Institute (PGI) – Prime Minister Donald
Tusk set a target for the production of commercial shale gas by
late 2014/early 2015. BMI is cautiously optimistic, expecting
environmental concerns preventing Polish shale gas production
from accelerating at breakneck speed. Furthermore, as Poland
switches from coal to gas to adhere to the EU's 2020 carbon
emissions goals, the country will still be a net importer of gas
by 2021.
Getting Old Before It Gets RichAs Poland struggles to avoid the middle income trap over the
next twenty years, it will also face one of the problems of a
24 Business Monitor International Ltdwww.businessmonitor.com
POLAND Q4 2013
Rapidly Ageing Population Population By Age Bracket, mn
Source: BMI, World Bank
high income country: ageing. In 2030, 34.6% of the population
will be of pensionable age, one of the highest ratios in the CEE
region, compared to 19.0% in 2010. The old age dependency
ratio (population aged 65+ as a percentage of the population aged
15-64) will double in the next 30 years, from about 20% to 40%.
Although ageing will dampen economic growth towards the
end of the forecast period, Poland could offset some of the
costs by raising the labour force participation rate. Only 64.8%
of the population between 20 and 64 is currently active on the
labour market, with a particularly low participation rate for the
young, women and the elderly. There are a number of proposals
in the pipeline for improving education, expanding childcare
to allow more women to work and proposals for flex-security.
The pension age was also raised to 67 in 2012, from 65 for men
and 60 for women.
25Business Monitor International Ltd www.businessmonitor.com
POLITICAL OUTLOOK
BMI’s long-term macroeconomic forecasts are based on a variety of quantitative and qualitative factors. Our 10-year forecasts assume in most
cases that growth eventually converges to a long-term trend, with economic potential being determined by factors such as capital investment,
demographics and productivity growth. Because quantitative frameworks often fail to capture key dynamics behind long-term growth determinants,
our forecasts also reflect analysts’ in-depth knowledge of subjective factors such as institutional strength and political stability. We assess trends in
the composition of the economy on a GDP by expenditure basis in order to determine the degree to which private and government consumption,
fixed investment and the export sector will drive growth in the future. Taken together, these factors feed into our projections for exchange rates,
external account balances and interest rates.


27Business Monitor International Ltd www.businessmonitor.com
SWOT Analysis
Strengths Foreign investor appetite for entering Poland remains strong thanks
to a stable political environment bolstered by EU membership, a
comparatively strong macroeconomic outlook, and the implementa-
tion of pro-business reforms which are likely to continue under Prime
Minister Donald Tusk.
With a few exceptions, foreign businesses are permitted unrestricted
ownership of Polish assets.
Weaknesses Foreign direct investment per capita remains considerably lower than
in comparable countries such as the Czech Republic and Hungary.
Although Poland has made great progress in improving its business
environment over the last decade, challenges remain. An inefficient
court system and poor quality infrastructure quality hold back growth.
Opportunities On the basis of its comparatively low labour costs, Poland offers a
strategic entry point to external investors looking to exploit its unfet-
tered access to most EU markets.
Local capital markets are deepening to provide opportunities for
greater financial intermediation and investment.
Threats The ‘brain drain’ of migration to higher-paid jobs in Western Europe
poses a minor – but rising – threat to the availability of skilled labour
in Poland.
BMI Business Environment Risk RatingsAlthough Poland’s business environment has become increasingly
attractive to foreign investors, the transport network is still in need of
substantial investment and development. The quality of the road network
is particularly poor, which has posed somewhat of a hindrance to freight
transport across the country.
Chapter 4: Business Environment
Business Environment Rank TrendEstonia 67.7 1 =Hungary 64.5 2 =Czech Republic 63.5 3 =Poland 63.4 4 =Lithuania 63.3 5 =Slovenia 62.7 6 =Slovakia 57.7 7 =Latvia 57.6 8 =Croatia 57.0 9 =Kazakhstan 55.0 10 =Romania 54.6 11 =Bulgaria 54.5 12 =Macedonia 54.4 13 =Montenegro 54.4 13 =Turkey 54.4 13 =Albania 50.7 16 =Belarus 49.9 17 =Russia 48.8 18 =Mongolia 47.9 19 =Azerbaijan 47.6 20 =Serbia 47.5 21 =Armenia 47.3 22 =Moldova 46.9 23 =Georgia 46.2 24 =Ukraine 44.5 25 =Uzbekistan 39.4 26 =Kosovo 38.8 27 =Kyrgyzstan 38.5 28 =Bosnia-Herzegovina 38.0 29 =Turkmenistan 37.6 30 =Tajikistan 34.3 31 =Regional ave 52.3 / Global ave 48.5 / Emerging Markets ave 45.1
Composite Rank TrendEstonia 73.4 1 -Poland 69.2 2 -Czech Republic 68.8 3 -Slovakia 67.1 4 -Slovenia 64.8 5 -Lithuania 64.6 6 +Hungary 64.0 7 =Latvia 63.0 8 =Kazakhstan 62.6 8 -Russia 61.7 10 -Croatia 61.0 11 -Romania 60.1 12 =Turkey 58.3 13 -Azerbaijan 56.5 14 =Bulgaria 56.3 15 -Mongolia 53.9 16 +Montenegro 53.5 17 =Turkmenistan 53.3 18 -Uzbekistan 52.4 19 =Albania 50.5 20 =Armenia 50.4 21 =Georgia 50.3 22 =Serbia 48.8 23 =Ukraine 47.4 24 -Moldova 46.0 25 =Belarus 44.2 26 =Tajikistan 41.8 27 -Kosovo 39.4 28 =Bosnia-Herzegovina 38.6 29 =Kyrgyzstan 33.8 30 -Macedonia - 31 -Regional ave 54.6 / Global ave 52.9 / Emerging Markets ave 49.6
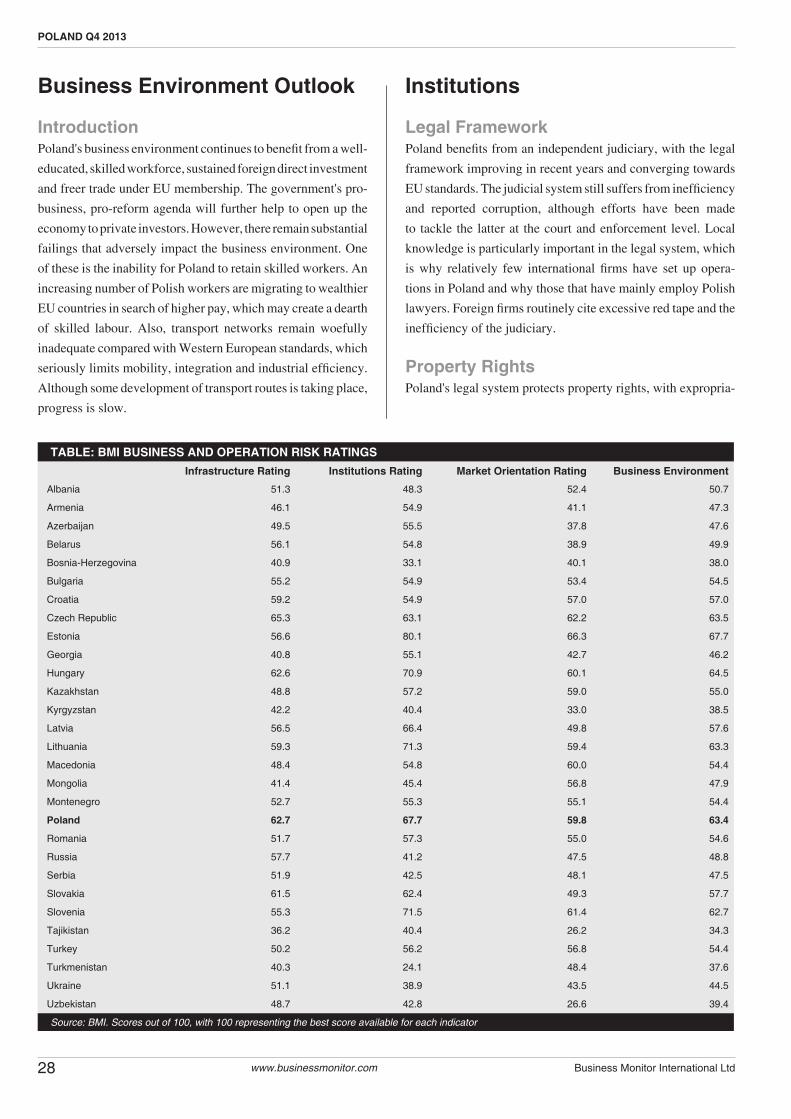
Business Environment Outlook
Introduction Poland's business environment continues to benefit from a well-
educated, skilled workforce, sustained foreign direct investment
and freer trade under EU membership. The government's pro-
business, pro-reform agenda will further help to open up the
economy to private investors. However, there remain substantial
failings that adversely impact the business environment. One
of these is the inability for Poland to retain skilled workers. An
increasing number of Polish workers are migrating to wealthier
EU countries in search of higher pay, which may create a dearth
of skilled labour. Also, transport networks remain woefully
inadequate compared with Western European standards, which
seriously limits mobility, integration and industrial efficiency.
Although some development of transport routes is taking place,
progress is slow.
Institutions
Legal FrameworkPoland benefits from an independent judiciary, with the legal
framework improving in recent years and converging towards
EU standards. The judicial system still suffers from inefficiency
and reported corruption, although efforts have been made
to tackle the latter at the court and enforcement level. Local
knowledge is particularly important in the legal system, which
is why relatively few international firms have set up opera-
tions in Poland and why those that have mainly employ Polish
lawyers. Foreign firms routinely cite excessive red tape and the
inefficiency of the judiciary.
Property RightsPoland's legal system protects property rights, with expropria-
28 Business Monitor International Ltdwww.businessmonitor.com
POLAND Q4 2013
TABLE: BMI BUSINESS AND OPERATION RISK RATINGSInfrastructure Rating Institutions Rating Market Orientation Rating Business Environment
Albania 51.3 48.3 52.4 50.7
Armenia 46.1 54.9 41.1 47.3
Azerbaijan 49.5 55.5 37.8 47.6
Belarus 56.1 54.8 38.9 49.9
Bosnia-Herzegovina 40.9 33.1 40.1 38.0
Bulgaria 55.2 54.9 53.4 54.5
Croatia 59.2 54.9 57.0 57.0
Czech Republic 65.3 63.1 62.2 63.5
Estonia 56.6 80.1 66.3 67.7
Georgia 40.8 55.1 42.7 46.2
Hungary 62.6 70.9 60.1 64.5
Kazakhstan 48.8 57.2 59.0 55.0
Kyrgyzstan 42.2 40.4 33.0 38.5
Latvia 56.5 66.4 49.8 57.6
Lithuania 59.3 71.3 59.4 63.3
Macedonia 48.4 54.8 60.0 54.4
Mongolia 41.4 45.4 56.8 47.9
Montenegro 52.7 55.3 55.1 54.4
Poland 62.7 67.7 59.8 63.4
Romania 51.7 57.3 55.0 54.6
Russia 57.7 41.2 47.5 48.8
Serbia 51.9 42.5 48.1 47.5
Slovakia 61.5 62.4 49.3 57.7
Slovenia 55.3 71.5 61.4 62.7
Tajikistan 36.2 40.4 26.2 34.3
Turkey 50.2 56.2 56.8 54.4
Turkmenistan 40.3 24.1 48.4 37.6
Ukraine 51.1 38.9 43.5 44.5
Uzbekistan 48.7 42.8 26.6 39.4
Source: BMI. Scores out of 100, with 100 representing the best score available for each indicator
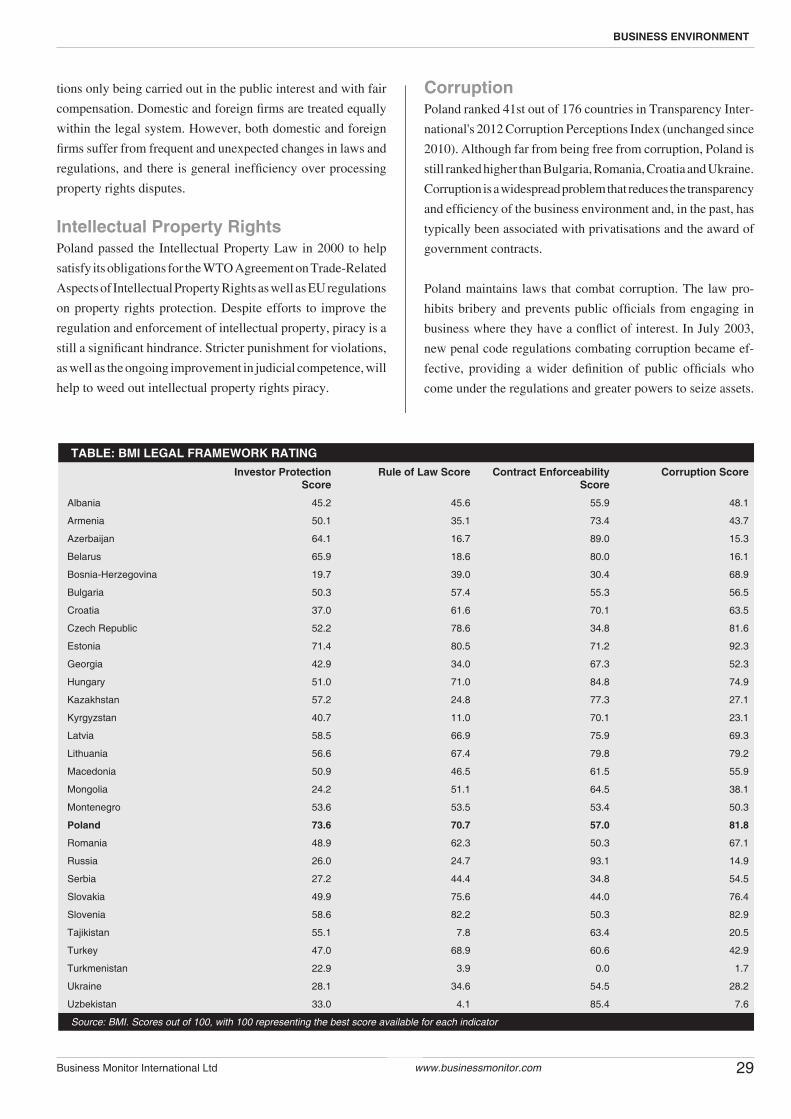
tions only being carried out in the public interest and with fair
compensation. Domestic and foreign firms are treated equally
within the legal system. However, both domestic and foreign
firms suffer from frequent and unexpected changes in laws and
regulations, and there is general inefficiency over processing
property rights disputes.
Intellectual Property RightsPoland passed the Intellectual Property Law in 2000 to help
satisfy its obligations for the WTO Agreement on Trade-Related
Aspects of Intellectual Property Rights as well as EU regulations
on property rights protection. Despite efforts to improve the
regulation and enforcement of intellectual property, piracy is a
still a significant hindrance. Stricter punishment for violations,
as well as the ongoing improvement in judicial competence, will
help to weed out intellectual property rights piracy.
CorruptionPoland ranked 41st out of 176 countries in Transparency Inter-
national's 2012 Corruption Perceptions Index (unchanged since
2010). Although far from being free from corruption, Poland is
still ranked higher than Bulgaria, Romania, Croatia and Ukraine.
Corruption is a widespread problem that reduces the transparency
and efficiency of the business environment and, in the past, has
typically been associated with privatisations and the award of
government contracts.
Poland maintains laws that combat corruption. The law pro-
hibits bribery and prevents public officials from engaging in
business where they have a conflict of interest. In July 2003,
new penal code regulations combating corruption became ef-
fective, providing a wider definition of public officials who
come under the regulations and greater powers to seize assets.
29Business Monitor International Ltd www.businessmonitor.com
BUSINESS ENVIRONMENT
TABLE: BMI LEGAL FRAMEWORK RATINGInvestor Protection
ScoreRule of Law Score Contract Enforceability
ScoreCorruption Score
Albania 45.2 45.6 55.9 48.1
Armenia 50.1 35.1 73.4 43.7
Azerbaijan 64.1 16.7 89.0 15.3
Belarus 65.9 18.6 80.0 16.1
Bosnia-Herzegovina 19.7 39.0 30.4 68.9
Bulgaria 50.3 57.4 55.3 56.5
Croatia 37.0 61.6 70.1 63.5
Czech Republic 52.2 78.6 34.8 81.6
Estonia 71.4 80.5 71.2 92.3
Georgia 42.9 34.0 67.3 52.3
Hungary 51.0 71.0 84.8 74.9
Kazakhstan 57.2 24.8 77.3 27.1
Kyrgyzstan 40.7 11.0 70.1 23.1
Latvia 58.5 66.9 75.9 69.3
Lithuania 56.6 67.4 79.8 79.2
Macedonia 50.9 46.5 61.5 55.9
Mongolia 24.2 51.1 64.5 38.1
Montenegro 53.6 53.5 53.4 50.3
Poland 73.6 70.7 57.0 81.8
Romania 48.9 62.3 50.3 67.1
Russia 26.0 24.7 93.1 14.9
Serbia 27.2 44.4 34.8 54.5
Slovakia 49.9 75.6 44.0 76.4
Slovenia 58.6 82.2 50.3 82.9
Tajikistan 55.1 7.8 63.4 20.5
Turkey 47.0 68.9 60.6 42.9
Turkmenistan 22.9 3.9 0.0 1.7
Ukraine 28.1 34.6 54.5 28.2
Uzbekistan 33.0 4.1 85.4 7.6
Source: BMI. Scores out of 100, with 100 representing the best score available for each indicator
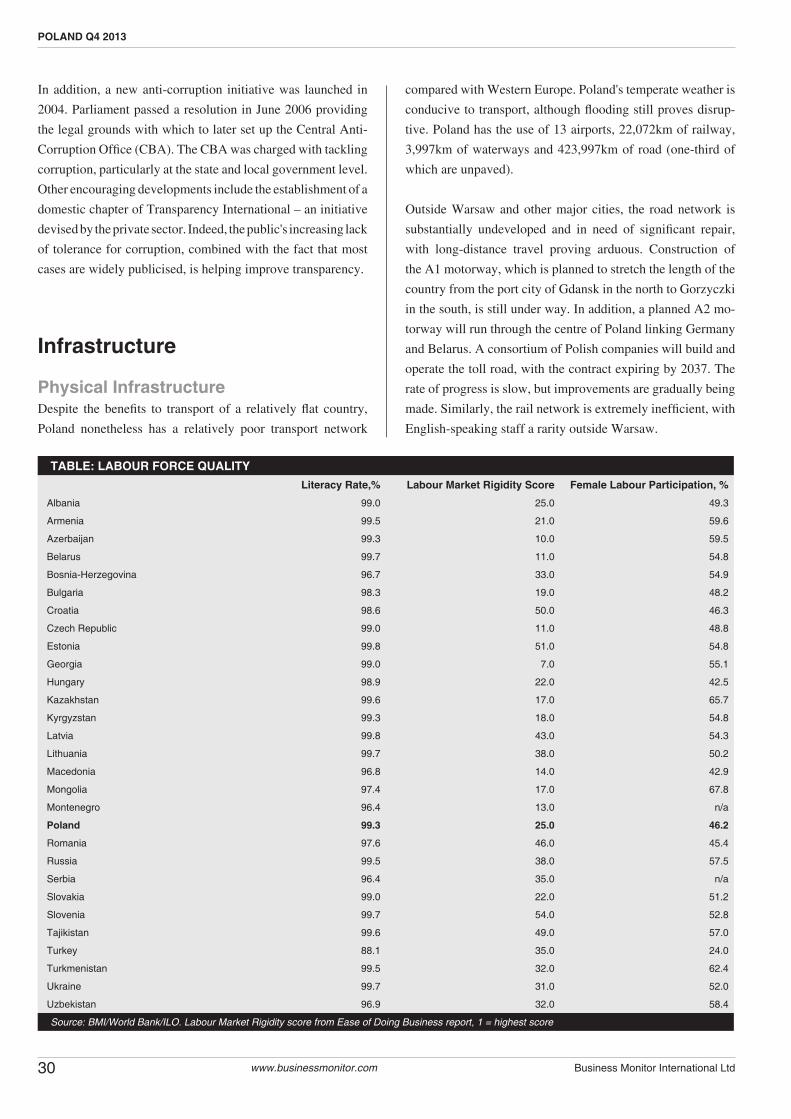
In addition, a new anti-corruption initiative was launched in
2004. Parliament passed a resolution in June 2006 providing
the legal grounds with which to later set up the Central Anti-
Corruption Office (CBA). The CBA was charged with tackling
corruption, particularly at the state and local government level.
Other encouraging developments include the establishment of a
domestic chapter of Transparency International – an initiative
devised by the private sector. Indeed, the public's increasing lack
of tolerance for corruption, combined with the fact that most
cases are widely publicised, is helping improve transparency.
Infrastructure
Physical InfrastructureDespite the benefits to transport of a relatively flat country,
Poland nonetheless has a relatively poor transport network
compared with Western Europe. Poland's temperate weather is
conducive to transport, although flooding still proves disrup-
tive. Poland has the use of 13 airports, 22,072km of railway,
3,997km of waterways and 423,997km of road (one-third of
which are unpaved).
Outside Warsaw and other major cities, the road network is
substantially undeveloped and in need of significant repair,
with long-distance travel proving arduous. Construction of
the A1 motorway, which is planned to stretch the length of the
country from the port city of Gdansk in the north to Gorzyczki
in the south, is still under way. In addition, a planned A2 mo-
torway will run through the centre of Poland linking Germany
and Belarus. A consortium of Polish companies will build and
operate the toll road, with the contract expiring by 2037. The
rate of progress is slow, but improvements are gradually being
made. Similarly, the rail network is extremely inefficient, with
English-speaking staff a rarity outside Warsaw.
30 Business Monitor International Ltdwww.businessmonitor.com
POLAND Q4 2013
TABLE: LABOUR FORCE QUALITYLiteracy Rate,% Labour Market Rigidity Score Female Labour Participation, %
Albania 99.0 25.0 49.3
Armenia 99.5 21.0 59.6
Azerbaijan 99.3 10.0 59.5
Belarus 99.7 11.0 54.8
Bosnia-Herzegovina 96.7 33.0 54.9
Bulgaria 98.3 19.0 48.2
Croatia 98.6 50.0 46.3
Czech Republic 99.0 11.0 48.8
Estonia 99.8 51.0 54.8
Georgia 99.0 7.0 55.1
Hungary 98.9 22.0 42.5
Kazakhstan 99.6 17.0 65.7
Kyrgyzstan 99.3 18.0 54.8
Latvia 99.8 43.0 54.3
Lithuania 99.7 38.0 50.2
Macedonia 96.8 14.0 42.9
Mongolia 97.4 17.0 67.8
Montenegro 96.4 13.0 n/a
Poland 99.3 25.0 46.2
Romania 97.6 46.0 45.4
Russia 99.5 38.0 57.5
Serbia 96.4 35.0 n/a
Slovakia 99.0 22.0 51.2
Slovenia 99.7 54.0 52.8
Tajikistan 99.6 49.0 57.0
Turkey 88.1 35.0 24.0
Turkmenistan 99.5 32.0 62.4
Ukraine 99.7 31.0 52.0
Uzbekistan 96.9 32.0 58.4
Source: BMI/World Bank/ILO. Labour Market Rigidity score from Ease of Doing Business report, 1 = highest score
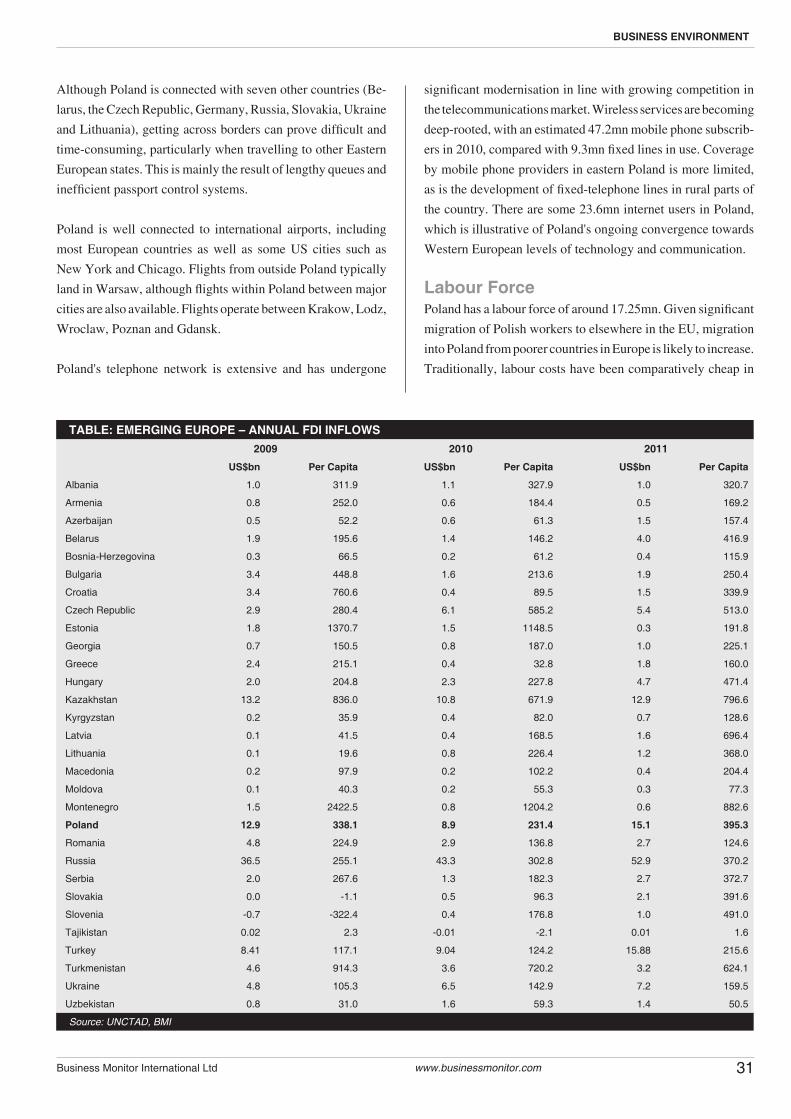
Although Poland is connected with seven other countries (Be-
larus, the Czech Republic, Germany, Russia, Slovakia, Ukraine
and Lithuania), getting across borders can prove difficult and
time-consuming, particularly when travelling to other Eastern
European states. This is mainly the result of lengthy queues and
inefficient passport control systems.
Poland is well connected to international airports, including
most European countries as well as some US cities such as
New York and Chicago. Flights from outside Poland typically
land in Warsaw, although flights within Poland between major
cities are also available. Flights operate between Krakow, Lodz,
Wroclaw, Poznan and Gdansk.
Poland's telephone network is extensive and has undergone
significant modernisation in line with growing competition in
the telecommunications market. Wireless services are becoming
deep-rooted, with an estimated 47.2mn mobile phone subscrib-
ers in 2010, compared with 9.3mn fixed lines in use. Coverage
by mobile phone providers in eastern Poland is more limited,
as is the development of fixed-telephone lines in rural parts of
the country. There are some 23.6mn internet users in Poland,
which is illustrative of Poland's ongoing convergence towards
Western European levels of technology and communication.
Labour ForcePoland has a labour force of around 17.25mn. Given significant
migration of Polish workers to elsewhere in the EU, migration
into Poland from poorer countries in Europe is likely to increase.
Traditionally, labour costs have been comparatively cheap in
31Business Monitor International Ltd www.businessmonitor.com
BUSINESS ENVIRONMENT
TABLE: EMERGING EUROPE – ANNUAL FDI INFLOWS2009 2010 2011
US$bn Per Capita US$bn Per Capita US$bn Per Capita
Albania 1.0 311.9 1.1 327.9 1.0 320.7
Armenia 0.8 252.0 0.6 184.4 0.5 169.2
Azerbaijan 0.5 52.2 0.6 61.3 1.5 157.4
Belarus 1.9 195.6 1.4 146.2 4.0 416.9
Bosnia-Herzegovina 0.3 66.5 0.2 61.2 0.4 115.9
Bulgaria 3.4 448.8 1.6 213.6 1.9 250.4
Croatia 3.4 760.6 0.4 89.5 1.5 339.9
Czech Republic 2.9 280.4 6.1 585.2 5.4 513.0
Estonia 1.8 1370.7 1.5 1148.5 0.3 191.8
Georgia 0.7 150.5 0.8 187.0 1.0 225.1
Greece 2.4 215.1 0.4 32.8 1.8 160.0
Hungary 2.0 204.8 2.3 227.8 4.7 471.4
Kazakhstan 13.2 836.0 10.8 671.9 12.9 796.6
Kyrgyzstan 0.2 35.9 0.4 82.0 0.7 128.6
Latvia 0.1 41.5 0.4 168.5 1.6 696.4
Lithuania 0.1 19.6 0.8 226.4 1.2 368.0
Macedonia 0.2 97.9 0.2 102.2 0.4 204.4
Moldova 0.1 40.3 0.2 55.3 0.3 77.3
Montenegro 1.5 2422.5 0.8 1204.2 0.6 882.6
Poland 12.9 338.1 8.9 231.4 15.1 395.3
Romania 4.8 224.9 2.9 136.8 2.7 124.6
Russia 36.5 255.1 43.3 302.8 52.9 370.2
Serbia 2.0 267.6 1.3 182.3 2.7 372.7
Slovakia 0.0 -1.1 0.5 96.3 2.1 391.6
Slovenia -0.7 -322.4 0.4 176.8 1.0 491.0
Tajikistan 0.02 2.3 -0.01 -2.1 0.01 1.6
Turkey 8.41 117.1 9.04 124.2 15.88 215.6
Turkmenistan 4.6 914.3 3.6 720.2 3.2 624.1
Ukraine 4.8 105.3 6.5 142.9 7.2 159.5
Uzbekistan 0.8 31.0 1.6 59.3 1.4 50.5
Source: UNCTAD, BMI
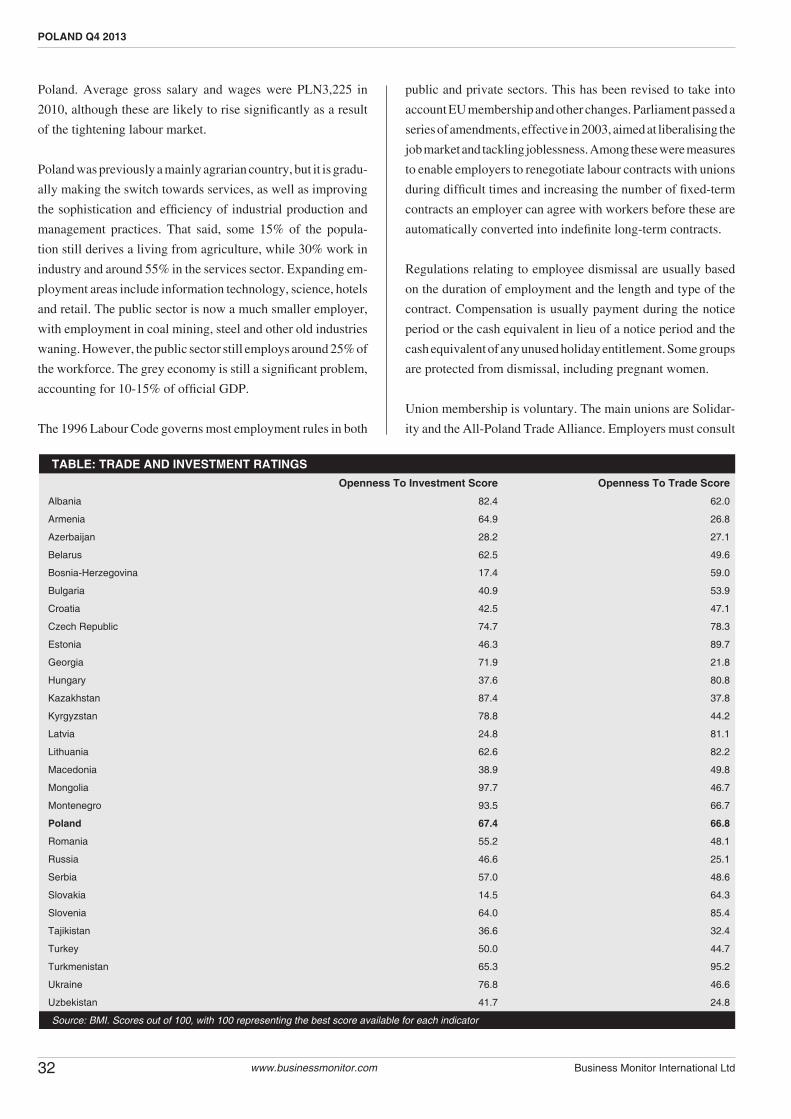
Poland. Average gross salary and wages were PLN3,225 in
2010, although these are likely to rise significantly as a result
of the tightening labour market.
Poland was previously a mainly agrarian country, but it is gradu-
ally making the switch towards services, as well as improving
the sophistication and efficiency of industrial production and
management practices. That said, some 15% of the popula-
tion still derives a living from agriculture, while 30% work in
industry and around 55% in the services sector. Expanding em-
ployment areas include information technology, science, hotels
and retail. The public sector is now a much smaller employer,
with employment in coal mining, steel and other old industries
waning. However, the public sector still employs around 25% of
the workforce. The grey economy is still a significant problem,
accounting for 10-15% of official GDP.
The 1996 Labour Code governs most employment rules in both
public and private sectors. This has been revised to take into
account EU membership and other changes. Parliament passed a
series of amendments, effective in 2003, aimed at liberalising the
job market and tackling joblessness. Among these were measures
to enable employers to renegotiate labour contracts with unions
during difficult times and increasing the number of fixed-term
contracts an employer can agree with workers before these are
automatically converted into indefinite long-term contracts.
Regulations relating to employee dismissal are usually based
on the duration of employment and the length and type of the
contract. Compensation is usually payment during the notice
period or the cash equivalent in lieu of a notice period and the
cash equivalent of any unused holiday entitlement. Some groups
are protected from dismissal, including pregnant women.
Union membership is voluntary. The main unions are Solidar-
ity and the All-Poland Trade Alliance. Employers must consult
32 Business Monitor International Ltdwww.businessmonitor.com
POLAND Q4 2013
TABLE: TRADE AND INVESTMENT RATINGSOpenness To Investment Score Openness To Trade Score
Albania 82.4 62.0
Armenia 64.9 26.8
Azerbaijan 28.2 27.1
Belarus 62.5 49.6
Bosnia-Herzegovina 17.4 59.0
Bulgaria 40.9 53.9
Croatia 42.5 47.1
Czech Republic 74.7 78.3
Estonia 46.3 89.7
Georgia 71.9 21.8
Hungary 37.6 80.8
Kazakhstan 87.4 37.8
Kyrgyzstan 78.8 44.2
Latvia 24.8 81.1
Lithuania 62.6 82.2
Macedonia 38.9 49.8
Mongolia 97.7 46.7
Montenegro 93.5 66.7
Poland 67.4 66.8
Romania 55.2 48.1
Russia 46.6 25.1
Serbia 57.0 48.6
Slovakia 14.5 64.3
Slovenia 64.0 85.4
Tajikistan 36.6 32.4
Turkey 50.0 44.7
Turkmenistan 65.3 95.2
Ukraine 76.8 46.6
Uzbekistan 41.7 24.8
Source: BMI. Scores out of 100, with 100 representing the best score available for each indicator

unions on redundancies, wages and other labour issues. Poland
also abides by the International Labour Organization Convention
on workers' rights. Despite sporadic strikes, Poland's industrial
relations record is now average for the region. Strikes in the
private sector are rare.
Market Orientation
Foreign Investment Policy Since the collapse of communism and the subsequent transition
to a market economy, Poland has embraced foreign investment.
The principal investors in Poland remain the US and Western
European states. Membership of the EU in March 2004 has further
consolidated Poland's reputation as a stable and open economy
that is open to foreign investment. Indeed, strengthening trade
links as well as convergence towards Western European levels
of wealth and standards of corporate regulation have provided
further incentives for the foreign investor.
Successive governments since 1990 have passed legislation
aimed at cutting red tape surrounding foreign acquisitions.
These include passing the Law on Economic Freedom in 2004,
which has simplified the process of registering a company. Fur-
ther reforms include the improvement in regulation regarding
bank loans and bankruptcy law, as well as a reduction in the
corporate income tax rate to 19% from 27%. The current Civic
Platform-led coalition government is widely seen as pro-reform
and pro-business, which will likely encourage further foreign
investment. The government's commitment to privatising state-
owned industries will provide further opportunities for foreign
investors to gain exposure to key industries.
Foreign investors are permitted to operate in almost all Pol-
ish markets, with the exception of some strategic industries
(including air transport, broadcasting and gambling) as well
as real estate. Foreign firms are treated in the same manner as
domestic companies with regard to property rights and are not
restricted in remitting profits abroad. Foreign investors who
maintain permanent residence in Poland are permitted to set
up joint-stock companies, limited liability companies, limited
joint-stock partnerships, professional partnerships, registered
partnerships and limited partnerships.
In July 2004, the government amended the Economic Freedom
Act, with updated rules and compliance procedures regarding
the operation of branches and representative offices in Poland.
Foreign investors wishing to establish a branch in Poland must
register with the National Court Register. While a branch is
permitted to conduct all activities of the parent company, a
representative office, on the other hand, is limited to promo-
tional activities on behalf of the parent firm. Registration of
either a branch or representative office no longer requires the
acquisition of permits, which greatly improves the efficiency
and transparency of the process.
Foreign Trade RegimeUpon membership of the EU in 2004, Poland agreed to adhere to
the same trade regulations, including the Community Customs
Code and Community Tariff. There are now no customs barri-
ers to trade with other EU countries, while trade with non-EU
countries is dictated by EU regulations. EU tariffs are generally
lower than previous Polish tariffs.
Poland adheres to the EU's Generalised System of Preferences.
Licensing regulations, which are the same as elsewhere in the EU,
restrict trade in some goods and with some non-EU countries.
Notably, EU import quotas apply to steel products and textiles
as well as some Chinese products, for example.
Trade in some agricultural products may also be restricted or
33Business Monitor International Ltd www.businessmonitor.com
BUSINESS ENVIRONMENT
TABLE: TOP EXPORT DESTINATIONS 2002 2003 2004 2005 2006 2007 2008 2009
EXPORTS TO FRANCE 2,473.30 3,277.10 4,454.30 5,547.90 6,906.30 8,548.00 10,617.10 9,494.10
EXPORTS TO ITALY 2,264.00 3,083.60 4,513.60 5,481.60 7,256.20 9,293.60 10,263.00 9,344.00
EXPORTS TO UNITED KINGDOM 2,126.30 2,698.70 3,986.50 4,990.40 6,337.50 8,339.10 9,837.10 8,790.80
EXPORTS TO CZECH REPUBLIC 1,639.90 2,171.80 3,188.50 4,072.10 6,144.30 7,777.30 9,730.60 8,013.10
EXPORTS TO NETHERLANDS 1,841.30 2,406.70 3,166.20 3,716.40 4,263.60 5,362.90 6,874.80 5,747.00
TOTAL 41,513.60 54,106.70 74,429.40 90,368.30 112,380.90 142,156.00 173,948.60 139,237.10
TOP 5 21,751.90 28,512.30 38,276.90 45,276.90 56,738.40 70,274.80 83,272.20 71,353.00
% from top 5 trade partners 52.4 52.7 51.4 50.1 50.5 49.4 47.9 51.2
Source: IMF, Direction of Trade Statistics.

subject to preferential tariffs under the EU's Common Agricul-
tural Policy. Among goods subject to quota limits are petrol,
diesel fuel and heating oils, alcohol and cigarettes. Imports of
strategic goods, including weapons and some chemical and
transport equipment require a licence or concession. A licence
is also needed for most alcoholic drinks, gas and some agricul-
tural products.
Tax RegimeThe tax regime became more benign for investors in the years
approaching the country's EU membership, and legislation has
been streamlined. Revisions of corporate, individual and VAT
regulations are under discussion in parliament, but implementa-
tion has been postponed.
Corporate Tax: The principal rate is 19%. Resident firms are
taxed on global income. Non-resident firms are taxed only on
income earned in Poland. Dividends to corporate and individual
shareholders are subject to a 19% withholding tax. Dividends
paid by a Polish firm to a firm in an EU member state are exempt
under certain circumstances. Dividends paid between elements
within a corporate group are also exempt. A tax credit regime
is in effect, unless tax treaties state otherwise.
Individual Tax: Rates increase progressively to a maximum of
32%. Individuals may be subject either to limited or unlimited
tax liability. Resident individuals are taxed on global income.
Non-resident individuals are taxed only on income earned in
Poland. An 18% tax applies to some income, such as dividends
and interest. An individual may elect to be taxed at a flat rate of
18% on business income in some circumstances.
Indirect Tax: Polish VAT regulations were generally harmo-
nised with EU directives on EU accession in May 2004. The
main rate is 23%. Poland permits VAT refunds based on rules
in EU directives.
Capital Gains: Gains of individuals and companies from disposal
of business assets are taxed as income. Gains by individuals from
share sales are taxed separately from income at 19%. Income of
an individual on the sale of a residence, other building or non-
business land is taxed at 10%. This income may be tax-exempt
if the proceeds are used to buy another similar asset within two
years, or the sale takes place five years after purchase.
Operational Risk
Security RiskAlthough crime remains a widespread problem in Poland, it
tends to be low-level and usually does not pose any serious
risk to life or property. General crime levels are moderate and
tend to centre around petty offences such as vandalism and car
thefts. For this reason, crime remains an inconvenience rather
than a serious threat to safety and is unlikely to affect the normal
operation of business.
As a member of the EU, Poland suffers from an underlying threat
of terrorism, although this is not as significant as in Western
Europe. However, owing to Poland's lack of prominence on the
world political stage and limited involvement in the global 'War
on Terror', it remains a low-risk country.
34 Business Monitor International Ltdwww.businessmonitor.com
POLAND Q4 2013
Pharmaceuticals
Executive Summary The Polish pharmaceutical market contracted severely in 2012
due to harsh pricing measures and strict margins imposed on
wholesalers, pharmaceutical manufacturers and retailers. Moreo-
ver, over the course of the year, the burden of pharmaceutical
spending shifted onto the Polish consumer, as the harsher
reimbursement regime caused a rise in private contributions to
prescription payments. We forecast a return to growth in 2013,
driven by demand for hospitals and private consumption growth
as the Polish government entrenches cuts to drug expenditure.
We expect strong growth in the medium-to-long term as Poland's
economy diversifies and aligns with developed countries. The
growth of private medical companies is a positive development
in the Polish healthcare market, and the introduction of volun-
tary health insurance could lead to the private sector playing a
greater role in healthcare provision.
Headline Expenditure Projections• Pharmaceuticals: PLN31.37bn (US$9.64bn) in 2012 to
PLN32.26bn (US$10.29bn) in 2013; 2.8% in local currency
terms and 6.7% in US dollar terms.
• Healthcare: PLN108.69bn (US$33.41bn) in 2012 to
PLN121.08bn (US$36.04bn) in 2013; +4.5% in local cur-
rency terms and 1.2% in US dollar terms.
Risk/Reward Rating: Poland has a RRR score of 61.5out of 100,
making it the second most attractive pharmaceutical market in
Central and Eastern Europe.
Key Trends And Developments
The National Health Fund (NFZ) will be decentralised in H113
with regional authorities taking a greater role in commissioning
healthcare services.
The health insurance market is scheduled to be liberalised with
services previously not covered by NFZ insurance. It will be
covered through additional voluntary health insurance. Private
health insurers will be able to compete with the NFZ for pre-
miums. In order to even up the market, tax breaks, allowances
and deductions will be introduced to encourage uptake.
The number of prescriptions receiving no subsidy at all from
the NFZ increased significantly in 2012. Private healthcare
spending in Poland is expected to continue rising in line with
incomes. The role of the private sector and the potential intro-
duction of voluntary health insurance as a supplement to the
NFZ suggest market dynamics will be driven increasingly by
private consumption, and government provisioning will retreat.
Consolidation within private healthcare will continue, as LuxMed
buys up MegaMed’s clinics. Privatisation of debt-laden hospitals
by municipalities will continue in 2013.
Owing to the margin limits imposed on reimbursable drugs, retail
pharmacy sales have dipped significantly, with many individual
pharmacy stores closing down. Pharmacy chains have been
able to weather the conditions well; they benefit from greater
discounts when buying wholesale.
BMI Economic View: Although we have revised down our
forecast for real GDP growth in 2012 from 2.5% to 2.3%, we
are above consensus for Polish growth in 2013, expecting an
expansion of 2.6%. Net exports and investment are likely to be
key drivers of this outturn.
BMI Political View: We broadly expect Poland's political risk
profile to improve over the course of our 10-year forecast horizon,
as the country assumes greater responsibility at the regional and
international level and the domestic political environment con-
tinues to mature. Our core scenario envisages Poland emerging
as a solid 'middle power' of Europe. A strong macroeconomic
outlook, coupled with greater maturity on the part of domestic
policymakers, will facilitate this general progression over the
years ahead.
Industry Forecast
Prescription Drugs: We believe better access to innovative prod-
35Business Monitor International Ltd www.businessmonitor.com
Chapter 5: Key Sectors
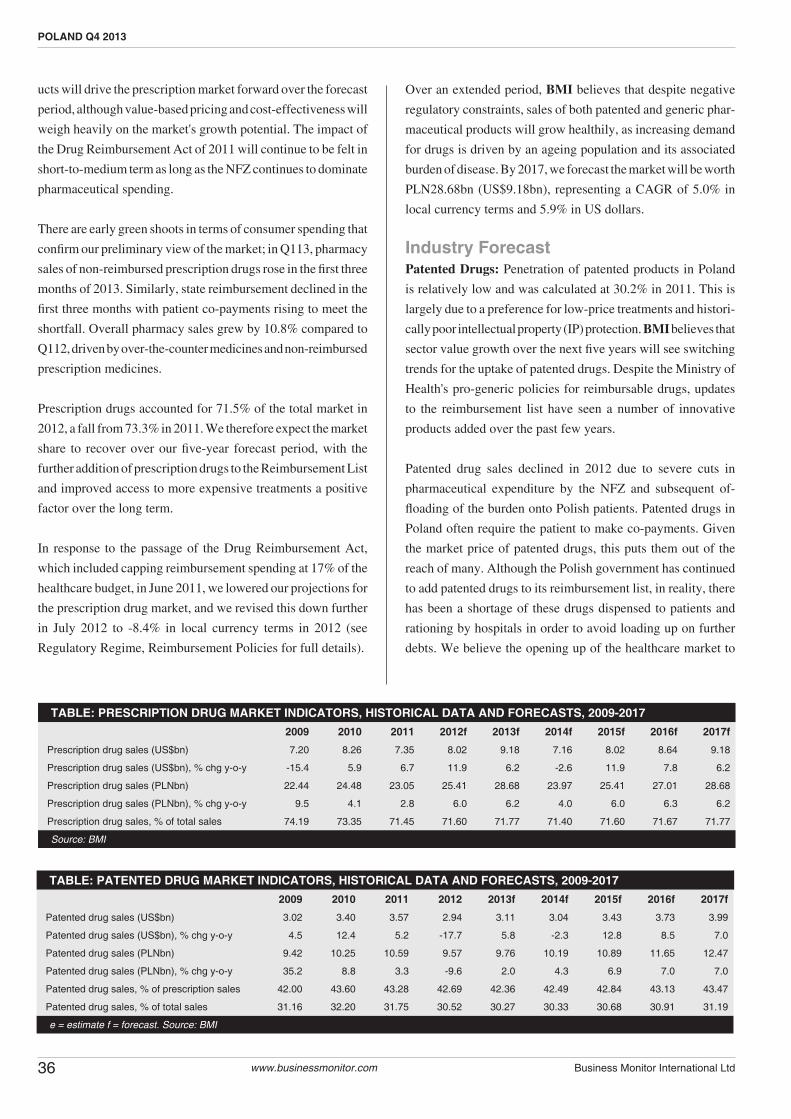
ucts will drive the prescription market forward over the forecast
period, although value-based pricing and cost-effectiveness will
weigh heavily on the market's growth potential. The impact of
the Drug Reimbursement Act of 2011 will continue to be felt in
short-to-medium term as long as the NFZ continues to dominate
pharmaceutical spending.
There are early green shoots in terms of consumer spending that
confirm our preliminary view of the market; in Q113, pharmacy
sales of non-reimbursed prescription drugs rose in the first three
months of 2013. Similarly, state reimbursement declined in the
first three months with patient co-payments rising to meet the
shortfall. Overall pharmacy sales grew by 10.8% compared to
Q112, driven by over-the-counter medicines and non-reimbursed
prescription medicines.
Prescription drugs accounted for 71.5% of the total market in
2012, a fall from 73.3% in 2011. We therefore expect the market
share to recover over our five-year forecast period, with the
further addition of prescription drugs to the Reimbursement List
and improved access to more expensive treatments a positive
factor over the long term.
In response to the passage of the Drug Reimbursement Act,
which included capping reimbursement spending at 17% of the
healthcare budget, in June 2011, we lowered our projections for
the prescription drug market, and we revised this down further
in July 2012 to -8.4% in local currency terms in 2012 (see
Regulatory Regime, Reimbursement Policies for full details).
Over an extended period, BMI believes that despite negative
regulatory constraints, sales of both patented and generic phar-
maceutical products will grow healthily, as increasing demand
for drugs is driven by an ageing population and its associated
burden of disease. By 2017, we forecast the market will be worth
PLN28.68bn (US$9.18bn), representing a CAGR of 5.0% in
local currency terms and 5.9% in US dollars.
Industry ForecastPatented Drugs: Penetration of patented products in Poland
is relatively low and was calculated at 30.2% in 2011. This is
largely due to a preference for low-price treatments and histori-
cally poor intellectual property (IP) protection. BMI believes that
sector value growth over the next five years will see switching
trends for the uptake of patented drugs. Despite the Ministry of
Health's pro-generic policies for reimbursable drugs, updates
to the reimbursement list have seen a number of innovative
products added over the past few years.
Patented drug sales declined in 2012 due to severe cuts in
pharmaceutical expenditure by the NFZ and subsequent of-
floading of the burden onto Polish patients. Patented drugs in
Poland often require the patient to make co-payments. Given
the market price of patented drugs, this puts them out of the
reach of many. Although the Polish government has continued
to add patented drugs to its reimbursement list, in reality, there
has been a shortage of these drugs dispensed to patients and
rationing by hospitals in order to avoid loading up on further
debts. We believe the opening up of the healthcare market to
36 Business Monitor International Ltdwww.businessmonitor.com
POLAND Q4 2013
TABLE: PRESCRIPTION DRUG MARKET INDICATORS, HISTORICAL DATA AND FORECASTS, 2009-2017 2009 2010 2011 2012f 2013f 2014f 2015f 2016f 2017f
Prescription drug sales (US$bn) 7.20 8.26 7.35 8.02 9.18 7.16 8.02 8.64 9.18
Prescription drug sales (US$bn), % chg y-o-y -15.4 5.9 6.7 11.9 6.2 -2.6 11.9 7.8 6.2
Prescription drug sales (PLNbn) 22.44 24.48 23.05 25.41 28.68 23.97 25.41 27.01 28.68
Prescription drug sales (PLNbn), % chg y-o-y 9.5 4.1 2.8 6.0 6.2 4.0 6.0 6.3 6.2
Prescription drug sales, % of total sales 74.19 73.35 71.45 71.60 71.77 71.40 71.60 71.67 71.77
Source: BMI
TABLE: PATENTED DRUG MARKET INDICATORS, HISTORICAL DATA AND FORECASTS, 2009-2017 2009 2010 2011 2012 2013f 2014f 2015f 2016f 2017f
Patented drug sales (US$bn) 3.02 3.40 3.57 2.94 3.11 3.04 3.43 3.73 3.99
Patented drug sales (US$bn), % chg y-o-y 4.5 12.4 5.2 -17.7 5.8 -2.3 12.8 8.5 7.0
Patented drug sales (PLNbn) 9.42 10.25 10.59 9.57 9.76 10.19 10.89 11.65 12.47
Patented drug sales (PLNbn), % chg y-o-y 35.2 8.8 3.3 -9.6 2.0 4.3 6.9 7.0 7.0
Patented drug sales, % of prescription sales 42.00 43.60 43.28 42.69 42.36 42.49 42.84 43.13 43.47
Patented drug sales, % of total sales 31.16 32.20 31.75 30.52 30.27 30.33 30.68 30.91 31.19
e = estimate f = forecast. Source: BMI

private payers and private health insurance should help accelerate
spending on patented drugs in the medium term, should plans
by the NFZ and Ministry of Health come to fruition.
In mid-November 2011, an updated reimbursement list came
out containing 279 new products, including 256 generic drugs
and 22 products of new active ingredients. The total list now
includes 3,491 medicinal items; 382 were removed at the request
of drugmakers. Drug removals are primarily driven by business
considerations, with pricing controls and margin ceilings making
production unprofitable.
Reimbursement levels were lowered for 1,055 items and raised
for 299 items, which was attributed to the outcome of price
negotiations and the addition of cheaper equivalents. The list
excluded 847 previously reimbursed medicines, evoking harsh
criticism from doctors and patient groups. The announcement of
changes to the reimbursement list almost created panic buying
in late 2011, as patients were concerned that they would have
to pay more for their medicines.
In late December 2011, the Ministry of Health made some
amendments to the list. It said these were last-minute corrections
of previous mistakes that left patients who suffer from certain
diseases with no subsidised medicines. Minister of Health Bartosz
Arlukowicz told the Sejm committee that he would not bend to
the protests, as Poland's medication market needed reforming. He
said: 'It's time to end the Wild West phase in medication policy.
The most important element in the process must be the patient.'
The final version of the list reintroduced some key medicines for
diabetics, painkillers for people suffering from cancer and those
with transplants or schizophrenia as well as asthmatic children.
It was published on the ministry's website on December 30 2011
and became binding the following day.
Placing downward pressure on the growth of the patented
drug market in the medium term will be the patent cliff, which
will see a number of high value products lose protection. The
strength of the domestic generic drug industry should see rapid
devaluation of patented product sales once IP protection is lost.
The adoption of more stringent health technology assessment
techniques in Poland will also serve to moderate the uptake of
patented drugs as products deemed too expensive for benefit
realised will go unsubsidised. As a result, through to 2017,
BMI forecasts a local currency CAGR of 5.4% for patented
products. Over a 10-year period, we project a higher CAGR of
6.0%, which is considerable in comparison to many developed
markets. However, given the relative lag between launching
patented drugs in Poland and in more developed markets in
Europe, this is not surprising.
Industry ForecastGeneric Drugs: In 2013, we expect generic drug sales to contract
to PLN13.28bn (US$4.24bn). BMI forecasts the sector to expand
to PLN16.22bn (US$5.19bn) by 2017. A local currency CAGR
for the generic market of 4.8% (+5.6% in US dollars) is forecast,
especially as we expect private consumption to drive demand
for generic drugs while the government moderates pharmaceuti-
cal spending and imposes additional price cuts. Furthermore,
as the backlog of novel drug approval requests is added to the
list, BMI expects the generic market share to decrease slightly
in the next few years, dropping to 40.8% in 2016.
Nevertheless, over the 10-year period, in the European market
a number of high-profile patents will expire, allowing generics
to pick up further market share. Poland currently has one of the
highest generic drug penetration rates in Europe; combining this
assumption with other market dynamics, we believe that over our
10-year forecast period, the proportion of the more expensive,
advanced patented pharmaceuticals will moderately increase
at the expense of the generic drug market, especially given the
government's reluctance to include expensive pharmaceuticals
on its reimbursement list.
The government's policy of stocking the reimbursement list
37Business Monitor International Ltd www.businessmonitor.com
POLITICAL OUTLOOK
TABLE: GENERICS DRUG MARKET INDICATORS, HISTORICAL DATA AND FORECASTS, 2009-2017 2009 2010 2011 2012f 2013f 2014f 2015f 2016f 2017f
Generic drug sales (US$bn) 4.17 4.40 4.68 3.95 4.24 4.12 4.58 4.92 5.19
Generic drug sales (US$bn), % chg y-o-y -25.7 5.3 6.5 -15.6 7.3 -2.8 11.2 7.3 5.6
Generic drug sales (PLNbn) 13.01 13.26 13.88 12.85 13.28 13.79 14.53 15.36 16.22
Generic drug sales (PLNbn), % chg y-o-y -3.8 1.9 4.7 -7.4 3.3 3.8 5.3 5.7 5.6
Generic drug sales, % of prescription sales
58.00 56.40 56.72 57.31 57.64 57.51 57.16 56.87 56.53
Generic drug sales, % of total sales 43.03 41.65 41.60 40.98 41.18 41.07 40.92 40.76 40.57
Source: European Generics Association (EGA), AESGP, IMS Health, BMI
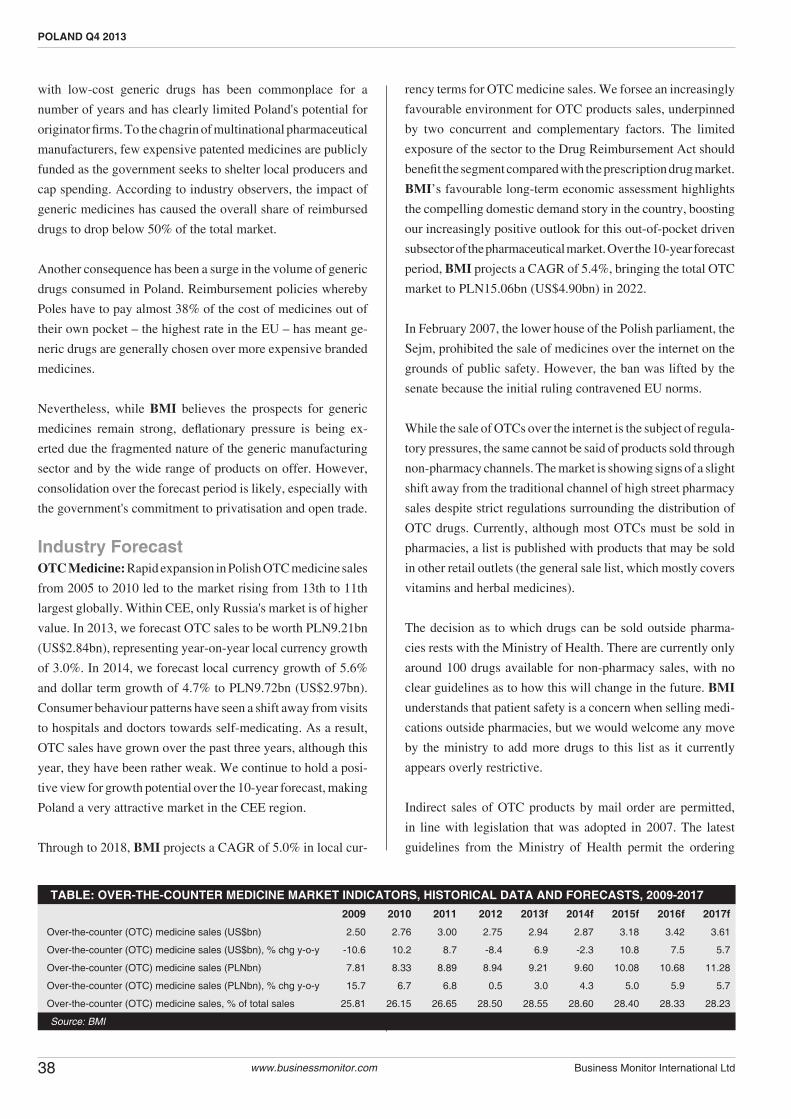
with low-cost generic drugs has been commonplace for a
number of years and has clearly limited Poland's potential for
originator firms. To the chagrin of multinational pharmaceutical
manufacturers, few expensive patented medicines are publicly
funded as the government seeks to shelter local producers and
cap spending. According to industry observers, the impact of
generic medicines has caused the overall share of reimbursed
drugs to drop below 50% of the total market.
Another consequence has been a surge in the volume of generic
drugs consumed in Poland. Reimbursement policies whereby
Poles have to pay almost 38% of the cost of medicines out of
their own pocket – the highest rate in the EU – has meant ge-
neric drugs are generally chosen over more expensive branded
medicines.
Nevertheless, while BMI believes the prospects for generic
medicines remain strong, deflationary pressure is being ex-
erted due the fragmented nature of the generic manufacturing
sector and by the wide range of products on offer. However,
consolidation over the forecast period is likely, especially with
the government's commitment to privatisation and open trade.
Industry ForecastOTC Medicine: Rapid expansion in Polish OTC medicine sales
from 2005 to 2010 led to the market rising from 13th to 11th
largest globally. Within CEE, only Russia's market is of higher
value. In 2013, we forecast OTC sales to be worth PLN9.21bn
(US$2.84bn), representing year-on-year local currency growth
of 3.0%. In 2014, we forecast local currency growth of 5.6%
and dollar term growth of 4.7% to PLN9.72bn (US$2.97bn).
Consumer behaviour patterns have seen a shift away from visits
to hospitals and doctors towards self-medicating. As a result,
OTC sales have grown over the past three years, although this
year, they have been rather weak. We continue to hold a posi-
tive view for growth potential over the 10-year forecast, making
Poland a very attractive market in the CEE region.
Through to 2018, BMI projects a CAGR of 5.0% in local cur-
rency terms for OTC medicine sales. We forsee an increasingly
favourable environment for OTC products sales, underpinned
by two concurrent and complementary factors. The limited
exposure of the sector to the Drug Reimbursement Act should
benefit the segment compared with the prescription drug market.
BMI’s favourable long-term economic assessment highlights
the compelling domestic demand story in the country, boosting
our increasingly positive outlook for this out-of-pocket driven
subsector of the pharmaceutical market. Over the 10-year forecast
period, BMI projects a CAGR of 5.4%, bringing the total OTC
market to PLN15.06bn (US$4.90bn) in 2022.
In February 2007, the lower house of the Polish parliament, the
Sejm, prohibited the sale of medicines over the internet on the
grounds of public safety. However, the ban was lifted by the
senate because the initial ruling contravened EU norms.
While the sale of OTCs over the internet is the subject of regula-
tory pressures, the same cannot be said of products sold through
non-pharmacy channels. The market is showing signs of a slight
shift away from the traditional channel of high street pharmacy
sales despite strict regulations surrounding the distribution of
OTC drugs. Currently, although most OTCs must be sold in
pharmacies, a list is published with products that may be sold
in other retail outlets (the general sale list, which mostly covers
vitamins and herbal medicines).
The decision as to which drugs can be sold outside pharma-
cies rests with the Ministry of Health. There are currently only
around 100 drugs available for non-pharmacy sales, with no
clear guidelines as to how this will change in the future. BMI
understands that patient safety is a concern when selling medi-
cations outside pharmacies, but we would welcome any move
by the ministry to add more drugs to this list as it currently
appears overly restrictive.
Indirect sales of OTC products by mail order are permitted,
in line with legislation that was adopted in 2007. The latest
guidelines from the Ministry of Health permit the ordering
38 Business Monitor International Ltdwww.businessmonitor.com
POLAND Q4 2013
TABLE: OVER-THE-COUNTER MEDICINE MARKET INDICATORS, HISTORICAL DATA AND FORECASTS, 2009-2017 2009 2010 2011 2012 2013f 2014f 2015f 2016f 2017f
Over-the-counter (OTC) medicine sales (US$bn) 2.50 2.76 3.00 2.75 2.94 2.87 3.18 3.42 3.61
Over-the-counter (OTC) medicine sales (US$bn), % chg y-o-y -10.6 10.2 8.7 -8.4 6.9 -2.3 10.8 7.5 5.7
Over-the-counter (OTC) medicine sales (PLNbn) 7.81 8.33 8.89 8.94 9.21 9.60 10.08 10.68 11.28
Over-the-counter (OTC) medicine sales (PLNbn), % chg y-o-y 15.7 6.7 6.8 0.5 3.0 4.3 5.0 5.9 5.7
Over-the-counter (OTC) medicine sales, % of total sales 25.81 26.15 26.65 28.50 28.55 28.60 28.40 28.33 28.23
Source: BMI
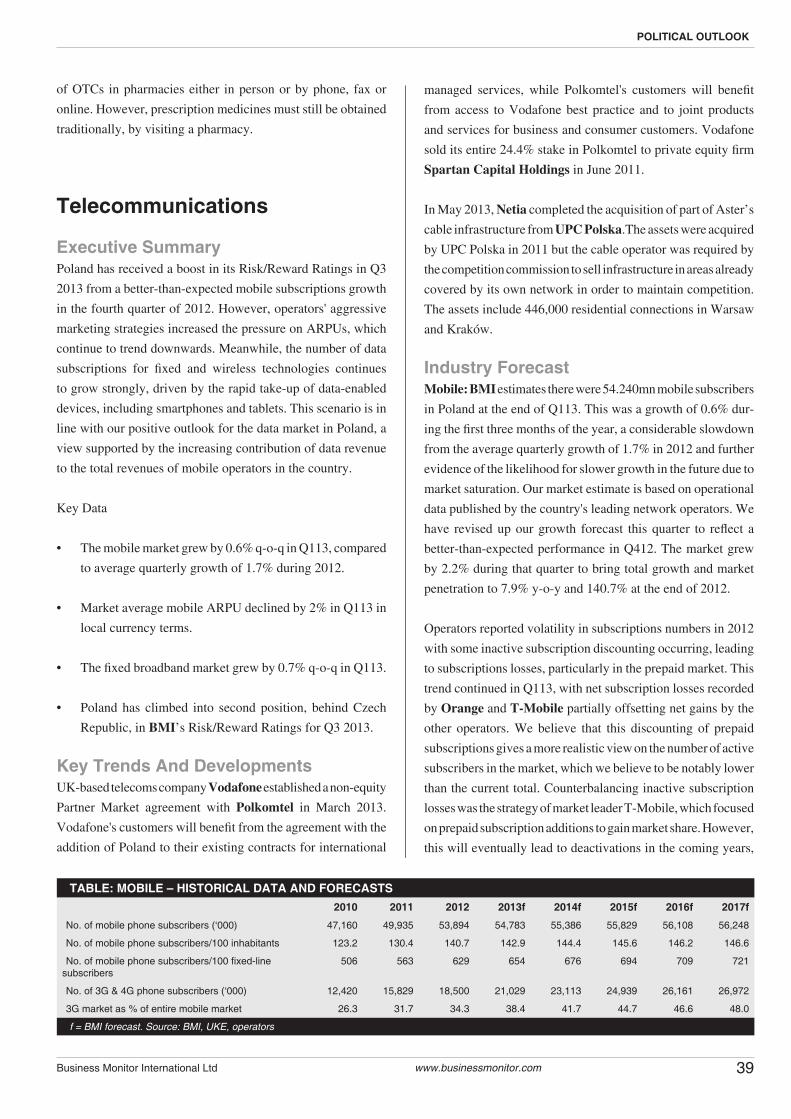
of OTCs in pharmacies either in person or by phone, fax or
online. However, prescription medicines must still be obtained
traditionally, by visiting a pharmacy.
Telecommunications
Executive Summary Poland has received a boost in its Risk/Reward Ratings in Q3
2013 from a better-than-expected mobile subscriptions growth
in the fourth quarter of 2012. However, operators' aggressive
marketing strategies increased the pressure on ARPUs, which
continue to trend downwards. Meanwhile, the number of data
subscriptions for fixed and wireless technologies continues
to grow strongly, driven by the rapid take-up of data-enabled
devices, including smartphones and tablets. This scenario is in
line with our positive outlook for the data market in Poland, a
view supported by the increasing contribution of data revenue
to the total revenues of mobile operators in the country.
Key Data
• The mobile market grew by 0.6% q-o-q in Q113, compared
to average quarterly growth of 1.7% during 2012.
• Market average mobile ARPU declined by 2% in Q113 in
local currency terms.
• The fixed broadband market grew by 0.7% q-o-q in Q113.
• Poland has climbed into second position, behind Czech
Republic, in BMI’s Risk/Reward Ratings for Q3 2013.
Key Trends And DevelopmentsUK-based telecoms company Vodafone established a non-equity
Partner Market agreement with Polkomtel in March 2013.
Vodafone's customers will benefit from the agreement with the
addition of Poland to their existing contracts for international
managed services, while Polkomtel's customers will benefit
from access to Vodafone best practice and to joint products
and services for business and consumer customers. Vodafone
sold its entire 24.4% stake in Polkomtel to private equity firm
Spartan Capital Holdings in June 2011.
In May 2013, Netia completed the acquisition of part of Aster’s
cable infrastructure from UPC Polska.The assets were acquired
by UPC Polska in 2011 but the cable operator was required by
the competition commission to sell infrastructure in areas already
covered by its own network in order to maintain competition.
The assets include 446,000 residential connections in Warsaw
and Kraków.
Industry ForecastMobile: BMI estimates there were 54.240mn mobile subscribers
in Poland at the end of Q113. This was a growth of 0.6% dur-
ing the first three months of the year, a considerable slowdown
from the average quarterly growth of 1.7% in 2012 and further
evidence of the likelihood for slower growth in the future due to
market saturation. Our market estimate is based on operational
data published by the country's leading network operators. We
have revised up our growth forecast this quarter to reflect a
better-than-expected performance in Q412. The market grew
by 2.2% during that quarter to bring total growth and market
penetration to 7.9% y-o-y and 140.7% at the end of 2012.
Operators reported volatility in subscriptions numbers in 2012
with some inactive subscription discounting occurring, leading
to subscriptions losses, particularly in the prepaid market. This
trend continued in Q113, with net subscription losses recorded
by Orange and T-Mobile partially offsetting net gains by the
other operators. We believe that this discounting of prepaid
subscriptions gives a more realistic view on the number of active
subscribers in the market, which we believe to be notably lower
than the current total. Counterbalancing inactive subscription
losses was the strategy of market leader T-Mobile, which focused
on prepaid subscription additions to gain market share. However,
this will eventually lead to deactivations in the coming years,
39Business Monitor International Ltd www.businessmonitor.com
POLITICAL OUTLOOK
TABLE: MOBILE – HISTORICAL DATA AND FORECASTS 2010 2011 2012 2013f 2014f 2015f 2016f 2017f
No. of mobile phone subscribers (‘000) 47,160 49,935 53,894 54,783 55,386 55,829 56,108 56,248
No. of mobile phone subscribers/100 inhabitants 123.2 130.4 140.7 142.9 144.4 145.6 146.2 146.6
No. of mobile phone subscribers/100 fixed-line subscribers
506 563 629 654 676 694 709 721
No. of 3G & 4G phone subscribers (‘000) 12,420 15,829 18,500 21,029 23,113 24,939 26,161 26,972
3G market as % of entire mobile market 26.3 31.7 34.3 38.4 41.7 44.7 46.6 48.0
f = BMI forecast. Source: BMI, UKE, operators
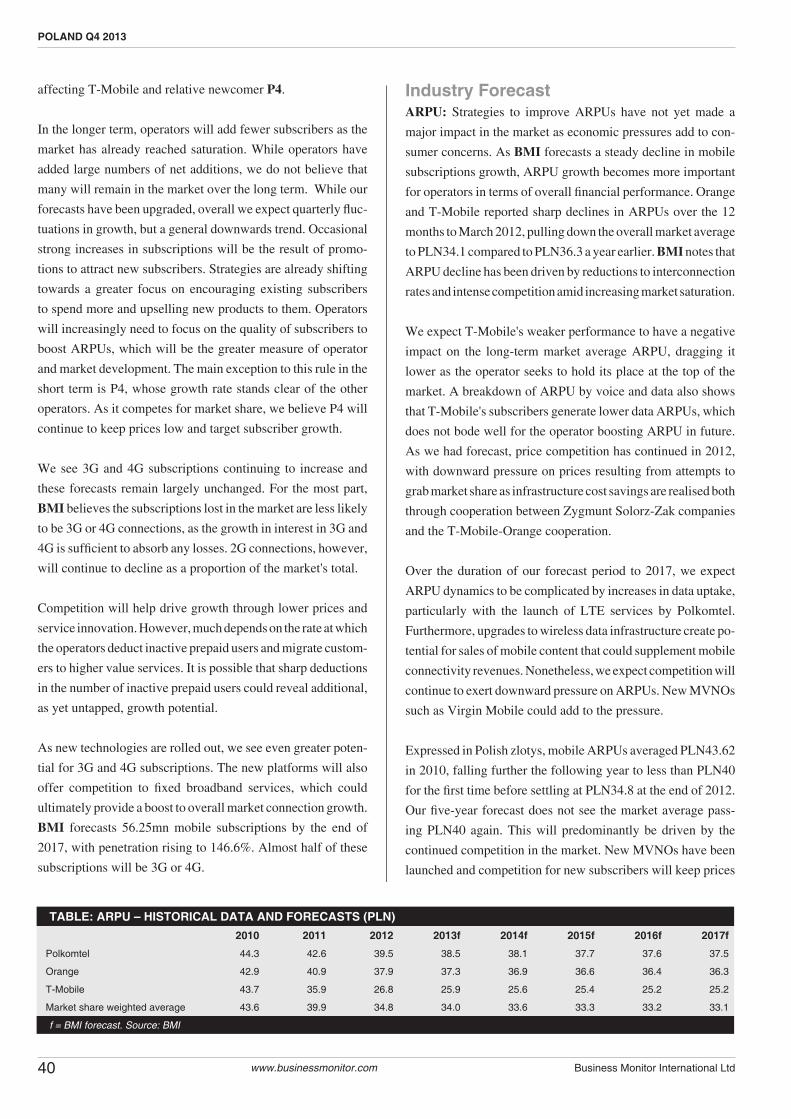
affecting T-Mobile and relative newcomer P4.
In the longer term, operators will add fewer subscribers as the
market has already reached saturation. While operators have
added large numbers of net additions, we do not believe that
many will remain in the market over the long term. While our
forecasts have been upgraded, overall we expect quarterly fluc-
tuations in growth, but a general downwards trend. Occasional
strong increases in subscriptions will be the result of promo-
tions to attract new subscribers. Strategies are already shifting
towards a greater focus on encouraging existing subscribers
to spend more and upselling new products to them. Operators
will increasingly need to focus on the quality of subscribers to
boost ARPUs, which will be the greater measure of operator
and market development. The main exception to this rule in the
short term is P4, whose growth rate stands clear of the other
operators. As it competes for market share, we believe P4 will
continue to keep prices low and target subscriber growth.
We see 3G and 4G subscriptions continuing to increase and
these forecasts remain largely unchanged. For the most part,
BMI believes the subscriptions lost in the market are less likely
to be 3G or 4G connections, as the growth in interest in 3G and
4G is sufficient to absorb any losses. 2G connections, however,
will continue to decline as a proportion of the market's total.
Competition will help drive growth through lower prices and
service innovation. However, much depends on the rate at which
the operators deduct inactive prepaid users and migrate custom-
ers to higher value services. It is possible that sharp deductions
in the number of inactive prepaid users could reveal additional,
as yet untapped, growth potential.
As new technologies are rolled out, we see even greater poten-
tial for 3G and 4G subscriptions. The new platforms will also
offer competition to fixed broadband services, which could
ultimately provide a boost to overall market connection growth.
BMI forecasts 56.25mn mobile subscriptions by the end of
2017, with penetration rising to 146.6%. Almost half of these
subscriptions will be 3G or 4G.
Industry ForecastARPU: Strategies to improve ARPUs have not yet made a
major impact in the market as economic pressures add to con-
sumer concerns. As BMI forecasts a steady decline in mobile
subscriptions growth, ARPU growth becomes more important
for operators in terms of overall financial performance. Orange
and T-Mobile reported sharp declines in ARPUs over the 12
months to March 2012, pulling down the overall market average
to PLN34.1 compared to PLN36.3 a year earlier. BMI notes that
ARPU decline has been driven by reductions to interconnection
rates and intense competition amid increasing market saturation.
We expect T-Mobile's weaker performance to have a negative
impact on the long-term market average ARPU, dragging it
lower as the operator seeks to hold its place at the top of the
market. A breakdown of ARPU by voice and data also shows
that T-Mobile's subscribers generate lower data ARPUs, which
does not bode well for the operator boosting ARPU in future.
As we had forecast, price competition has continued in 2012,
with downward pressure on prices resulting from attempts to
grab market share as infrastructure cost savings are realised both
through cooperation between Zygmunt Solorz-Zak companies
and the T-Mobile-Orange cooperation.
Over the duration of our forecast period to 2017, we expect
ARPU dynamics to be complicated by increases in data uptake,
particularly with the launch of LTE services by Polkomtel.
Furthermore, upgrades to wireless data infrastructure create po-
tential for sales of mobile content that could supplement mobile
connectivity revenues. Nonetheless, we expect competition will
continue to exert downward pressure on ARPUs. New MVNOs
such as Virgin Mobile could add to the pressure.
Expressed in Polish zlotys, mobile ARPUs averaged PLN43.62
in 2010, falling further the following year to less than PLN40
for the first time before settling at PLN34.8 at the end of 2012.
Our five-year forecast does not see the market average pass-
ing PLN40 again. This will predominantly be driven by the
continued competition in the market. New MVNOs have been
launched and competition for new subscribers will keep prices
40 Business Monitor International Ltdwww.businessmonitor.com
POLAND Q4 2013
TABLE: ARPU – HISTORICAL DATA AND FORECASTS (PLN) 2010 2011 2012 2013f 2014f 2015f 2016f 2017f
Polkomtel 44.3 42.6 39.5 38.5 38.1 37.7 37.6 37.5
Orange 42.9 40.9 37.9 37.3 36.9 36.6 36.4 36.3
T-Mobile 43.7 35.9 26.8 25.9 25.6 25.4 25.2 25.2
Market share weighted average 43.6 39.9 34.8 34.0 33.6 33.3 33.2 33.1
f = BMI forecast. Source: BMI
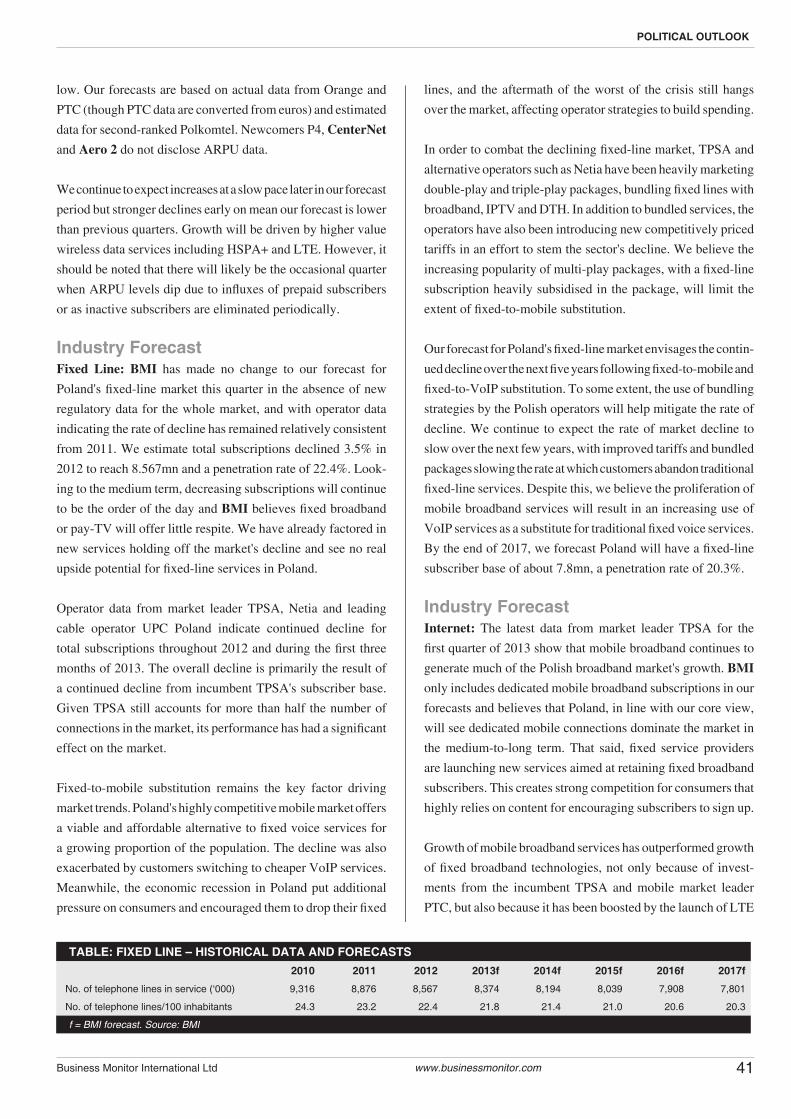
low. Our forecasts are based on actual data from Orange and
PTC (though PTC data are converted from euros) and estimated
data for second-ranked Polkomtel. Newcomers P4, CenterNet and Aero 2 do not disclose ARPU data.
We continue to expect increases at a slow pace later in our forecast
period but stronger declines early on mean our forecast is lower
than previous quarters. Growth will be driven by higher value
wireless data services including HSPA+ and LTE. However, it
should be noted that there will likely be the occasional quarter
when ARPU levels dip due to influxes of prepaid subscribers
or as inactive subscribers are eliminated periodically.
Industry ForecastFixed Line: BMI has made no change to our forecast for
Poland's fixed-line market this quarter in the absence of new
regulatory data for the whole market, and with operator data
indicating the rate of decline has remained relatively consistent
from 2011. We estimate total subscriptions declined 3.5% in
2012 to reach 8.567mn and a penetration rate of 22.4%. Look-
ing to the medium term, decreasing subscriptions will continue
to be the order of the day and BMI believes fixed broadband
or pay-TV will offer little respite. We have already factored in
new services holding off the market's decline and see no real
upside potential for fixed-line services in Poland.
Operator data from market leader TPSA, Netia and leading
cable operator UPC Poland indicate continued decline for
total subscriptions throughout 2012 and during the first three
months of 2013. The overall decline is primarily the result of
a continued decline from incumbent TPSA's subscriber base.
Given TPSA still accounts for more than half the number of
connections in the market, its performance has had a significant
effect on the market.
Fixed-to-mobile substitution remains the key factor driving
market trends. Poland's highly competitive mobile market offers
a viable and affordable alternative to fixed voice services for
a growing proportion of the population. The decline was also
exacerbated by customers switching to cheaper VoIP services.
Meanwhile, the economic recession in Poland put additional
pressure on consumers and encouraged them to drop their fixed
lines, and the aftermath of the worst of the crisis still hangs
over the market, affecting operator strategies to build spending.
In order to combat the declining fixed-line market, TPSA and
alternative operators such as Netia have been heavily marketing
double-play and triple-play packages, bundling fixed lines with
broadband, IPTV and DTH. In addition to bundled services, the
operators have also been introducing new competitively priced
tariffs in an effort to stem the sector's decline. We believe the
increasing popularity of multi-play packages, with a fixed-line
subscription heavily subsidised in the package, will limit the
extent of fixed-to-mobile substitution.
Our forecast for Poland's fixed-line market envisages the contin-
ued decline over the next five years following fixed-to-mobile and
fixed-to-VoIP substitution. To some extent, the use of bundling
strategies by the Polish operators will help mitigate the rate of
decline. We continue to expect the rate of market decline to
slow over the next few years, with improved tariffs and bundled
packages slowing the rate at which customers abandon traditional
fixed-line services. Despite this, we believe the proliferation of
mobile broadband services will result in an increasing use of
VoIP services as a substitute for traditional fixed voice services.
By the end of 2017, we forecast Poland will have a fixed-line
subscriber base of about 7.8mn, a penetration rate of 20.3%.
Industry ForecastInternet: The latest data from market leader TPSA for the
first quarter of 2013 show that mobile broadband continues to
generate much of the Polish broadband market's growth. BMI
only includes dedicated mobile broadband subscriptions in our
forecasts and believes that Poland, in line with our core view,
will see dedicated mobile connections dominate the market in
the medium-to-long term. That said, fixed service providers
are launching new services aimed at retaining fixed broadband
subscribers. This creates strong competition for consumers that
highly relies on content for encouraging subscribers to sign up.
Growth of mobile broadband services has outperformed growth
of fixed broadband technologies, not only because of invest-
ments from the incumbent TPSA and mobile market leader
PTC, but also because it has been boosted by the launch of LTE
41Business Monitor International Ltd www.businessmonitor.com
POLITICAL OUTLOOK
TABLE: FIXED LINE – HISTORICAL DATA AND FORECASTS 2010 2011 2012 2013f 2014f 2015f 2016f 2017f
No. of telephone lines in service (‘000) 9,316 8,876 8,567 8,374 8,194 8,039 7,908 7,801
No. of telephone lines/100 inhabitants 24.3 23.2 22.4 21.8 21.4 21.0 20.6 20.3
f = BMI forecast. Source: BMI
services by Cyfrowy Polsat in September 2011, and then later
by Polkomtel.We expect the advanced state of Poland's LTE
market to fuel growth in subscriptions above what was already
a fast-growing market with strong competition.
We continue to forecast that Poland's broadband market will be
driven by increased investment on the part of operators, includ-
ing networks upgrades and expansions. Although we expect
mobile broadband to record the fastest rates of growth, we also
expect fixed broadband to continue to grow and be subject to
ongoing investments. Such investments will ensure broadband
coverage is extended over a greater part of Poland's territory.
As the Polish economy strengthens, businesses and consumers
are expected to increase their spending on telecommunications
services such as broadband. Some of this new spending will be
used to upgrade to higher speed broadband services. Broadband
growth will also benefit from new regulatory initiatives, including
the use of wireless technologies to expand broadband coverage
in rural and underserved parts of the country.
Over the five years to 2017, we forecast that Poland's broadband
market will experience a 39% increase in subscriber numbers.
By the end of 2017, we expect the country's broadband penetra-
tion rate to rise to about 37.4% to reach 14.35mn subscribers.
Essentially, from this point on, the two key growth drivers will
be the proliferation of mobile and wireless broadband services
as well as growing use of multi-play convergence packages.
Meanwhile, looking at the number of internet users, we con-
tinue to believe that, over the next five years, internet usage
will continue to increase at a steady pace as network access is
expanded and as services become more accessible and afford-
able. The growing prevalence of mobile broadband services
will also fuel strong growth in the level of internet usage. By
the end of 2017, we believe Poland's internet user penetration
rate should climb to just over 70%. By this time, there will more
than 27.1mn internet users in the country.
42 Business Monitor International Ltdwww.businessmonitor.com
POLAND Q4 2013
TABLE: INTERNET – HISTORICAL DATA AND FORECASTS 2010 2011 2012 2013f 2014f 2015f 2016f 2017f
No. of internet users (‘000) 23,793 24,848 25,723 26,487 26,850 26,984 27,076 27,125
No. of internet users/100 inhabitants 62.2 64.9 67.1 69.1 70.0 70.4 70.6 70.7
No. of broadband internet subscribers (‘000) 8,304 10,064 11,163 12,164 12,925 13,558 14,039 14,348
No. of broadband internet subscribers/100 inhabitants 21.7 26.3 29.1 31.7 33.7 35.3 36.6 37.4
f = BMI forecast. Source: BMI, World Bank/International Telecommunication Union (ITU)
43Business Monitor International Ltd www.businessmonitor.com
KEY SECTORS
Other Key Sectors
Latest Forecast DataBelow are the latest forecast tables for our other core key sectors:
TABLE: POLAND OIL AND GAS SECTOR KEY INDICATORS2010 2011 2012e 2013f 2014f 2015f 2016f 2017f
Oil Proved Reserves, mn barrels 96 96 155 157 156 156 153 150
Oil Production, 000b/d 29 28 28 28 28 28 28 27
Oil Consumption, 000b/d 568 579 538 522 527 543 559 574
Oil Refinery Capacity, 000b/d 493 493 493 550 550 550 550 550
Oil Net Exports, 000b/d -540 -550 -510 -493 -499 -515 -531 -547
Oil Price, US$/bbl, OPEC Basket 77 108 110 103 101 100 99 97
Value of Net Oil Exports, US$bn (BMI base case) -15 -22 -20 -19 -18 -19 -19 -19
Value of Net Hydrocarbons Exports, US$bn (BMI base case) -20 -27 -27 -25 -24 -25 -25 -25
Value of Net Oil Exports at constant US$50/bbl–US$bn -10 -10 -9 -9 -9 -9 -10 -10
Value of Net Oil Exports at constant US$100/bbl–US$mn -20 -20 -19 -18 -18 -19 -19 -20
Value of Net Hydrocarbons Exports constant US$50/bbl–US$mn -13 -13 -12 -12 -12 -12 -13 -13
Value of Net Hydrocarbons Exports constant US$100/bbl–US$mn -25 -26 -24 -24 -24 -25 -26 -26
Total Net Hydrocarbons Exports, 000boe/d -730 -740 -706 -695 -706 -726 -743 -757
Gas Proved reserves, tcm 0 0 0 0 0 0 0 0
Gas Production, bcm 6 6 6 6 7 7 7 8
Gas Consumption, bcm 17 17 18 18 19 19 20 20
LNG Price, US$/mn btu 12 16 16 15 15 15 15 14
Reserves/Production Ratio 9 9 15 15 15 15 15 15
Source: National Statistics, Industry Sources, BMI
TABLE: PHARMA SECTOR KEY INDICATORS2010 2011 2012e 2013f 2014f 2015f 2016f 2017f
Pharmaceutical sales, US$bn 11 11 10 10 10 11 12 12
Pharmaceutical sales, US$bn, % chg y-o-y 6.6 -14.4 4.3 -3.7 11.2 7.8 6.1
Pharmaceutical sales, PLNbn 32 33 31 32 32 34 36 38
Pharmaceutical sales, PLNbn % change y-o-y 4.8 -6.0 1.3 2.0 5.4 6.2 6.1
Health expenditure, US$bn 33 35 33 35 33 37 40 43
Health expenditure, US$bn % change y-o-y 6.2 -3.4 4.3 -4.6 11.5 8.4 6.9
Health expenditure, PLNbn 98 103 109 110 111 118 126 134
Health expenditure, PLNbn % change y-o-y 4.4 6.0 1.3 1.1 5.7 6.8 6.9
Communicable, maternal, perinatal and nutritional condi-tions, DALY
160,843 156,628 152,476 148,389 144,366 140,407 136,512 132,681
Source: National Statistics, Industry Sources, BMI

44 Business Monitor International Ltdwww.businessmonitor.com
POLAND Q4 2013
TABLE: TELECOMS SECTOR KEY INDICATORS2011 2012e 2013f 2014f 2015f 2016f 2017f
Number of Main Telephone Lines in Service (‘000) 8,876 8,567 8,374 8,194 8,039 7,908 7,801
Number of Main Telephone Lines in Service, % change y-o-y -4.7 -3.5 -2.3 -2.2 -1.9 -1.6 -1.4
Number of Main Telephone Lines/100 Inhabitants 23 22 22 21 21 21 20
Number of Cellular Mobile Phone Subscribers (‘000) 49,935 53,894 54,783 55,386 55,829 56,108 56,248
Number of Cellular Mobile Phone Subscribers, % change y-o-y 5.9 7.9 1.6 1.1 0.8 0.5 0.2
Number of Mobile Phone Subscribers/100 Inhabitants 130 141 143 144 146 146 147
Number of Mobile Phone Subscribers/100 Inhabitants, % change y-o-y 5.8 7.9 1.6 1.1 0.8 0.5 0.2
Number of Internet Users (‘000) 24,848 25,730 26,494 26,857 26,991 27,083 27,132
Number of Internet Users, % change y-o-y 4.4 3.5 3.0 1.4 0.5 0.3 0.2
Number of Internet Users/100 Inhabitants 65 67 69 70 70 71 71
Number of Internet Users/100 Inhabitants, % change y-o-y 4.4 3.5 2.9 1.3 0.5 0.3 0.2
Number of Broadband Internet Subscribers (‘000) 10,064 11,163 12,164 12,925 13,558 14,039 14,348
Number of Broadband Internet Subscribers, % change y-o-y 21.2 10.9 9.0 6.3 4.9 3.6 2.2
Source: National Statistics, Industry Sources, BMI
TABLE: DEFENCE AND SECURITY SECTOR KEY INDICATORS2011 2012e 2013f 2014f 2015f 2016f 2017f
Defence expenditure, PLNmn 27,536 29,923 30,724 32,255 34,546 36,859 39,300
Defence expenditure, PLNmn % change y-o-y 7.1 8.7 2.7 5.0 7.1 6.7 6.6
Defence expenditure, % of GDP 2 2 2 2 2 2 2
Defence expenditure, PLN per capita of population 719 781 802 841 901 961 1,024
Defence expenditure, PLN per serviceman
Defence expenditure, US$mn, constant prices 10,731 10,250 10,678 10,258 11,288 11,881 12,312
Defence expenditure, US$mn, constant prices % change y-o-y 4.3 -4.5 4.2 -3.9 10.0 5.3 3.6
Defence expenditure, constant US$ per capita of population 280 267 279 268 294 310 321
Defence expenditure, constant US$ per serviceman
Source: National Statistics, Industry Sources, BMI
TABLE: INFRASTRUCTURE SECTOR KEY INDICATORS2010 2011 2012e 2013f 2014f 2015f 2016f 2017f
Construction industry value, PLNbn 101 111 105 104 110 117 124 132
Construction industry value, US$bn 33 37 32 33 33 37 40 42
Construction industry, real growth, % y-o-y 11.3 -13.5 2.8 -0.8 12.1 7.7 6.5
Construction industry value, % GDP 7 7 6 6 6 6 6 6
Source: National Statistics, Industry Sources, BMI

45Business Monitor International Ltd www.businessmonitor.com
KEY SECTORS
This report is abstracted from BMI’s industry report series, which covers 22 sectors across global markets. Every quarter, we will provide tables
showing the latest five-year forecasts for key industries as well as a forecast scenario for a key sector. If you would like to order a full report, or find
out about BMI’s other 1,113 industry reports, please contact [email protected]
TABLE: FOOD AND DRINK SECTOR KEY INDICATORS2010 2011 2012e 2013f 2014f 2015f 2016f 2017f
Food consumption, US$bn 55 60 56 59 61 65 71 75
Food consumption PLNbn 167 177 184 191 201 211 223 235
Food consumption, US$ per capita 1,442 1,558 1,463 1,534 1,599 1,694 1,860 1,962
Confectionery sales, US$mn 3,129 3,314 3,090 3,238 3,373 3,573 3,923 4,127
Confectionery sales, PLNmn 9,437 9,823 10,171 10,517 11,048 11,611 12,260 12,898
Alcoholic drinks sales, US$mn 7,878 8,669 8,252 8,704 9,046 9,624 10,555 11,140
Alcoholic drink sales, PLNmn 23,763 25,696 27,162 28,270 29,626 31,279 32,983 34,813
Soft drinks sales, US$mn 5,890 6,590 6,349 6,778 7,193 7,807 8,808 9,588
Soft drink sales, PLNmn 17,766 19,534 20,895 22,014 23,558 25,374 27,526 29,961
Total mass grocery retail sales, US$bn 24 26 25 27 29 32 36 39
Total mass grocery retail sales, PLNbn 72 78 84 89 96 104 112 121
Exports of food and drink, US$mn 10,873 12,684 11,974 12,491 13,546 15,030 16,678 18,491
Imports of food and drink, US$mn 8,511 9,785 9,064 9,359 10,070 11,162 12,283 13,189
Food and drink trade balance US$mn 2,362 2,899 2,910 3,132 3,476 3,868 4,395 5,302
Source: National Statistics, Industry Sources, BMI
TABLE: AUTOS SECTOR KEY INDICATORS2010 2011 2012e 2013f 2014f 2015f 2016f 2017f
Vehicle production, units 869,395 842,026 661,773 547,698 534,379 543,094 557,470 570,719
Passenger car production, units 785,000 740,200 548,100 438,480 418,301 418,100 422,845 426,089
Vehicle sales, units 366,575 338,764 329,878 324,055 332,468 347,316 350,985 355,623
Vehicle sales, units, % chg y-o-y -7.6 -2.6 -1.8 2.6 4.5 1.1 1.3
Passenger car sales, units 315,858 277,427 273,589 270,853 278,979 292,928 296,144 300,649
Passenger car sales, units, % chg y-o-y -12.2 -1.4 -1.0 3.0 5.0 1.1 1.5
Commercial vehicle sales, units 50,717 61,337 56,289 53,202 53,489 54,388 54,841 54,975
Commercial vehicle sales, units, % chg y-o-y 20.9 -8.2 -5.5 0.5 1.7 0.8 0.2
Passenger car density, cars per 1,000 of population 450 467 496 528 567 613 655 702
Source: National Statistics, Industry Sources, BMI
TABLE: FREIGHT KEY INDICATORS2011 2012 2013f 2014f 2015f 2016f 2017f
Port of Gdansk container throughput, TEU 685,643 928,905 1,285,605 1,511,357 1,722,253 1,901,559 2,091,721
Port of Gdansk container throughput, TEU, % y-o-y 33.95 35.48 38.40 17.56 13.95 10.41 10.00
Air Freight Tonnes (000) 68.37 70.76 72.44 76.14 82.80 88.98 95.39
Air Freight Tonnes % Change y-o-y 11.64 3.49 2.38 5.11 8.75 7.47 7.20
Rail Freight Tonnes (000) 248,606 230,878 221,297 226,125 234,822 242,894 251,259
Rail Freight Tonnes % Change y-o-y 14.69 -7.13 -4.15 2.18 3.85 3.44 3.44
Road Freight Tonnes (000) 1,322,237 1,336,474 1,339,949 1,374,922 1,413,420 1,451,582 1,495,129
Road Freight Tonnes % Change y-o-y 3.57 1.08 0.26 2.61 2.80 2.70 3.00
Source: BMI

47Business Monitor International Ltd www.businessmonitor.com
Chapter 6: BMI Global Assumptions
TABLE: GLOBAL ASSUMPTIONS2012e 2013f 2014f 2015f 2016f 2017f
Real GDP Growth (%)
US 2.2 1.8 2.7 2.6 2.4 2.4
Eurozone -0.6 -0.5 0.9 1.4 1.5 1.6
Japan 1.9 1.4 1.3 1.0 0.9 1.1
China 7.7 7.5 6.7 6.0 5.8 5.8
World 2.7 2.6 3.2 3.3 3.4 3.4
Consumer Inflation (ave)
US 2.1 2.1 2.1 2.1 2.1 2.1
Eurozone 2.6 1.8 1.8 1.7 1.8 1.9
Japan 0.0 0.0 0.6 1.3 1.8 2.3
China 2.7 2.8 2.9 2.8 2.7 2.7
World 3.4 3.2 3.2 3.1 3.2 3.2
Interest Rates (eop)
Fed Funds Rate 0.00 0.00 0.00 0.75 2.00 3.00
ECB Refinancing Rate 0.75 0.25 0.25 0.75 1.00 1.50
Japan Overnight Call Rate 0.10 0.10 0.10 0.10 0.25 0.50
Exchange Rates (ave)
US$/EUR 1.27 1.33 1.27 1.23 1.20 1.20
JPY/US$ 79.85 91.00 94.00 97.00 98.50 100.50
CNY/US$ 6.31 6.20 6.28 6.35 6.45 6.55
Oil Prices (ave)
OPEC Basket (US$/bbl) 109.5 103.0 101.0 100.0 99.0 97.0
Brent Crude (US$/bbl) 111.7 106.0 103.0 102.0 101.0 99.0
e/f = estimate/forecast. Source: BMI
Global Outlook
Risks Mounting For Emerging MarketsOur global real GDP growth estimates for 2013 have been revised
down to 2.6% from 2.7% since our last Global Assumptions
update, with our 2014 forecast remaining at 3.2%.
Our growth forecasts for developed states reflect our expecta-
tions for an improvement in economic activity in the US and,
less substantially, the eurozone, between 2013 and 2014 (on
aggregate, we forecast an improvement in growth to 1.9% next
year, from 1.1% in 2013). While our core forecasts show an
improvement in growth in emerging markets from 2013 to 2014
(from 4.6% to 4.9%), the risks are firmly to the downside, and in
general, our projections remain below consensus. Since our last
Global Assumptions update, we have downgraded our outlooks
for emerging European and Latin American growth for 2013
and 2014, and are assessing incoming data in order to determine
whether further downgrades are warranted.
The current political turmoil and economic difficulties in emerging
markets (EMs) is a result of both external and internal risks that
we have been flagging for some time now, including a slowdown
in China as well as the prospect of monetary policy normalising
in the US. Moreover, many EMs have also seen a deterioration
in their macroeconomic and political risk profiles as a slowdown
in growth has exacerbated social tensions. The bigger picture is
that the decade of near-perfect conditions for EM growth – with
interest rates and inflation coming down, undervalued currencies,
improving external and fiscal accounts, rising commodity prices,
and labour market convergence – is over. We continue to expect
the more vulnerable EM economies to struggle to adjust to this
48 Business Monitor International Ltdwww.businessmonitor.com
POLAND Q4 2013
TABLE: DEVELOPED STATES, REAL GDP GROWTH, %2012e 2013f 2014f 2015f
Developed States Aggregate Growth 1.2 1.1 1.9 2.0
G7 1.4 1.2 2.0 2.0
Eurozone -0.6 -0.5 0.9 1.4
EU-27 -0.4 -0.1 1.2 1.6
Selected Developed States
Australia 3.7 2.1 1.8 2.5
Austria 0.8 0.8 1.5 1.9
Belgium -0.3 0.4 1.6 1.9
Canada 1.7 1.7 2.4 2.4
Denmark -0.5 0.6 1.3 1.6
Finland -0.2 0.1 1.6 2.0
France 0.1 -0.3 0.5 1.3
Germany 0.7 0.5 1.9 1.6
Ireland 0.2 0.8 2.1 2.3
Italy -2.4 -1.5 0.1 0.7
Japan 1.9 1.4 1.3 1.0
Netherlands -1.1 -0.6 1.1 1.5
Norway 3.1 2.5 2.5 2.7
Portugal -4.7 -3.0 -2.0 0.9
Spain -1.3 -1.7 0.2 0.9
Sweden 0.7 1.5 2.5 2.7
Switzerland 1.0 1.9 2.0 1.4
UK 0.0 1.1 1.4 2.0
US 2.2 1.8 2.7 2.6
e/f = estimate/forecast. Source: BMI
TABLE: BMI VERSUS BLOOMBERG CONSENSUS REAL GDP GROWTH FORECASTS, %US Eurozone Japan Brazil China Russia India
2013 Bloomberg Consensus 1.8 -0.1 1.8 2.5 7.6 2.8 5.7
BMI 1.8 -0.5 1.4 2.6 7.5 2.6 5.5
2014 Bloomberg Consensus 2.7 1.0 1.4 3.2 7.6 3.4 5.7
BMI 2.7 0.9 1.3 3.0 6.7 3.9 6.0
Source: BMI, Bloomberg
new reality over the coming years.
Developed StatesOur developed state aggregate growth projection for 2013 has
been revised down to 1.1% from 1.2%, while it remains 1.9%
for 2014.
US growth looks to have slowed in the first half of 2013, and
we have revised down our real GDP growth forecast for the
year as a whole to 1.8% from 2.1%. However, we still believe
that the US economy should pick up strength in the second half
of the year and into 2014, as the fiscal drag subsides. We have
lowered our eurozone growth forecast for 2014 marginally, to
0.9% from 1.0% previously.
Emerging MarketsWe estimate EM real GDP aggregate growth of 4.6% in 2013,
representing a slight downgrade from our previous 4.7% projec-
tion, with a slight acceleration in growth in 2014 to 4.9% (down
from our previous 5.1% estimate).
In China, the 7.5% y-o-y real GDP growth figure for Q213, re-
leased on July 15, has confirmed that the first quarter upswing in
mainland economic activity was only temporary. With Chinese
growth projected to slow in 2014 to 6.7% (below the consensus
projection of 7.6%), the rest of the emerging market universe is
also going to get hit. This is particularly the case for countries
elsewhere in emerging Asia (we are forecasting a slowdown in
emerging Asia aggregate growth to 5.8% in 2014 from 6.2% in
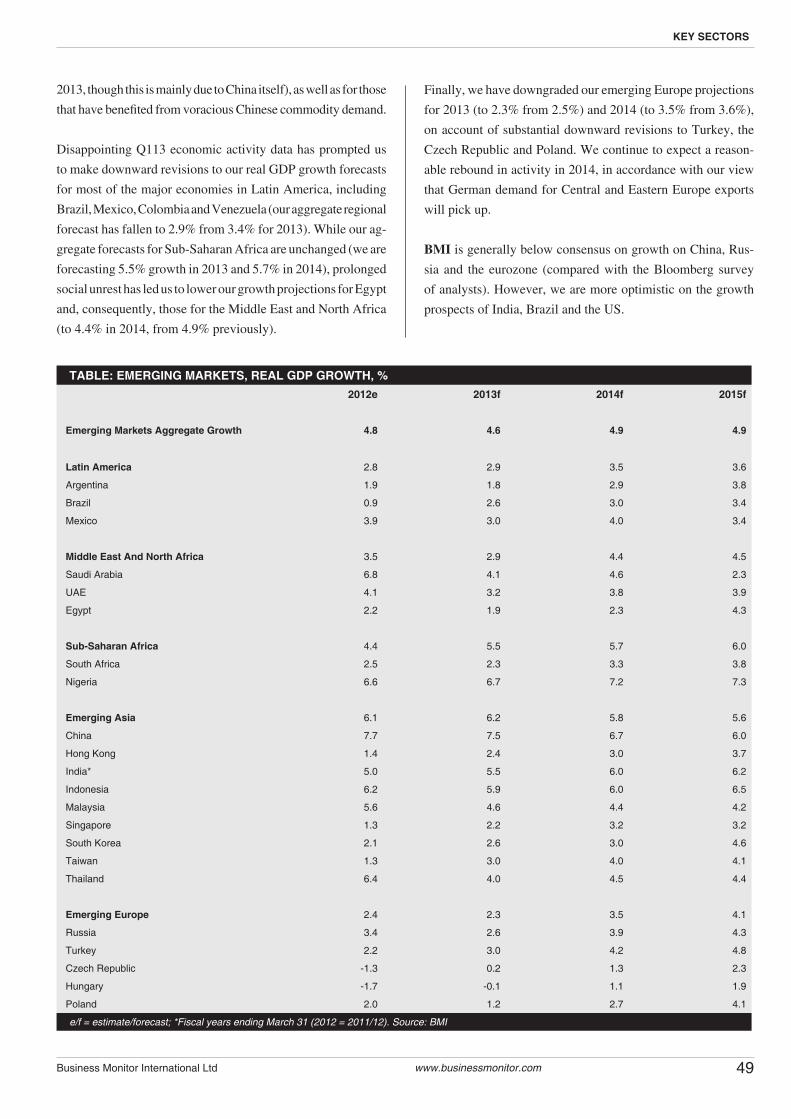
49Business Monitor International Ltd www.businessmonitor.com
KEY SECTORS
TABLE: EMERGING MARKETS, REAL GDP GROWTH, %2012e 2013f 2014f 2015f
Emerging Markets Aggregate Growth 4.8 4.6 4.9 4.9
Latin America 2.8 2.9 3.5 3.6
Argentina 1.9 1.8 2.9 3.8
Brazil 0.9 2.6 3.0 3.4
Mexico 3.9 3.0 4.0 3.4
Middle East And North Africa 3.5 2.9 4.4 4.5
Saudi Arabia 6.8 4.1 4.6 2.3
UAE 4.1 3.2 3.8 3.9
Egypt 2.2 1.9 2.3 4.3
Sub-Saharan Africa 4.4 5.5 5.7 6.0
South Africa 2.5 2.3 3.3 3.8
Nigeria 6.6 6.7 7.2 7.3
Emerging Asia 6.1 6.2 5.8 5.6
China 7.7 7.5 6.7 6.0
Hong Kong 1.4 2.4 3.0 3.7
India* 5.0 5.5 6.0 6.2
Indonesia 6.2 5.9 6.0 6.5
Malaysia 5.6 4.6 4.4 4.2
Singapore 1.3 2.2 3.2 3.2
South Korea 2.1 2.6 3.0 4.6
Taiwan 1.3 3.0 4.0 4.1
Thailand 6.4 4.0 4.5 4.4
Emerging Europe 2.4 2.3 3.5 4.1
Russia 3.4 2.6 3.9 4.3
Turkey 2.2 3.0 4.2 4.8
Czech Republic -1.3 0.2 1.3 2.3
Hungary -1.7 -0.1 1.1 1.9
Poland 2.0 1.2 2.7 4.1
e/f = estimate/forecast; *Fiscal years ending March 31 (2012 = 2011/12). Source: BMI
2013, though this is mainly due to China itself), as well as for those
that have benefited from voracious Chinese commodity demand.
Disappointing Q113 economic activity data has prompted us
to make downward revisions to our real GDP growth forecasts
for most of the major economies in Latin America, including
Brazil, Mexico, Colombia and Venezuela (our aggregate regional
forecast has fallen to 2.9% from 3.4% for 2013). While our ag-
gregate forecasts for Sub-Saharan Africa are unchanged (we are
forecasting 5.5% growth in 2013 and 5.7% in 2014), prolonged
social unrest has led us to lower our growth projections for Egypt
and, consequently, those for the Middle East and North Africa
(to 4.4% in 2014, from 4.9% previously).
Finally, we have downgraded our emerging Europe projections
for 2013 (to 2.3% from 2.5%) and 2014 (to 3.5% from 3.6%),
on account of substantial downward revisions to Turkey, the
Czech Republic and Poland. We continue to expect a reason-
able rebound in activity in 2014, in accordance with our view
that German demand for Central and Eastern Europe exports
will pick up.
BMI is generally below consensus on growth on China, Rus-
sia and the eurozone (compared with the Bloomberg survey
of analysts). However, we are more optimistic on the growth
prospects of India, Brazil and the US.

Copyright of Poland Business Forecast Report is the property of Business MonitorInternational and its content may not be copied or emailed to multiple sites or posted to alistserv without the copyright holder's express written permission. However, users may print,download, or email articles for individual use.