polar power corporate presentation - s21.q4cdn.com · investor presentation all photos in this...
TRANSCRIPT
1
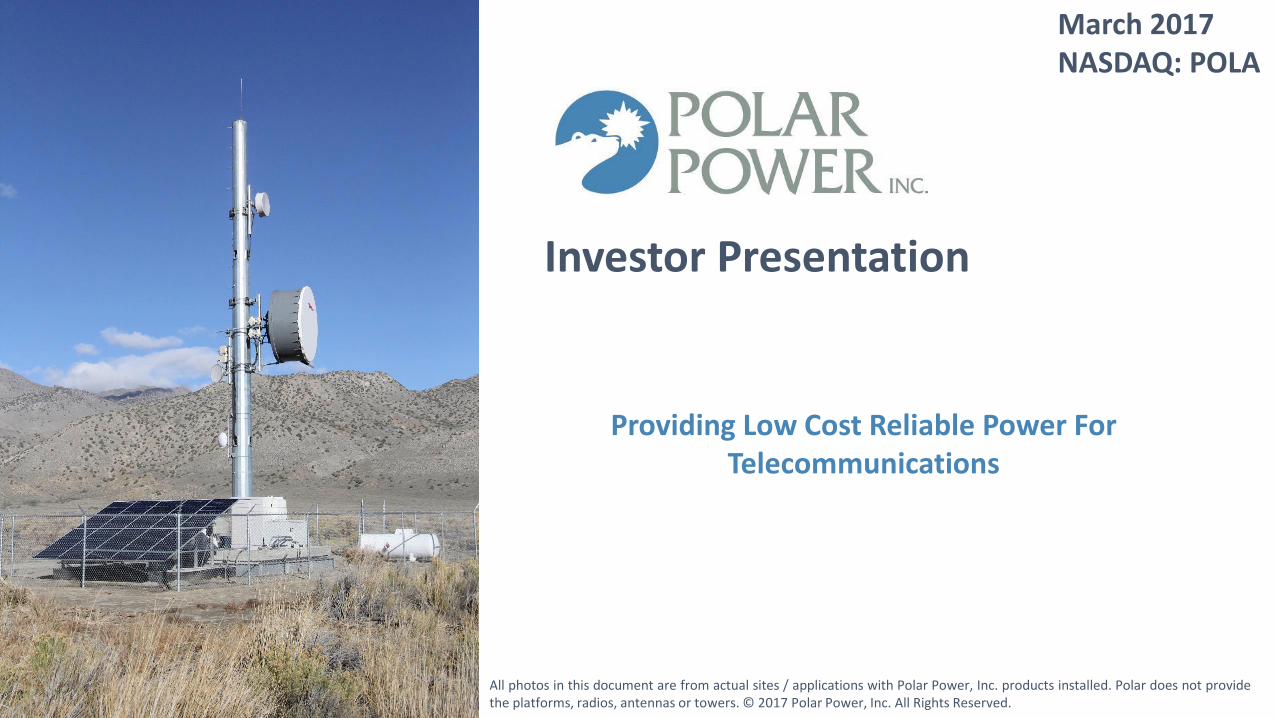
Investor Presentation
All photos in this document are from actual sites / applications with Polar Power, Inc. products installed. Polar does not providethe platforms, radios, antennas or towers. © 2017 Polar Power, Inc. All Rights Reserved.
Providing Low Cost Reliable Power For Telecommunications
March 2017NASDAQ: POLA
2
The following discussion, in addition to the other information contained in this presentation, should be considered carefully inevaluating our prospects. This presentation (including without limitation the following factors that may affect operating results)contains forward-looking statements regarding us and our business, financial condition, results of operations and prospects. Wordssuch as "expects," "anticipates," "intends," "plans," "believes," "seeks," "estimates" and similar expressions or variations of suchwords are intended to identify forward-looking statements, but are not the exclusive means of identifying forward-lookingstatements in this presentation. Additionally, statements concerning future matters such as revenue projections, projectedprofitability, growth strategies, and other statements regarding matters that are not historical are forward-looking statements.
Forward-looking statements in this presentation reflect the good faith judgment of our management and the statements are basedon facts and factors as we currently know them. Forward-looking statements are subject to risks and uncertainties and actualresults and outcomes may differ materially from the results and outcomes discussed in the forward-looking statements. Factorsthat could cause or contribute to such differences in results and outcomes include, but are not limited to, those discussed in thispresentation. Readers are urged not to place undue reliance on these forward-looking statements which speak only as of the dateof this presentation. We undertake no obligation to revise or update any forward-looking statements in order to reflect any eventor circumstance that may arise after the date of this presentation.
This presentation shall not constitute an offer to sell or the solicitation of an offer to sell or the solicitation of an offer to buy anysecurities of the Company nor shall there be any sale of securities in any jurisdiction in which such offer, solicitation or sale wouldbe unlawful prior to registration or qualification under the securities laws of any such jurisdiction.
© 2017 Polar Power, Inc. All Rights Reserved.
2
SAFE HARBOR
3
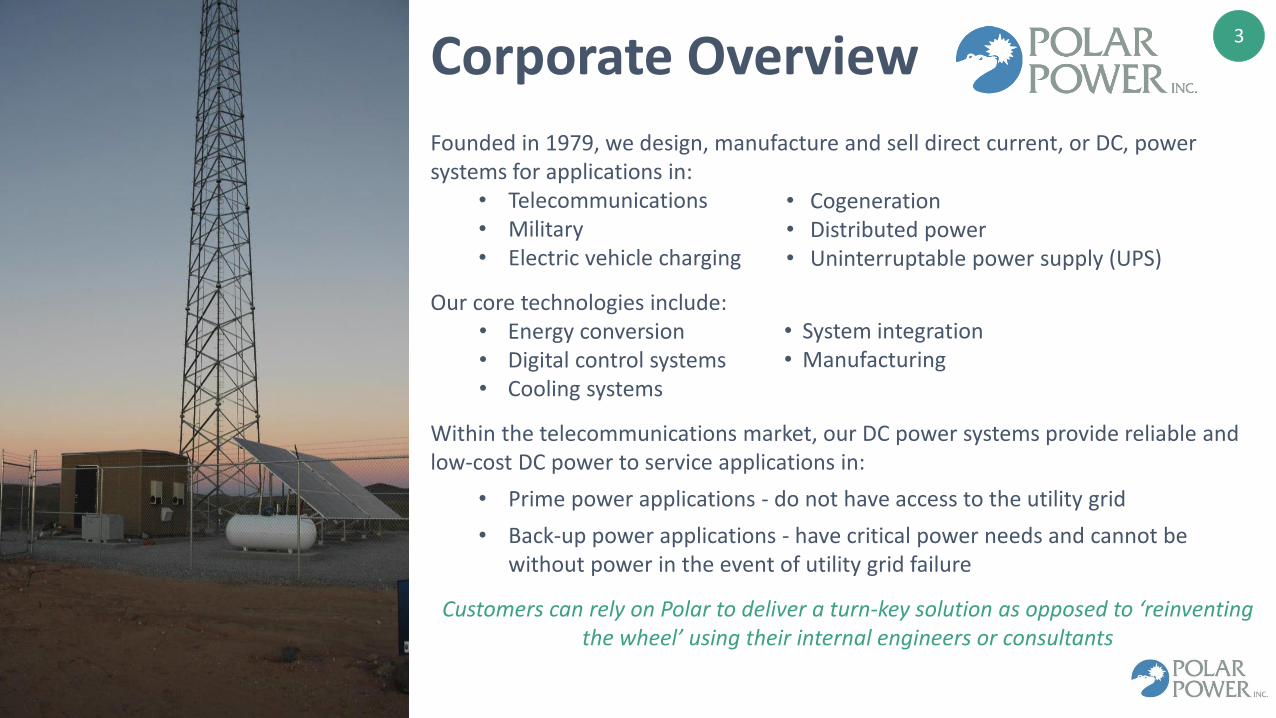
Corporate Overview
Founded in 1979, we design, manufacture and sell direct current, or DC, power systems for applications in:
• Telecommunications• Military• Electric vehicle charging
Our core technologies include: • Energy conversion• Digital control systems• Cooling systems
Within the telecommunications market, our DC power systems provide reliable and low-cost DC power to service applications in:
• Prime power applications - do not have access to the utility grid
• Back-up power applications - have critical power needs and cannot be without power in the event of utility grid failure
Customers can rely on Polar to deliver a turn-key solution as opposed to ‘reinventing the wheel’ using their internal engineers or consultants
• Cogeneration• Distributed power• Uninterruptable power supply (UPS)
• System integration• Manufacturing

4
Investment Highlights
Broad Market Opportunities In Telecommunications, Distributed Power, Cogeneration, Military, Electric Vehicle Charging & Uninterruptible Power Supply (UPS)
• Multi-billion dollar opportunity with multiple applications within multiple markets
• Top-tier customer base including Verizon, AT&T and Telstra
• Direct sales / relationships with customers
Strong Technology History & Brand Recognition With Proprietary DC Power System Technologies
• Leadership in energy conversion, power generation, energy storage and digital controls
• Our DC power systems are smaller, lighter, and more efficient than many AC power systems
• Integrated controls with remote monitoring and control
• Manufacturing expertise enables us to provide a turnkey, fully integrated system
Track Record Of Growth and Profitability
• Funded a decade of growth with free cash flow generated by operations
• Proceeds from recent public offering will support greater penetration of existing customers and broader outreach to new customers and end markets
5
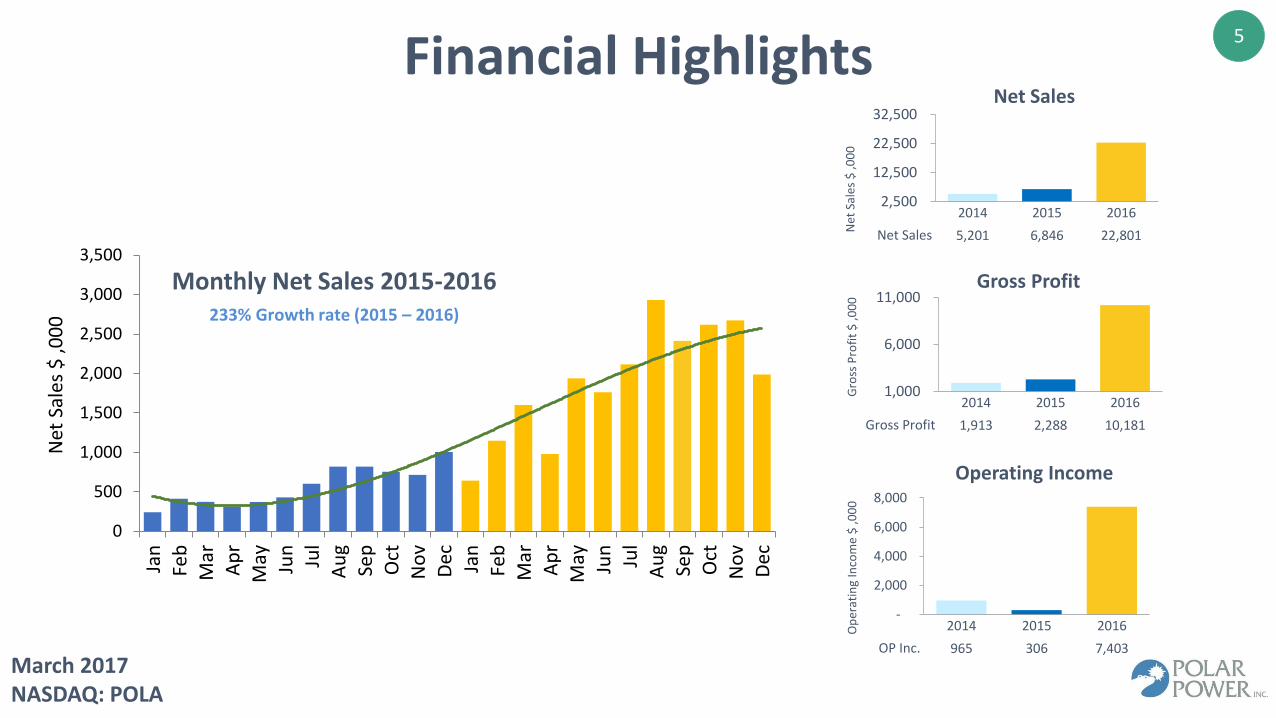
2,500
12,500
22,500
32,500
2014 2015 2016
Net Sales 5,201 6,846 22,801
1,000
6,000
11,000
2014 2015 2016
Gross Profit 1,913 2,288 10,181
-
2,000
4,000
6,000
8,000
2014 2015 2016
OP Inc. 965 306 7,403
Net
Sal
es $
,00
0G
ross
Pro
fit
$ ,0
00
Op
erat
ing
Inco
me
$ ,0
00
Financial HighlightsNet Sales
Operating Income
Gross Profit
March 2017NASDAQ: POLA
0
500
1,000
1,500
2,000
2,500
3,000
3,500
Jan
Feb
Mar
Ap
rM
ay Jun
Jul
Au
gSe
pO
ctN
ov
Dec Jan
Feb
Mar
Ap
rM
ay Jun
Jul
Au
gSe
pO
ctN
ov
Dec
Net
Sal
es $
,00
0 233% Growth rate (2015 – 2016)
Monthly Net Sales 2015-2016
6
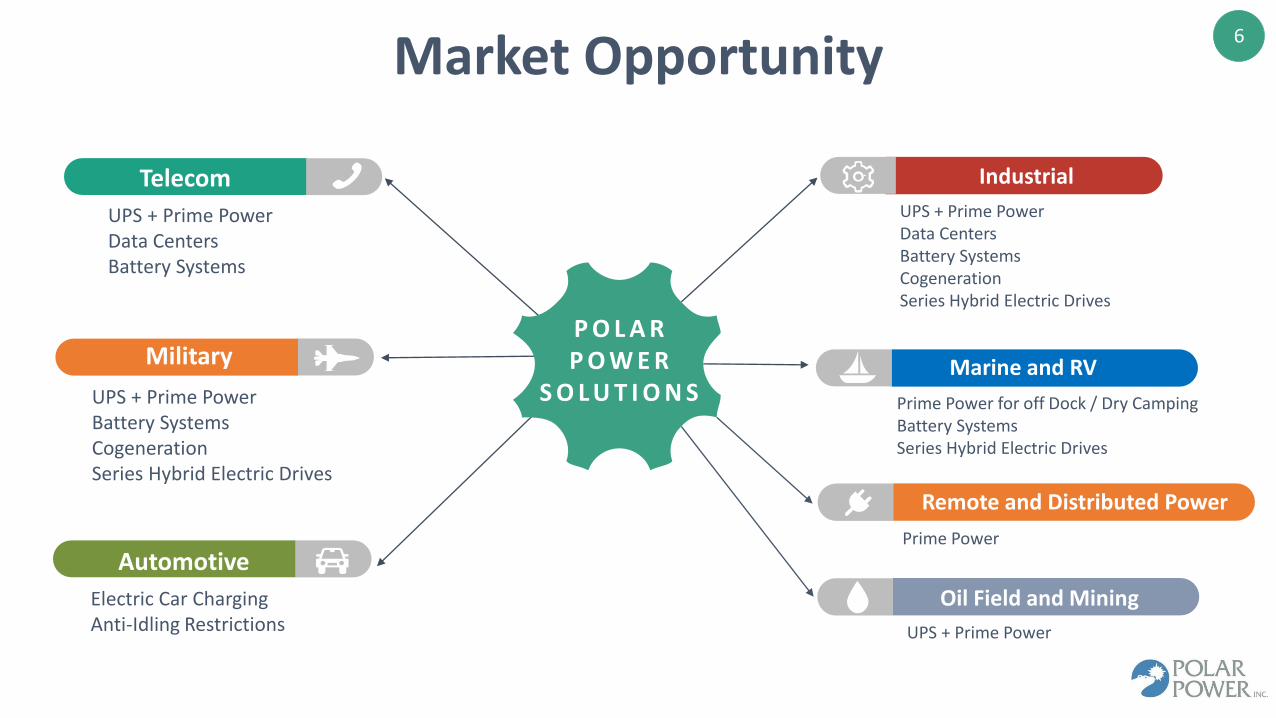
Market Opportunity
.Telecom
Military
Automotive
Industrial
Marine and RV
Remote and Distributed Power
P O L A RP O W E R
S O L U T I O N S
Oil Field and Mining
UPS + Prime PowerData CentersBattery Systems
UPS + Prime PowerBattery SystemsCogenerationSeries Hybrid Electric Drives
UPS + Prime PowerData CentersBattery SystemsCogenerationSeries Hybrid Electric Drives
Electric Car ChargingAnti-Idling Restrictions
Prime Power for off Dock / Dry CampingBattery SystemsSeries Hybrid Electric Drives
Prime Power
UPS + Prime Power
7
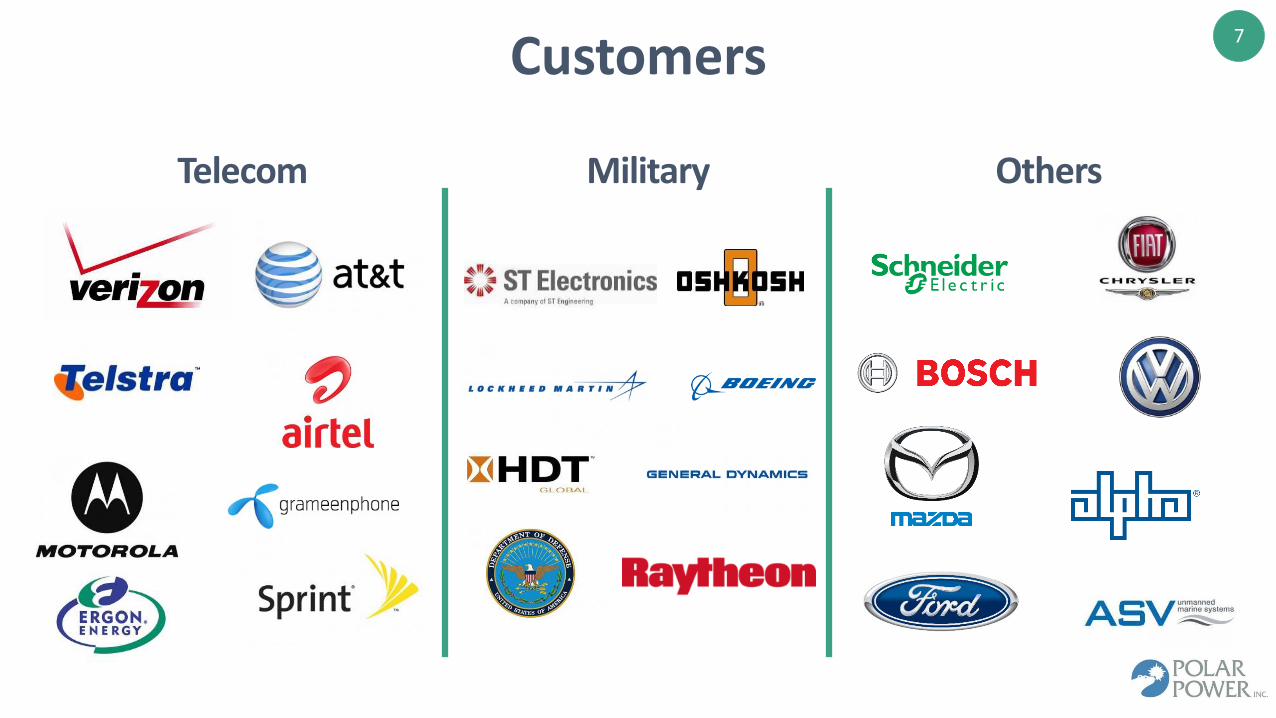
Customers
Telecom Military Others
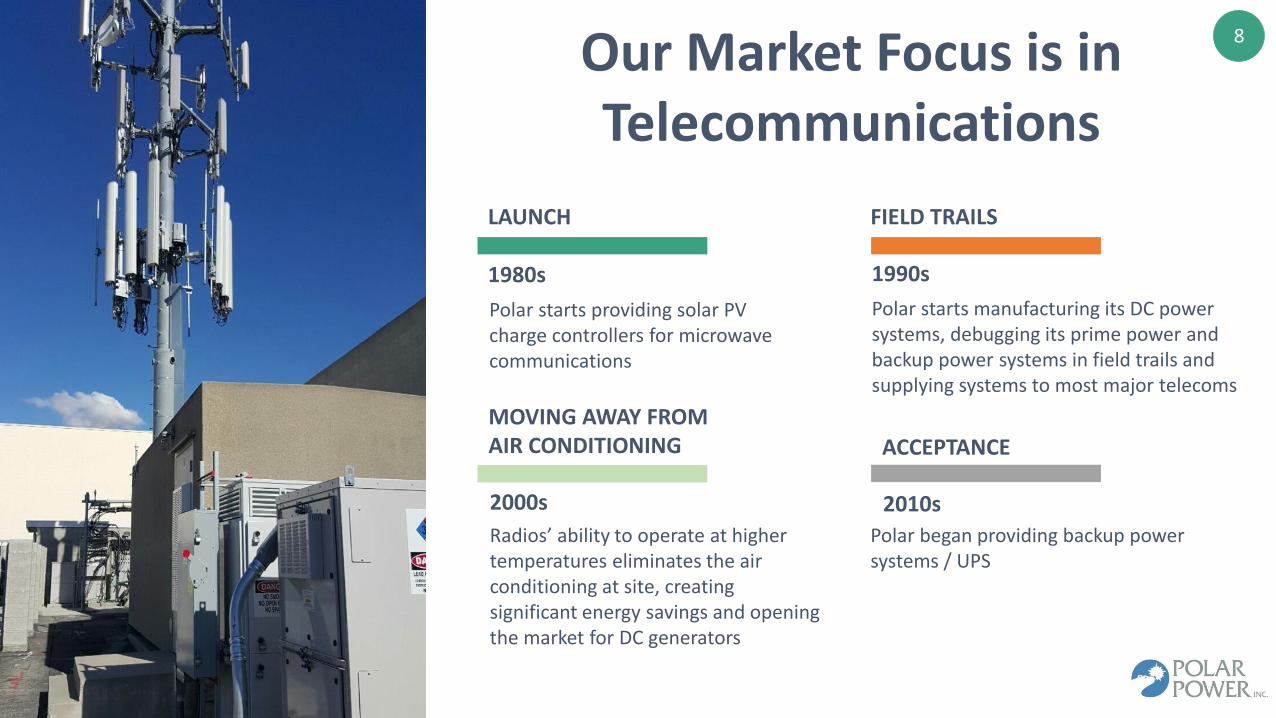
8Our Market Focus is in Telecommunications
1980s
LAUNCH
1990s
FIELD TRAILS
2010s
ACCEPTANCE
Polar began providing backup power systems / UPS
Polar starts providing solar PV charge controllers for microwave communications
Polar starts manufacturing its DC power systems, debugging its prime power and backup power systems in field trails and supplying systems to most major telecoms
2000s
MOVING AWAY FROM AIR CONDITIONING
Radios’ ability to operate at higher temperatures eliminates the air conditioning at site, creating significant energy savings and opening the market for DC generators
9
10
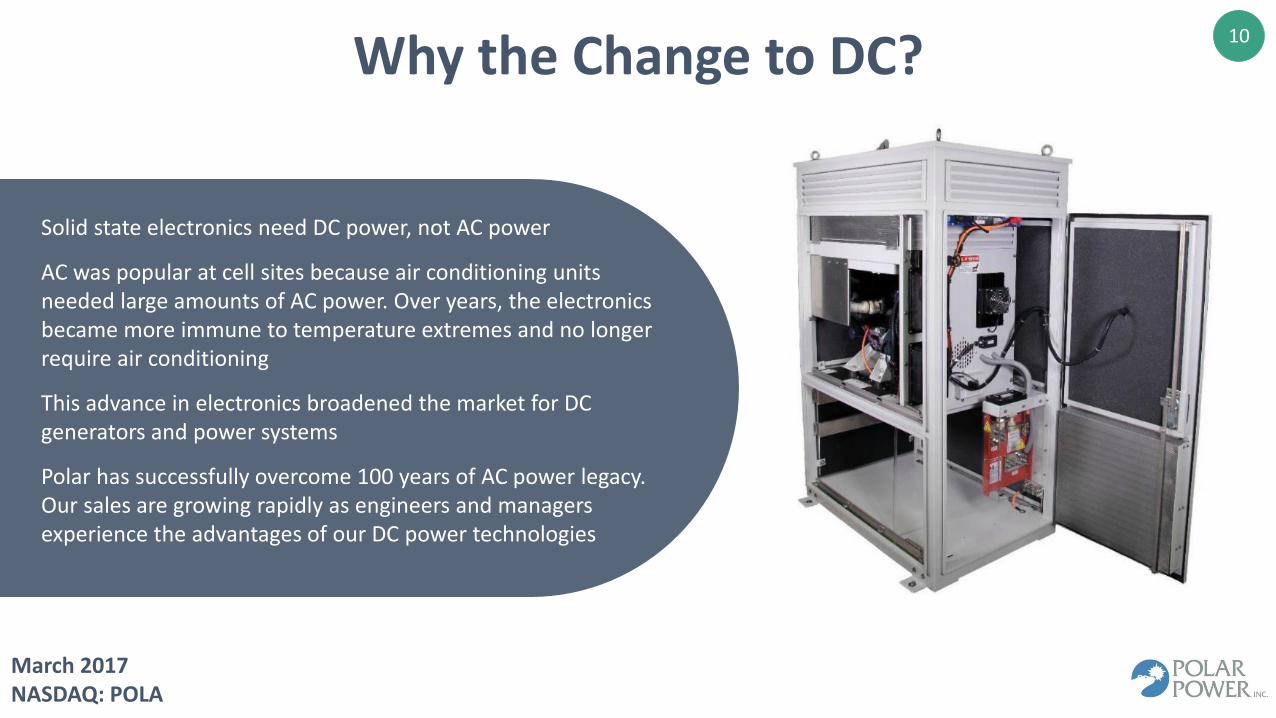
Why the Change to DC?
Solid state electronics need DC power, not AC power
AC was popular at cell sites because air conditioning units needed large amounts of AC power. Over years, the electronics became more immune to temperature extremes and no longer require air conditioning
This advance in electronics broadened the market for DC generators and power systems
Polar has successfully overcome 100 years of AC power legacy. Our sales are growing rapidly as engineers and managers experience the advantages of our DC power technologies
March 2017NASDAQ: POLA
11
Why Choose Polar Power?
• Optimized core product technology over 20 years from both a cost and performance perspective and now deliver a turnkey system
• Provide technical support for our customers including their: architecture and engineering (A&E), installers, commissioning, maintenance, local, regional, and national project managers. Support goes beyond just that of the DC power system
• Rapidly change the product to keep up with the constantly evolving telecommunications infrastructure and power requirements
• Manufacturing the product in volume with 8-week delivery schedules
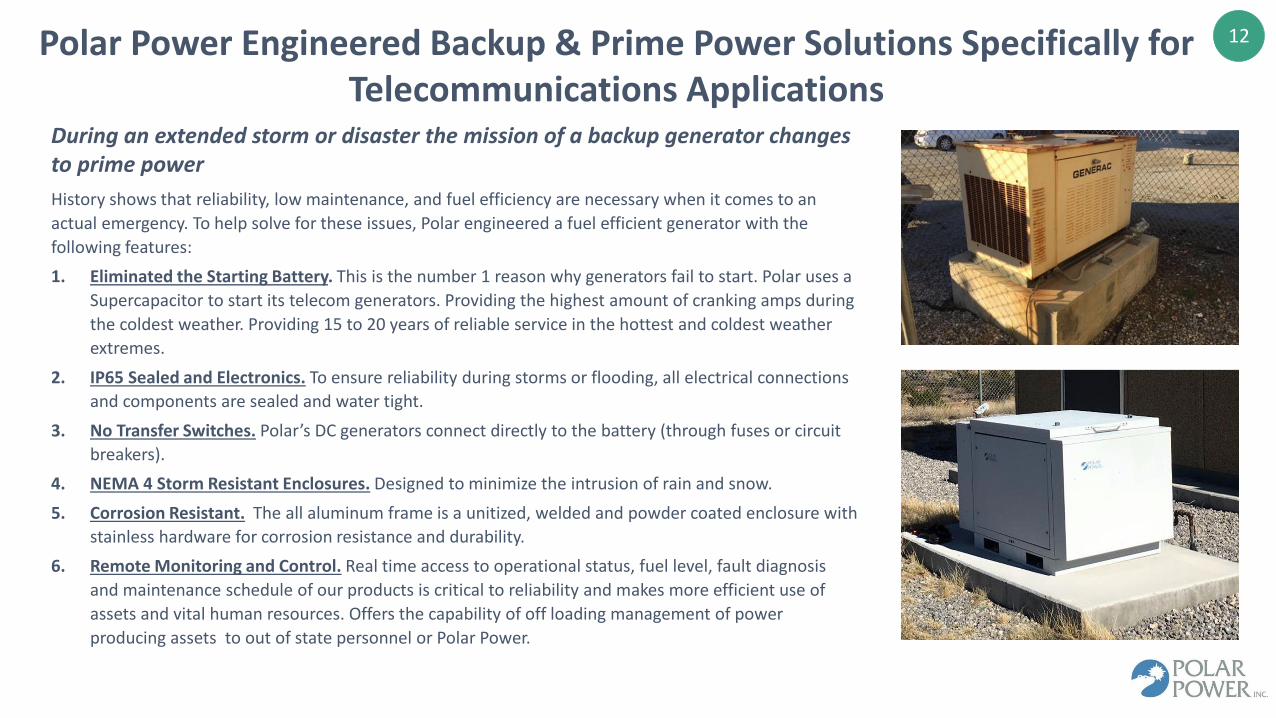
12Polar Power Engineered Backup & Prime Power Solutions Specifically for Telecommunications Applications
History shows that reliability, low maintenance, and fuel efficiency are necessary when it comes to an
actual emergency. To help solve for these issues, Polar engineered a fuel efficient generator with the
following features:
1. Eliminated the Starting Battery. This is the number 1 reason why generators fail to start. Polar uses a
Supercapacitor to start its telecom generators. Providing the highest amount of cranking amps during
the coldest weather. Providing 15 to 20 years of reliable service in the hottest and coldest weather
extremes.
2. IP65 Sealed and Electronics. To ensure reliability during storms or flooding, all electrical connections
and components are sealed and water tight.
3. No Transfer Switches. Polar’s DC generators connect directly to the battery (through fuses or circuit
breakers).
4. NEMA 4 Storm Resistant Enclosures. Designed to minimize the intrusion of rain and snow.
5. Corrosion Resistant. The all aluminum frame is a unitized, welded and powder coated enclosure with
stainless hardware for corrosion resistance and durability.
6. Remote Monitoring and Control. Real time access to operational status, fuel level, fault diagnosis
and maintenance schedule of our products is critical to reliability and makes more efficient use of
assets and vital human resources. Offers the capability of off loading management of power
producing assets to out of state personnel or Polar Power.
During an extended storm or disaster the mission of a backup generator changes to prime power
13Polar Power Engineered Backup & Prime Power Solutions Specifically for Telecommunications Applications
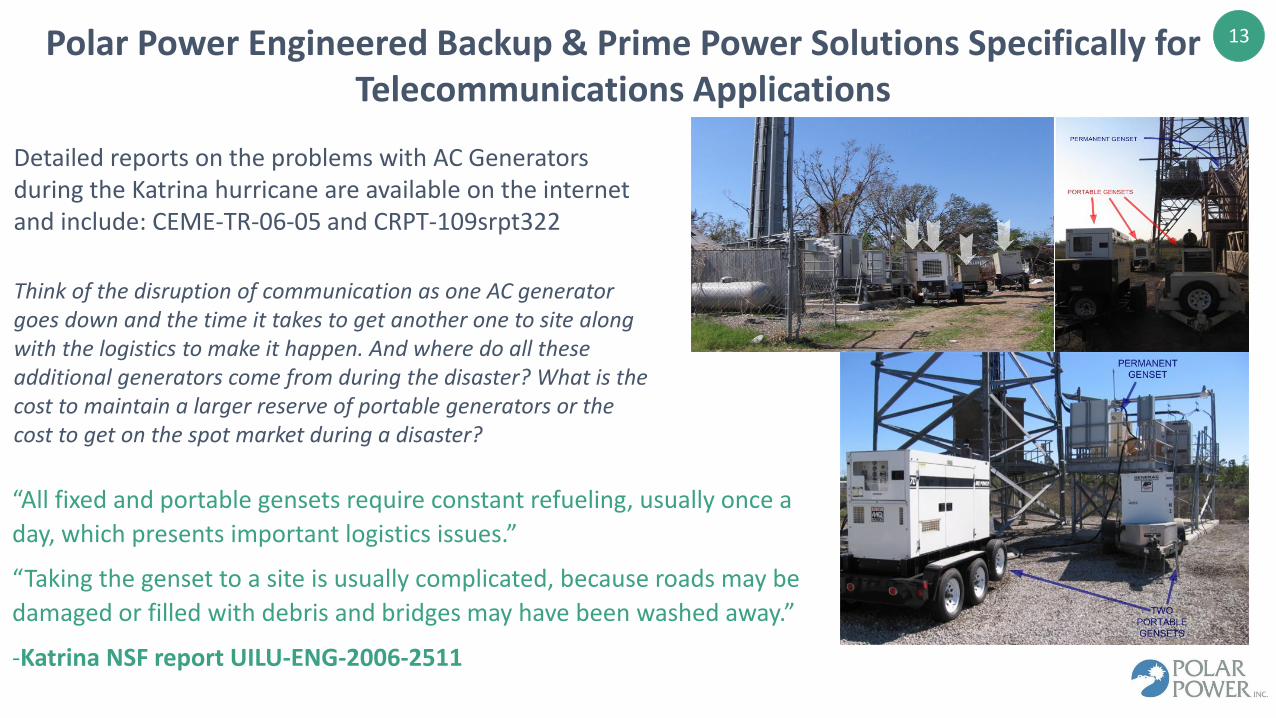
“All fixed and portable gensets require constant refueling, usually once a
day, which presents important logistics issues.”
“Taking the genset to a site is usually complicated, because roads may be
damaged or filled with debris and bridges may have been washed away.”
-Katrina NSF report UILU-ENG-2006-2511
Detailed reports on the problems with AC Generators during the Katrina hurricane are available on the internet and include: CEME-TR-06-05 and CRPT-109srpt322
Think of the disruption of communication as one AC generator goes down and the time it takes to get another one to site along with the logistics to make it happen. And where do all these additional generators come from during the disaster? What is the cost to maintain a larger reserve of portable generators or the cost to get on the spot market during a disaster?

14
Leroy SommerAC Model 42.2Power: 16kWWeight: 246 LBSLength: 18 IN
Polar Power Alternator
DC Model 8220Power: 22 kW
Weight: 49 LBSLength: 5.5 IN
SIMPLICITY = RELIABILITY
AC Versus DC
3X Larger
15
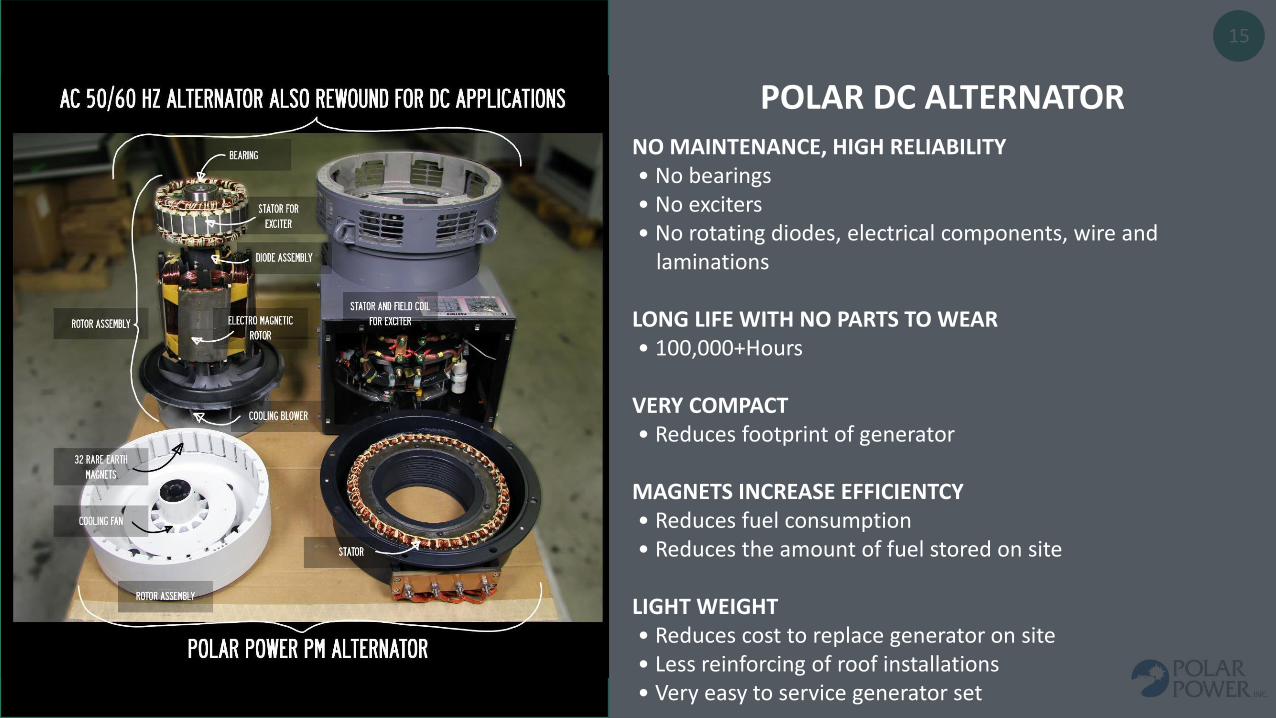
NO MAINTENANCE, HIGH RELIABILITY• No bearings• No exciters• No rotating diodes, electrical components, wire and
laminations
LONG LIFE WITH NO PARTS TO WEAR• 100,000+Hours
VERY COMPACT• Reduces footprint of generator
MAGNETS INCREASE EFFICIENTCY• Reduces fuel consumption• Reduces the amount of fuel stored on site
LIGHT WEIGHT• Reduces cost to replace generator on site• Less reinforcing of roof installations• Very easy to service generator set
POLAR DC ALTERNATOR
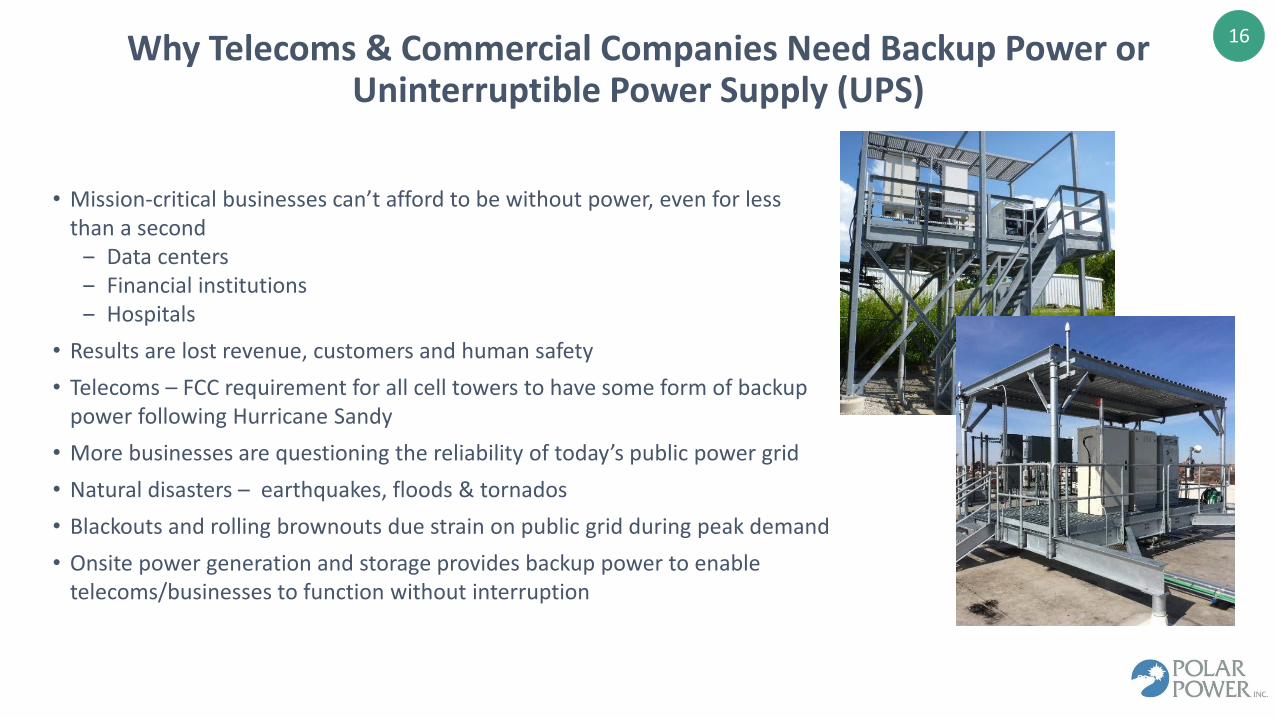
16Why Telecoms & Commercial Companies Need Backup Power or Uninterruptible Power Supply (UPS)
• Mission-critical businesses can’t afford to be without power, even for less than a second
‒ Data centers‒ Financial institutions‒ Hospitals
• Results are lost revenue, customers and human safety
• Telecoms – FCC requirement for all cell towers to have some form of backup power following Hurricane Sandy
• More businesses are questioning the reliability of today’s public power grid
• Natural disasters – earthquakes, floods & tornados
• Blackouts and rolling brownouts due strain on public grid during peak demand
• Onsite power generation and storage provides backup power to enable telecoms/businesses to function without interruption
17
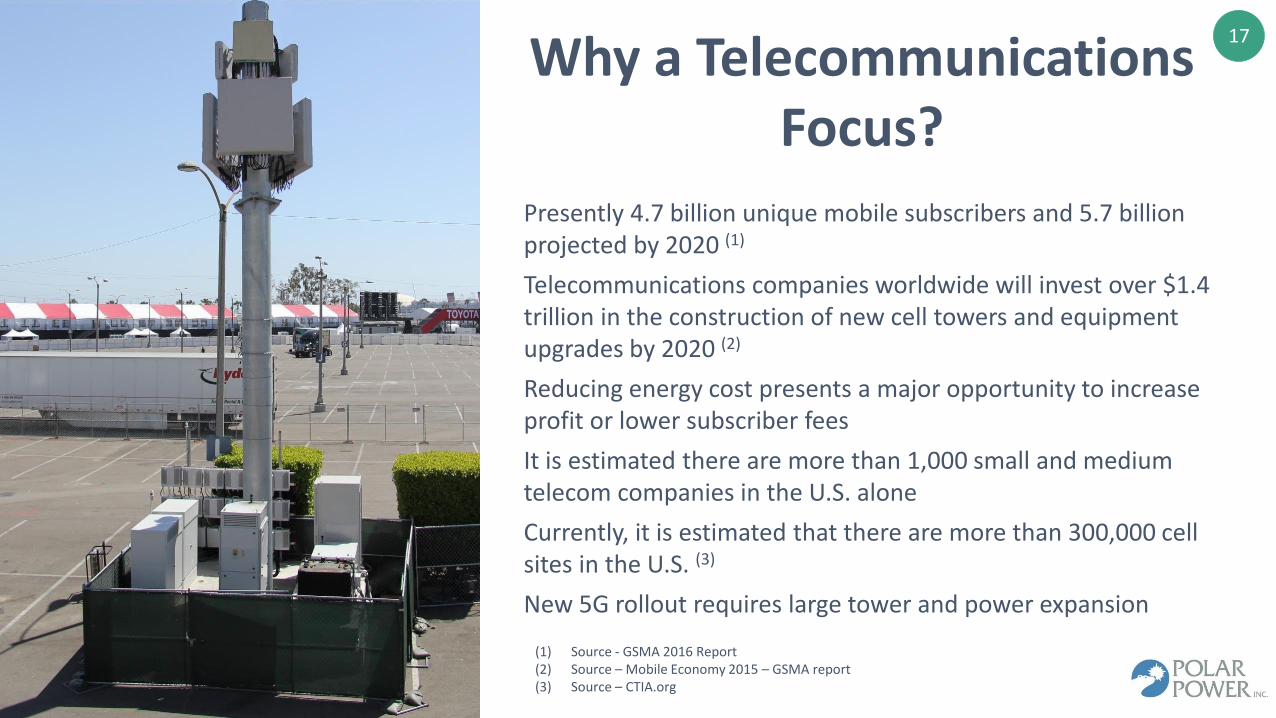
Why a Telecommunications Focus?
Presently 4.7 billion unique mobile subscribers and 5.7 billion projected by 2020 (1)
Telecommunications companies worldwide will invest over $1.4 trillion in the construction of new cell towers and equipment upgrades by 2020 (2)
Reducing energy cost presents a major opportunity to increase profit or lower subscriber fees
It is estimated there are more than 1,000 small and medium telecom companies in the U.S. alone
Currently, it is estimated that there are more than 300,000 cell sites in the U.S. (3)
New 5G rollout requires large tower and power expansion
(1) Source - GSMA 2016 Report(2) Source – Mobile Economy 2015 – GSMA report(3) Source – CTIA.org
18
Trends
FCC regulatory change and wireless carriers revenue goals demand longer backup capacity at all cell sites triggered by Hurricane Katrina & Sandy
Cell phones are displacing land lines as primary means of communications. Now the same level of reliability is being demanded of cell phones
Enhanced pressure from the EPA to reduce greenhouse gases
Necessity of independent towers and cell sites for first responders
Strict mandates to provide rural connectivity to broadband service in the U.S. and developing nations
Many wireless carriers are divesting their tower assets and in turn renting the space from the “new” owners; now referred to as Tower Operators.
Tower Operators have a narrow business interest of providing space and electrical energy; with new owners cell sites are now focused on reducing energy costs to increase their profits.
Key Drivers to Growth of Reliable Power Systems
1
2
3
5
4
19
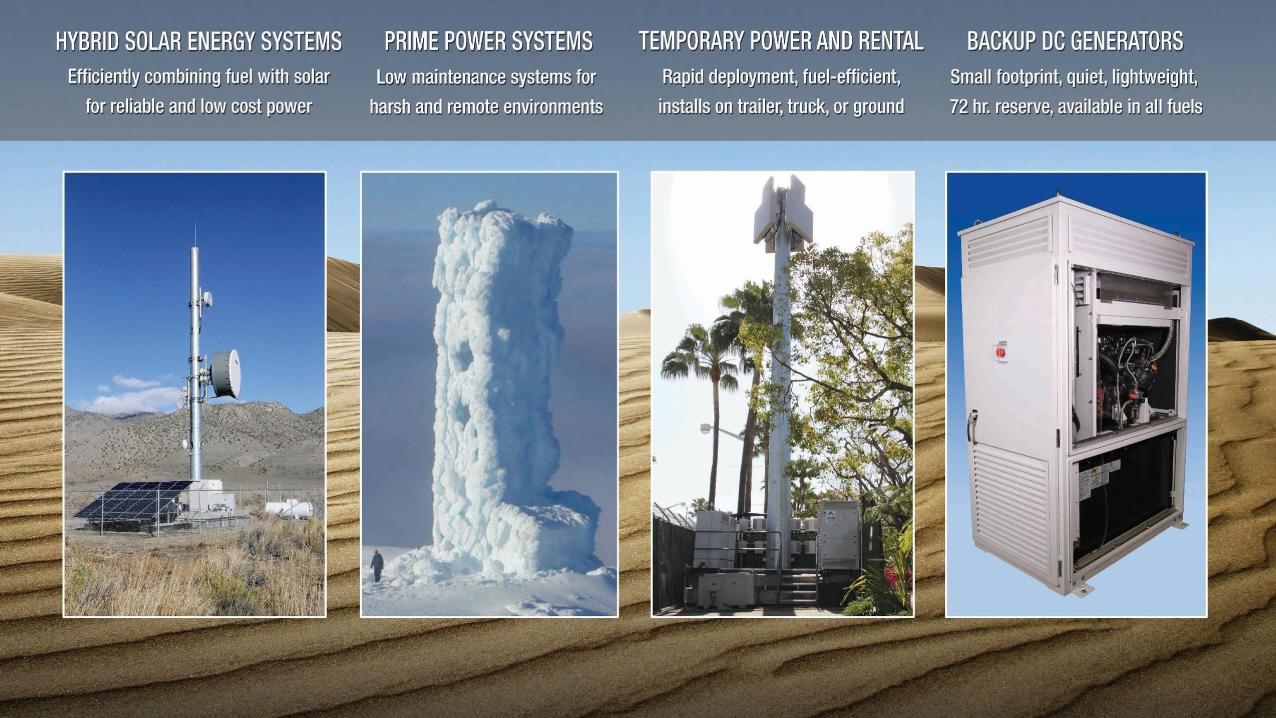
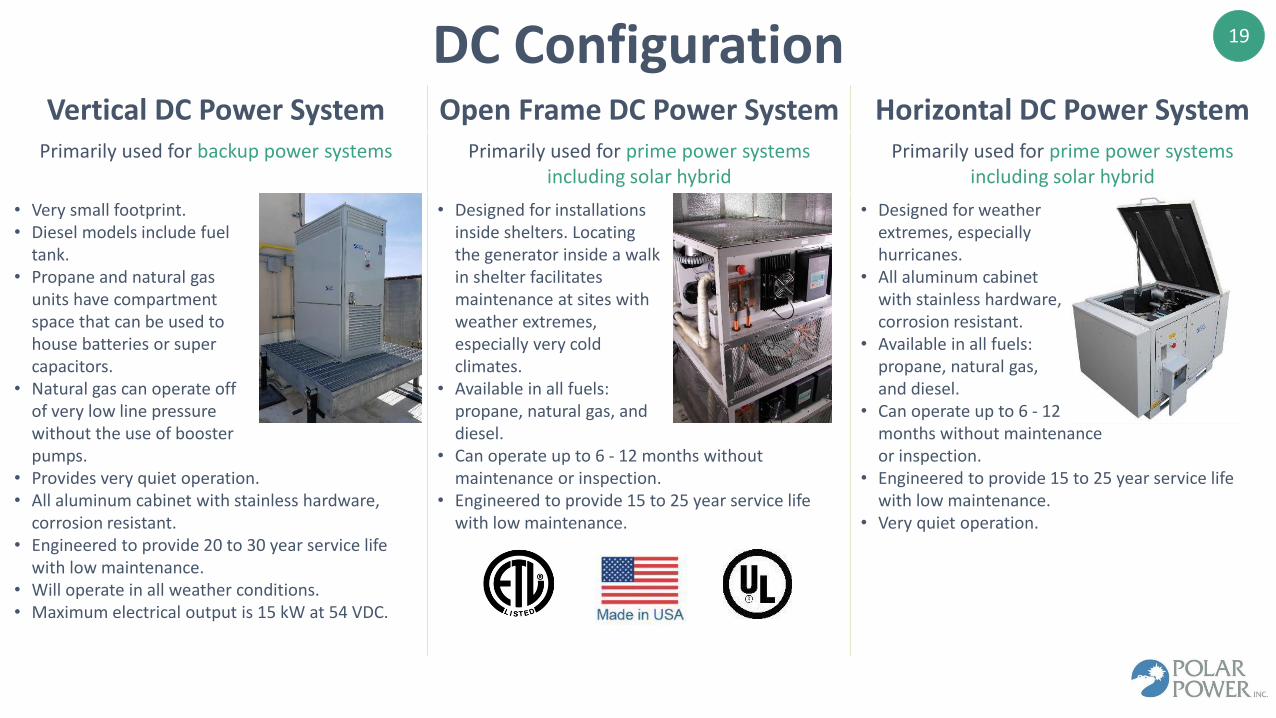
Vertical DC Power System Open Frame DC Power System Horizontal DC Power SystemPrimarily used for backup power systems Primarily used for prime power systems
including solar hybridPrimarily used for prime power systems
including solar hybrid
• Very small footprint.• Diesel models include fuel
tank.• Propane and natural gas
units have compartment space that can be used to house batteries or super capacitors.
• Natural gas can operate off of very low line pressure without the use of booster pumps.
• Provides very quiet operation.• All aluminum cabinet with stainless hardware,
corrosion resistant.• Engineered to provide 20 to 30 year service life
with low maintenance.• Will operate in all weather conditions.• Maximum electrical output is 15 kW at 54 VDC.
• Designed for installations inside shelters. Locating the generator inside a walk in shelter facilitates maintenance at sites with weather extremes, especially very cold climates.
• Available in all fuels: propane, natural gas, and diesel.
• Can operate up to 6 - 12 months without maintenance or inspection.
• Engineered to provide 15 to 25 year service life with low maintenance.
• Designed for weather extremes, especially hurricanes.
• All aluminum cabinet with stainless hardware, corrosion resistant.
• Available in all fuels: propane, natural gas, and diesel.
• Can operate up to 6 - 12 months without maintenance or inspection.
• Engineered to provide 15 to 25 year service life with low maintenance.
• Very quiet operation.
DC Configuration

20
Backup Power
Systems
On-GridSites
Advantages of DC Power Systems
• With air conditioning no longer required, during a power outage there is now the opportunity for smaller and more efficient DC power systems to provide backup power.
• Space is at a very high premium on the cell site. Polar’s DC power systems are smaller than many AC power systems.
• Polar’s DC power systems are lighter than many AC power systems, reducing roof reinforcing requirements.
• Polar’s unique fuel carburation system allows our power systems to function off line pressure without expensive booster pumps, typical of AC power systems.
• Isolation from the grid, no problems with the power system accidentally connecting to the grid• Quiet operation• Small amounts of fuel on site
21
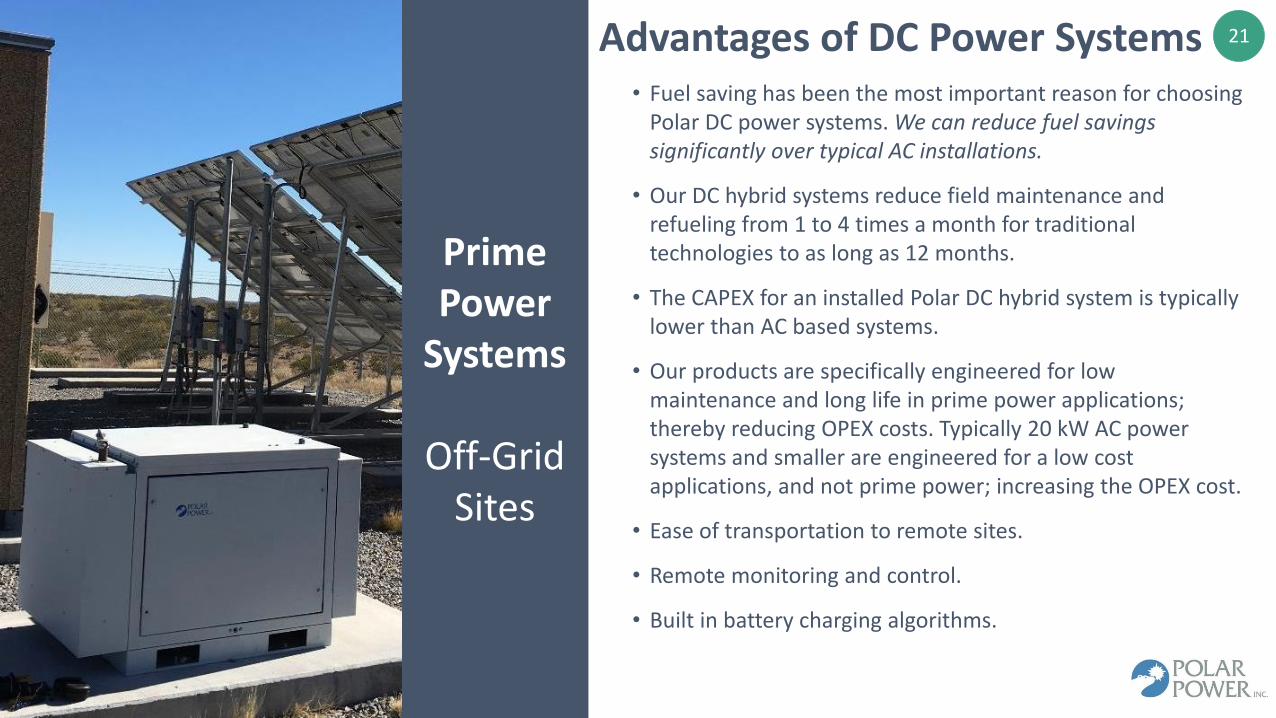
Prime Power
Systems
Off-Grid Sites
• Fuel saving has been the most important reason for choosing Polar DC power systems. We can reduce fuel savings significantly over typical AC installations.
• Our DC hybrid systems reduce field maintenance and refueling from 1 to 4 times a month for traditional technologies to as long as 12 months.
• The CAPEX for an installed Polar DC hybrid system is typically lower than AC based systems.
• Our products are specifically engineered for low maintenance and long life in prime power applications; thereby reducing OPEX costs. Typically 20 kW AC power systems and smaller are engineered for a low cost applications, and not prime power; increasing the OPEX cost.
• Ease of transportation to remote sites.
• Remote monitoring and control.
• Built in battery charging algorithms.
Advantages of DC Power Systems
22
0
50
100
150
200
250
300
350
400
450
1 2 3 4
GA
LLO
NS
PER
WEE
K
Average Fuel Consumption a Week
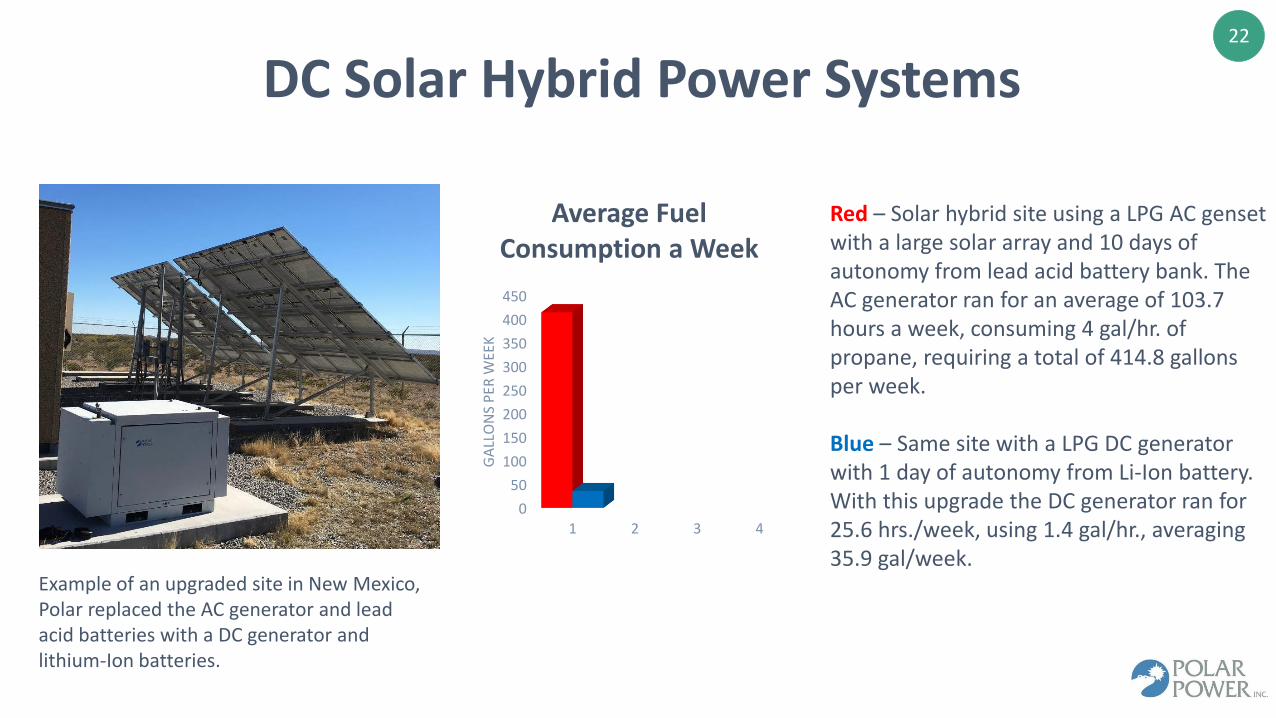
Red – Solar hybrid site using a LPG AC genset with a large solar array and 10 days of autonomy from lead acid battery bank. The AC generator ran for an average of 103.7 hours a week, consuming 4 gal/hr. of propane, requiring a total of 414.8 gallons per week.
Blue – Same site with a LPG DC generator with 1 day of autonomy from Li-Ion battery. With this upgrade the DC generator ran for 25.6 hrs./week, using 1.4 gal/hr., averaging 35.9 gal/week.
Example of an upgraded site in New Mexico, Polar replaced the AC generator and lead acid batteries with a DC generator and lithium-Ion batteries.
DC Solar Hybrid Power Systems
23
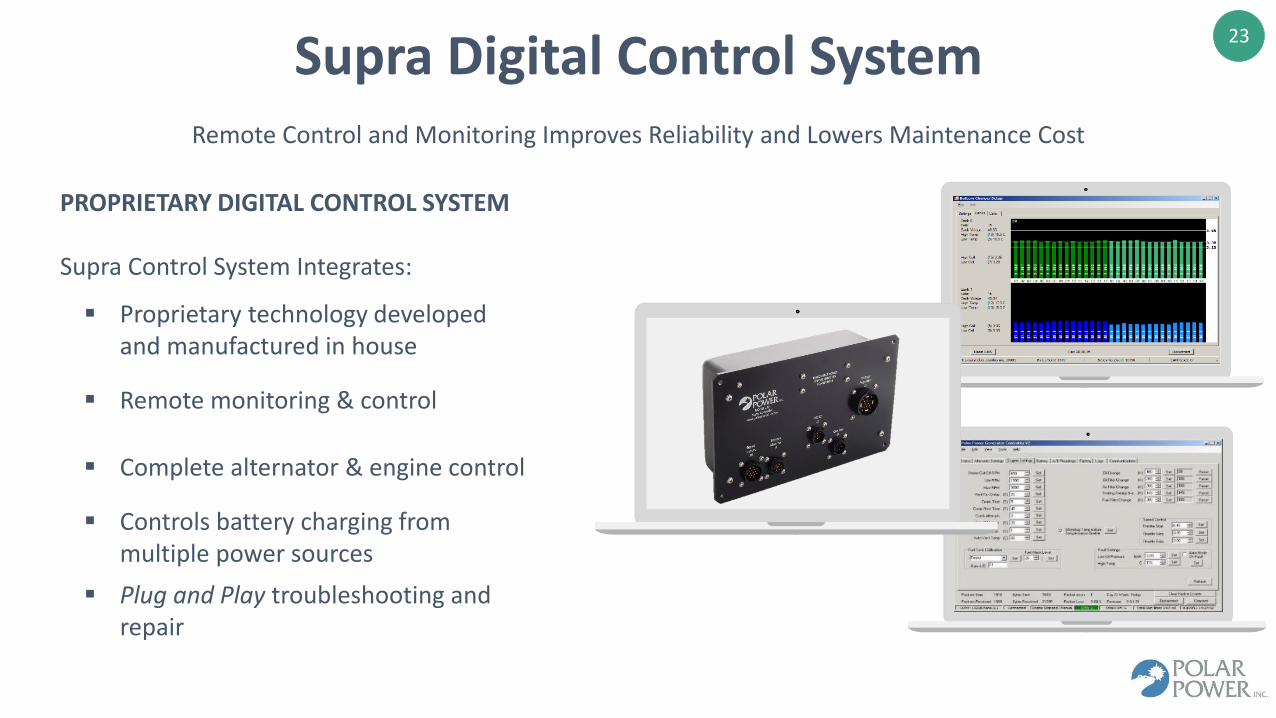
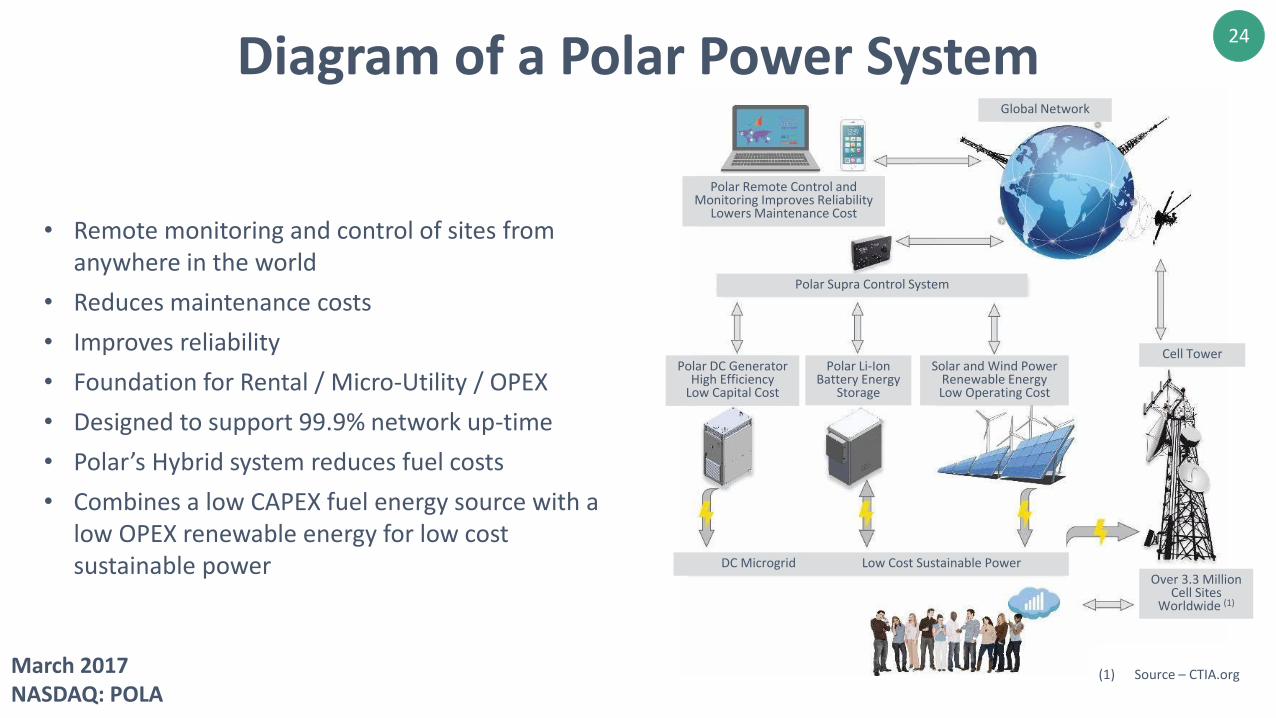
Supra Digital Control System Remote Control and Monitoring Improves Reliability and Lowers Maintenance Cost
PROPRIETARY DIGITAL CONTROL SYSTEM
Supra Control System Integrates:
Proprietary technology developed and manufactured in house
Remote monitoring & control
Complete alternator & engine control
Controls battery charging frommultiple power sources
Plug and Play troubleshooting and repair
24
• Remote monitoring and control of sites from anywhere in the world
• Reduces maintenance costs
• Improves reliability
• Foundation for Rental / Micro-Utility / OPEX
• Designed to support 99.9% network up-time
• Polar’s Hybrid system reduces fuel costs
• Combines a low CAPEX fuel energy source with a low OPEX renewable energy for low cost sustainable power
Polar Remote Control and Monitoring Improves Reliability
Lowers Maintenance Cost
Global Network
Polar Supra Control System
Polar DC Generator High Efficiency
Low Capital Cost
Polar Li-Ion Battery Energy
Storage
Solar and Wind Power Renewable Energy Low Operating Cost
Cell Tower
DC Microgrid Low Cost Sustainable Power Over 3.3 Million
Cell Sites Worldwide (1)
Diagram of a Polar Power System
March 2017NASDAQ: POLA
(1) Source – CTIA.org
25Growth StrategyFurther Develop U.S. Mobile Telecommunications Market
• During the last 3 years, we achieved significant success in selling our DC power systems to large wireless companies
• Product approval from the big 3 wireless carriers in the USA
• Further expand our sales, manufacturing and service infrastructure through strategic allocation of capital in operations and plant and equipment
Expand DC Power Systems Sales Into New Geographic Markets
• Currently, our sales of DC power systems are mostly to U.S. customers, which represents only 4.7% of the total global telecommunications market, we believe a significant opportunity exists for sales of our DC power systems to customers located in developing nations
Expand Renewable Solar Energy Product Offerings
• Increased environmental regulations and reduction in cost of solar and advanced storage batteries has accelerated tower operators’ focus on solar hybrid systems in off-grid and bad-grid regions
• In 2013, we developed our proprietary Lithium Battery Management System and Solar Control System
Enter Power Rental Market
• Trend of wireless carriers divesting tower assets to tower operators and tower operators further divesting power infrastructure to energy companies
• Introduced pilot rental program in Southern California in 2014 to evaluate business model
• We plan to introduce an equipment rental program to enter the energy provider market in the telecommunications tower industry
Develop Products For Telecom Data Centers
• Industry transitioning towards distributed data centers favoring our DC power systems
• In process of developing higher power DC systems for application in data centers
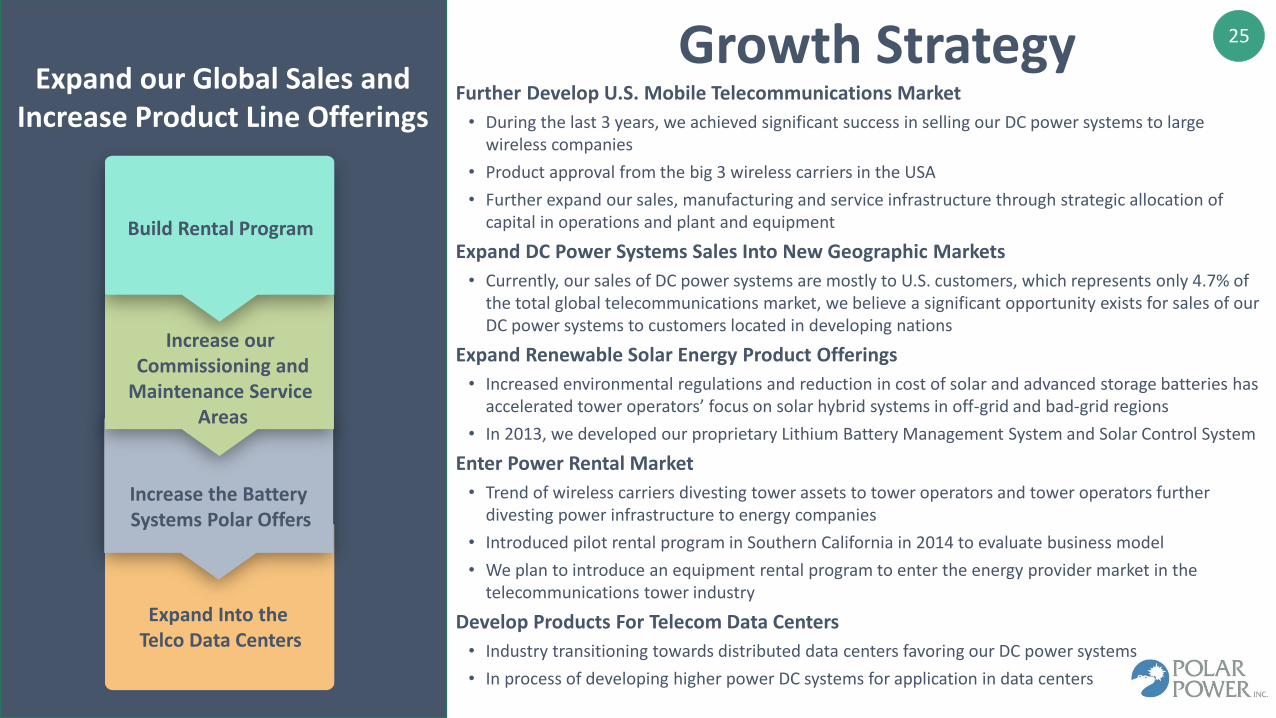
Expand our Global Sales and Increase Product Line Offerings
Build Rental Program
Increase our Commissioning and
Maintenance Service Areas
Increase the Battery Systems Polar Offers
Expand Into the Telco Data Centers
26
Key Steps to Expanding our Telecom Sales
Add Additional Sales Personnel• We have 1 fulltime sales person on the road with
6 supporting staff, that support $15.5 million in sales for 9 months ended September 30, 2016
• Recently hired 2 senior level sales directors • Now we are focused on hiring sales support staff
Build A Rental Fleet / Micro-Utility / OPEX Based Service• Allows us to demonstrate our technology as the
customer can rent for a week, month, or years without affecting its CAPEX
• Many customers would rather procure power systems under their operating budgets, and not their capital budgets.
• Would provide a continuous revenue stream• Would provide significant tax advantages for Polar
Build our Monitoring Maintenance and Commissioning Services• Presently, we perform our customer service on an
“on call” basis rather than on a contract maintenance basis
Increase production facilities
Increase inventory
Increase customer service
Build our overseas presence
27
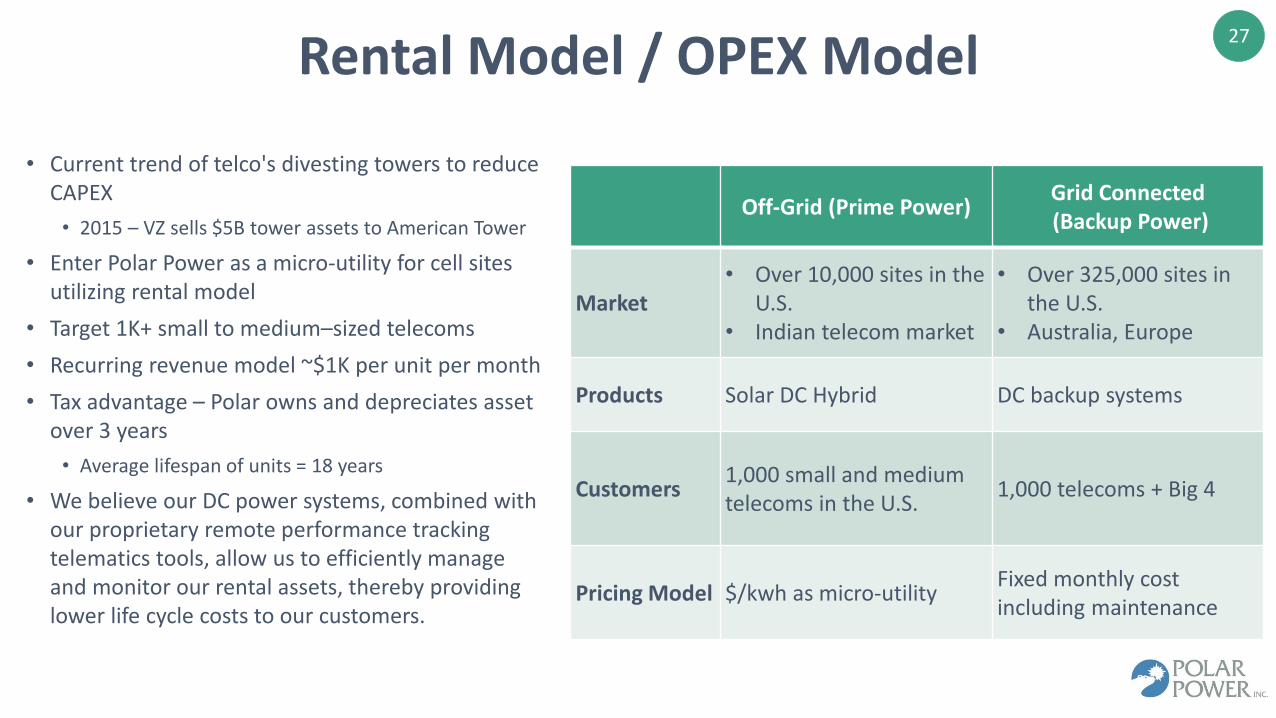
Rental Model / OPEX Model
Off-Grid (Prime Power)Grid Connected(Backup Power)
Market• Over 10,000 sites in the
U.S.• Indian telecom market
• Over 325,000 sites in the U.S.
• Australia, Europe
Products Solar DC Hybrid DC backup systems
Customers1,000 small and medium telecoms in the U.S.
1,000 telecoms + Big 4
Pricing Model $/kwh as micro-utilityFixed monthly cost including maintenance
• Current trend of telco's divesting towers to reduce CAPEX
• 2015 – VZ sells $5B tower assets to American Tower
• Enter Polar Power as a micro-utility for cell sites utilizing rental model
• Target 1K+ small to medium–sized telecoms
• Recurring revenue model ~$1K per unit per month
• Tax advantage – Polar owns and depreciates asset over 3 years
• Average lifespan of units = 18 years
• We believe our DC power systems, combined with our proprietary remote performance tracking telematics tools, allow us to efficiently manage and monitor our rental assets, thereby providing lower life cycle costs to our customers.
28
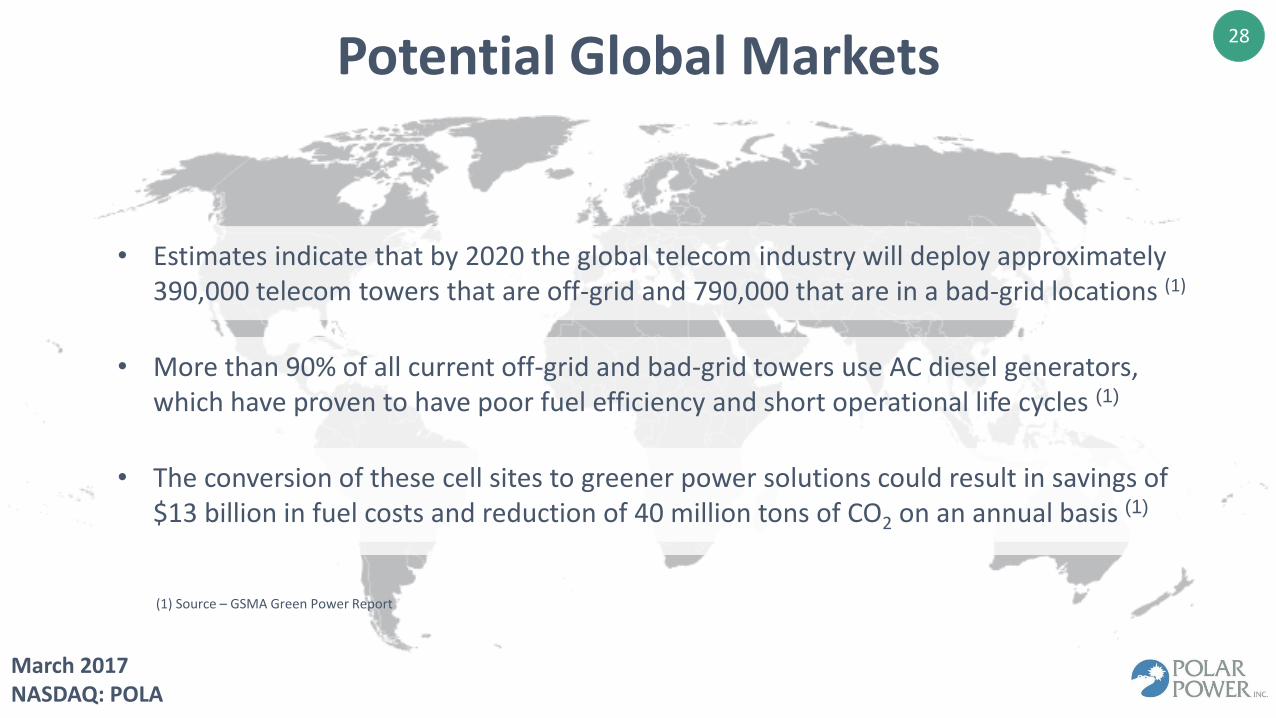
Potential Global Markets
• Estimates indicate that by 2020 the global telecom industry will deploy approximately 390,000 telecom towers that are off-grid and 790,000 that are in a bad-grid locations (1)
• More than 90% of all current off-grid and bad-grid towers use AC diesel generators, which have proven to have poor fuel efficiency and short operational life cycles (1)
• The conversion of these cell sites to greener power solutions could result in savings of $13 billion in fuel costs and reduction of 40 million tons of CO2 on an annual basis (1)
March 2017NASDAQ: POLA
(1) Source – GSMA Green Power Report
29
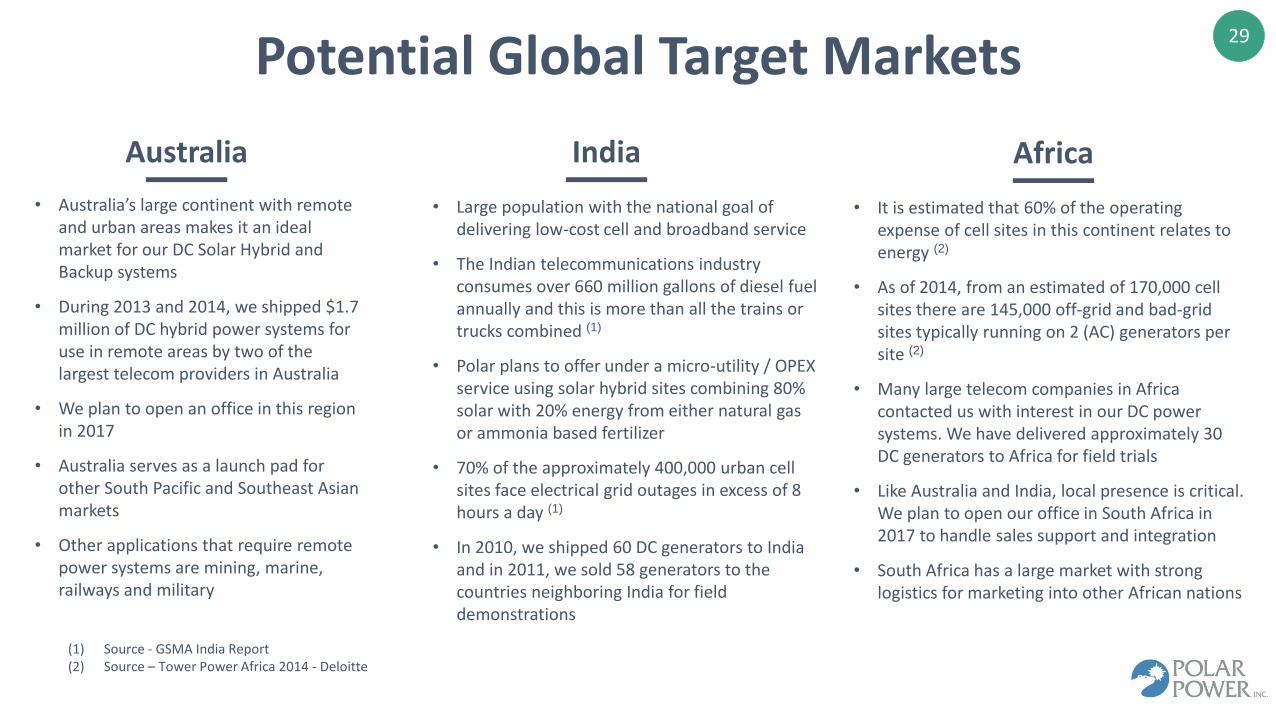
Potential Global Target Markets
Australia
• Australia’s large continent with remote and urban areas makes it an ideal market for our DC Solar Hybrid and Backup systems
• During 2013 and 2014, we shipped $1.7 million of DC hybrid power systems for use in remote areas by two of the largest telecom providers in Australia
• We plan to open an office in this region in 2017
• Australia serves as a launch pad for other South Pacific and Southeast Asian markets
• Other applications that require remote power systems are mining, marine, railways and military
• Large population with the national goal of delivering low-cost cell and broadband service
• The Indian telecommunications industry consumes over 660 million gallons of diesel fuel annually and this is more than all the trains or trucks combined (1)
• Polar plans to offer under a micro-utility / OPEX service using solar hybrid sites combining 80% solar with 20% energy from either natural gas or ammonia based fertilizer
• 70% of the approximately 400,000 urban cell sites face electrical grid outages in excess of 8 hours a day (1)
• In 2010, we shipped 60 DC generators to India and in 2011, we sold 58 generators to the countries neighboring India for field demonstrations
• It is estimated that 60% of the operating expense of cell sites in this continent relates to energy (2)
• As of 2014, from an estimated of 170,000 cell sites there are 145,000 off-grid and bad-grid sites typically running on 2 (AC) generators per site (2)
• Many large telecom companies in Africa contacted us with interest in our DC power systems. We have delivered approximately 30 DC generators to Africa for field trials
• Like Australia and India, local presence is critical. We plan to open our office in South Africa in 2017 to handle sales support and integration
• South Africa has a large market with strong logistics for marketing into other African nations
India Africa
(1) Source - GSMA India Report(2) Source – Tower Power Africa 2014 - Deloitte
30
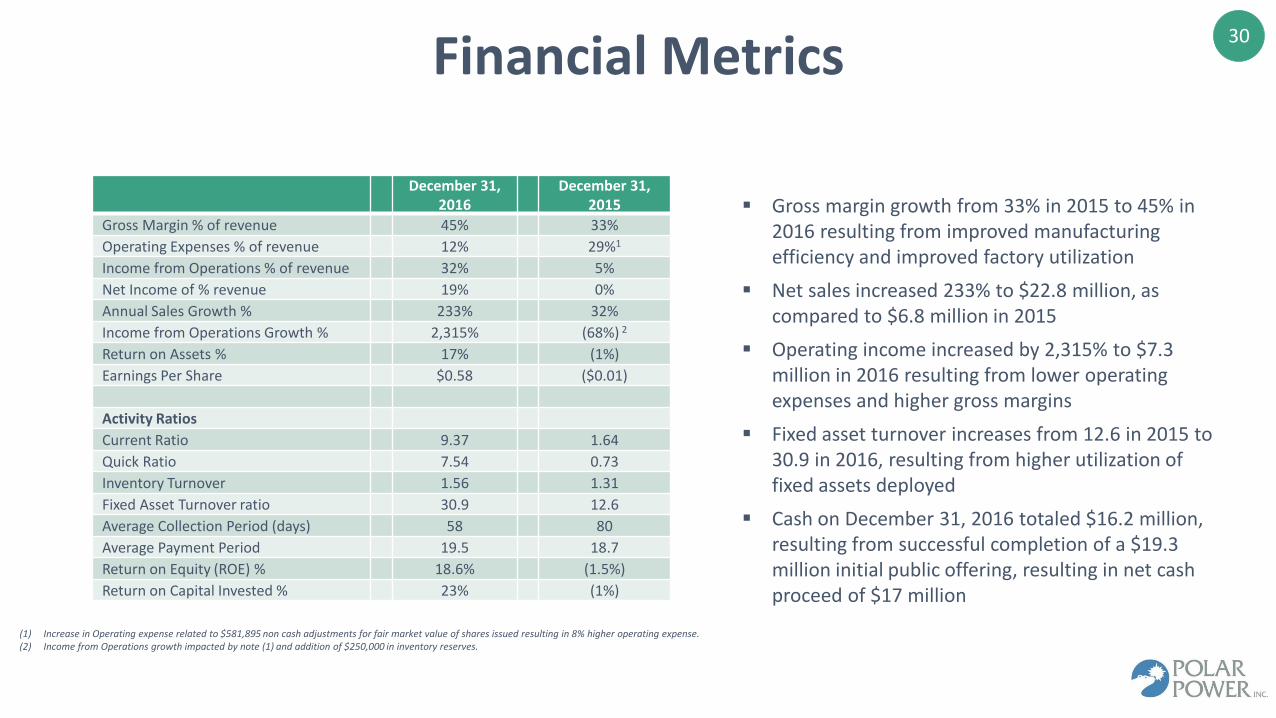
Gross margin growth from 33% in 2015 to 45% in 2016 resulting from improved manufacturing efficiency and improved factory utilization
Net sales increased 233% to $22.8 million, as compared to $6.8 million in 2015
Operating income increased by 2,315% to $7.3 million in 2016 resulting from lower operating expenses and higher gross margins
Fixed asset turnover increases from 12.6 in 2015 to 30.9 in 2016, resulting from higher utilization of fixed assets deployed
Cash on December 31, 2016 totaled $16.2 million, resulting from successful completion of a $19.3 million initial public offering, resulting in net cash proceed of $17 million
(1) Increase in Operating expense related to $581,895 non cash adjustments for fair market value of shares issued resulting in 8% higher operating expense.(2) Income from Operations growth impacted by note (1) and addition of $250,000 in inventory reserves.
Financial Metrics
December 31,2016
December 31,2015
Gross Margin % of revenue 45% 33%
Operating Expenses % of revenue 12% 29%1
Income from Operations % of revenue 32% 5%
Net Income of % revenue 19% 0%
Annual Sales Growth % 233% 32%
Income from Operations Growth % 2,315% (68%) 2
Return on Assets % 17% (1%)
Earnings Per Share $0.58 ($0.01)
Activity Ratios
Current Ratio 9.37 1.64
Quick Ratio 7.54 0.73
Inventory Turnover 1.56 1.31
Fixed Asset Turnover ratio 30.9 12.6
Average Collection Period (days) 58 80
Average Payment Period 19.5 18.7
Return on Equity (ROE) % 18.6% (1.5%)
Return on Capital Invested % 23% (1%)

31
Financial Review | 2015 – 2016
Sales growth of 233% during 2016 resulting from expansion of sales of DC power systems into new regions with U.S. telecommunications sector
Net income increased to $4.4 million, or $0.58 per basic and diluted share, resulting from increased sales and improved factory overhead absorption and reduction in material costs
Total Sales and General and Administrative (SG&A) expenses totaled 12% of net sales in 2016 compared to 29% of net sales in 2015.
Income Statements
(in thousands, except per share data)Years Ended
December 31,
2016 2015
Net Sales $22,801 $6,847
Cost of Sales 12,619 4,558
Gross Profit 10,181 2,288
Total operating expenses 2,777 1,981
Income from operations 7,403 307
Total other (expense) (140) (66)
Income (loss) before income taxes
7,263 240
Income tax provision (2,861) (274)
Net Income (loss) 4,402 ($33)
Net Income (loss) per share – basic and diluted
$0.58 ($0.01)
March 2017NASDAQ: POLA
32
Balance Sheets
$3,946
$25,664
$-
$5,000
$10,000
$15,000
$20,000
$25,000
$30,000
2015 2016
Cur Assets PP&E
Deposits Def. Tax
$2,400 $2,740
$2,248
$19,244
$-
$5,000
$10,000
$15,000
$20,000
$25,000
$30,000
2015 2016
Cur Liabilities LT Liability
Stock Ret. Earnings
Assets 2015-2016
Liabilities and Equity 2015-2016
December 31,2016
December 31,2015
ASSETSTotal current assets 25,664,264 3,946,296
Property and equipment, net 737,586 542,892Deposits 66,796 88,944Deferred financing costs - -Deferred tax assets 160,637 205,000Total assets $26,629,283 $4,783,132
LIABILITIES AND SHAREHOLDERS EQUITYTotal current liabilities 2,739,874 2,400,958
Notes payable, net of current portion 237,431 127,840
Total liabilities 2,977,305 2,528,798Common stock, 10,143,158 issuedand additional paid in capital
19,243,729 2,248,895
Retained earnings 4,408,249 5,439Total shareholders’ equity 23,651,978 2,254,334
Total liabilities and shareholders’ equity $26,629,283 $4,783,132
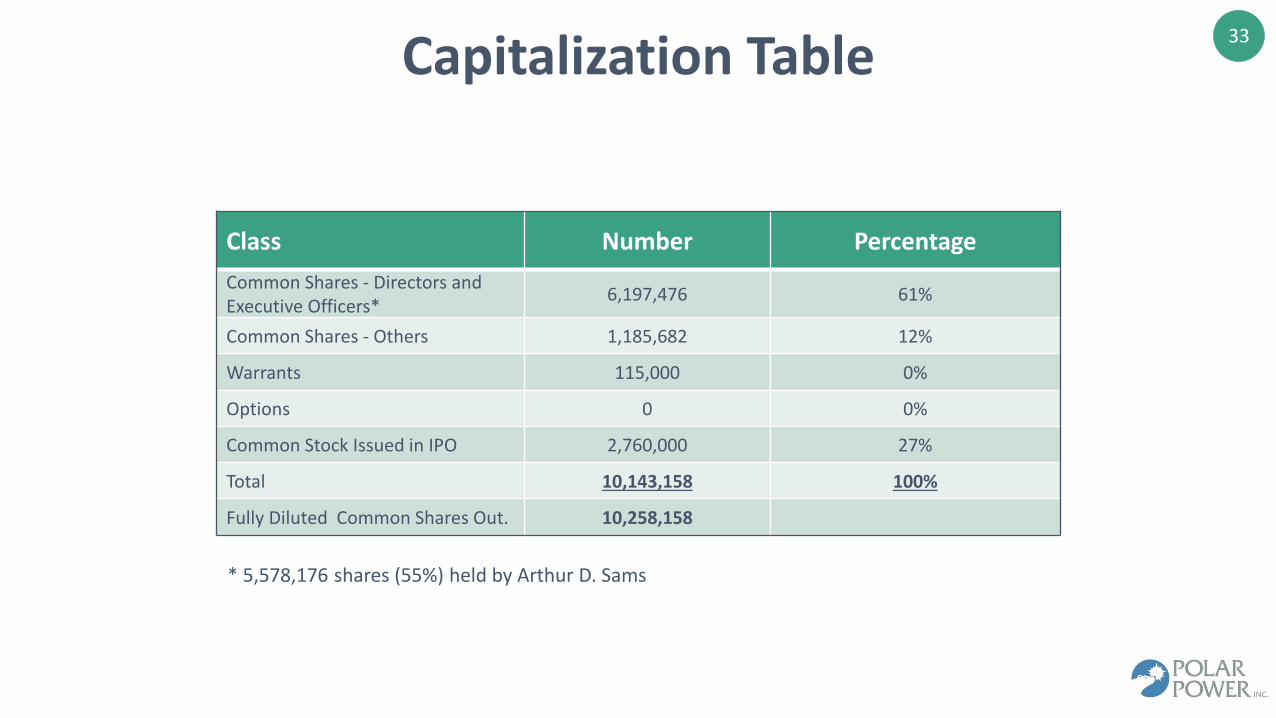
33
Capitalization Table
Class Number Percentage
Common Shares - Directors and Executive Officers*
6,197,476 61%
Common Shares - Others 1,185,682 12%
Warrants 115,000 0%
Options 0 0%
Common Stock Issued in IPO 2,760,000 27%
Total 10,143,158 100%
Fully Diluted Common Shares Out. 10,258,158
* 5,578,176 shares (55%) held by Arthur D. Sams
34
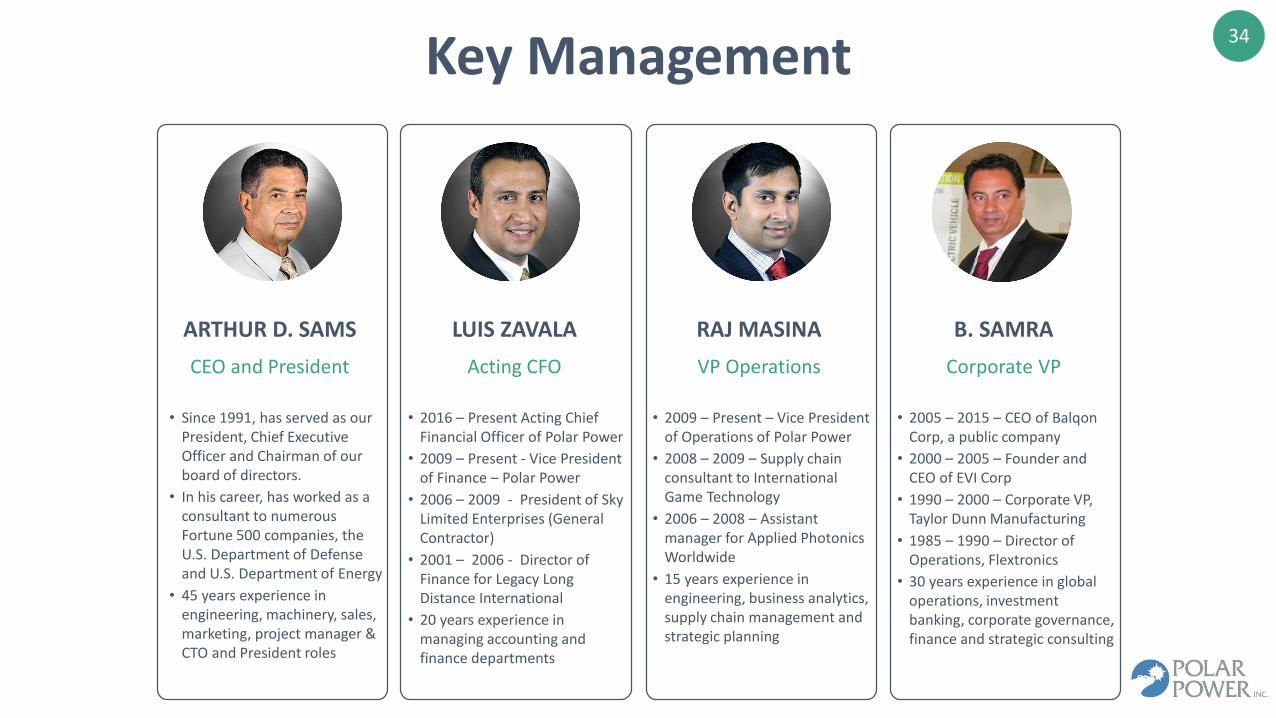
Key Management
ARTHUR D. SAMS LUIS ZAVALA RAJ MASINA B. SAMRA
CEO and President Acting CFO VP Operations Corporate VP
• Since 1991, has served as our President, Chief Executive Officer and Chairman of our board of directors.
• In his career, has worked as a consultant to numerous Fortune 500 companies, the U.S. Department of Defense and U.S. Department of Energy
• 45 years experience in engineering, machinery, sales, marketing, project manager & CTO and President roles
• 2016 – Present Acting Chief Financial Officer of Polar Power
• 2009 – Present - Vice President of Finance – Polar Power
• 2006 – 2009 - President of Sky Limited Enterprises (General Contractor)
• 2001 – 2006 - Director of Finance for Legacy Long Distance International
• 20 years experience in managing accounting and finance departments
• 2009 – Present – Vice President of Operations of Polar Power
• 2008 – 2009 – Supply chain consultant to International Game Technology
• 2006 – 2008 – Assistant manager for Applied Photonics Worldwide
• 15 years experience in engineering, business analytics, supply chain management and strategic planning
• 2005 – 2015 – CEO of Balqon Corp, a public company
• 2000 – 2005 – Founder and CEO of EVI Corp
• 1990 – 2000 – Corporate VP, Taylor Dunn Manufacturing
• 1985 – 1990 – Director of Operations, Flextronics
• 30 years experience in global operations, investment banking, corporate governance, finance and strategic consulting
35
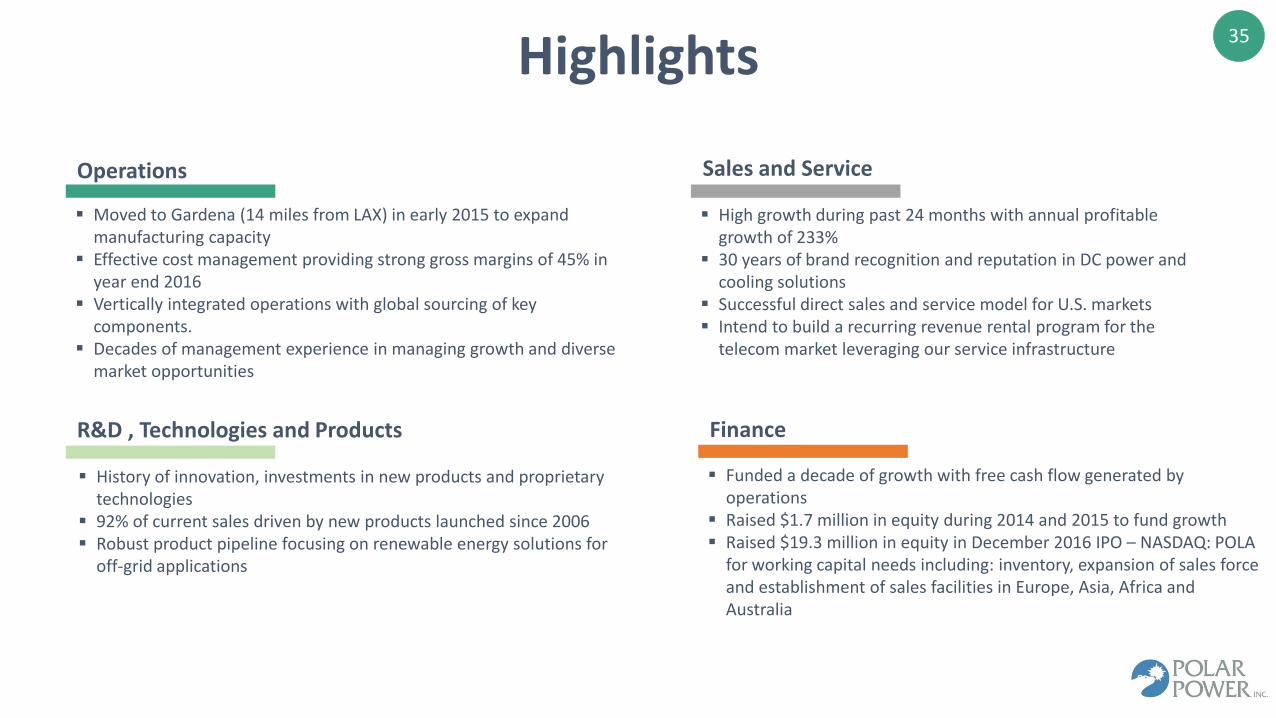
History of innovation, investments in new products and proprietary technologies
92% of current sales driven by new products launched since 2006 Robust product pipeline focusing on renewable energy solutions for
off-grid applications
Moved to Gardena (14 miles from LAX) in early 2015 to expand manufacturing capacity
Effective cost management providing strong gross margins of 45% in year end 2016
Vertically integrated operations with global sourcing of key components.
Decades of management experience in managing growth and diverse market opportunities
High growth during past 24 months with annual profitable growth of 233%
30 years of brand recognition and reputation in DC power and cooling solutions
Successful direct sales and service model for U.S. markets Intend to build a recurring revenue rental program for the
telecom market leveraging our service infrastructure
Funded a decade of growth with free cash flow generated by operations
Raised $1.7 million in equity during 2014 and 2015 to fund growth Raised $19.3 million in equity in December 2016 IPO – NASDAQ: POLA
for working capital needs including: inventory, expansion of sales force and establishment of sales facilities in Europe, Asia, Africa and Australia
Operations
Finance
Sales and Service
R&D , Technologies and Products
Highlights
36
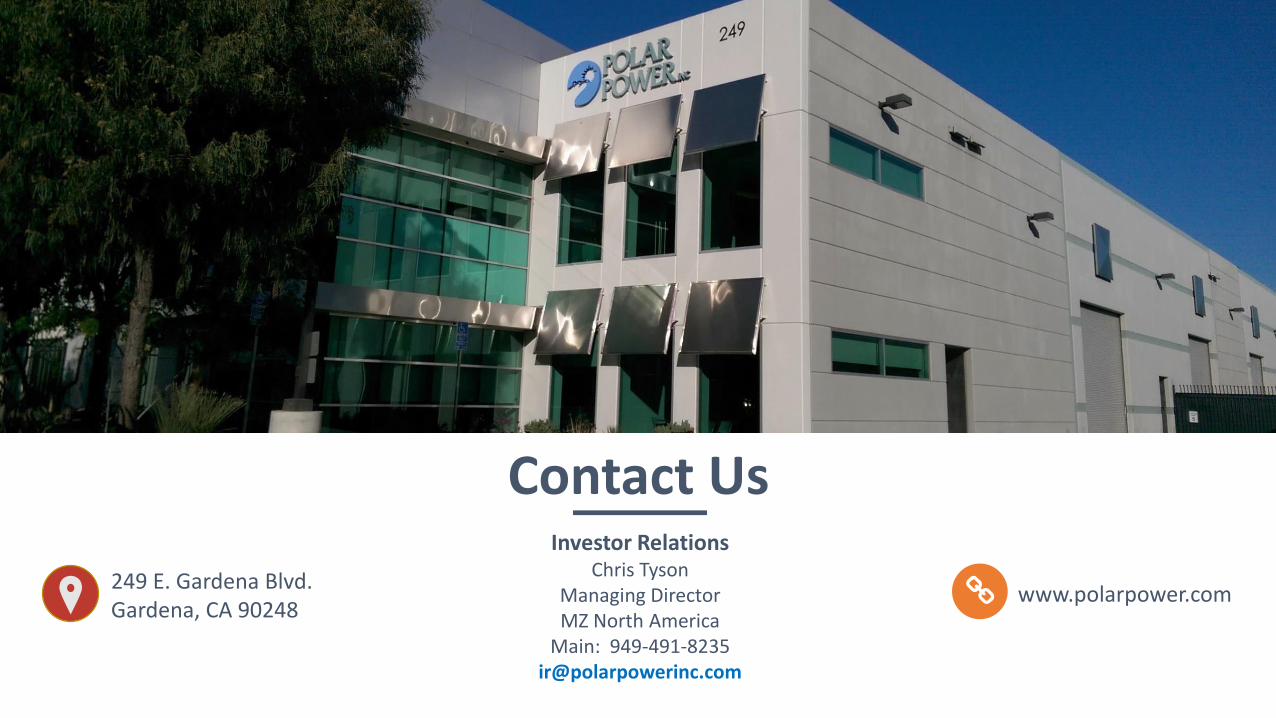
Contact Us
www.polarpower.com249 E. Gardena Blvd.Gardena, CA 90248
Investor RelationsChris Tyson
Managing Director MZ North America
Main: [email protected]
37
Other Projects Reflecting Market Opportunities and Polar Capabilities
Appendix
38
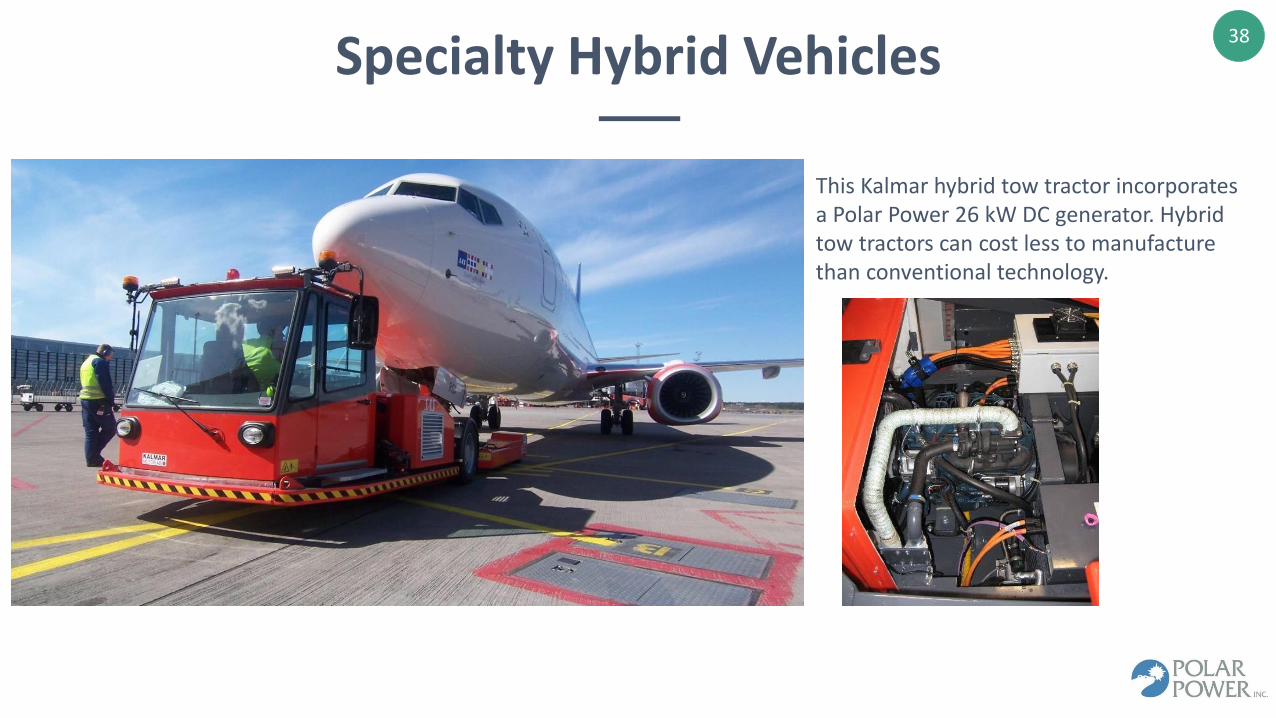
Specialty Hybrid Vehicles
This Kalmar hybrid tow tractor incorporates a Polar Power 26 kW DC generator. Hybrid tow tractors can cost less to manufacture than conventional technology.
39
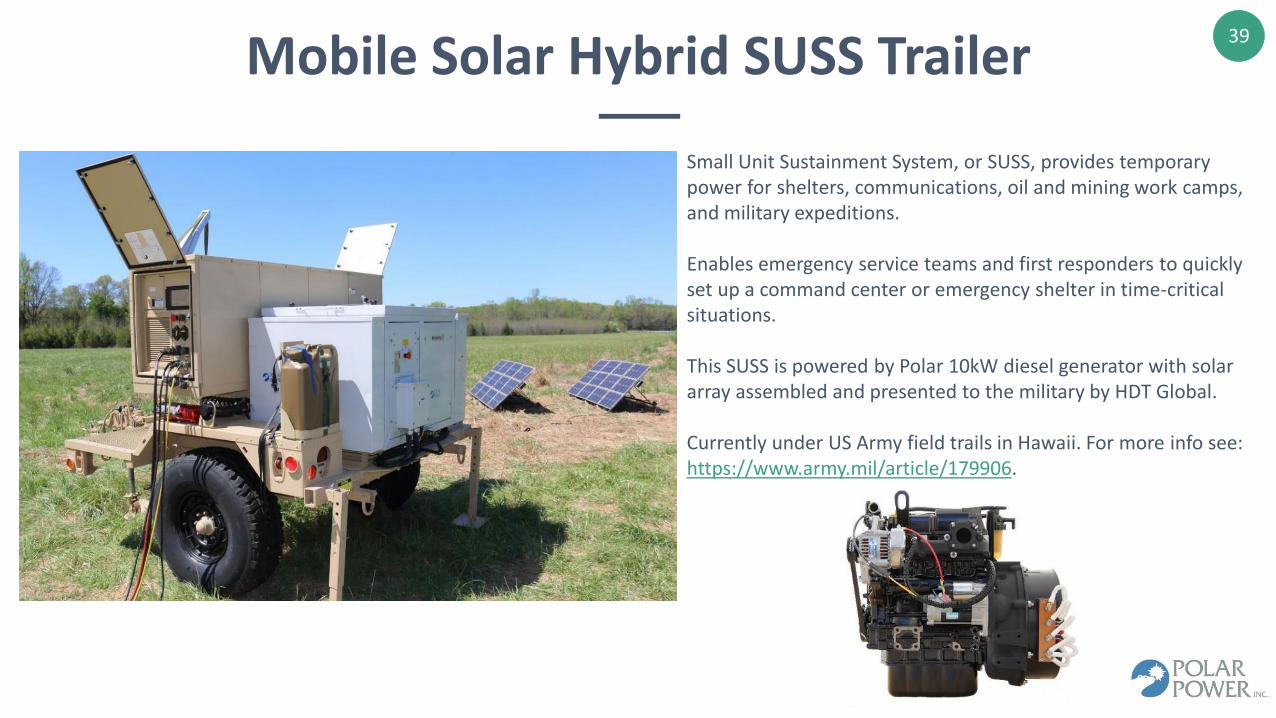
Mobile Solar Hybrid SUSS Trailer
Small Unit Sustainment System, or SUSS, provides temporary power for shelters, communications, oil and mining work camps, and military expeditions.
Enables emergency service teams and first responders to quickly set up a command center or emergency shelter in time-critical situations.
This SUSS is powered by Polar 10kW diesel generator with solar array assembled and presented to the military by HDT Global.
Currently under US Army field trails in Hawaii. For more info see: https://www.army.mil/article/179906.
40
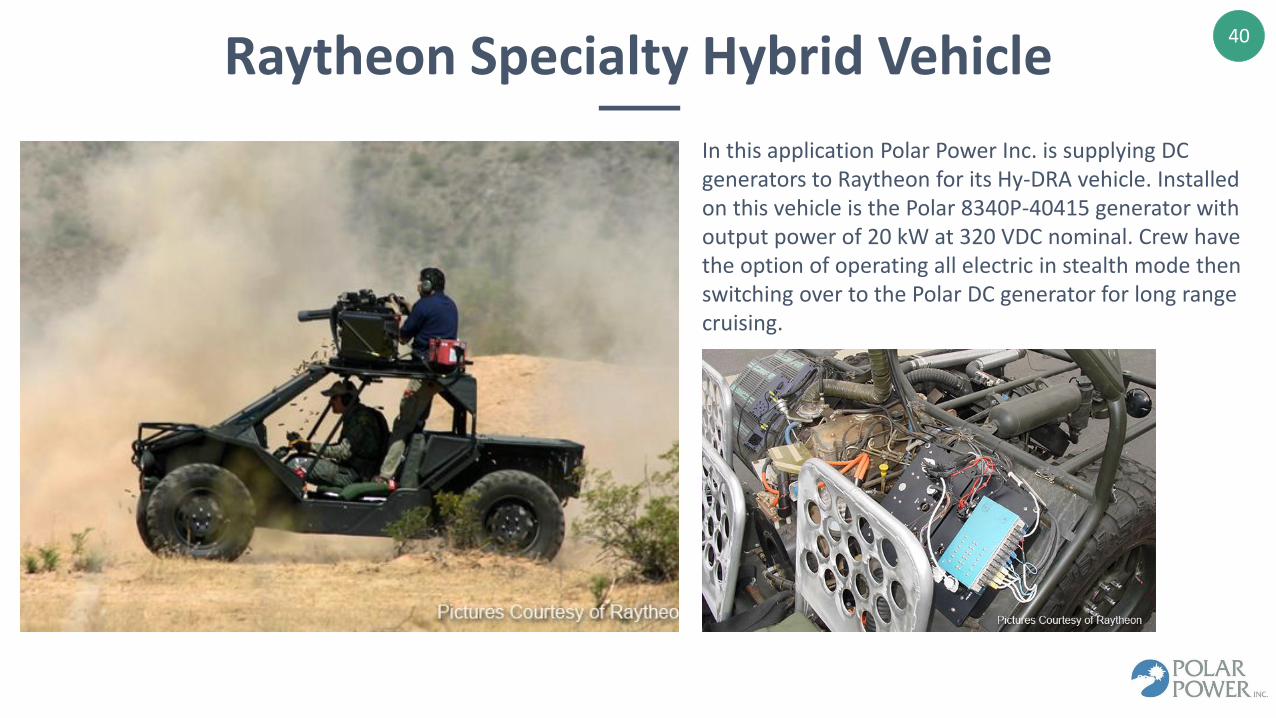
Raytheon Specialty Hybrid Vehicle
In this application Polar Power Inc. is supplying DC generators to Raytheon for its Hy-DRA vehicle. Installed on this vehicle is the Polar 8340P-40415 generator with output power of 20 kW at 320 VDC nominal. Crew have the option of operating all electric in stealth mode then switching over to the Polar DC generator for long range cruising.
41
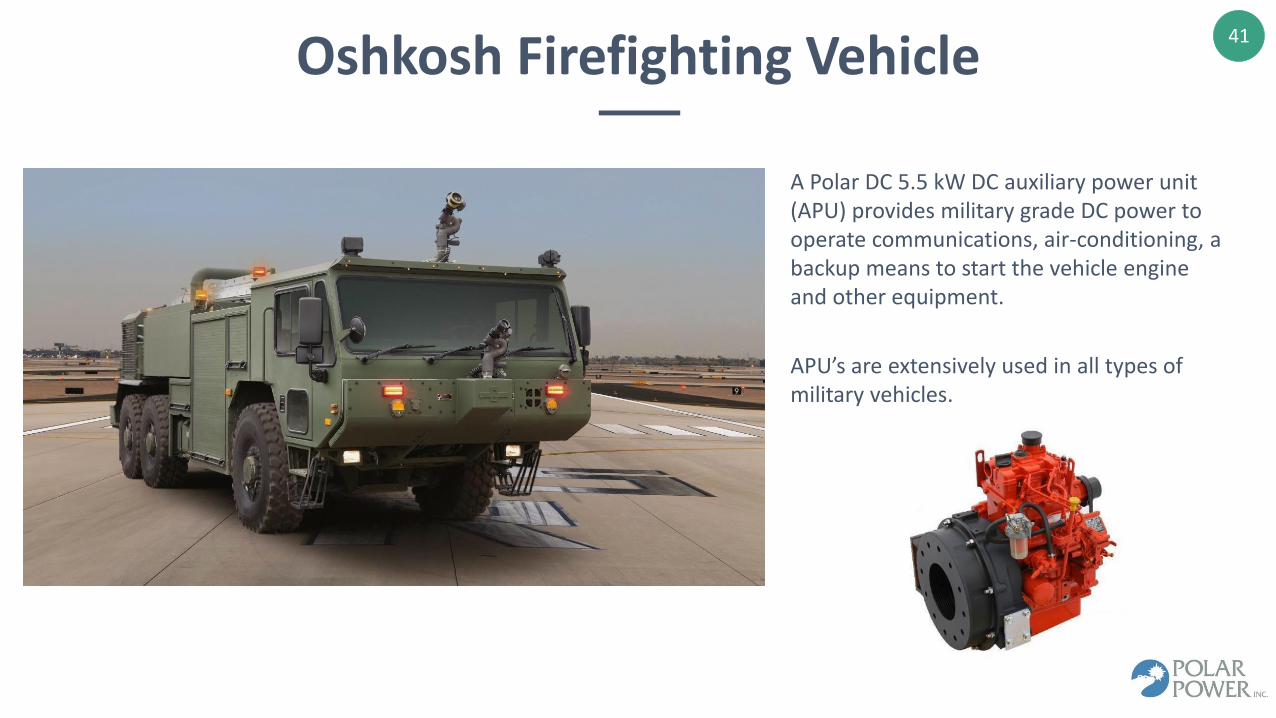
Oshkosh Firefighting Vehicle
A Polar DC 5.5 kW DC auxiliary power unit (APU) provides military grade DC power to operate communications, air-conditioning, a backup means to start the vehicle engine and other equipment.
APU’s are extensively used in all types of military vehicles.
42
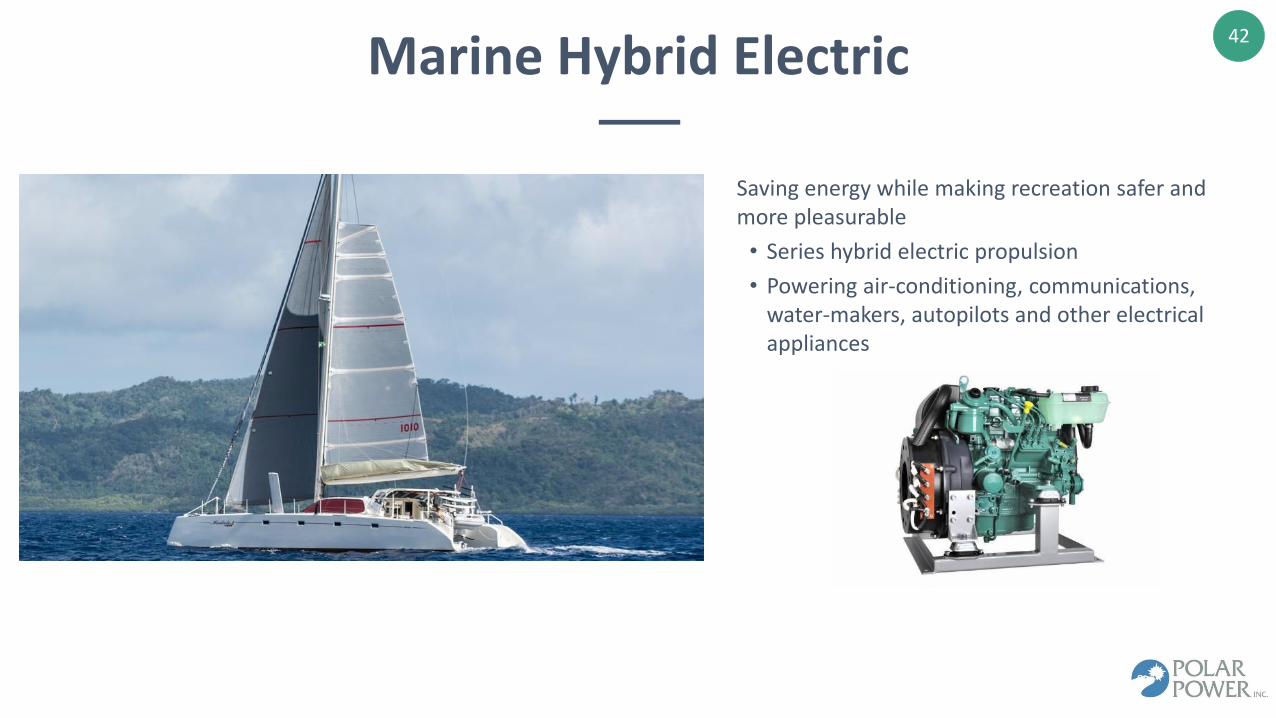
Marine Hybrid Electric
Saving energy while making recreation safer and more pleasurable
• Series hybrid electric propulsion
• Powering air-conditioning, communications, water-makers, autopilots and other electrical appliances
43
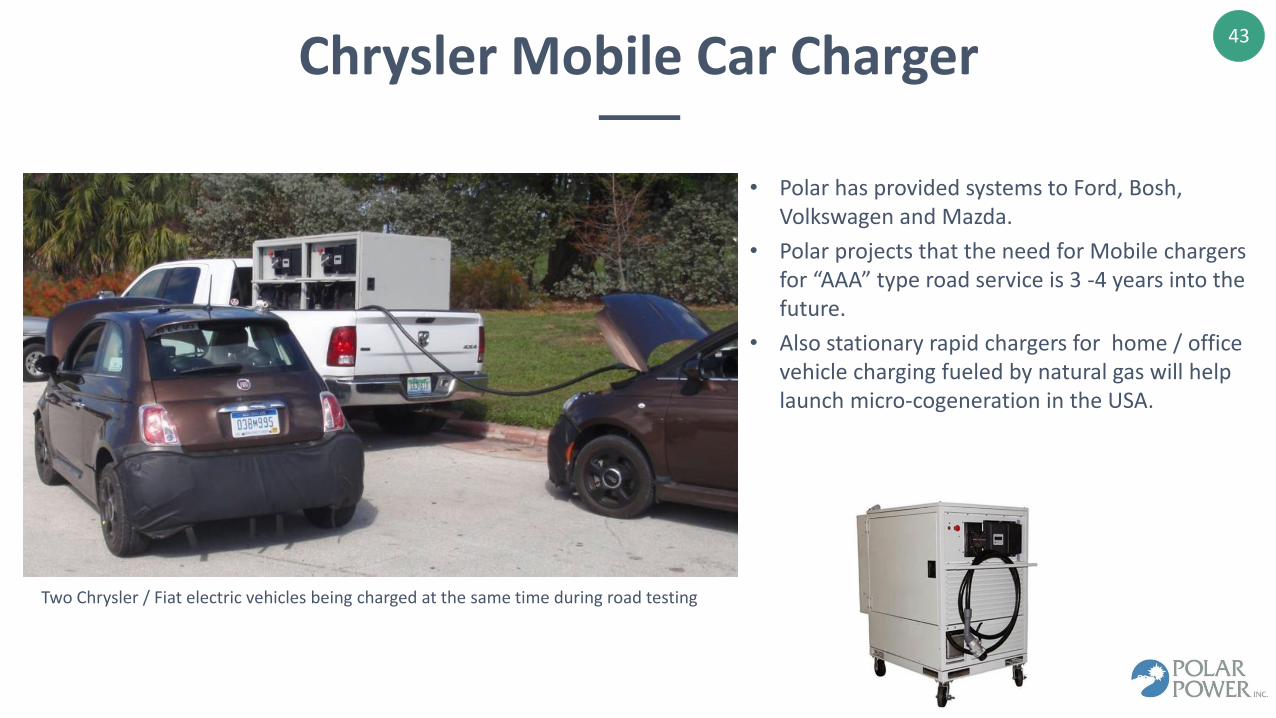
Chrysler Mobile Car Charger
• Polar has provided systems to Ford, Bosh, Volkswagen and Mazda.
• Polar projects that the need for Mobile chargers for “AAA” type road service is 3 -4 years into the future.
• Also stationary rapid chargers for home / office vehicle charging fueled by natural gas will help launch micro-cogeneration in the USA.
Two Chrysler / Fiat electric vehicles being charged at the same time during road testing