polaris consulting & services limitedpolarisft.com/investor/presentations/polaris q1 fy2017...
TRANSCRIPT
1
Polaris Consulting & Services Limited(BSE: 532254; NSE: POLARIS)
Q1 FY2017 Earnings Presentation
August 8, 2016

2
Performance Highlights: Q1 FY2017EARNINGS PRESENTATION
Net Revenue
Rs. 4,955 mn
+0.5% y-o-y
EBITDA
Rs. 587 mn
Margin: 11.8%
DSO
89 Days
(85 Days: Q1 FY2016)
PAT
Rs. 397 mn
Margin: 8.0%
Headcount
7,197
Attrition: 15.2%
CCE and Investments
Rs. 3,528 mn
(Rs. 4,265 mn: Q4 FY2016)

3
Management PerspectivesEARNINGS PRESENTATION
Commenting on results and developments Mr. Jitin Goyal, CEO and Executive Director said:
Commenting on results Mr. NM Vaidyanathan, Chief Financial Officer said:
Our revenue for the quarter remained relatively flat at Rs. 495.5 Cr. compared to Rs. 492.8 Cr. during the
same period last year in-spite of drop in revenue from our largest customer on account of the
productivity savings program which was partially offset by restatement of revenue recognised to comply
with IND-AS. Annual performance driven pay, bonus payments and tax payments made during the
quarter impacted our cash position. We anticipate our liquidity to improve in the coming months driven
by internal cash accruals with no significant capital expenditure planned in the near future.
As Virtusa and Polaris continue to integrate operations and marketing strategies, we have started to
experience early signs of synergic benefits. Going forward we anticipate that the combined capabilities of
both organisations will support Polaris’ endeavour to increase market share in the BFS vertical.
Furthermore, during the fiscal year 2017, our focus would be on digital banking transformation and
helping our clients reimagine the future of banking in a digital era.

4
Performance OverviewEARNINGS PRESENTATION
The Company has adopted Indian AS (IND AS) from Q1 FY2017; the y-o-y quarter financials has also been restated
using same accounting standards
Adoption of IND AS resulted in revenue and PAT by ~Rs. 170 mn and ~Rs. 85 mn, respectively, compared to IGAAP
PAT for the quarter benefitted from better operating profit coupled with higher other income
Cash and Cash equivalents & Investments was impacted due to annual performance driven pay, bonus payments
and advance tax payment
Performance Discussion
(Rs. million, unless stated)
Q1 y-o-y
Particulars FY2017 FY2016 Growth (%)
Net Revenue 4,955 4,928 0.5%
EBITDA 587 574 2.3%
Margin (%) 11.8% 11.6%
PAT 397 367 8.2%
Margin (%) 8.0% 7.4%
Basic EPS (Rs.) 3.92 3.67 6.7%

5
Q1 FY2017 Revenue Break-upEARNINGS PRESENTATION
Note:1. Fixed bid includes Fixed price
Revenue by Vertical Revenue by Service Offering
Revenue by Contract Type
1
Retail Banking
18%
Corporate Banking
18%Treasury & Capital
Markets51%
Insurance & others
13%
Fixed Bid38%
Time & Material
62%
App Maintenance
43%
App Development
43%
Testing 13%
Others1%

6
Operational MetricsEARNINGS PRESENTATION
Revenue Mix Utilization
Headcount1 Attrition2
Note:1. Excluding BPO and including vendors2. Voluntary attrition
1,571 1,580 1,538 1,549
6,077 6,158 6,003 5,648
7,648 7,738 7,541 7,197
Q2 FY16 Q3 FY16 Q4 FY16 Q1 FY17
Onsite Offshore Total Headcount
53.7% 53.4% 55.3% 55.2% 57.0%
46.3% 46.6% 44.7% 44.8% 43.0%
Q1 FY16 Q2 FY16 Q3 FY16 Q4 FY16 Q1 FY17
Onsite Offshore
13.0% 13.9%11.6%
15.2%
Q2 FY16 Q3 FY16 Q4 FY16 Q1 FY17
Attrition (annualized)
76.2%72.7% 72.4% 71.7%
91.0% 89.7% 90.8%88.2%
72.2%68.1% 67.5% 67.1%
Q2 FY16 Q3 FY16 Q4 FY16 Q1 FY17
Average Utilization Onsite Offshore

7
Operational MetricsEARNINGS PRESENTATION
DSO Cash & Cash Equivalent and Investments (Rs. mn)
Contribution by top ClientsClient Concentration
Q1 FY16 Q2 FY16 Q3 FY16 Q4 FY16 Q1 FY17
$1+ mn clients 24 21 21 25 24
$3+ mn clients 7 8 9 5 6
$5+ mn clients 6 7 7 9 8
$10+ mn clients 6 6 6 5 5
$25+ mn clients 1 1 1 1 1
8583
8178
89
Q1 FY16 Q2 FY16 Q3 FY16 Q4 FY16 Q1 FY17
DSO (Days)
39.2% 39.5% 41.1% 40.1%44.7%
53.1% 54.5% 56.3% 53.7%60.3%
Q1 FY16 Q2 FY16 Q3 FY16 Q4 FY16 Q1 FY17
Top 5 Top 10
3,185 2,941 4,079 4,265
3,528
Q1 FY16 Q2 FY16 Q3 FY16 Q4 FY16 Q1 FY17
Cash and Cash Equivalents & Investments

8
Factsheet

9
FactsheetEARNINGS PRESENTATION
Detailed Profit & Loss Statement
Profit & Loss Statement (Rs. mn) Q1 FY17 Q1 FY16 Y-o-Y Growth (%)
Income from operations 4,955.0 4,928.1 0.5%
Employee Cost (3,837.4) (3,802.9) 0.9%
% of Sales 77.4% 77.2%
Other Expenditures (530.5) (551.3)
EBITDA 587 574 2.3%
EBITDA Margin (%) 11.8% 11.6%
Depreciation and Amortisation (57.5) (67.5)
% of Sales 1.2% 1.4%
EBIT 529.7 506.4 4.6%
EBIT Margin (%) 10.7% 10.3%
Other Income 74.8 51.5
Exceptional Item 0.0 0.0
PBT 604.5 557.9 8.3%
PBT Margin (%) 12.2% 11.3%
Tax Expenses (205.5) (191.0)
Share of (profit)/loss of associate companies (1.7) 0.0
Minority Interest 0.0 0.1
PAT 397.2 367.1 8.2%
PAT Margin (%) 8.0% 7.4%
EPS:
Basic EPS (Rs.) 3.92 3.67 6.7%
Diluted EPS (Rs.) 3.88 3.65 6.3%

10
FactsheetEARNINGS PRESENTATION
Q1 FY16 Q2 FY16 Q3 FY16 Q4 FY16 Q1 FY17
Revenue By Vertical
Retail Banking 14% 15% 15% 16% 18%
Corporate Banking 22% 22% 21% 19% 18%
Treasury & Capital Markets 47% 47% 51% 52% 51%
Insurance & others 17% 16% 13% 13% 13%
Revenue by Service Offering:
App Maintenance 38% 39% 40% 42% 43%
App Development 46% 46% 46% 44% 44%
Testing 15% 14% 13% 13% 13%
Others 1% 1% 1% 1% 1%
Revenue by Product Type:
Fixed Bid 39% 39% 41% 41% 38%
Time & Material 61% 61% 59% 59% 62%
Revenue Mix:
Onsite 54% 53% 55% 55% 57%
Offshore 46% 47% 45% 45% 43%
Q1 FY16 Q2 FY16 Q3 FY16 Q4 FY16 Q1 FY17
Utilization:
Average Utilization 76% 73% 72% 72%
Onsite 91% 90% 91% 88%
Offshore 72% 68% 68% 67%
Clients:
Top client 39% 40% 41% 40% 45%
Top 10 clients 53% 54% 56% 54% 60%
US$ 1+ Mn accounts 24 21 21 25 24
US$ 3+ Mn accounts 7 8 9 5 6
US$ 5+ Mn accounts 6 7 7 9 8
US$ 10+ Mn accounts 6 6 6 5 5
US$ 25+ Mn accounts 1 1 1 1 1
Headcount:
Total Headcount 7,305 7,648 7,738 7,541 7,197
Onsite 1,540 1,571 1,580 1,538 1,549
Offshore 5,765 6,077 6,158 6,003 5,648
Attrition (Annualized) 18% 16% 18% 23%
Cash:
Cash, Cash Equivalents & Investments (Rs. Mn)
3,185 2,941 4,079 4,265 3,528
DSO (days) 85 83 81 78 89

11
Polaris at GlanceEARNINGS PRESENTATION
About Polaris Consulting & Services Ltd. (“Polaris”)
o Founded in 1993; Listed on NSE and BSE, Polaris has a market capitalization of around Rs. 2,000 Cr.
o As on June 30, 2016, the Company has 7,197 employees (excluding BPO division)
o Strong balance sheet with zero debt
Specialization
o Polaris is a niche and leading player in the financial technology space
o Major customers include Citibank, Bank of Montreal, JPMC, Lloyds, M&T Bank, RBS, Morgan Stanley and Credit Suisse
o Consistently awarded CMMI Level 5 certification starting from 2001
Recent Developments
o Virtusa Consulting Services Private Limited (“Virtusa”) acquired 52.9% of the total outstanding share capital of the Company in March 2016. Further in April 2016, pursuant to an Open Offer, Virtusaacquired 26.0% stake taking their total stake to 78.9% of the outstanding share capital
o During Q4 FY2016, Polaris entered into a Business Transfer Agreement to transfer all its BPO business as a going concern
12
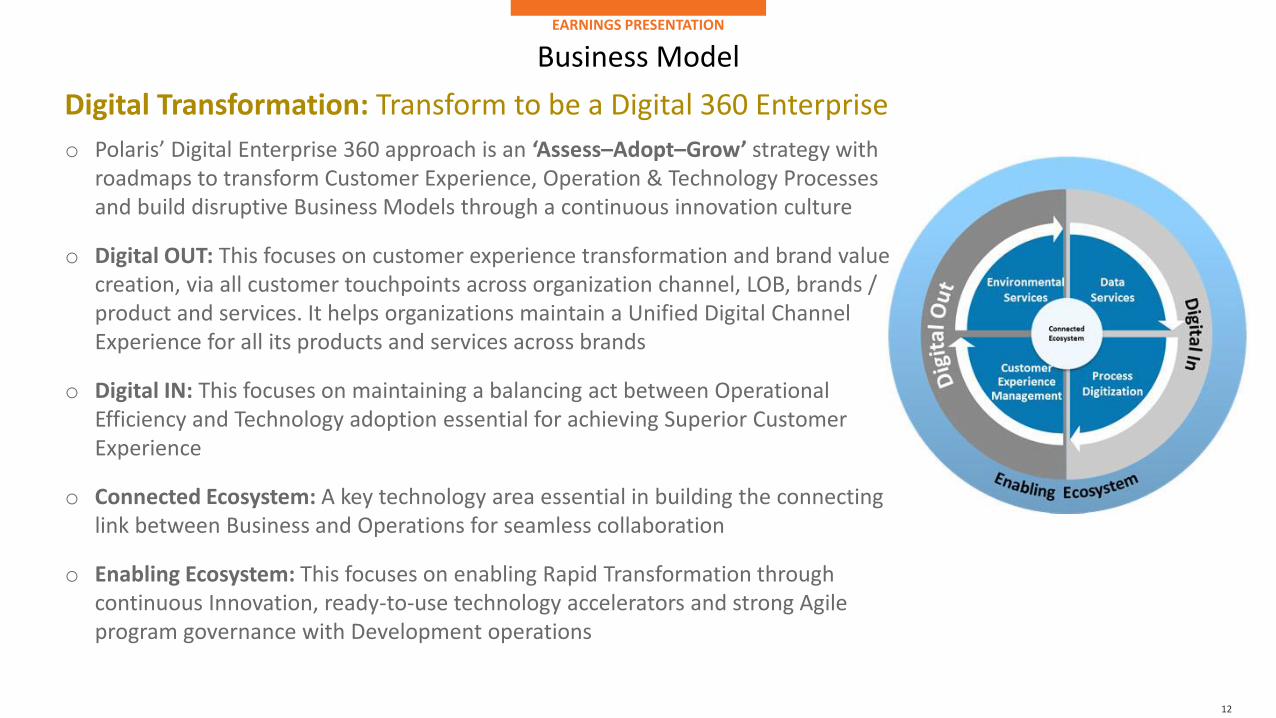
Business ModelEARNINGS PRESENTATION
Digital Transformation: Transform to be a Digital 360 Enterprise
o Polaris’ Digital Enterprise 360 approach is an ‘Assess–Adopt–Grow’ strategy with roadmaps to transform Customer Experience, Operation & Technology Processes and build disruptive Business Models through a continuous innovation culture
o Digital OUT: This focuses on customer experience transformation and brand value creation, via all customer touchpoints across organization channel, LOB, brands / product and services. It helps organizations maintain a Unified Digital Channel Experience for all its products and services across brands
o Digital IN: This focuses on maintaining a balancing act between Operational Efficiency and Technology adoption essential for achieving Superior Customer Experience
o Connected Ecosystem: A key technology area essential in building the connecting link between Business and Operations for seamless collaboration
o Enabling Ecosystem: This focuses on enabling Rapid Transformation through continuous Innovation, ready-to-use technology accelerators and strong Agile program governance with Development operations

13
Safe Harbor StatementEARNINGS PRESENTATION
Certain statements in this presentation concerning our future prospects are forward-looking statements. Forward-looking statements by their natureinvolve a number of risks and uncertainties that could cause actual results to differ materially from market expectations. These risks anduncertainties include, but are not limited to our ability to manage growth, intense competition among Indian and overseas IT companies, variousfactors which may affect our cost advantage, such as wage increases or an appreciating Rupee, our ability to attract and retain highly skilledprofessionals, time and cost overruns on fixed-price, fixed-time frame contracts, client concentration, restrictions on immigration, our ability tomanage our international operations, reduced demand for technology in our key focus areas, disruptions in telecommunication networks, our abilityto successfully complete and integrate potential acquisitions, liability for damages on our service contracts, the success of the companies in whichPolaris has made strategic investments, withdrawal of governmental fiscal incentives, political instability, legal restrictions on raising capital oracquiring companies outside India, unauthorized use of our intellectual property and general economic conditions affecting our industry. Polaris may,from time to time, make additional written and oral forward-looking statements, including our reports to shareholders. These forward-lookingstatements represent only the Company’s current intentions, beliefs or expectations, and any forward-looking statement speaks only as of the dateon which it was made. The Company assumes no obligation to revise or update any forward-looking statements.

14
© 2016 Virtusa Corporation. All rights reserved. VirtusaPolaris and all other related logos are either registered trademarks or trademarks of Virtusa Corporation in the United States, the European Union, and/or India. All other company and service names are the property of their respective holders and may be registered trademarks or trademarks in the United States and/or other countries.
Contact Details:
NM Vaidyanathan, [email protected] Consulting & Services LimitedPolaris House, 244, Anna SalaiChennai - 600006Phone: +91 44 3987 4000
Bijay Sharma, Churchgate [email protected]: +91 22 6169 5988Thank you