polaris industries inc. investor...
TRANSCRIPT

Investor Presentation
June 7, 2016
POLARIS INDUSTRIES INC.

CORPORATE OVERVIEW – 20152015 Sales by Reporting Segments*1954 Year Polaris was Founded
~8,100 Employees Worldwide
16 Manufacturing Locations
5 Research & Development Centers
~1,800 Dealers In North America
~1,700 Dealers Outside North America
>390,000 Units Shipped Worldwide
>100 Countries – Polaris Products Sold
Building a Highly Profitable Global EnterpriseIR JUNE 7 2016 2
78%15%
7%78%
14%
8%
Int’l
Canada
United States
Global AdjacentMarkets
Motorcycles
Off-RoadVehicles/
Snow
*PG&A included in respective segments
BILLION UP
2015 Sales by Geography

Grew Full Year Sales 5%; Net income flatAll businesses gained market share in 2015International sales down 5% (up 10% excluding currency)
Constant Currency: EMEA +2%; Latin America +66%; Asia Pacific +21%; Pretax Income included ~$70 million of negative currency
Earnings per share up 2% to $6.75Repurchased 2.2 million shares for $294 millionNet income margin down 49 bps from 2014
$4,479.6 $4,719.3
FY 2014 FY 2015
$454.0 $455.4
FY 2014 FY 2015
Grew Market Share in All Businesses Despite Tough Economic Headwinds
Net IncomeTotal Company Sales
3IR JUNE 7 2016
2015 SALES & NET INCOME
78% 15%
7%
Motorcycles
Adjacent Markets
FY 2015 Sales by Reporting Segments
(includes respective PG&A)
ORV / Snowmobiles
($ millions) ($ millions)

Company Performance Below Expectations4IR JUNE 7 2016
WHAT WENT WELLINTERNAL FACTORSEXTERNAL FACTORS
STRENGTHENING DOLLARUS Canda Euro
OIL & AG COMMODITIES DOWNSoft retail in oil states
MORE COMPETITIVE OFFERINGSHonda, BRP, John Deere
, Yamaha
MILD WINTERSnowmobile market weak
PAINT ISSUESScout / Slingshot delays
INVENTORY TOO HIGHFactory and Dealer
INCONSISTENT QUALITYRecalls
POOR FORECASTING / EXECUTIONGuidance revision in Q4
INDIAN GROWTHRetail ~80% for 2015
SLINGSHOT GROWTH / PROFITABILITYSales well north of $100 million in year one
POWERSPORTS SHARE GAINSGrew for 7th straight year
LEAN / VIP ACCELERATIONOver 900 VIP projects in pipeline
2015 PERFORMANCE – WHAT HAPPENED?
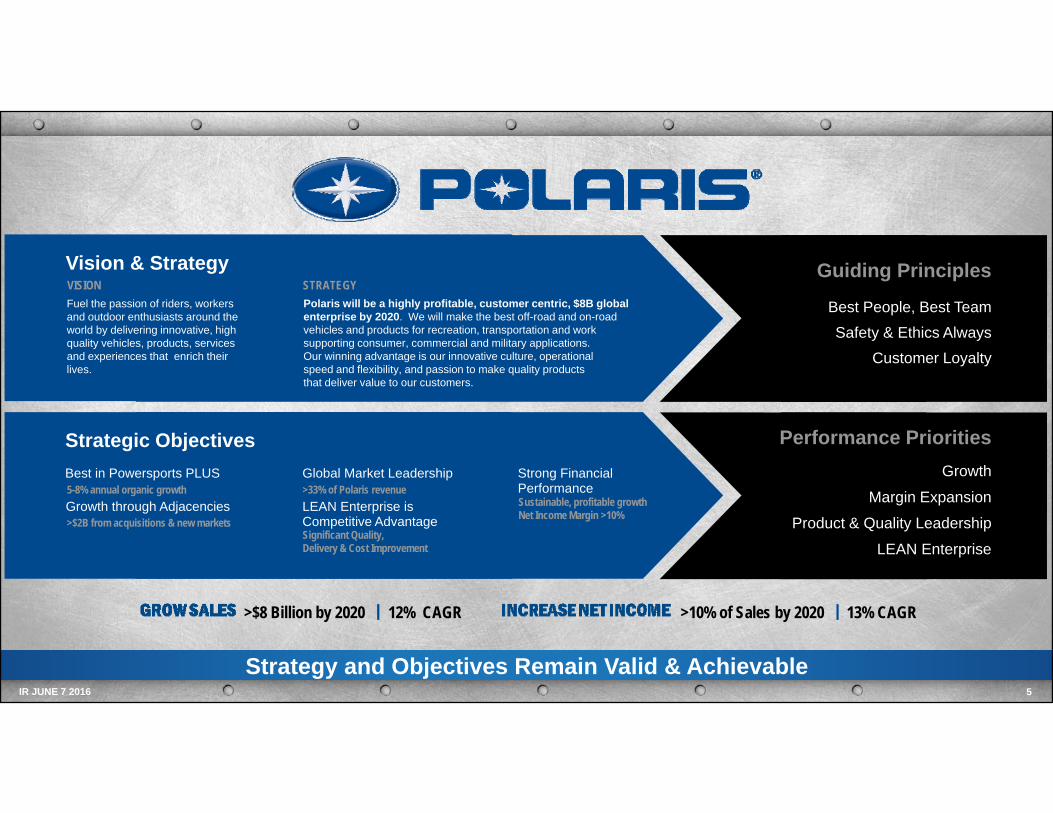
Strategic Objectives
Vision & StrategyVISIONFuel the passion of riders, workers and outdoor enthusiasts around the world by delivering innovative, high quality vehicles, products, services and experiences that enrich their lives.
STRATEGYPolaris will be a highly profitable, customer centric, $8B global enterprise by 2020. We will make the best off-road and on-road vehicles and products for recreation, transportation and work supporting consumer, commercial and military applications. Our winning advantage is our innovative culture, operational speed and flexibility, and passion to make quality productsthat deliver value to our customers.
Best in Powersports PLUS
Growth through Adjacencies5-8% annual organic growth
>$2B from acquisitions & new markets
Global Market Leadership
LEAN Enterprise is Competitive Advantage
>33% of Polaris revenue
Significant Quality, Delivery & Cost Improvement
Strong Financial PerformanceSustainable, profitable growthNet Income Margin >10%
Guiding Principles
Best People, Best Team Safety & Ethics Always
Customer Loyalty
Performance PrioritiesGrowth
Margin Expansion
Product & Quality Leadership
LEAN Enterprise
>$8 Billion by 2020 12% CAGR >10% of Sales by 2020 13% CAGR
5IR JUNE 7 2016
Strategy and Objectives Remain Valid & Achievable

ORV/Snowmobiles Down Modestly, Motorcycles Unchanged; GAM Increased6IR JUNE 7 2016
Global Adjacent MarketsMotorcyclesORV / Snowmobiles
2015Reported
2016Guidance
2015Reported
2016Guidance
2015Reported
2016Guidance
2016 SALES GUIDANCE BY REPORTING SEGMENTS*
$698.3
Uphigh-teens %(unchanged)
IndianVictory
Slingshot
IndianVictory
Slingshot
PG&A
PG&A
PG&APG&A
W&TDefense
W&TDefense
Up high-single digits %
(increased)
Down low to mid-single
digits %(decreased)
ORV ORV
PG&APG&A
Snow
$3,708.9
$312.1
($ millions)
Snow
*Guidance unchanged as disclosed on 4/21/16
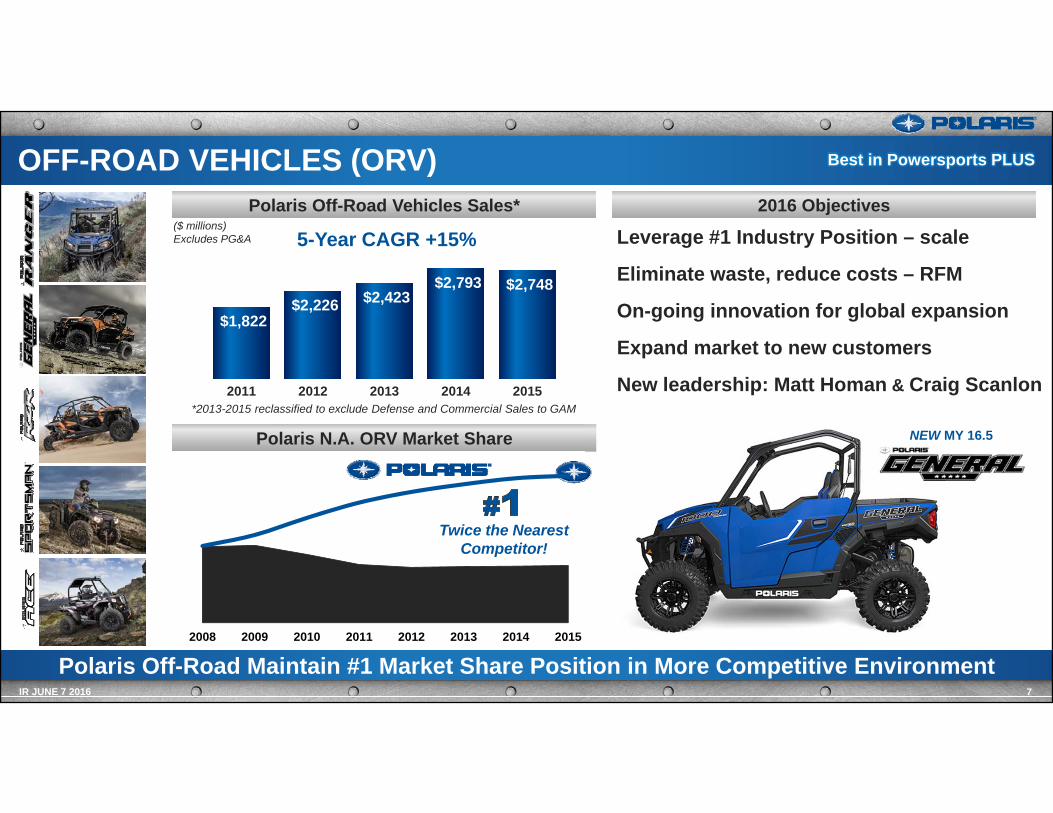
$1,822 $2,226 $2,423
$2,793 $2,748
2011 2012 2013 2014 2015
OFF-ROAD VEHICLES (ORV)
7IR JUNE 7 2016
2016 ObjectivesPolaris Off-Road Vehicles Sales*
Polaris N.A. ORV Market Share
Polaris Off-Road Maintain #1 Market Share Position in More Competitive Environment
($ millions)Excludes PG&A
Twice the Nearest Competitor!
Leverage #1 Industry Position – scale
Eliminate waste, reduce costs – RFM
On-going innovation for global expansion
Expand market to new customers
New leadership: Matt Homan & Craig Scanlon
2008 2009 2010 2011 2012 2013 2014 2015
Best in Powersports PLUS
5-Year CAGR +15%
NEW MY 16.5
*2013-2015 reclassified to exclude Defense and Commercial Sales to GAM

2013 2014 2015 2013 2014 2015 2013 2014 2015
MOTORCYCLES
8IR JUNE 7 2016
2016 ObjectivesMotorcycle Vehicle SalesIndian® “Legendary” / Victory® “American Muscle”
Broaden product lineExpand dealer network Accelerate accessories growth
Slingshot®
Broaden consumer baseBuild upon first mover advantageGrow globallyEnhance dealer engagement
Total Motorcycle Market Share 2013 - 2015
Motorcycle Growth Continues; Production Constraints Resolved
Acquired2011
Est. 2014
1.8PTS2013 to 2015
Indian MotorcycleHarley-Davidson Japanese Top 4
3.6PTS2013 to 2015
0.5PTS2013 to 2015
$134 $196 $220 $349
$608
2011 2012 2013 2014 2015
Best in Powersports PLUS
MY’17 Victory Octane™(Mid-sized)
MY 16.5 Slingshot®
White Pearl SL LE(Moto-Roadster)
MY’16 Indian Springfield™ (Bagger/Touring)
5-Year CAGR +50%($ millions)Excludes PG&A

SNOWMOBILES
9IR JUNE 7 2016
2016 ObjectivesSnowmobile Vehicle SalesIndustry-leading quality
Grow Timbersled™ category
Leverage platform commonality
Continue to grow Market Share
Introduced 7 new MY’17 snowmobiles in March (+4 Limited Editions)
6-Year Market Share Pts. Growth – N.A.
Strong #2 and Gaining Share in N.A.
8 pts(’15/’16 season vs. ’09/’10)
$280 $283$302
$322 $323
2011 2012 2013 2014 2015
$ in
Mill
ions
Best in Powersports PLUS
5-Year CAGR +11%($ millions)Excludes PG&A

PARTS, GARMENTS & ACCESSORIES (PG&A)
10IR JUNE 7 2016
2016 ObjectivesPG&A Sales – All Businesses
Grow Core PG&A globally
Build aftermarket brands
Expand digital shopping experience
Refine retail transformation model (SMART)
FY 2015 Sales by Segment & Category
Accelerate Core Growth / Broaden Aftermarket Offerings
Cor
e Po
laris
PG
&A
Bra
nds
Afte
rmar
ket B
rand
s
$408 $461$611
$742 $781
2011 2012 2013 2014 2015
($ millions)
82%
11%7%
Motorcycles
Adjacent Markets
ORV / Snowmobiles
Apparel
53%
39% 8%
Accessories
Parts
Best in Powersports PLUS
5-Year CAGR +18%
Accessorized RANGER Crew® XP-900 With Lock & Ride® Pro-Fit Cab System

People Movers
Light Duty Haulers
Industrial
EQC
Golf
GLOBAL ADJACENT MARKETS
11IR JUNE 7 2016
2016 ObjectivesGlobal Adjacent Markets Vehicle Sales*Aixam grows #1 market share . . . AgainExpand commercial sales / improved executionLeverage installed baseAdd scale / capability through M&AObtain program of record (Military)
Work & Transportation / Military ORV Markets
Building Businesses for Future Growth / Profitability
Growth Through Adjacencies
$81 $110
$221$270 $260
2011 2012 2013 2014 2015
Wor
k &
Tra
nspo
rtat
ion
Mili
tary
$600+ Million Market
Very-light Ultra-light
COTS(Commercial off the shelf)
$4+ Billion Market
5-Year CAGR +46%
Acquired March 2016
*2013-2015 reclassified to include Defense and Commercial Sales
($ millions)Excludes PG&A
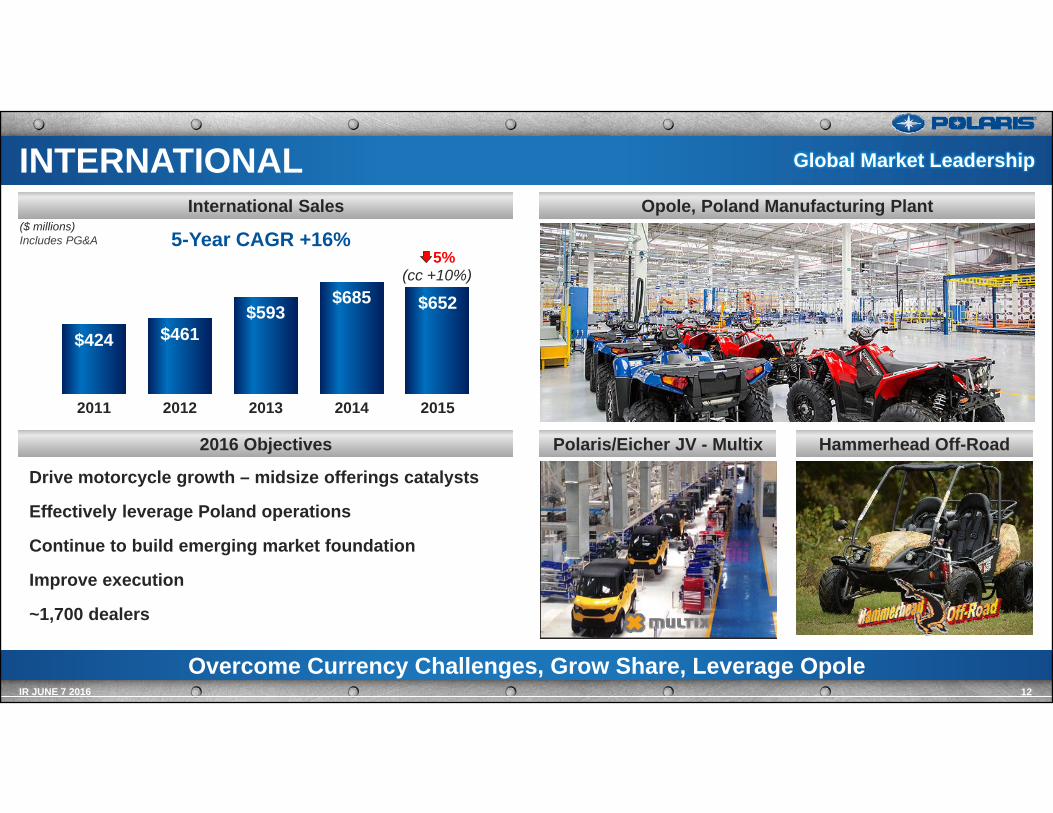
Overcome Currency Challenges, Grow Share, Leverage Opole12IR JUNE 7 2016
INTERNATIONAL
$424 $461$593
$685 $652
2011 2012 2013 2014 2015
5%(cc +10%)
($ millions)Includes PG&A
2016 Objectives
Drive motorcycle growth – midsize offerings catalysts
Effectively leverage Poland operations
Continue to build emerging market foundation
Improve execution
~1,700 dealers
International Sales Opole, Poland Manufacturing Plant
Hammerhead Off-RoadPolaris/Eicher JV - Multix
Global Market Leadership
5-Year CAGR +16%

Lean Delivers Sustainable Profitable Growth and Competitive Advantage13IR JUNE 7 2016
LEAN ENTERPRISELean drives continuous improvement across the business.
Customer Value, Flow, Pull, Standardized Work, Waste Elimination, Built-in Quality and Speed
RFM Commercial Model
Lean Product Development
Lean Business Process
Plant Lean
Lean Material Flow
OUT INConsumer & Dealer Pull
1 2 3 4 5
SxS to RFM in 2H 2016 Start of ProductionQ2 2016
>$100 Million VIPCost Down Opportunity
Lean Business ProcessImprov’t
Lean PDPRFM - Order to Delivery
Distribution Plant Network
Supply Chain
Dealers
Huntsville Lean
LEAN Enterprise is Competitive Advantage
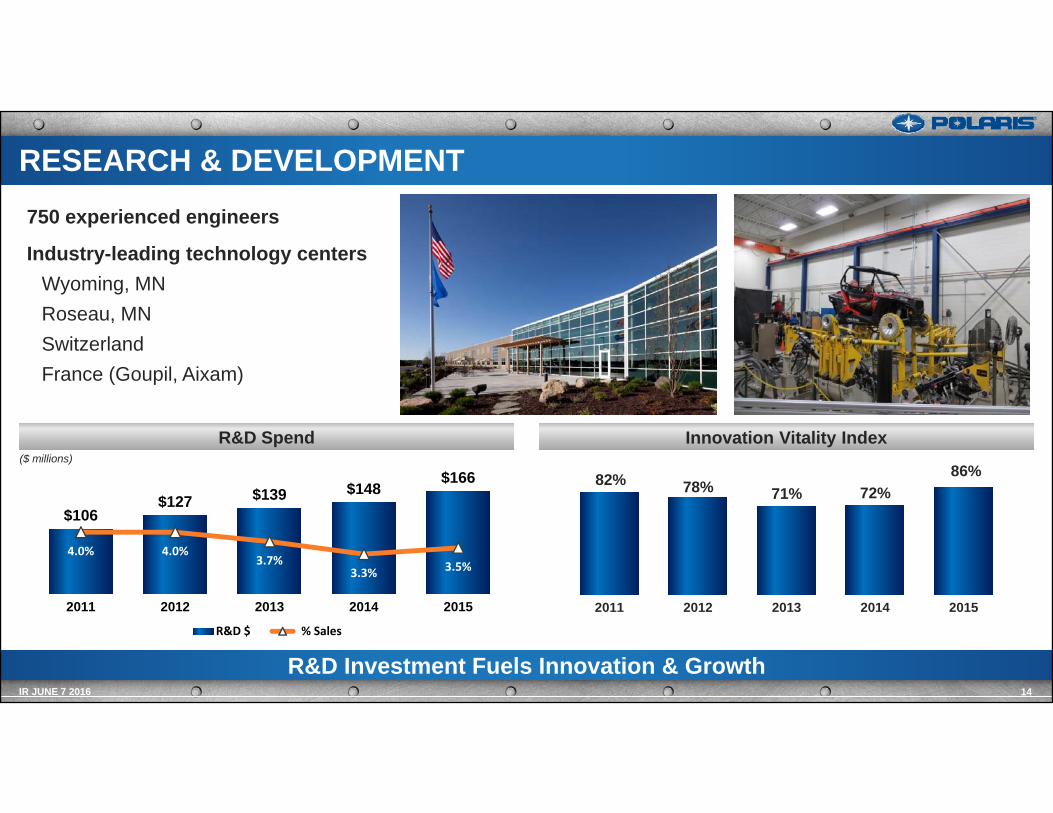
750 experienced engineers
Industry-leading technology centersWyoming, MNRoseau, MNSwitzerland France (Goupil, Aixam)
R&D Investment Fuels Innovation & Growth
Innovation Vitality IndexR&D Spend
14IR JUNE 7 2016
RESEARCH & DEVELOPMENT
$106$127 $139 $148
$166
4.0% 4.0%3.7%
3.3% 3.5%
2011 2012 2013 2014 2015
R&D $ % Sales
82% 78% 71% 72%86%
2011 2012 2013 2014 2015
($ millions)

725,000 sq. ft. manufacturing plantInitially produce RANGER® SxS; Slingshot® to start in Q3 2016
~1,700 employees at capacity
~$150 million investment
Provides capacity, flexibility and improved efficiencies
Incorporates most advanced lean flow processes and industry-leading technologies
Huntsville Production to Start in Q2 2016 as Planned15IR JUNE 7 2016
NEW MANUFACTURING FACILITY – HUNTSVILLE, AL LEAN Enterprise is Competitive Advantage

Difficult / Decent Start to YearSales & Earnings down- on guidance; Indian outpacing industry; ORV catching up; Recall
Variability too ConsistentMonth-to-month, region-to-region demand shifts challenging
Lean Enterprise Traction BuildingVIP cost initiatives; Inventory reduction; Standard work & waste elimination
Executing RZR Recall Q2 PriorityCustomer safety / back to riding #1 focus; Retail & production plans in place
Regain Momentum in Growing Powersports IndustryAggressively protecting #1 share position
R&D and Growth Investments OngoingProducts / services and acquisition pipeline active
All Out Assault on Cost & Working to Make Growth Happen16IR JUNE 7 2016
Q1 2016 Comments

ORV sales softer than previously anticipatedPoor weather, RZR recall, slow dealer floor traffic
ORV/Snowmobile segment sales now trending in the range of down high-single digits %
Gross margin pressure due to mix, plus potential increased recall costsGross Margin % trending similar to Q1 2016
Dealer inventory health remains a top priority
Motorcycle segment growth expected to continue
17Baird Conf 6-7-16
Q2 2016 Update
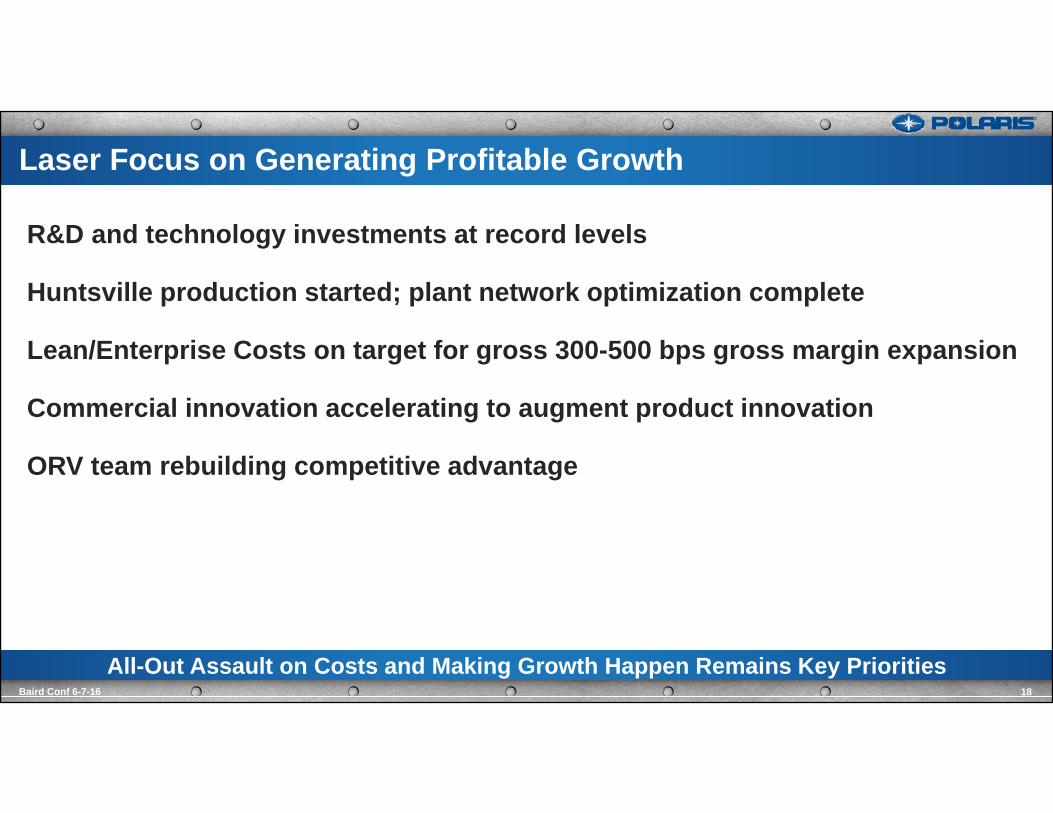
R&D and technology investments at record levels
Huntsville production started; plant network optimization complete
Lean/Enterprise Costs on target for gross 300-500 bps gross margin expansion
Commercial innovation accelerating to augment product innovation
ORV team rebuilding competitive advantage
All-Out Assault on Costs and Making Growth Happen Remains Key Priorities 18Baird Conf 6-7-16
Laser Focus on Generating Profitable Growth

Except for historical information contained herein, the matters set forth in this document, including but not limited to management’s expectations regarding 2016 sales, shipments, margins, currencies, net income and cash flow, the opportunities for expansion anddiversification of the Company’s business and the Company’s guidance on earnings per share are forward-looking statements that involve certain risks and uncertainties that could cause actual results to differ materially from those forward-looking statements. Potential risks and uncertainties include such factors as product offerings, promotional activities and pricing strategies by competitors; manufacturing operation expansion initiatives; acquisition integration costs; warranty expenses; foreign currency exchange rate fluctuations; environmental and product safety regulatory activity; effects of weather; commodity costs; uninsured product liability claims; uncertainty in the retail and wholesale credit markets; performance of affiliate partners; changes in tax policy and overall economic conditions, including inflation, consumer confidence and spending and relationships with dealers and suppliers. Investors are also directed to consider other risks and uncertainties discussed in our 2015 annual report and Form 10-K filed by the Company with the Securities and Exchange Commission. The Company does not undertake any duty to any person to provide updates to its forward-looking statements.
The data source for retail sales figures included in this presentation is registration information provided by Polaris dealers in North America and compiled by the Company or Company estimates. The Company must rely on information that its dealers supply concerning retail sales, and other retail sales data sources and this information is subject to revision.
Non-GAAP Measure - Constant Currency Reporting. This presentation includes information regarding the Company’s 2015 results and 2016 expectations on a constant currency basis, which is a non-GAAP measure, as well as on a GAAP basis. For purpose of comparison, the results on a constant currency basis uses the respective prior year exchange rates for the comparative period to enhance thevisibility of the underlying business trends, excluding the impact of translation arising from foreign currency exchange rate fluctuations.
19IR JUNE 7 2016
SAFE HARBOR
CONSISTENT FINANCIAL PERFORMANCE
Q1 2016 SALES & NET INCOME
Q1 2016 N.A. RETAIL SALES & DEALER INVENTORY
2016 FULL YEAR DETAILED GUIDANCE
2016 FULL YEAR GROSS PROFIT MARGIN GUIDANCE
FOREIGN CURRENCIES EXPOSURES FOR POLARIS
POLARIS FINANCIAL POSITION
FACTORY INVENTORY
TAYLOR-DUNN ACQUISITION
POLARIS CUSTOMER USAGE PROFILES
MANUFACTURING LOCATIONS
20IR JUNE 7 2016
APPENDICES

72% 77% 79%53%
66%
Polaris PeerAvg.*
S&P500
Russell2000
DJIA
$194 $230
$644
$209
$433
2011 2012 2013 2014 2015 2016
Dividends Repurchases
Return on Invested CapitalSales & Earnings Per Share
33%$2,657
21%$3,210
18%$3,777
19%$4,480
5%$4,719 2% to 3%
$3.20$4.40
$5.40$6.65 $6.75
2011 2012 2013 2014 2015 2016
Sales EPS
39% 40% 39% 38%32%
12%20%
26%
16% 13%
9% 9% 9% 9% 8%2011 2012 2013 2014 2015
Polaris Peer Average* S&P 500 Average
Strong Balance Sheet & Cash Flow Generation
Dividends & Share Repurchase5-Year Total Return
21IR JUNE 7 2016
FINANCIAL STRENGTH & FLEXIBILITY
Dividend 4%More AggressiveShare Buyback
Expectations
($ millions)
*PEERS: ACAT, BC, DE, DOO, HOG, WGO, TTC
Industry-Leading!
June 2, 2011 – June 2, 2016(Including Dividend Yield)
5-Year CAGR: Sales 19%, EPS 26%
Guidance
$6.20 TO
$6.80
($ millions)

Q1 sales and net income in-line with guidanceORV/Snowmobile sales down 9%; Motorcycles up 18%; Global Adjacent Markets down 5%
Results include ~$30 million of additional costs: product liability, warranty, acquisition related costs and severance accruals
Earnings per share decreased 45% to $0.71Gross profit margin down 324 bps from negative currency, mix and higher warranty
N.A. dealer inventory levels down 1%ORV down 10 percent
Q1 Results In-line with Expectations
Q1 2016 Net IncomeQ1 2016 Sales
22IR JUNE 7 2016
Q1 2016 SALES & NET INCOME
$1,033.3 $983.0
Q1 2015 Q1 2016
$88.6
$46.9
Q1 2015 Q1 2016
($ millions) ($ millions)

Polaris N.A. retail 6% for Q1 2016 vs. Q1 2015Polaris held Powersports share – remains clear #1
North American Industry improved sequentially vs. Q4; Q1 similar to Polaris
Polaris Q1 2016 N.A. dealer inventory 1% vs. Q1 2015ORV 10% year-over-year; RANGER®, RZR® and ATVs all declinedMotorcycles significantly as expected, near targeted levelsSnowmobiles low-twenties % due to lower snowfall in key regions
RFM business model re-engaged for motorcycles; ATVs working well; SxS to convert in Q4 2016
+8%+11%
+7%
-6%+6%
Q1 2015 Q2 2015 Q3 2015 Q4 2015 Q1 2016
Retail Improved; Dealer Inventory Down vs. Q1 2015
N.A. Dealer InventoryPolaris Retail Sales
23IR JUNE 7 2016
N.A. POWERSPORTS RETAIL SALES: Q1 2016
Q1 2015 Q1 2016
-12% Existing ORV Models 4% New ORV models2% Snowmobiles5% Slingshot/Indian0% New Dealers
-1% Total Increase
-1%

Earnings Per Share (diluted)Gross Profit Margin
24IR JUNE 7 2016
Total Company Sales
$4,719
2015 Actual FY 2016Guidance
28.4%
2015 Actual FY 2016Guidance
2016 Sales & Earnings Guidance Remains Unchanged
$6.75
2015 Actual FY 2016Guidance
AssumptionsProtect market shareDealer inventory about flat
Segment ExpectationsORV/Snowmobiles
low to mid-single digits % (decreased)Motorcycles
high-teens % (unchanged)Global Adjacent Markets
high-single digits % (increased)
Assumptions F/X = minus ~90 bpsHuntsville start-up Q2’16Commodities positive
AssumptionsF/X = minus ~55¢ per share (unchanged)Share count down ~2% (increased)Net income $ down 1% to 10% (unchanged)
2016 FULL YEAR GUIDANCE (as disclosed on 4/21/16)
2% to 3%(unchanged)
Constant CurrencyFlat to 5%
Constant Currency20 to 30 bps
Constant CurrencyFlat to 9%
$6.75 to $7.35
8% to %$6.20 to $6.80
(unchanged)70 to 120 bps
(Improved)
Other 2016 ExpectationsOperating expenses: Up 10 to 30 bps as a % of sales (decreased)Income from financial services: grow faster than total company sales (increased)Income taxes: Approx. 35% of pre-tax income (unchanged)International sales: low to mid-single digits % (unchanged)PG&A sales: Grow faster than overall company (unchanged)
($ millions)
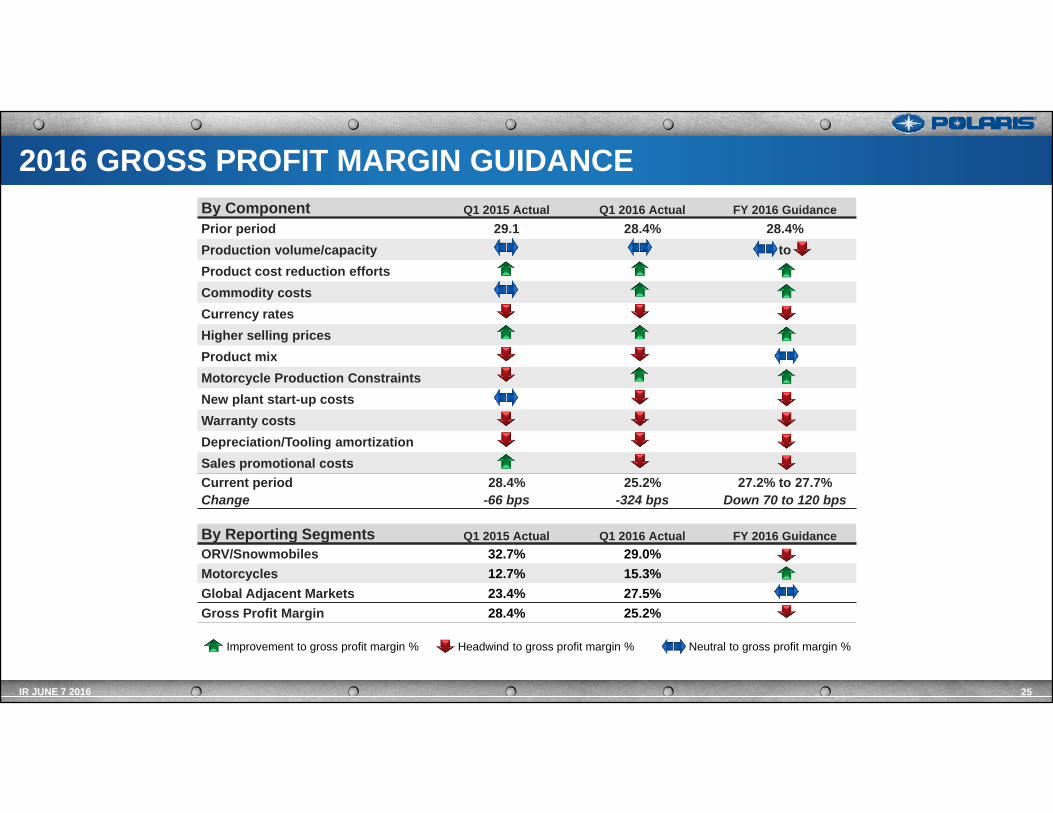
By Component Q1 2015 Actual Q1 2016 Actual FY 2016 GuidancePrior period 29.1 28.4% 28.4%Production volume/capacity toProduct cost reduction effortsCommodity costsCurrency ratesHigher selling pricesProduct mixMotorcycle Production ConstraintsNew plant start-up costsWarranty costsDepreciation/Tooling amortizationSales promotional costsCurrent period 28.4% 25.2% 27.2% to 27.7%Change -66 bps -324 bps Down 70 to 120 bps
By Reporting Segments Q1 2015 Actual Q1 2016 Actual FY 2016 GuidanceORV/Snowmobiles 32.7% 29.0%Motorcycles 12.7% 15.3%Global Adjacent Markets 23.4% 27.5%Gross Profit Margin 28.4% 25.2%
25IR JUNE 7 2016
2016 GROSS PROFIT MARGIN GUIDANCE
Improvement to gross profit margin % Headwind to gross profit margin % Neutral to gross profit margin %

Currency Improved Slightly in Q1; Remains Volatile26IR JUNE 7 2016
FOREIGN CURRENCY EXPOSURE FOR POLARIS
Foreign Currency Hedging Contracts Currency Impact on Net IncomeNotional Avg. Exchange Compared to Prior Year Period
Foreign CurrencyCurrencyPosition
Cash FlowExposure Hedged
Amounts(US $ in Millions)
Rate of OpenContracts
FY 2016(Expectation)
Canadian Dollar (CAD) Long 80% $193 $0.72 to 1 CAD Negative
Australian Dollar (AUD) Long 60% $22 $0.71 to 1 AUD Negative
Euro (EUR) Long 0% - - Negative
Japanese Yen (JPY) Short 40% $6 120 Yen to $1 Positive
Mexican Peso (MXN) Short 90% $41 17 Peso to $1 Positive
F/X Impacts vs. Prior Year($ in millions)
ActualQ1 2015
ActualQ1 2016
ActualFY 2015
FY 2016 Expectations
Sales ($32) ($14) ($160) ($75)
Gross Profit ($12) ($17) ($70) ($75)
Pretax Income ($16) ($8) ($70) ($55)
Open F/X Hedging Contracts as of March 31, 2016

POLARIS FINANCIAL POSITION
27IR JUNE 7 2016
Capital Summary March 2016Cash DriversFav/(Unfav)March 2015
Cash $ 145.8 +32%Debt /Capital Lease Obligations $ 532.4 (63%)Shareholders’ Equity $ 930.9 8%Total Capital $1,463.3 23%
Debt to Total Capital 36% (9%)
2015
Operating cash flow up significantly
Factory inventory flat sequentially from Q4’15
Increased share repurchases given stock price
Cap Ex expected to be slightly higher than 2015Reflects Huntsville, Spirit Lake Investments
Operating Cash Flow
Strong Balance Sheet and Cash Flow Generation
ROIC*
CashQ1 2015
OperatingActivities
Dividends Capex NetBorrow-
ings
ShareRepur-chase
Acquisition Other CashQ1 2016
$155
$139 $35 $55 $66 $85$55
$16 $146
$4$139
Q1 2015 Q1 2016 2016
38%
28%
Q1 2015 Q1 2016
*Defined as trailing 12 months net income divided by average total assets, minus
average current liabilities
UpSignificantly
($ millions) ($ millions)
($ millions)
Expectations
Q1 2016 Summary
2016 Expectations

Inventory Turns Decreasing as Inventory Value Grows at a Faster Rate than Sales
Factory Inventory & TurnsSales
28IR JUNE 7 2016
POLARIS SALES GROWTH & FACTORY INVENTORY
($ millions)
$298 $345$418
$566
$710
5.6 5.6 5.5 5.0
4.3
2011 2012 2013 2014 2015 2016
Inventory Turns
Factory inventory historically growing faster than sales – major focus in 2016
Inventory reduction closely tied to Retail Flow Management (RFM)Vehicle platforming, localization of suppliers, reduction of supplier lead-times, distribution network reconfiguration
Tied incentive compensation to factory inventory reduction targets for executives
$2,657$3,210
$3,777$4,480 $4,719
2011 2012 2013 2014 2015
($ millions)
+23%+18%
+30%
+24%
+33%+21%
+18%+19% +5%
Inventory $ down significantly,
Turns Improve
Expectations

Burden Carriers
Tow Tractors
Stock Chasers
Personal Carriers
Utility Vehicles
ACQUISITION: TAYLOR-DUNN (3/7/16)
29IR JUNE 7 2016
Taylor Dunn Product LineTaylor-Dunn OverviewLeader in light-industrial and commercial vehicles2015 sales: ~1% of total Polaris (80% N.A.)
~80 models, ~95% electric
~240 dealers worldwide
150+ Employees; HQ and manufacturing in Anaheim, CA
Customers: Industrial, warehouse, schools/universitiesBusiness expected to be neutral to 2016 earnings
Established dealer network
Large installed base
Industrial market presence
Strong brand recognition
Strategic Fit with Work & Transportation (W&T)
Expands Products and Channel Access to Polaris W&T Business
MSRP – $5,500 to $48,500

SnowmobilesMotorcycles
POLARIS CUSTOMER USAGE PROFILES
IR JUNE 7 2016
Off-Road Vehicles
30
Die-Hard "Biker"
Motorcycle Enthusiast
Show-off Rider
Commuter RiderWeekend
Rider
Trail/ Touring
Off-Trail/ Deep Snow
On/Off Trail Recreation/
Utility
AVERAGEAGE 50 43 44 43 47 52 56 42
INCOME ~$100k ~$100k -- ~$90k ~$90k ~$100k - $125k $160k ~$90k
MALEFEMALE
91%9%
91%9%
98%2%
87%13%
75%25%
90%10%
95%5%
90%10%
PRIMARYUSE
Work & PlayFarm/Ranch
Property Maint.Rec/Trail
Hunt
Mostly PlayRec/Trail
DunesProperty
Play & Work Rec/TrailProperty
Farm/Ranch
Work & PlayRec/Trail
Property Maint.Hunt
Rec/TrailHuntUtility
Cruising, Day tripsaround town
Commute
Cruising, Day trips,Commute
Recreationon & off trail
Trail Riding
Private Property Maintenance
Farm/Ranch
Hunt/Fish
Desert/Dunes
MY15, except GENERAL (MY16)
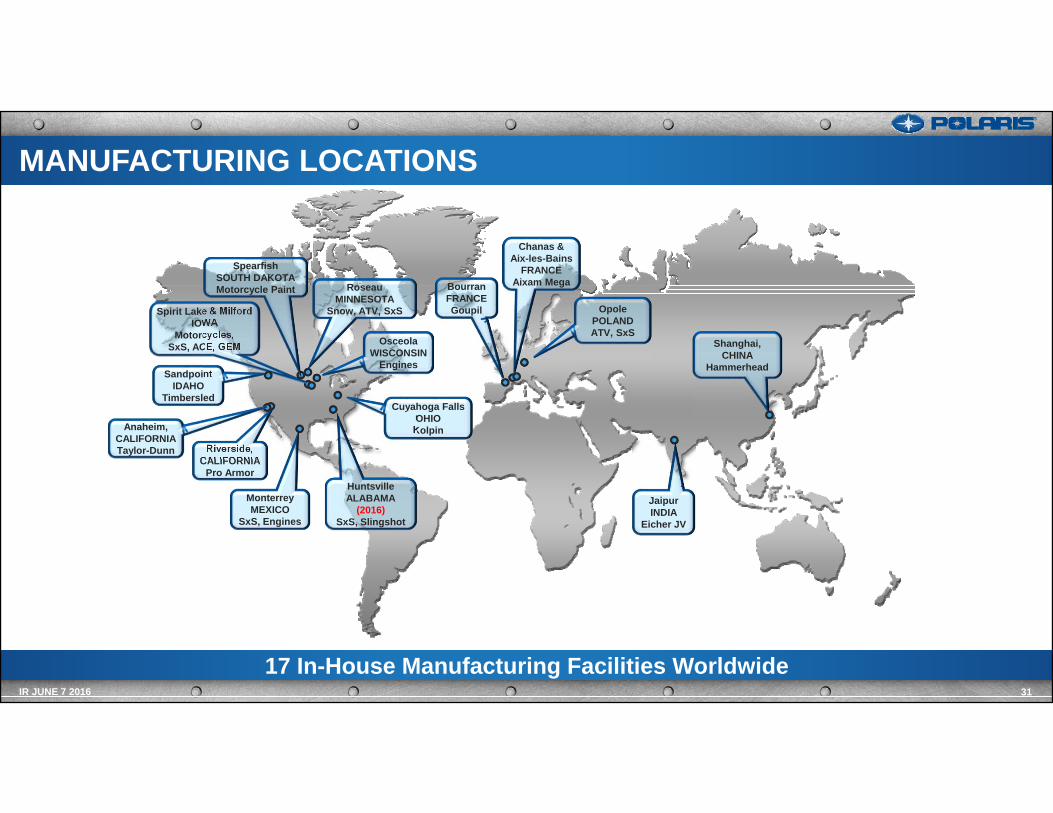
17 In-House Manufacturing Facilities Worldwide31IR JUNE 7 2016
MANUFACTURING LOCATIONS
Monterrey MEXICO
SxS, Engines
Spirit Lake & MilfordIOWA
Motorcycles,SxS, ACE, GEM
RoseauMINNESOTA
Snow, ATV, SxS
OsceolaWISCONSIN
Engines
BourranFRANCEGoupil
Chanas &Aix-les-Bains
FRANCEAixam Mega
Cuyahoga FallsOHIO
Kolpin
Riverside, CALIFORNIA
Pro Armor
Shanghai, CHINA
Hammerhead
HuntsvilleALABAMA
(2016)SxS, Slingshot
OpolePOLANDATV, SxS
JaipurINDIA
Eicher JV
SandpointIDAHO
Timbersled
SpearfishSOUTH DAKOTAMotorcycle Paint
Anaheim, CALIFORNIA Taylor-Dunn
