policies at the national and regional level – south asia: beverages and spices in sri lanka anura...
TRANSCRIPT

Policies at the National and Regional Level – South Asia: Beverages and Spices
in Sri Lanka
Anura Herath
Sri LankaIDRC/UNCTAD Workshop on Standards and
Trade 16-17 May 2002, Geneva

Status Summary: Spice & beverage Sector
Sector
National EconomyGDP - 0.57%
Tot. FE (5600 Rm):1.75%Agric. FE - 8.5%
ProductionLand - 53,000 ha (9% of total)
Farms: 250,000Av Size: 1/4 ha
About 20%-50% HH income
EnvironmentBiodiversity
Land degradation
Socio-Economy/TechnologyLabour intensive
High women participationAll local inputs

Traditional Areas of ProductionTraditional Areas of Production

Progress of the Sector Progress of the Sector [1980-2000][1980-2000]
Sector has progressedThere is a tremendous potential in the world
market
Local Scene
Area (ha): 30,240 - 53,600
Foreign Exchange (US $ mn): 6.4 - 69.7
Exports (mt):10,300 - 17,900
Global Scene
Imports (mt): 220,000 - 500,000
Growth Rate: 3-4%
Per capita spice consumption: 2.33 -
3.19

Markets for SL Spices & BeveragesMarkets for SL Spices & Beverages
• Cinnamon: USA – 10%; Mexico – 44%
• Cardamom: Singapore – 21%; UK - 5%, South Africa; Bangladesh
• Clove: India – 26%; Saudi Arabia – 15%; UK – 7%
• Pepper: UAS – 10%; UK – 11%; India – 25%
• Coffee : UK – 5%; Italy – 9%; Austria – 12%, Germany – 23%
• Cocoa: UK; Germany; Italy

Tax structure for EACTax structure for EAC
Country Coffee Cocoa Cinnamon Pepper Cardamom CloveJapan 0% 20% 0%; 20-35% 0% all 0%; 4.2% 0%; 4.2% 4.2%USA 0% all 0%; 1% 0% 0% 0% 0%EU 4%; 10-30% 6.7%; 12% 0%; 1.3% 0% 20% 10%Mexico 20% all 15% all 10% all 10% 20% 10%Russia 0%, 10% 0% all 0% all 0% all 0% all 0% allSouth Africa 0% all 0%; 20% 0% all 0% all 0% all 0% allBrazil 10% all 10%; 20% 10% all 10% all 10% all 10% allChina-MFN 40%; 60% 20%; 45% 35% all 45% all 6% 3%Australia 0% 0%; 5% 0% 0% 0% 0%Indonesia 30% all 10%; 20% 30% all 30% all 30% 5%Venezuela 10% all 10%; 20% 10%; 15% 10%; 15% 10% all 10% allSri Lanka 35% all 35% all 35% all 35% all 35% all 35% all

Increase in market accessIncrease in market access
Country% Export upto 80%
Pot.reduction rate
Weighted by % of export
Italy 2.3% 0.0% 0.0%Germany FR 2.6% 0.0% 0.0%Guatemala 2.6% 24.0% 0.6%Chile 2.7% 24.0% 0.6%Equador 2.9% 24.0% 0.7%Spain 3.9% 0.0% 0.0%Peru 6.4% 24.0% 1.5%Colombia 6.4% 24.0% 1.5%USA 10.7% 0.0% 0.0%Mexico 44.4% 24.0% 10.7%
Access Increase in % 16%
Cinnamon 1990 - 1999
Cardamom = 8% Clove = 22%
Pepper = 18% Coffee = 17%

Export Volume of Spices & BeveragesExport Volume of Spices & Beverages
0
2,000
4,000
6,000
8,000
10,000
12,000
14,000
16,000
18,000
20,000
1970 1972 1974 1976 1978 1980 1982 1984 1986 1988 1990 1992 1994 1996 1998
Exp
ort
Vol
um
e (m
t)
Total Spice Coffee & cocoa

Quality Requirements
CleanlinessSpecifications
Wholeinsects dead
Excretamammalian
Excretaother
Mold Insectinfested
Extraneousmatter
Bycount
Bymg./lb
Bymg./lb
% bywgt.
% bywgt.
% bywgt.
Cardamom 4 3 1.0 1.00 1.00 0.50
Cinnamon 2 1 2.0 1.00 1.00 0.50
Cloves 4 5 8.0 1.00 1.00 1.00
Mace 4 3 1.0 2.00 1.00 0.50
Nutmeg (broken) 4 5 1.0 SF(4) SF(4) 0.50
Nutmeg (whole) 4 0 0.0 SF(5) SF(5) 0.00
Black pepper 2 1 5.0 SF(6) SF(6) 1.00
White pepper 2 1 1.0 SF(7) SF(7) 0.50
Aflatoxin DDT etc. Radiation Solvent residues
For all 4 ppb 1- 0.5 ppm 10-6% 1 ppm
u
SF= 4,5,6,7: 1-5% insect or infected pieces

Percentage of Product Volume with High Moisture Percentage of Product Volume with High Moisture Level and Mould at the Exporter LevelLevel and Mould at the Exporter Level
0%
5%
10%
15%
20%
25%
30%
35%
40%
% o
f V
olum
e th
e E
xpor
ter
Lev
el
Wet 19% 12% 16% 9% 38% 15% 38%
Semi-dry 5% 6% 7% 5% 0% 1% 0%
with mould 1% 2% 1% 1% 2% 6% 2%
Cinnamon Pepper Coffee Nutmeg Clove Cocoa Cradamom
National level survey of 350 traders

Main reasons for low qualityMain reasons for low quality
• Improper harvesting
• Unfavourable drying systems. Nearly 70% of the producers use sun drying on home yard with no proper surface for drying. Roadside drying is common.
• Experience frequent rain during the harvesting period. About 69% of producers claimed the problem.
• Only 5% of the producers use a mechanical dryer.
• About 64% reported of poor storage.

Estimated Proportion of Products with Substandard Quality and the Reprocessing Cost to meet SPS
Requirements
Product >20% M >15% M % Mould Exp. Mt Reproce.mt
Cost $
Cinnam. 19% 5% 1% 9,130 2,313 433,676
Pepper 12% 6% 2% 3,611 717 134,414
Coffee 16% 7% 1% 1,550 378 70,784
Nutmeg 9% 5% 1% 752 108 20,162
Clove 38% 0% 2% 1,296 515 96,554
Cocoa 15% 1% 6% 127 28 5,256
Cardam. 38% 0% 2% 18 7 1,336
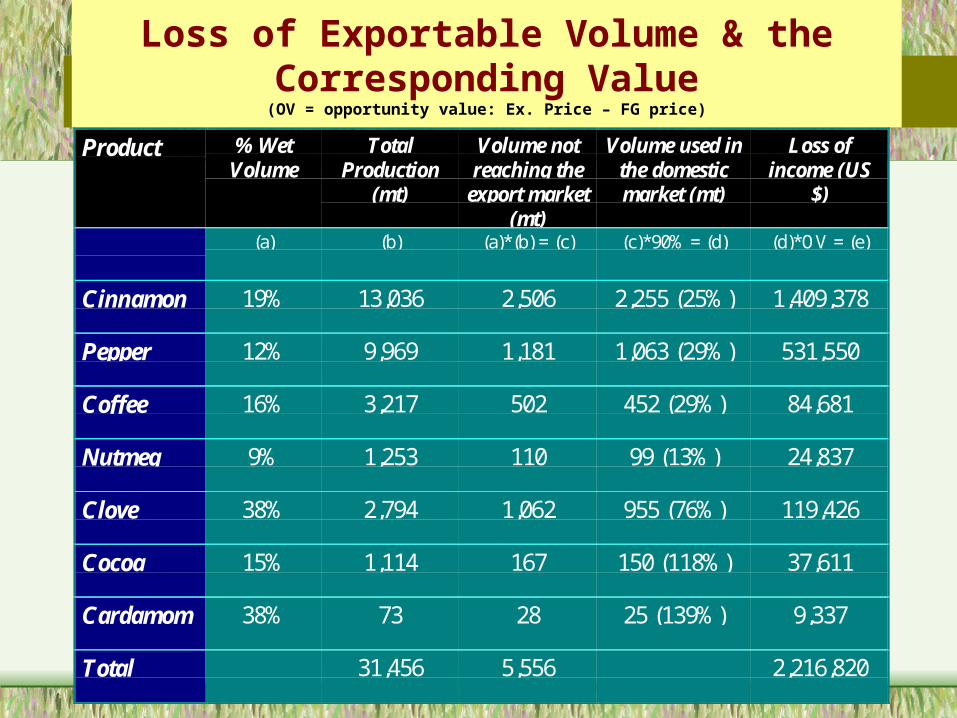
Loss of Exportable Volume & the Corresponding Value
(OV = opportunity value: Ex. Price – FG price)
Product % WetVolume
TotalProduction
(mt)
Volume notreaching the
export market(mt)
Volume used inthe domesticmarket (mt)
Loss ofincome (US
$)
(a) (b) (a)*(b) = (c) (c)*90% = (d) (d)*OV = (e)
Cinnamon 19% 13,036 2,506 2,255 (25%) 1,409,378
Pepper 12% 9,969 1,181 1,063 (29%) 531,550
Coffee 16% 3,217 502 452 (29%) 84,681
Nutmeg 9% 1,253 110 99 (13%) 24,837
Clove 38% 2,794 1,062 955 (76%) 119,426
Cocoa 15% 1,114 167 150 (118%) 37,611
Cardamom 38% 73 28 25 (139%) 9,337
Total 31,456 5,556 2,216,820

Loss of EmploymentProduct Estimated
reprocessedquantity
before export(mt)
Labour forreprocessing(# persons /
year)
Volume notreaching the
exportmarket (mt)
Total labourloss
(persons/year)
Net labourloss
(persons/year)
Cinnamon 2,313 368 2,506 1,917 1,549
Pepper 717 114 1,181 456 342
Coffee 378 60 502 262 202
Nutmeg 108 17 110 48 30
Clove 515 82 1,062 314 232
Cocoa 28 4 167 57 52
Carda. 7 1 28 7 6
Total 4,066 647 5,556 3,061 2,415

Loss of FE due to non Loss of FE due to non compliancecompliance• Loss of prices: Average FOB price is 41% less than the average world
market price for coffee, 34% for cocoa, 20% for pepper, 69% for nutmeg and 30% for cardamom. This difference, according to the exporters, is mainly due to non-compliance
• Volume loss at the retail trade level: If the quality is in line with SPS requirements, this volume could have been exported at about US $ 2.2 million per year
• Value loss at the exporter level due to lack of quality: There is a reprocessing cost of about 0.7 million US $ per year. This will reduce the competitiveness.
• In total the estimated value of foreign exchange loss due to non-compliance is US $ 2.9million / year: about 5% of the total FE earnings from spices & beverage crops

Overall Impact – What Policies?Overall Impact – What Policies?
• Overall impact on country’s GNP
• Negative impact on poverty alleviation
• Permanent loss of markets
Policy Interventions

Basis for Policy Directions Basis for Policy Directions (understanding the sector)(understanding the sector)
• Small Size of the cultivation– Heterogeneity– Low capital and low credit – low investment– Subsistence nature – poverty issue– Information gap – basically government
sources: GOSL cannot reach the base for lack of funds

Holding size of cardamom: Sri LankaHolding size of cardamom: Sri Lanka
Distribution of Holding Size and Cumulative Distribution: Cardamom
0
2
4
6
8
10
12
14
0.08 0.2 0.4 0.6 0.8 1 1.2 2 >2
Holding Size (ha)
Fre
qu
ency
0%
20%
40%
60%
80%
100%
120%
Cu
mu
lati
ve %
Frequency Cumulative %

yHolding size of Cinnamon: Sri LankayHolding size of Cinnamon: Sri Lanka
Distribution of Holding Size and Cumulative Distribution: Cinnamon
0
5
10
15
20
25
30
35
0.08 0.2 0.4 0.6 0.8 1 1.2 2 More
Holding Size (ha)
Fre
qu
en
cy
0%
20%
40%
60%
80%
100%
120%
Cu
mu
lati
ve
%
Frequency Cumulative %

Holding size of Pepper: Sri LankaHolding size of Pepper: Sri Lanka
Distribution of Holding Size and Cumulative Distribution: Pepper
0
10
20
30
40
50
60
70
80
0.08 0.2 0.4 0.6 0.8 1 1.2 2 More
Holding Size (ha)
Fre
qu
en
cy
0%
20%
40%
60%
80%
100%
120%
Cu
mu
lati
ve
%
Frequency Cumulative %

0
10
20
30
40
50
60
70
>.5 ac 0.5-1 ac 1-2 ac 2-4 ac >4 ac
Fre
qu
ency
0%
20%
40%
60%
80%
100%
120%
% c
um
ula
tive
Frequency %
Holding size of Coffee: Sri LankaHolding size of Coffee: Sri Lanka

Basis for Policy Directions Basis for Policy Directions (understanding the sector)(understanding the sector)
• Small Size of the cultivation • % marketed in the domestic market
– Considerable• hence total production meeting the cost of
compliance may not be cost effective for the small scale producers
– The price gab between Grade 1 & 2 is inadequate for high investment
• Pepper – 7-10%; Cinnamon – 10-15%; Coffee – 5-8%

Domestically Traded Volumes & Domestically Traded Volumes & share of that out of exportsshare of that out of exports
Product Total Production
(mt)
Volume not reaching the
export market (mt)
Volume used in the domestic market (mt)
Cinnamon 13,036 2,506 2,255 (25%)
Pepper 9,969 1,181 1,063 (29%)
Coffee 3,217 502 452 (29%)
Nutmeg 1,253 110 99 (13%)
Clove 2,794 1,062 955 (76%)
Cocoa 1,114 167 150 (118%)
Cardamom 73 28 25 (139%)

Basis for Policy Directions Basis for Policy Directions (understanding the sector)(understanding the sector)
• Small Size of the cultivation • % marketed in the domestic market • Awareness
– There is a considerable gap in time & precise information: • producer – exporter• Exporter – consumer
– Gap between the national inquiry points & producers– Government information sources are less efficient due to lack of
resources

Producers’ Knowledge on Producers’ Knowledge on processingprocessing
Producers' Knowledge on the Recomemded Processing Methods{data from a survey of 1075 producers of spices and beverage crops}
Lack of know ledge81%
Only partial know ledge8%
Know s the process11%

Percentage of Producers having Percentage of Producers having knowledge on Processingknowledge on Processing
0%
20%
40%
60%
80%
100%
Lack ofknowledge
Only partialknowledge
Knows theprocess
Cardamom
Cinnamon
Citronella
Cocoa
Coffee
Pepper

Percentage of Trading Partners at Different Points of the Trade Channel who have Reported the Inferior
Quality of Spices
0%
10%
20%
30%
40%
50%
60%
70%
% t
rade
rs in
the
sam
ple
Exporter Retail buyer Village Collector Wholesale buyer
Information Gap

Well planned training Well planned training programme is neededprogramme is needed
• There are about 70,000 traders involved in the industry
• The total cost then would be in the range of US $ 1.954 million
• The annual budget allocation is US $ 24,400, which is only 3% of the requirement

Basis for Policy Directions Basis for Policy Directions (understanding the sector)(understanding the sector)
• Small Size of the cultivation • % marketed in the domestic market • Awareness • Cost of Production
– Less competitive & thus cost increase is not attractive

Cost of production becomes high - Cost of production becomes high - 20022002
Product Cost of Production (US $/kg)
Cost of processing at
farm-gate (US $/kg)
Total cost of production (US $/kg)
Farm-gate price (US
$/kg)
Pepper 0.76 0.19 0.95 1.95
Coffee 0.34 0.23 0.56 0.54
Cocoa 0.33 0.25 0.58 0.70
Cinnamon 2.00 0.19 2.19 4.70
Cardamom 1.85 0.38 2.23 8.88

Basis for Policy Directions Basis for Policy Directions (understanding the sector)(understanding the sector)
• Small Size of the cultivation • % marketed in the domestic market • Awareness • Cost of Production • Technology
– Not in line with giving high quality

SummarySummary
• The sector is important for FE earning and poverty alleviation
• Improved market access is only marginal if SPS requirements are not met, so emphasis on quality is essential
• There is a notable cost in complying with standards
• Quality is affected by weather, technology and knowledge factors
• The policy interventions should take the basic features of the sector.

Policy Direction for Sri Policy Direction for Sri LankaLanka
• Increase awareness in lowering cost of production and increasing quality.
• Encourage central processing and out-grower systems
• Emphasise on the possibility of exchanging improved genetic material and plant varieties which help in increasing competitiveness
• Increase facilities for national inquiry points
• Improve the capacity to detect and eliminate contaminants, to process spices to acceptable standards, and proper packaging etc.
• Encourage capacity building on HRD
• Develop strategies, may be collectively with other DC, to take Technical Assistance under SPS measures through a close consultative process with all the stakeholders
• Provide state assistance to central collection and processing points to maintain the homogeneity of quality.
• Encourage regional co-operation through producers’ meetings