policy conundrums in urban transport
TRANSCRIPT

Policy conundrums in urban
transport
Bill Cameron
Department of Transport

1. Personal perspective, not official standpoint of
Department of Transport
2. Enables me to speak freely, based on:
• Experience - research (13 years)
consultancy (19) government (8) and 32 of
service to the SATC Board and Organising
Committee
• Hindsight
• A rational perspective
• Objective not political considerations
3. A mixture of optimism, effort, pain, suffering
and disillusionment
Where am I coming from?

Driessen Report – 1974Defined Urban Transport Problem as:
• Not a transport problem
• A land use problem
• It was in 1974 and still is today
• Sustainable public transport is
not possible in sprawling,
dispersed RSA cities
So I went to the archives Where I came in?
Resulted in a Transport
Branch and Urban
Transport Group at
CSIR
Interpretation of my themePolicy conundrums in urban transport
• Policy
• Conundrum
• Urban
• Transport
Policy – set of principles to guide decisions for achieving rational outcomes. Statement of intent implemented as procedures and protocols
Conundrum – confusing question, riddle or dilemma – rationality versus expediency; logic vs politics
Urban – in my context “municipal”, mostly metropolitan
Transport - movement of passengers and freight for all purposes by all modes: not just public transport

Let’s start with policyUrban transport performance still shaped by:
1. Group Areas Act
2. Legacies of Traffic and Transport law, e.g. Road
Transportation Act; Urban Transport Act; Legal succession
to SATS Act; Road Traffic Act; and others
Current urban transport policy intended to be shaped by:
1. 1996 White Paper
2. Subsequent legislation including: NLTTA; NLTA; SANRAL
and National Roads Act; National Road Traffic Act; and
others
3. Public Transport Strategy and Action Plan
4. Expenditure – Vote 35 Transport Budget
5. BUT strongly influenced by ad hoc policy pronouncements
related to budget allocations and crisis management
(Tolls, Mamelodi, Moloto Road to exemplify)
What are the problems transport
policy seeks to address?
1. Fragmentation of responsibilities
2. Destructive competition
3. Fiscally unsustainable public transport systems
4. Unacceptable safety, security and customer service
standards
5. Inefficient freight and passenger movement
(efficiency defined as unacceptable time and cost
burdens on users affecting the economy through
negative effects on productivity and competition)
6. Uncoordinated services and fare/tariff systems
7. Low accessibility to economic and social activities
What are some of the policy intentions?
1. Fragmentation - Assignment to the lowest
competent level of government. (Metro)
2. Destructive competition - Regulated competition
through licensing
3. Prioritise public transport – expenditure & road
space
4. Sustainability - Rationalise & integrate services
5. Safety – AARTO Act “Points demerit system”
6. Inefficiency – Urban spatial transformation
7. Uncoordinated services – ITP’s
8. Low accessibility – IDP’s and BEPP’s (Land use))

1. Assignment , not universally supported
2. Regulated competition not effective – ITP’s not
informing PRE’s and PRE’s not on top of licensing
3. P T priority - Dedicated road space resisted
4. Sustainability – Cost coverage <40% on all fronts
5. Points demerit system on ice
6. Mega-housing projects entrenching dispersed low
density settlement
7. ITP’s ineffectual - in Bosman St outside my office I
regularly see - A Re Yeng, TBS, Autopax, Gautrain Bus,
PUTCO, North Star and minibus taxi services
8. IDP’s and BEPPs not improving accessibility - travel times
and costs rising
Performance of policy ?
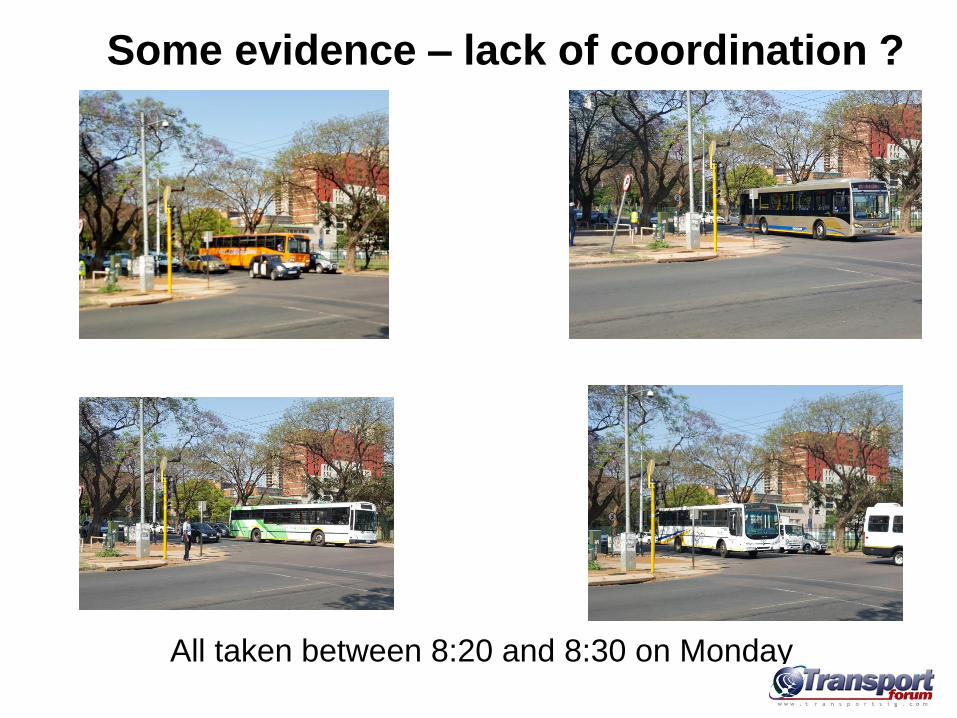
Some evidence – lack of coordination ?
All taken between 8:20 and 8:30 on Monday

2003 2013
Johannesburg 52.9 60.6 14.6
Tshwane 59.5 63.6 6.9
Ekurhuleni 50 55.5 11.0
Cape Town 49.8 54 8.4
Ethekwini 44.5 52.9 18.9
Nelson Mandela 34 39.5 16.2
Buffalo City 44 41.6 -5.5
Mangaung 40.7 47.3 16.2
All metro's 49.5 55.9 12.9
Metropolitan
Municipality
Average travel time to
work%
Increase
Travel time changes
Metropolitan
MunicipalitiesTrain Bus Taxi Total
2003 527 000 408 000 1 368 000 2 303 000
% of all modes 11.2 8.7 29.0 48.9
% of public modes 22.9 17.7 59.4 100.0
2013 650 000 438 000 1 988 000 3 076 000
% of all modes 9.6 6.5 29.3 45.4
% of public modes 21.1 14.2 64.6 100.0
Travel mode used for work trips 2003 and 2013 (NHTS)
Mode share changes
Travel time
and costs

Some evidence - accessibility ?
Policy intentions relate to the
vision and objectives of the W P
In a nutshell, for urban transport these are the questions of:
• Why?; (fragmentation and destructive competition)
• What?; (devolution or assignment)
• Where?; (Metro’s)
• When? (NLTTA tried to spell out a timetable for plans
and implementation but these targets were unrealistic
and not realised. PTS timetable is compromised.)
Substance of policy even less clear
• How?
Substance of policy – the real
conundrumHow to:• Clarify roles of government tiers
• Allocate powers and functions
• Rationalise funding
• Rationalise state subsidies
• Implement licensing and law enforcement
• Improve the performance of SOE’s
• Encourage competition and private ownership
• Equitably support private operators
These have been a bridge too far
What are the conundrums? We have enough money but spend it sub-
optimally through impenetrable silos
Silos seek to preserve the status quo. (MBT
and SABTA, Provinces, PTOG Operators and
SABOA, PRASA, SANRAL and DoT, Human
Settlements, Housing)
Municipal development grants substantial but
not aligned
Vested interests resist change - reallocation
could improve, profitability, performance and
service to customers
Spatial status quo makes public transport
unsustainable

What are the conundrums?
• The poor captive to dangerous taxi’s, and
infrequent and uncomfortable PUTCO or
Golden Arrow Buses,
• Meantime the old and new elite swan
around in WaBenzi, Beemers, Audi’s and
Lexus.
• 2003 to 2013 car use for work trips
increased by 860 000, 55% or 5.5% per
year.
• This not a sign of prioritised public
transport, and is unsustainable

NATIONAL SUBSIDIES 2014/15
(R billion) % Mode
Market
share %
(Work and
Study)
Annual
operating
subsidy
per
passenger
Annual
capital
subsidy per
passenger
Total PRASA subsidy 14.95
Current subsidy 3.89
Capital subsidy 11.06
Gautrain ridership guarantee paid to operator 0.99 3.7
Public Transport Operating Grant (PTOG) 4.83 17.8
Public Transport Infrastructure & Grant (PTIG) 4.97
Public Transport National Operating Grant (PTNOG) 0.9
Taxi recapitalisation 0.42 1.6 Minibus 66 0 135
TOTALS 27.06 100.0 100.0 2 257 3 499
5 930
7 461
13 439
6 471
55.2
21.7
Train
Bus
18
16
How do we spend transport funds?
• Who are the beneficiaries?
• Do we care about them?
• Or are we in the business of running trains?

Cost items Gautrain Commuter
Rail
PTOG
subsidised
bus
Municipal
bus
IPTN /
BRT
Minibus
Taxi
Total or
average
Operating expenditure (R m) 2 418 4 783 4 269 783 851 13 088 26 192
Operating subsidy (R m) 1 036 1 940 2 600 591 522 0 6 689
Fare revenue/operating costs (%) 55% 39% 39% 18% 37% 100% 70%
Passengers carried (% share) 1% 21% 8% 1% 2% 67% 100%
Operating cost/passenger carried (R) 140.1 9.2 22.0 24.4 20.9 8.1 10.8
Fare revenue/passenger carried (R) 77.8 3.6 8.6 4.4 7.8 8.1 7.6
Subsidy/passenger carried (R) 60.0 3.7 13.4 18.4 12.8 0.0 2.8
Metropolitan public transport (6 original metros)
Source: DPME / NT: Expenditure and performance review of PTIS
Subsidise the
wealthy?Most cost effective
mode – low fares
questionable?
All much the same with
distortionary
consequences?
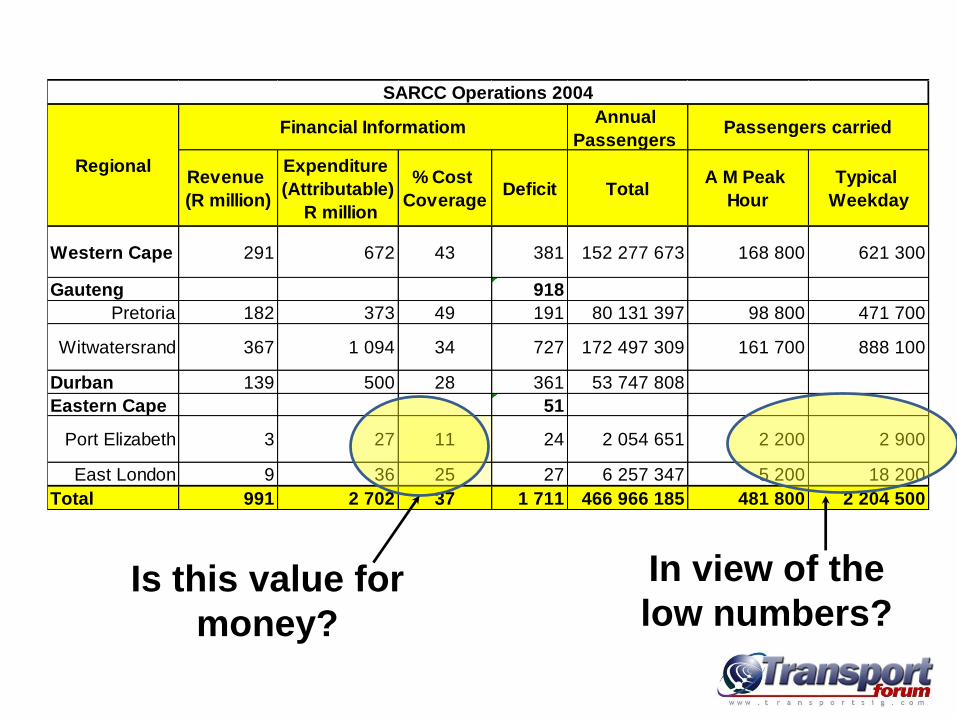
Annual
Passengers
Revenue
(R million)
Expenditure
(Attributable)
R million
% Cost
CoverageDeficit Total
A M Peak
Hour
Typical
Weekday
Western Cape 291 672 43 381 152 277 673 168 800 621 300
Gauteng 918
Pretoria 182 373 49 191 80 131 397 98 800 471 700
Witwatersrand 367 1 094 34 727 172 497 309 161 700 888 100
Durban 139 500 28 361 53 747 808
Eastern Cape 51
Port Elizabeth 3 27 11 24 2 054 651 2 200 2 900
East London 9 36 25 27 6 257 347 5 200 18 200
Total 991 2 702 37 1 711 466 966 185 481 800 2 204 500
Regional
Passengers carriedFinancial Informatiom
SARCC Operations 2004
Is this value for
money?
In view of the
low numbers?
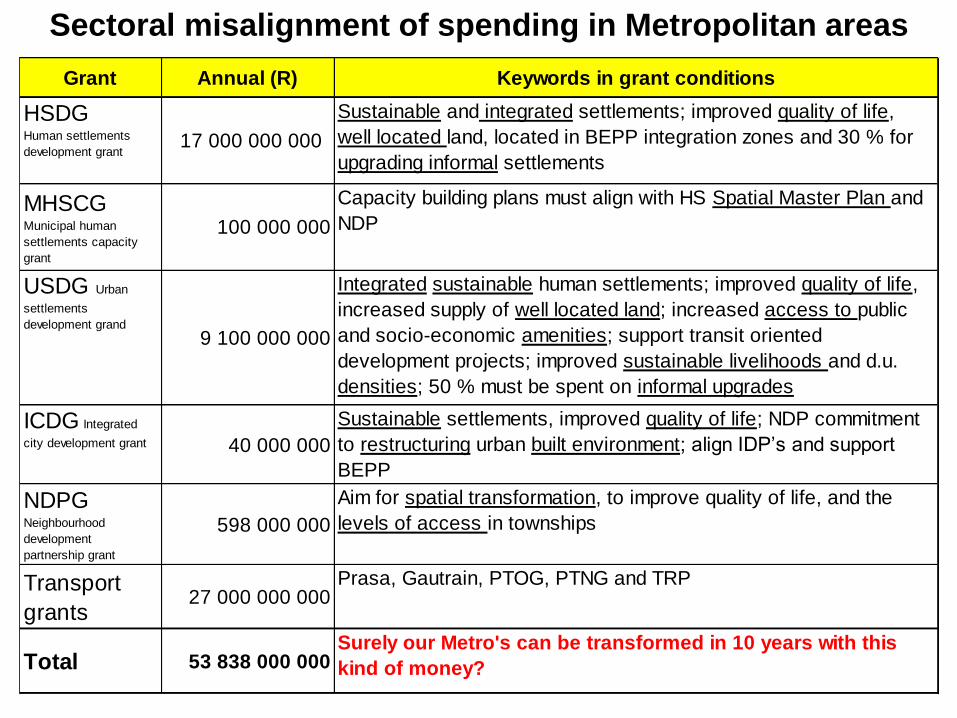
Grant Annual (R) Keywords in grant conditions
USDG Urban
settlements
development grand
9 100 000 000
Integrated sustainable human settlements; improved quality of life,
increased supply of well located land; increased access to public
and socio-economic amenities; support transit oriented
development projects; improved sustainable livelihoods and d.u.
densities; 50 % must be spent on informal upgrades
ICDG Integrated
city development grant 40 000 000
Sustainable settlements, improved quality of life; NDP commitment
to restructuring urban built environment; align IDP’s and support
BEPP
NDPG Neighbourhood
development
partnership grant
598 000 000
Aim for spatial transformation, to improve quality of life, and the
levels of access in townships
Transport
grants27 000 000 000
Prasa, Gautrain, PTOG, PTNG and TRP
Total 53 838 000 000Surely our Metro's can be transformed in 10 years with this
kind of money?
17 000 000 000
Sustainable and integrated settlements; improved quality of life,
well located land, located in BEPP integration zones and 30 % for
upgrading informal settlements
100 000 000
Capacity building plans must align with HS Spatial Master Plan and
NDPMHSCG Municipal human
settlements capacity
grant
HSDG Human settlements
development grant
Sectoral misalignment of spending in Metropolitan areas

Transport and other Sectoral Silos prevail - municipal grants poorly aligned and conditionality is uncoordinated
Forum of Directors-General for Urban GrantsHas recently been convened by DG Treasury to address the problem including:
• Cooperative Governance
• Planning, Monitoring and Evaluation
• National Treasury
• Human Settlements
• Transport
• Water and Sanitation

The importance of urban areas to the
South African economy
• Sprawling, segregated spatial form of
urban areas is a significant structural
constraint to growth
– Reduces agglomeration effects of
dense local markets
– Imposes significant transport costs that
contribute to higher labour costs
(estimated that over 20% of urban
GDP is spent on transport)
– Entrenches structural poverty
• Large cities should lead faster, more
inclusive national economic growth– “Urbanisation dividend” from growing
economic agglomeration
– “Democracy dividend” from less
divided, higher density cities
Requires coordinated action to
realise this growth dividend 8
Many of our programmes are still
structured to subsidise the low
growth apartheid spatial legacy

The way forward?
• Assignment The Cape Town experience
From IRT Silo to
• Persevere with the PTS Moderate and accelerate
Quality car competitive public transport is essentiall
• Pursue alternative housing forms and delivery models

The benefits of
accessibility
Choice location

Conclusion
• “We have to engage in brutal public conversations. It is especially time for anger. Anger is often where important change begins. Not the anger of blind destruction, but the anger that brings clarity of direction, lucidity of purpose.”
• Colonialism and apartheid divided space. De-colonialism must mean making whole –reconfiguration of space. It requires fundamental social and economic change. Liberation is incomplete when the colonial or apartheid city is not reorganised, but simply taken over. (Anjie Krog Sunday Times Literary Awards)