policy effectiveness evaluation - archidok · 2 policy effectiveness evaluation why evaluate...
TRANSCRIPT

Policy effectiveness evaluationThe effectiveness of urban wastewater treatment and packaging
waste management systems
Policy effectiveness evaluation2
Why evaluate effectiveness?
Policy effectiveness evaluation helps to raise important questions about environmental policies: Are they working? Are they cost-effective? If not, how can they be improved?
The 2001 European Environment Agency publication ‘Reporting on environmental measures: are we being effective?’ (1) (REM) confirmed a widespread lack of knowledge at that time in Europe about the effectiveness of past policies for most areas. The report set out a framework for approaching effectiveness evaluations, guiding the exploration of the relationship between the needs of society for a policy measure and the final impact of that measure on the environment.
Over the past few years, however, many policy-making agents have stepped up their efforts to assess policy effectiveness. The EEA itself has become engaged in such evaluations in order to inform policy-making agents and the public. The Agency’s work in this area has underlined an important lesson i.e. for environment policy to deliver effective results, the institutional setup can be as important as the design of the policy itself. Governance can therefore make or break the success of a policy.
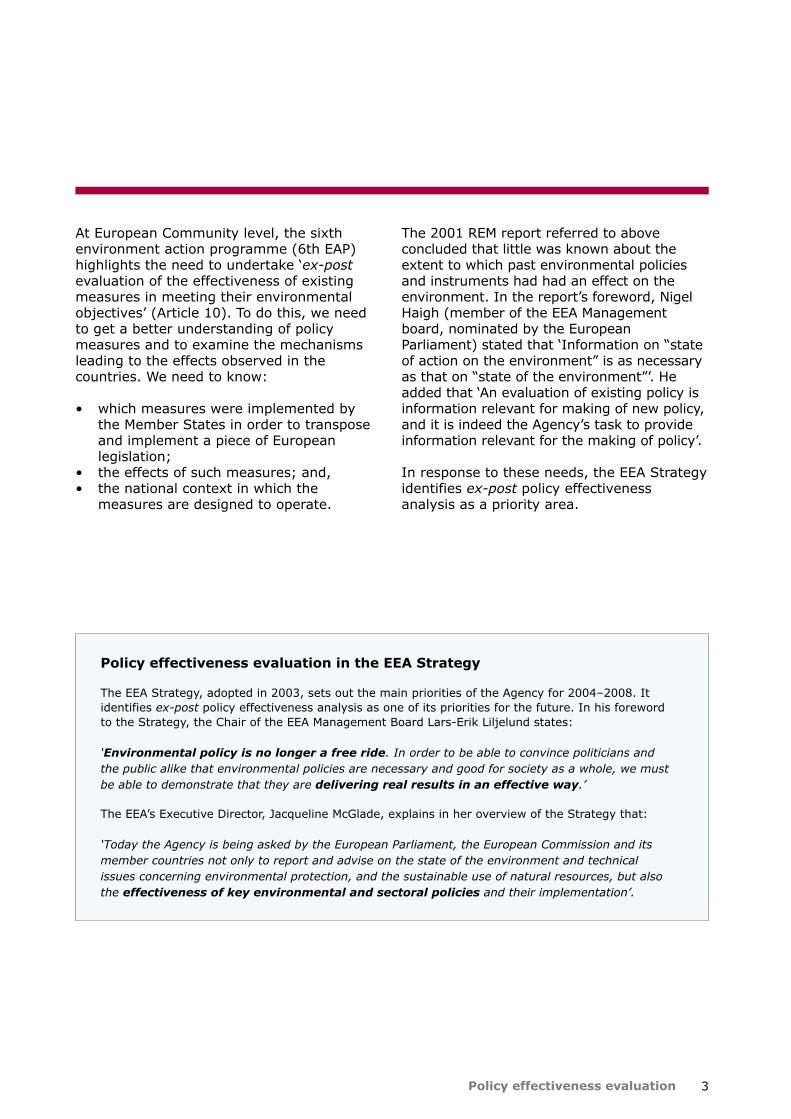
By evaluating effectiveness we can provide support to environmental policies, and respond to the information needs of EEA clients. As the figure below illustrates, effectiveness evaluation also provides an important feedback mechanism in the policy cycle. It is an essential tool to improve understanding of the difference that environmental policies make in the broader context of sustainable development. It is necessary to point to measurable, demonstrable results of policies in order to justify them against broader societal objectives. This is one of the main reasons for evaluating policy effectiveness.
Policy effectiveness evaluation
(1) EEA, 2001: Reporting on environmental measures: Are we being effective? Environmental issue report No 25.
Policy measure effectiveness (and ex-post impact assessment)
(6)
Issue identification
(1)
Issue framing (2)
Policy measure development/adoption
(4)
Policy measure implementation
(5)
Policy measure identification (and ex-ante impact assessment)
(3)
Data Information Knowledge
Main stages in the policy cycle, supported by data, information and knowledge
3Policy effectiveness evaluation
At European Community level, the sixth environment action programme (6th EAP) highlights the need to undertake ‘ex-post evaluation of the effectiveness of existing measures in meeting their environmental objectives’ (Article 10). To do this, we need to get a better understanding of policy measures and to examine the mechanisms leading to the effects observed in the countries. We need to know:
• which measures were implemented by the Member States in order to transpose and implement a piece of European legislation;
• the effects of such measures; and,• the national context in which the
measures are designed to operate.
Policy effectiveness evaluation in the EEA Strategy
The EEA Strategy, adopted in 2003, sets out the main priorities of the Agency for 2004–2008. It identifies ex-post policy effectiveness analysis as one of its priorities for the future. In his foreword to the Strategy, the Chair of the EEA Management Board Lars-Erik Liljelund states: ‘Environmental policy is no longer a free ride. In order to be able to convince politicians and the public alike that environmental policies are necessary and good for society as a whole, we must be able to demonstrate that they are delivering real results in an effective way.’
The EEA’s Executive Director, Jacqueline McGlade, explains in her overview of the Strategy that: ‘Today the Agency is being asked by the European Parliament, the European Commission and its member countries not only to report and advise on the state of the environment and technical issues concerning environmental protection, and the sustainable use of natural resources, but also the effectiveness of key environmental and sectoral policies and their implementation’.
The 2001 REM report referred to above concluded that little was known about the extent to which past environmental policies and instruments had had an effect on the environment. In the report’s foreword, Nigel Haigh (member of the EEA Management board, nominated by the European Parliament) stated that ‘Information on “state of action on the environment” is as necessary as that on “state of the environment”’. He added that ‘An evaluation of existing policy is information relevant for making of new policy, and it is indeed the Agency’s task to provide information relevant for the making of policy’.
In response to these needs, the EEA Strategy identifies ex-post policy effectiveness analysis as a priority area.
Policy effectiveness evaluation4
A pilot study approach
The European Environment Agency’s two pilot studies on urban waste water treatment and packaging waste are based on the work developed in the REM report. The pilot studies aim to put the theory into practice. Reports from the studies are available from the EEA web site at www.eea.eu.int.
The approach of these studies — to examine how some Member States implement certain EU policies, investigating the country’s
Putting the theory into practice
Lessons to learn from the EEA pilot studies
1. Governance can make or break the success of a policy
In achieving effective implementation of a policy, the institutional setup can be as important as the design of the policy itself. Therefore, a nuanced understanding of governance and institutional relationships is an important element in effectiveness evaluation. The pilot studies’ ‘country case study’ approach allows this to be elucidated.
2. By tackling problems at source, economic instruments can be effective ingredients in the
policy mix
Water pollution control levies and other financial incentives to reduce industries’ wastewater output have reduced the need for treatment plant capacity. Such instruments are useful tools in finding the balance between prevention and treatment capacity, a balance that is particularly important given the huge investments involved in wastewater treatment.
institutional and national policy context — has proved to be a useful one. Their main strength lies in detailed examination of the systems that are in place at country level, and the resulting elucidation of those features that work well. The result is a complex picture; the development of each national system tells its own story. However, these stories provide powerful explanations of where trends arise from, what they actually mean, and where they may be going.
5Policy effectiveness evaluation
3. In assessing a policy’s goal-achievement, it is important to distinguish between different types of goals
Packaging waste targets have helped to stimulate an increase in recycling and recovery across Europe. However, the need to tackle the increasing generation of waste has remained in the form of an objective rather than a specific, quantitative target, and there has been relatively little progress on the issue.
4. Data limitations are demanding, but not insurmountable
Providing answers to the questions that policy effectiveness evaluation asks is frequently hampered by data limitations. A broad range of data may be required. For example, an evaluation of the effectiveness of packaging waste policies requires information on costs and institutional structures, as well as packaging waste data per se.
5. Effectiveness evaluations are complex and require multidisciplinary efforts
Studies require a good understanding of the relationships between formal policy aims, the tools available to implement them and the changes in environmental quality that have been observed. In addition, they should use knowledge of other independent developments that affect the desired outcomes. Thorough consultation is essential when conducting effectiveness evaluations.
6. Effectiveness evaluations contribute to capacity building and shared policy learning
Planning and implementing the studies with country-level involvement paves the way towards addressing important information gaps and nurturing an improved understanding of the relationships between EU policy formulation, its implementation and future policy developments. The process of undertaking such evaluations can be as important as the outcomes of the evaluations themselves since they foster shared learning on policy design, implementation and evaluation between countries and the EU level.
Policy effectiveness evaluation6
Developing the EEA’s capacity for evaluating policy effectiveness
Pilot studies: learning by doing, while providing pertinent policy support With the aim of gaining practical experience in undertaking ex-post policy effectiveness evaluations and to provide support in selected policy areas, the EEA has conducted pilot studies on packaging waste management systems in five EU countries, and on wastewater policies in six EU countries.
Further studies are either planned or underway on how implementation of the landfill and incineration directives influences waste recycling and recovery activities in countries, on the use of economic instruments to promote resource use efficiency and on the implementation of the IPPC directive.
Methodological work: promoting consistent approaches The EEA aims to develop guidelines for practitioners. Towards this goal, it is building up an inventory of good practices in policy effectiveness evaluation analysis — both in Europe and further afield.
The cost-effectiveness of a policy is an important part of its overall effectiveness. In tandem with activities on the use of market based instruments and their effects on the environment, good practice guidelines and methodological expertise on cost-effectiveness evaluation are being developed.

7Policy effectiveness evaluation
Shortfalls in the implementation of the urban waste water treatment directive (UWWTD) remain. A European Commission report released in 2004 noted that several countries had failed to designate sensitive areas and were behind schedule in establishing the capacity of sewage treatment as required by the deadlines set in the directive for 1998 and 2000. As the next deadline is approaching at the end of 2005 — namely for extending sewage treatment to urban areas with more than 2000 inhabitants — it is timely and useful to increase our understanding of the problems experienced in implementing this directive.
This pilot study examines the effectiveness of wastewater policies and measures in six Member States in order to identify and understand the reasons for both the successes and the shortfalls in implementation. Two of these six countries (Denmark, the Netherlands) have almost fully implemented the directive while a further two countries (France, Spain) have yet to do so and remain rather far from
the targets. The remaining two countries (Estonia, Poland) have only recently acceded to the EU and are therefore being allowed more time to comply with this part of the environmental acquis. Nevertheless, they are making relatively good progress in this area, particularly Estonia where 70 % of the population is served by wastewater treatment.
The report seeks to clarify the role of local authorities, policy instruments and financial mechanisms in securing effective implementation, addressing at the same time the issue of cost-effectiveness. In doing so, it focuses on the extension of sewage plants with appropriate levels of treatment (biological or advanced) and trends in discharges to surface waters.
The effectiveness analysis shows that clear lines of institutional responsibility were helpful for achieving implementation in Denmark and the Netherlands. Overlaps of responsibilities between authorities at the local, regional and national level in Spain
Pilot study 1
Urban wastewater treatment policies: what can we learn about implementation?
The study examines the effectiveness of urban wastewater policies in six EU Member States: Denmark, Estonia, France, the Netherlands, Poland and Spain (2). Water pollution caused by wastewater persists despite three decades of effort to clean up European surface waters. Several EU Member States have still not fully satisfied the requirements of the Urban Waste Water Treatment Directive (91/271/EEC). Some information on the effectiveness of economic instruments in this area was already available for a few countries, providing a useful basis for the study to work from (3).
(2) EEA, 2005: Effectiveness of urban wastewater treatment policies in selected countries: an EEA pilot study. EEA Report No 2/2005.(3) Andersen, M. S., 1999: Governance by green taxes: implementing clean water policies in Europe 1970–1990. Environmental Economics and Policy
Studies, 2: 39–63.

Policy effectiveness evaluation8
and France, together with large investment needs and bottlenecks in financing, appear to be important reasons for shortfalls in implementing the requirements of the directive in time. In particular, the fact that local municipalities in Spain and France are responsible for the provision of sewage treatment, while not in full control of the financial resources required, has led to lengthy negotiations on financing that were not conducive to the timely implementation of the agreed measures.
Taking each of the six countries in turn:
• Denmark complies fully with UWWTD and discharges to surface waters have decreased by more than 90 %. However, the Danish approach to implementation appears to have been comparatively costly. Construction of sewage treatment plant capacity and the associated investment have been notably higher per capita than in the comparable case of the Netherlands.
• France has not yet responded fully to the challenge of the UWWTD, as in sensitive and non-sensitive areas 58 % and 37 % respectively of wastewater plants discharge below the required standards (EC, 2004a). France does not appear to be reaping the full benefits of its advanced management system with river basin management, full-cost pricing and a water-pollution control levy. French water-pollution levies remain modest by European standards, and the system could be fine-tuned to address the implementation gap.
• The Netherlands is close to compliance with the UWWTD. Discharges to surface waters have decreased by more than 90 %. However, it has not installed sufficient advanced treatment for nitrogen in some large cities. The Netherlands spends a lower share of GDP on water pollution control than the other Member States examined. Economic instruments
have been used to provide incentives to polluters to reduce pollution at source, rather than opting for the more expensive end-of-pipe solution of public sewage treatment.
• Spain has not yet achieved compliance with the UWWTD. An implementation gap persists in Spain despite the substantial EU subsidies devoted to supporting the implementation of the directive. For example, between 1993 and 2002 more than 3.8 billion Euro were provided in support from the Cohesion Fund, covering about half of Spanish investment in sewage control and up to 85 % of individual sewage treatment plant investments.
• Estonia, as a new Member State, has until 2010 to comply with UWWTD. As a result of wastewater investments, and of industrial decline, discharges to surface waters have been reduced by more than 90 % in just ten years. The Estonian water pollution levy is modest, however, and there is a risk that domestic environmental financing will not suffice if UWWTD requirements are to be implemented in time.
• Poland also has until 2010 to comply with the UWWTD for industry and large cities. Discharges to surface waters were reduced by about 24 % during the 1990s. Polish industry has made substantial investment, up to 0.5 % of gross value added annually, on water-pollution control. EU support is now available from the Cohesion and Structural Funds, but new methods of distributing these funds could help to improve implementation and cost-effectiveness.

9Policy effectiveness evaluation
The pilot study illustrates that more emphasis is needed on eco-efficiency in wastewater management. This becomes clear from a careful review of the approach adopted in the Netherlands. The use of economic instruments in the Dutch case, as an incentive to industry to reduce discharges at source, has reduced the need for public sewage-treatment plant capacity — and public investments — to a level well below that in other countries.
In contrast, water pollution taxes are rather low in France, Spain and Estonia, and full-cost pricing of sewage treatment is not in place in Poland, Spain or Estonia. The absence of economic incentives to promote eco-efficiency raises the question whether the Member States will be able to meet the requirements of the UWWTD cost-effectively. The main reason for delays in implementing the UWWTD remains the costs involved, so eco-efficient approaches that minimise investment warrant further attention. Greater emphasis on eco-efficiency, and economic incentives that promote wastewater reduction at source, are likely to be the keys to more timely and cost-effective implementation of the UWWTD in Member States.
The Dutch approach demonstrates that substantial savings in investment costs can be made if advantage is taken at an early stage of applying water pollution control levies and the incentives they provide for controlling the sources of pollution. The efficiency of the incentive approach appears to be reflected in the fact that water pollution control expenditure in the Netherlands (only 0.6 % of GDP) is about 20 % lower than in France (0.8 % of GDP), despite a higher rate of compliance with the UWWTD.
The Dutch-Danish comparison suggests that in Member States with low or inadequate water pollution levies (Spain, France and Estonia) or no full-cost pricing of sewerage (Spain, Estonia and Poland), there is a risk of over-investment in excessive capacity if account is not taken of the potential for reducing discharges from industrial sources.
Share of population served with public sewage treatment, and type of treatment offered
Mechanical Biological Advanced
%
0
10
20
30
40
50
60
70
80
90
100
Denmar
k
Fran
ce
Spain
Poland
Esto
nia
Nethe
rland
s
Note: The figures refer to total coverage by public sewage treatment plants and not just those specified according to the detailed UWWTD requirements.
Source: EEA, OECD, Eurostat.
The report presents a comparative overview showing that full connection has almost been achieved in Denmark, the Netherlands and France, with Spain and Poland lagging further behind, Estonia being in between. Simple mechanical treatment phased out in most countries, but advanced treatment has not been sufficiently extended in France, the Netherlands, Poland or Estonia, remaining almost absent from Spain.

Policy effectiveness evaluation10
Net load on surface waters — organic discharges (BOD) from sewage treatment plants, industry and other direct outlets, 1970–2002
Note: Absent or incomplete data on industrial discharges in Spain preclude calculation of the development in discharges. Available data suggest decreasing net loads over time.
Source: OECD, UNECE, Danish National Environmental Research Institute and national statistical services.
Changes in total discharges to surface waters in selected Member States are displayed, including both direct and indirect discharges of BOD. The net load concept has been developed by the Dutch Central Bureau of Statistics, which publishes such a figure annually for the Netherlands. For Denmark and France net loads have been calculated on the basis of the statistical sources available. For Poland and Estonia, Helcom work contributes to the calculation of net loads. In Poland, discharges have been reduced by about 24 % between late 1980s and mid-1990s. In Estonia the impressive reduction of about 95 % since the early 1990’s resulted from clean water policies as well as economic restructuring. In fact, per capita BOD discharge from industry and households combined is currently similar to the level in the Netherlands and Denmark. The net load indicator does not contain a spatial dimension, so the observed overall decreases can mask regional differences and undesirable local effects. However, the dramatic decline in the net load on surface waters clearly indicates the effect on organic discharges of improved sewage treatment capacity combined with industrial pre-treatment. In terms of effectiveness, the net load indicator reveals the first-order outcome of the policy: organic discharges have been reduced.
Index (policy start year = 100)
Denmark France Netherlands PolandEstonia
0
20
40
60
80
100
120
1970
1972
1974
1976
1978
1980
1982
1984
1986
1988
1990
1992
1994
1996
1998
2000
2002
In order to maximise the impact of EU funding, wastewater treatment plant capacity should be optimised. This could also help avoid the risk that these countries might incur larger operational costs than necessary, which they themselves would have to meet.
It is expected that cohesion policy, through the allocation of Cohesion and Structural Funds, will continue to support sewage
treatment plants for all 10 new Member States from its proposed budget for 2007–2013. Such support is greatly needed as current investments in Poland and Estonia are at the level of 5–10 Euro per capita (not PPP-adjusted), and it is estimated that this level will need to be increased to a level of about 40–50 Euro per capita in order for these countries to comply with the agreed deadlines.
11Policy effectiveness evaluation
The Cohesion and Structural Funds could also address the polluter-pays principle more systematically. If there are no economic instruments in place to provide industries with an incentive to promote eco-efficiency and to reduce pollution at source, there appears to be a risk that EU subsidies could lead to excess investment in sewage-treatment plant capacity. The right balance between prevention and adequate sewage treatment capacity needs to be found, not least because sewage treatment is one of
the most capital-intensive environmental measures.
Water-pollution control costs account for about 0.8 % of GDP in several Member States and have absorbed more than 50 % of all environmental investment in recent decades. Affordability and competitiveness concerns are legitimate, but the good news is that there is evidence that the polluter-pays principle can smooth implementation by helping to control costs.

Policy effectiveness evaluation12
Pilot study 2
Policies for managing packaging waste: how effective are they?
This study focuses on the effectiveness of packaging waste management systems in five EU Member States: Austria, Denmark, Ireland, Italy and the United Kingdom (4). The analysis considers the national regulations and measures established in the context of the Packaging and Packaging Waste Directive (94/62/EC). The conclusions aim to highlight the lessons that can be learned from the most effective features of these national systems. The packaging directive includes an objective to reduce waste generated, together with quantitative targets for the recycling and recovery of packaging waste, and the study investigates the responses to these. The directive forms the basis for the establishment of packaging waste management systems in some countries, whereas others already had such systems in place. Annual national reports since 1997 make packaging policy a relatively data-rich area for effectiveness analysis.
Packaging waste is a significant waste stream. The amended packaging and packaging waste directive has recently been adopted by the European Parliament and Council of Ministers, and work is underway to develop EU thematic strategies on waste prevention and recycling and on the sustainable use and management of natural resources. The packaging directive contains directly measurable, quantitative targets. It has now been in place for ten years and this is an opportune time to take stock of this important policy area.
This pilot study is a comparative evaluation of the effectiveness of packaging waste management systems in Austria, Denmark, Ireland, Italy and the United Kingdom. It makes an ex-post analysis of the effectiveness of the systems in terms of their contribution to fulfilling the environmental objectives specified in the EU directive, and national targets where applicable. It primarily covers data from 1997 to 2001. Direct comparison between countries’ waste generation is not
possible because of differences in data-reporting methodologies. Rather than being a simple ‘ranking’ exercise, the study aims to provide a deeper analysis of how these national systems work, highlighting elements that work well.
It is an objective of the sixth environment action programme to achieve a significant reduction in the volumes of waste generated, and prevention has also been given top priority in the waste hierarchy. The packaging directive’s overall objective is to reduce waste generation. For these reasons particular attention was paid to the issue of prevention, despite the fact that it is difficult to deal with and to measure because of constantly changing consumer demand, distribution systems and packaging materials.
(4) EEA, 2005: Effectiveness of packaging waste management systems in selected countries: an EEA pilot study. EEA Report No 3/2005.

13Policy effectiveness evaluation
Taking each country in turn:
• Austria had a system in place before the directive was agreed in 1994. The producer responsibility scheme for packaging waste (ARA) was established in 1993. It has managed to reach very high levels of recovery and recycling, much higher than required by the directive, and already fulfils the targets for 2008 in the revised directive. ARA is a full-cost system, covering more of the costs of collection, sorting and recovery than the other countries investigated. Consequently it is comparatively expensive.
• In Denmark, local authorities are responsible for establishing the necessary collection and recycling schemes. The deposit-return system for beverage packaging is one of the cornerstones of waste prevention. When the directive came into effect, recycling levels were already well on the way to meeting its targets. To meet the new obligations, it was decided to focus on transport packaging rather than household packaging, and the 2001 targets were successfully met with the exception of 15 % recycling of plastics waste which was missed by 1 %.
• The main policy measure in Ireland is the producer responsibility scheme Repak. Ireland has a derogation from certain requirements of the directive, meaning that it has to achieve the directive’s recycling and recovery targets by 2005, with a minimum recovery rate of 25 % by 2001. With extensive dependence on landfill, recycling is the only current recovery operation, and this reached the 2001 target of 25 %. Ireland’s packaging waste management system remains ‘work in progress’: extensive development of household waste management infrastructure and the impact of the
landfill directive are likely to have a significant impact in the coming years.
• The main measure in Italy for meeting the targets of the directive is the CONAI producer-responsibility scheme. CONAI pays the local authorities for the additional cost associated with the increase in collection of packaging. Total quantities of packaging waste increased by 19 % between 1997 and 2001. The directive’s recovery and recycling targets were met in 2001 as recovery rates increased to 50 % and recycling rates to 46 %. There are large differences between the amount of packaging waste collected separately for recycling and recovery in northern and southern Italy.
• The main measure in the United Kingdom is the producer-responsibility scheme (packaging waste recovery notes). This focuses on commercial waste, aiming to meet the directive’s targets in a cost-effective, competitive manner. Responsibility is shared along the packaging chain, obliging business to take responsibility for a certain amount of packaging according to their activities. Recent figures reveal increasing quantities of packaging. The recycling rate in 2001 was 42 %, exceeding the directive’s targets, but the 50 % recovery target was missed by 2 % in 2001. The financing need fluctuates widely due to annual PRN (packaging recovery notes) price changes. Measured per tonne of packaging recovered, the system appears to have achieved its goal of meeting the targets at the lowest possible cost to industry. However, because PRN turnover does not reflect the total costs, it is uncertain whether the system operates at lowest possible cost to society. Although competitive, this industry-orientated approach has resulted in a lack of public involvement and awareness of packaging waste issues.

Policy effectiveness evaluation14
Despite the packaging directive’s overall objective of reducing waste generation, targets address recovery and recycling, not reduction per se. The study highlights this distinction between targets and objectives, pointing out that full compliance with the targets does not automatically amount to achievement of the policy’s wider objective of reducing waste volumes. Of the five countries examined, those with initially high levels of recycling are maintaining their level while the others are steadily increasing it. Because the manufacture of packaging accounts for a large share of its environmental impacts, measures to reduce the generation of packaging (in combination with waste management efforts) have greater potential to reduce overall environmental impacts than the management of the waste alone. However, this principle must be balanced with overall resource efficiency, costs and internal market obligations.
Despite absolute increases in packaging waste generation as the table below illustrates, all countries except Italy achieved a relative decoupling of generation and economic growth (although associated error margins are not quantified).
There are indications that packaging waste recycling systems are reaching their upper limits in several countries. The analysis shows that the marginal cost of increasing recycling generally increases with higher levels of recycling, because to achieve higher levels requires collecting fractions which are less suitable for recycling. Denmark and the United Kingdom, whose systems target self-contained waste streams such as commercial and transport packaging, will need to increase focus on other waste streams (such as household waste) to obtain further increases in recycling levels. Although the expense of expanding systems to include more household waste may appear considerable, it can have disproportionately large benefits in terms of raising public awareness and action.
Cost-effectiveness information is not directly comparable between countries. This reflects different institutional decisions between countries: the fees of some compliance schemes include all costs (Austria), while others serve merely as an intervention to enhance the attractiveness of the recycling option (Italy), supplemented by local authority support. There are indistinguishable overlaps between costs borne by local authorities and compliance schemes.
Trends in recycling rates, 1997–2003
Note: Wood packaging has been added to the reported Danish data for supply of packaging and the recycling rate for Denmark is thus not the data reported to the Commission. The recycling rate for Ireland does not include wood.
0
10
20
30
40
50
60
70
80
1997
1998
1999
2000
2001
2002
2003
Recycling, %
Austria Denmark IrelandItaly United Kingdom
Recycling rates in 1997 varied from 15 % in Ireland to 64 % in Austria. By 2002, Ireland had increased recycling to 35 % and Austria to 66 %. The systems in Italy and the United Kingdom established in or around 1997–1998 have managed to produce steadily increasing recycling levels, reaching 45–50 % in 2002, levels similar to Denmark’s.
15Policy effectiveness evaluation
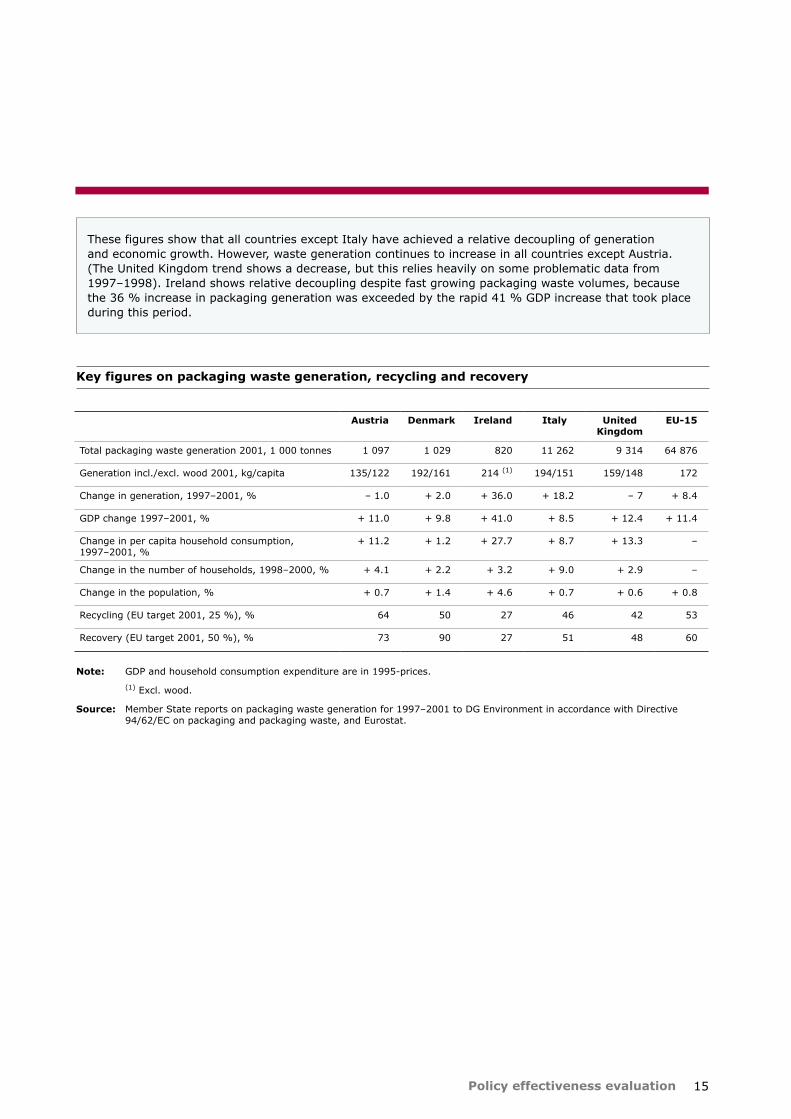
Key figures on packaging waste generation, recycling and recovery
Austria Denmark Ireland Italy United Kingdom
EU-15
Total packaging waste generation 2001, 1 000 tonnes 1 097 1 029 820 11 262 9 314 64 876
Generation incl./excl. wood 2001, kg/capita 135/122 192/161 214 (1) 194/151 159/148 172
Change in generation, 1997–2001, % – 1.0 + 2.0 + 36.0 + 18.2 – 7 + 8.4
GDP change 1997–2001, % + 11.0 + 9.8 + 41.0 + 8.5 + 12.4 + 11.4
Change in per capita household consumption, 1997–2001, %
+ 11.2 + 1.2 + 27.7 + 8.7 + 13.3 –
Change in the number of households, 1998–2000, % + 4.1 + 2.2 + 3.2 + 9.0 + 2.9 –
Change in the population, % + 0.7 + 1.4 + 4.6 + 0.7 + 0.6 + 0.8
Recycling (EU target 2001, 25 %), % 64 50 27 46 42 53
Recovery (EU target 2001, 50 %), % 73 90 27 51 48 60
Note: GDP and household consumption expenditure are in 1995-prices.
(1) Excl. wood.
Source: Member State reports on packaging waste generation for 1997–2001 to DG Environment in accordance with Directive 94/62/EC on packaging and packaging waste, and Eurostat.
These figures show that all countries except Italy have achieved a relative decoupling of generation and economic growth. However, waste generation continues to increase in all countries except Austria. (The United Kingdom trend shows a decrease, but this relies heavily on some problematic data from 1997–1998). Ireland shows relative decoupling despite fast growing packaging waste volumes, because the 36 % increase in packaging generation was exceeded by the rapid 41 % GDP increase that took place during this period.

European Environment AgencyKongens Nytorv 61050 Copenhagen KDenmark
Tel.: +45 33 36 71 00Fax: +45 33 36 71 99
Web: www.eea.eu.intEnquiries: www.eea.eu.int/enquiries
TH
-70-0
5-5
92-E
N-1
INSERT IMAGE