policy-enabled traffic engineering in maritime tactical
TRANSCRIPT

Policy-Enabled Traffic Engineering in
Maritime Tactical Networks
By
David A. Kidston
A Thesis Submitted to
The Faculty of Graduate Studies and Research
in partial fulfillment of the requirements for the degree of
Doctor of Philosophy
Ottawa-Carleton Institute of Electrical and Computer Engineering
Department of Systems and Computer Engineering
Carleton University
Ottawa, Ontario, Canada
August 28th, 2008
©2008 David A. Kidston

ii
Abstract
Naval at sea (maritime tactical) networks are characterised by a dynamic, heterogeneous,
and low-bandwidth environment. The effective management of communication resources
in this domain is critical, but is hampered by constraints imposed by a hierarchical
command structure and dynamic mission requirements. The most critical network
management issue in maritime networks is the limited bandwidth connecting each node
(ship) is often insufficient to support the network traffic generated locally. This leads to
very poor perceived Quality of Service (QoS) for all traffic. A solution common in fixed
networks is to use Traffic Engineering (TE) techniques. The goal of TE is to facilitate
efficient and reliable network operations while simultaneously optimizing network
resource utilization and traffic performance.
This concept has been applied in the maritime environment by developing four Policy-
Enabled Traffic Engineering (PETE) services for this environment: traffic monitoring,
traffic prioritisation, adaptive routing, and resource reservation. The flow-based resource
reservation service is a novel mechanism we developed to provide robust and efficient
end-to-end bandwidth reservations.
To evaluate the PETE services, our methodology focused on modelling and performance
evaluation of the management services using simulation. Since maritime networks have
not been described in depth in the literature, the modelling exercise provided valuable
insight into the challenges of operating such networks. Simulation allowed us to evaluate
our management solutions for different networks sizes, node mobility, and traffic types.
Results from these simulations are encouraging. With policy control, the traffic
monitoring service was able to adapt to dynamic network conditions and provide global
traffic statistics within a policy defined delay. The traffic prioritisation service was able to
achieve an improvement in delay from approximately 17% in a saturated network to 52%
in an overloaded network. Similarly, adaptive routing greatly improved the QoS achieved
by sending some traffic over under-used links while simultaneously improving the QoS of

iii
other traffic by spreading the load over multiple links. The resource reservation service
was found to be particularly effective in the maritime environment with an acceptance rate
19-76% better than RSVP and 86-1095% better than INSIGNIA, two alternative
reservation protocols. The resource reservation service model was validated against results
from a prototype implementation.

iv
Acknowledgements
This dissertation would not have been possible without the help of many people. I would
like to take this opportunity to express my deep appreciation to all those who lent a hand
in this arduous but deeply rewarding process.
First, I would like to thank my supervisor Professor Thomas Kunz. He was very patient
and supportive for the many years over which the development of this thesis seemed to
stretch on and on. His guidance provided me with the expertise to overcome the many
technical and procedural hurdles that come with a work of this size. His unfailing
optimism and good sense kept me on track.
I also extend my appreciation to the several sources which provided financial support
over many years. Thanks the gang at CRC for their support during the development of the
thesis. I am grateful to Dr. John Robinson for his unfailing support and encouragement to
get the job done. Many thanks to DRDC for financing the maritime network management
project in which the ideas for this thesis were developed and from which the policy
system used in this thesis is based. Thanks as well to the rest of the research team that
worked on the project: Isabelle Labbe, Francis St. Onge and Jean-François Roy. Without
you there would have been no policy system.
A special thank-you goes out to the anonymous reviewers from the various conferences
to which I submitted papers related to this work. Their input was invaluable in the
clarification and expression of the ideas you see presented here.
Last but not least I am deeply grateful for the moral support of my wife, children, parents
and friends for their love and encouragement through all the highs and lows. Without you
I would never have reached this stage in my life – my gratitude is beyond words.

v
Table of Contents
ABSTRACT ..................................................................................................................................................II
ACKNOWLEDGEMENTS ....................................................................................................................... IV
TABLE OF CONTENTS .............................................................................................................................V
LIST OF TABLES................................................................................................................................... VIII
LIST OF FIGURES.................................................................................................................................... IX
GLOSSARY OF TERMS .......................................................................................................................... XI
1 INTRODUCTION................................................................................................................................1
2 BACKGROUND ..................................................................................................................................5
2.1 THE MARITIME ENVIRONMENT ................................................................................................5
2.1.1 Communication Bearers ..........................................................................................................7
2.1.2 Routing Capabilities ................................................................................................................8
2.1.3 Traffic Characterisation ..........................................................................................................9
2.1.4 Management Issues and Requirements..................................................................................11
2.1.5 Comparison with Alternate Networking Paradigms..............................................................17
2.2 POLICY-BASED NETWORK MANAGEMENT (PBNM)...............................................................24
2.2.1 Policy Concepts .....................................................................................................................25
2.2.2 Standards...............................................................................................................................26
2.2.3 Benefits of PBNM ..................................................................................................................28
2.3 THE SERVICE ORIENTED ARCHITECTURE...............................................................................29
2.4 SUMMARY ..............................................................................................................................30
3 RELATED WORK ............................................................................................................................33
3.1 TRAFFIC ENGINEERING IN FIXED NETWORKS.........................................................................33
3.2 TRAFFIC ENGINEERING IN MOBILE NETWORKS......................................................................36
3.3 POLICY BASED NETWORK MANAGEMENT..............................................................................40
3.4 SUMMARY ..............................................................................................................................41
4 POLICY-ENABLED TRAFFIC ENGINEERING ................. ........................................................44
4.1 THE MARITIME POLICY SYSTEM ............................................................................................45
4.1.1 The PBNM Architecture ........................................................................................................45
4.1.2 Policy Representation............................................................................................................47
4.1.3 Policy Services.......................................................................................................................49

vi
4.2 THE PETE MANAGEMENT SERVICES.....................................................................................56
4.2.1 The Traffic Monitoring Service..............................................................................................57
4.2.2 The Traffic Prioritisation Service ..........................................................................................59
4.2.3 The Adaptive Routing Service................................................................................................61
4.2.4 The Resource Reservation Service.........................................................................................63
4.3 SUMMARY ..............................................................................................................................64
5 SIMULATION RESULTS – PART ONE........................................................................................67
5.1 METHODOLOGY......................................................................................................................67
5.2 SIMULATION SETUP................................................................................................................69
5.2.1 Network Topology..................................................................................................................69
5.2.2 Mobility Model ......................................................................................................................71
5.2.3 Background Traffic Model.....................................................................................................74
5.3 MODELS OF THE SERVICES.....................................................................................................76
5.3.1 Policy Distribution Service....................................................................................................76
5.3.2 Traffic Monitoring Service ....................................................................................................76
5.3.3 Traffic Prioritisation Service .................................................................................................77
5.3.4 Adaptive Routing Service.......................................................................................................79
5.4 RESULTS.................................................................................................................................79
5.4.1 Policy Distribution Service....................................................................................................79
5.4.2 Traffic Monitoring Service ....................................................................................................81
5.4.3 Traffic Prioritisation Service .................................................................................................84
5.4.4 Adaptive Routing Service.......................................................................................................87
5.5 SUMMARY ..............................................................................................................................88
6 THE RESOURCE RESERVATION SERVICE .............................................................................90
6.1 OVERVIEW .............................................................................................................................90
6.2 ROUTE GENERATION (PHASE ONE) ........................................................................................95
6.2.1 Topology Discovery...............................................................................................................95
6.2.2 Route Generation...................................................................................................................97
6.3 ADMISSION CONTROL PROBING (PHASE TWO).....................................................................102
6.3.1 Route Probing......................................................................................................................103
6.3.2 Bidirectional Reservations...................................................................................................104
6.4 ROUTE SELECTION AND ENFORCEMENT (PHASE THREE)......................................................105
6.4.1 Route Selection Algorithm ...................................................................................................106
6.4.2 Resource Allocation and Enforcement.................................................................................108
6.4.3 Pre-emption Algorithm ........................................................................................................108
6.5 RESERVATION MAINTENANCE (PHASE FOUR) ......................................................................110

vii
6.5.1 Route Maintenance and Termination ..................................................................................110
6.5.2 On Pre-emption ...................................................................................................................112
6.5.3 On Link Failure ...................................................................................................................114
6.5.4 Fault-Tolerance: Timeouts and Acknowledgements............................................................115
6.6 SUMMARY ............................................................................................................................116
7 SIMULATION RESULTS – PART TWO.....................................................................................118
7.1 SIMULATION SETUP..............................................................................................................118
7.1.1 Request Source Model .........................................................................................................119
7.1.2 Request Load Model ............................................................................................................119
7.1.3 Protocol Configuration Notes..............................................................................................119
7.2 MODELS OF THE RESERVATION PROTOCOLS........................................................................120
7.2.1 RRS Model ...........................................................................................................................121
7.2.2 RSVP Model.........................................................................................................................122
7.2.3 INSIGNIA Model .................................................................................................................123
7.3 RESULTS...............................................................................................................................124
7.3.1 RRS vs. RSVP, Static Network Model ..................................................................................124
7.3.2 Effect of Mobility on RRS and RSVP ...................................................................................125
7.3.3 Effect of Pre-Emption ..........................................................................................................127
7.3.4 RRS vs. INSIGNIA ...............................................................................................................129
7.4 POLICY-BASED CONTROL OF RRS .......................................................................................132
7.5 SUMMARY ............................................................................................................................134
8 VALIDATION RESULTS ..............................................................................................................136
8.1 METHODOLOGY....................................................................................................................136
8.2 TEST-BED SETUP..................................................................................................................136
8.3 SIMULATION SETUP..............................................................................................................137
8.4 RESULTS...............................................................................................................................138
9 CONCLUSION AND FUTURE WORK .......................................................................................140
9.1 SUMMARY ............................................................................................................................140
9.2 DIRECTIONS FOR FUTURE WORK..........................................................................................144
APPENDIX A: RRS PROTOCOL DETAILS ......................................................................................147
APPENDIX B: BIDIRECTIONAL ROUTING EXAMPLE...................... .........................................152
APPENDIX C: POLICY LANGUAGE DETAILS ..............................................................................156
APPENDIX D: NETWORK MODEL DESCRIPTION.......................................................................172
REFERENCES ..........................................................................................................................................189

viii
List of Tables
TABLE 1, COMMUNICATIONS SUBNET MATRIX ................................................................................................7
TABLE 2, SAMPLE NETWORK APPLICATION BANDWIDTH REQUIREMENTS (FROM [13]).................................11
TABLE 3, COMPARISON OF MARITIME NETWORKS WITH INFRASTRUCTURE-BASED NETWORKS. ...................20
TABLE 4, COMPARISON OF MARITIME NETWORKS WITH INFRASTRUCTURE-LESS NETWORKS.......................22
TABLE 5, SIMULATED BASELINE TRAFFIC......................................................................................................74
TABLE 6, WFQ WEIGHTINGS USED FOR TPS.................................................................................................78
TABLE 7, POLICY DISTRIBUTION DELAY IN SECONDS, SMALL NETWORK......................................................79
TABLE 8, POLICY DISTRIBUTION DELAY IN SECONDS, LARGE NETWORK......................................................80
TABLE 9, TRAFFIC MONITORING DELAY IN SECONDS, SMALL NETWORK......................................................81
TABLE 10, TRAFFIC MONITORING DELAY IN SECONDS, LARGE NETWORK....................................................82
TABLE 11, POLICY DISTRIBUTION DELAY IN SECONDS, SMALL NETWORK WITH TPS ...................................84
TABLE 12, POLICY DISTRIBUTION DELAY IN SECONDS, LARGE NETWORK WITH TPS ...................................85
TABLE 13, TRAFFIC MONITORING DELAY IN SECONDS, SMALL NETWORK WITH TPS ...................................85
TABLE 14, TRAFFIC MONITORING DELAY IN SECONDS, LARGE NETWORK WITH TPS ...................................85
TABLE 15, EFFECT OF TPS AND ARS ON VOICE CALL DELAY .......................................................................88
TABLE 16, EQUATING OSPF COST TO LINK TYPE..........................................................................................96
TABLE 17, ACCEPTANCE RATES, STATIC NETWORK ....................................................................................124
TABLE 18, ACCEPTANCE RATES, MOBILE NETWORK...................................................................................125
TABLE 19, RESERVATION FAILURE RATES (DUE TO MOBILITY)....................................................................126
TABLE 20, PRE-EMPTION RATES (RRS ONLY) ..............................................................................................127
TABLE 21, INSIGNIA RESULTS (STATIC NETWORK)...................................................................................131
TABLE 22, INSIGNIA RESULTS (MOBILE NETWORK) .................................................................................131
TABLE 23, RRS SIMULATION RESULTS WITH DISTRIBUTED REQUESTS...................................................... 139
TABLE D - 1, TRAFFIC MODELS....................................................................................................................186

ix
List of Figures FIGURE 1, TYPICAL MARITIME NETWORK ........................................................................................................6
FIGURE 2, TRAFFIC BREAKDOWN FOR A NAVAL EXERCISE (FROM [13]) ........................................................10
FIGURE 3, MARITIME RED/BLACK NETWORK DICHOTOMY............................................................................17
FIGURE 4, IETF POLICY ARCHITECTURE........................................................................................................27
FIGURE 5, PROPOSED POLICY ARCHITECTURE FOR MARITIME ENVIRONMENTS.............................................46
FIGURE 6, HL POLICY DISTRIBUTION (FROM [6])...........................................................................................50
FIGURE 7, POLICY DISTRIBUTION ALGORITHM PSEUDO CODE.......................................................................50
FIGURE 8, COMPONENT REGISTRATION AND DISCOVERY SERVICES..............................................................52
FIGURE 9, POLICY PROVISIONING PROCESS....................................................................................................53
FIGURE 10, TASK GROUP GEOMETRIC CONFIGURATION................................................................................69
FIGURE 11, SMALL NETWORK TOPOLOGY......................................................................................................70
FIGURE 12, LARGE NETWORK TOPOLOGY......................................................................................................70
FIGURE 13, INTER-TASK GROUP MOBILITY .....................................................................................................72
FIGURE 14, NETWORK FORMATION (LOS LINKS) OF LARGE NETWORK (STATIC)..........................................74
FIGURE 15, ADAPTIVE TRAFFIC MONITORING IN A SMALL NETWORK WITH DYNAMIC LOAD .......................83
FIGURE 16, EFFECT OF A POLICY CHANGE ON POLICY DISTRIBUTION DELAY (WITH AVERAGES) ..................87
FIGURE 17, DISTRIBUTED ADMISSION CONTROL ALGORITHM .......................................................................93
FIGURE 18, ADMISSIONCONTROL ALGORITHM PSEUDO-CODE......................................................................94
FIGURE 19, BEST-PATH ALGORITHM PSEUDO CODE......................................................................................99
FIGURE 20, BEST-PATH EXAMPLE ..................................................................................................................99
FIGURE 21, MULTIPLE-DISJOINT-PATH ALGORITHM PSEUDO CODE............................................................100
FIGURE 22, MULTIPLE-DISJOINT-PATH EXAMPLE ........................................................................................100
FIGURE 23, MULTIPLE-PARTIALLY -DISJOINT-PATH ALGORITHM PSEUDO CODE........................................101
FIGURE 24, MULTIPLE-PARTIALLY -DISJOINT-PATH EXAMPLE WITH L=1....................................................101
FIGURE 25, MULTIPLE-PARTIALLY -DISJOINT-PATH EXAMPLE WITH L=2....................................................102
FIGURE 26, ROUTE-SELECT ALGORITHM PSEUDO CODE..............................................................................107
FIGURE 27, ROUTE SELECTION ALGORITHM ................................................................................................107
FIGURE 28, PRE-EMPTION ALGORITHM PSEUDO CODE.................................................................................109
FIGURE 29, MAINTENANCE ALGORITHM PSEUDO CODE ..............................................................................111
FIGURE 30, THE RRS PROCESS MODEL.........................................................................................................122
FIGURE 31, INSIGNIA PROCESS MODEL......................................................................................................123
FIGURE 32, EXAMPLE OF NETWORK-WIDE RESERVED BANDWIDTH IN INSIGNIA .....................................130
FIGURE 33, EFFECT OF POLICY CHANGE ON NETWORK-WIDE RESERVED BANDWIDTH IN RRS ..................133
FIGURE 34, VALIDATION CONFIGURATION FOR THE TEST-BED ....................................................................137
FIGURE 35, VALIDATION CONFIGURATION IN OPNET................................................................................ 138
x
FIGURE A - 1, RSS PACKET PROCESSING FLOWCHART ............................................................................... 151
FIGURE B - 1, NETWORK CONNECTIVITY DIAGRAM EXAMPLE.................................................................... 153
FIGURE C - 1, HL TM POLICY REPRESENTATION.........................................................................................158
FIGURE C - 2, SAMPLE TM POLICY IN XML.................................................................................................159
FIGURE C - 3, HL TP POLICY REPRESENTATION..........................................................................................160
FIGURE C - 4, SAMPLE TP POLICY IN XML..................................................................................................161
FIGURE C - 5, HL AR POLICY REPRESENTATION.........................................................................................161
FIGURE C - 6, SAMPLE AR POLICY IN XML.................................................................................................162
FIGURE C - 7, HL RR POLICY REPRESENTATION..........................................................................................163
FIGURE C - 8, SAMPLE RR POLICY IN XML .................................................................................................164
FIGURE C - 9, JRULES ENGINE COMPONENTS...............................................................................................165
FIGURE C - 10, JRULES EXAMPLE.................................................................................................................166
FIGURE C - 11, SPECIFICATION POLICY RULES..............................................................................................166
FIGURE C - 12, LL TP POLICY XML REPRESENTATION...............................................................................168
FIGURE C - 13, LL TP XML POLICY CLASS-MAP SUB-ELEMENTS...............................................................169
FIGURE C - 14, LL TP POLICY EXAMPLE..................................................................................................... 170
FIGURE D - 1, SCENARIO FOR THE SMALL STATIC NETWORK WITH LOW BACKGROUND TRAFFIC...............174
FIGURE D - 2, OBJECT PALETTE ...................................................................................................................176
FIGURE D - 3, WORKSTATION NODE MODEL WITH RRS CAPABILITY ..........................................................177
FIGURE D - 4, THE CUSTOM SHIP_CLIENT_ADV NODE MODEL.....................................................................178
FIGURE D - 5, CONFIGURABLE ATTRIBUTES OF SHIP 4 (SHIP_CLIENT_ADV NODE MODEL)...........................181
FIGURE D - 6, CONFIGURATION OF 1ST WIRELESS LAN INTERFACE ON SHIP 4 ............................................182
FIGURE D - 7, OSPF CONFIGURATION ON SHIP 4 ..........................................................................................183
FIGURE D - 8, TRAJECTORY GENERATION ALGORITHM................................................................................184
FIGURE D - 9, THE 19TH TRAJECTORY GENERATED FOR SHIP4 IN THE SMALL NETWORK ..........................185
FIGURE D - 10, BACKGROUND TRAFFIC DEFINITIONS ..................................................................................186

xi
Glossary of Terms
API Application Programmer Interface
ARS Adaptive Routing Service
AS Autonomous System
BGP4 Border Gateway Protocol (version) 4
BLOS Beyond Line-of-sight (radio)
CIM Common Information Model
COP Common Operational Picture
COPS Common Open Policy Service
COPS-PR COPS Usage for Policy Provisioning
CoS Class of Service
DCOM Distributed Component Object Model
DES Discrete Event Simulation
DiffServ Differentiated Services
DMTF Distributed Management Task Force
DSR Dynamic Source Routing
ELOS Extended Line-of-sight (radio)
FEC Forwarding Equivalence Class
FQMM Flexible QoS Model for Mobile Ad hoc Networks
HF High Frequency (radio)
HL High Level (policy)
HTTP Hyper Text Transfer Protocol
HTTPS Hyper Text Transfer Protocol with Security
IEEE Institute of Electrical & Electronics Engineers
IETF Internet Engineering Task Force
INMARSAT International Marine/Maritime Satellite
INSIGNIA In-band Signalling (protocol)
IntServ Integrated Services
IP Internet Protocol
IPSec IP Security

xii
ISP Internet Service Provider
LL Low Level (policy)
LOS Line-of-sight (radio)
LSA Link State Advertisement
LSDB Link State Data Base
MAC Medium Access Control
MANET Mobile Ad-Hoc Network
MCOIN Maritime Command Operational Information Network
MIB Management Information Base
MIMS Minicom Information Management System
MPLS Multi Protocol Label Switching
MTR Multi Topology Routing
NETCONF Network Configuration Protocol
NM Network Management
NOC Network Operations Centre
OASIS Organization for the Advancement of Structured Information Standards
OSPF Open Shortest Path First
PBNM Policy-Based Network Management
PBTM Policy-Based Traffic Manager (the maritime policy system)
PDP Policy Decision Point
PETE Policy-Enabled Traffic Engineering
PEP Policy Enforcement Point
PSI Policy Service Interface
QoS Quality of Service
RRS Resource Reservation Service
RSVP Resource Reservation Protocol
SAP Systems, Applications and Products (software)
SATCOM Satellite Communications
SHF Super High Frequency (radio)
SL Specification Level (policy)
SLA Service Level Agreement

xiii
SNMP Simple Network Management Protocol
SOA Service Oriented Architecture
SOAP Simple Object Access Protocol
SWAN Stateless Wireless Ad-Hoc Networks (protocol)
TCP Transmission Control Protocol
TE Traffic Engineering
TMS Traffic Monitoring Service
TPS Traffic Prioritisation Service
UAV Unmanned Arial Vehicle
UDDI Universal Description, Discovery and Integration
UDP User Datagram Protocol
UHF Ultra High Frequency (radio)
VC Virtual Circuit
VHF Very High Frequency (radio)
VOIP Voice Over IP (voice call)
VTC Video Teleconference
W3C World Wide Web Consortium
WAN Wide Area Network
WS Web Services
WSDL Web Services Description Language
XML eXtensible Markup Language

1
1 Introduction
Many of the challenges in relation to next generation multi-bearer networks lay not so
much in how we build them, but in how we manage them in the face of complex
mobility, security and service provisioning issues. Naval at sea (tactical maritime)
networks are particularly difficult to manage due to their dynamic, heterogeneous, and
low-bandwidth connectivity. Such networks typically consist of small clusters of mobile
nodes with dynamic membership. Nodes may host wired sub-networks but are
interconnected by a heterogeneous combination of satellite and limited range low-
bandwidth radio links which may be connected as part of a mobile ad-hoc network
(MANET).
Naval at sea (maritime tactical) networks have not been well described in the literature
though they are significantly different from both contemporary terrestrial fixed networks
and MANETs. While fixed networks can be characterised by stable, low error rate, high
bandwidth links, maritime networks can be characterised by a number of factors
including: a limited availability of skilled network operators; dynamic changes to traffic
priorities; heterogeneous communications equipment; low bandwidth and error-prone
communications links; moderate mobility speed (dynamic topology); a hierarchical
command structure; and finally security considerations due to the wireless medium.
From these characteristics we have identified several management requirements that
suggests the management solution should be: automated to reduce the need for operator
intervention, provide timely configuration changes to deal with changes in policy and
hide the complexity of heterogeneous equipment; efficient and robust to deal with low
bandwidth and link errors; and distributed to deal with node mobility and hierarchical
control, and secure to avoid compromising a mission critical system. In order to satisfy
these requirements we investigated the use of Policy-Based Network Management
(PBNM). Policy systems allow network operators to encode high level management goals
which are automatically interpreted by the policy system into device commands
distributed to network elements as required to reach the stated goals [1].

2
Currently maritime networks are configured in advance and then left virtually
unmanaged. The limited bandwidth connecting each node (ship) is often insufficient even
to support the network traffic generated locally. This leads to very poor perceived Quality
of Service (QoS) for all traffic. A solution common in fixed networks is to use Traffic
Engineering (TE) techniques. TE is concerned with performance optimization of
operational networks. TE facilitates efficient and reliable network operations by
simultaneously optimizing network resource utilization and traffic performance. This can
be applied in the maritime environment to prioritise traffic and provide load balancing
amongst multiple WAN bearers to ensure that the most important traffic receives
adequate QoS.
In this work we have focused on TE management in this environment. To this purpose we
have developed four Policy-Enabled Traffic Engineering (PETE) management services: a
Traffic Monitoring Service (TMS), a Traffic Prioritisation Service (TPS), an Adaptive
Routing Service (ARS), and a Resource Reservation Service (RRS). Together these
services address the TE goal of effective management of communication resources by
first, monitoring the traffic that is active in the network; second, addressing congestion by
giving some relative priority to the traffic that flows on the links; third, optimizing link
usage by specifying on which type of links the allowed traffic will/should flow; and
finally, providing bandwidth guarantees to mission critical flows through distributed
admission control. These services thus provide visibility, prioritisation, resource
optimisation, and per-flow bandwidth resource reservations respectively.
In order to automate the PETE services we use a maritime policy system that was
developed in collaboration with colleagues at CRC* as part of a three-year project funded
by the Canadian DND [2]. The project developed several techniques to make the PBNM
system applicable to the specific problems encountered in maritime networks. The main
policy services that were developed include policy distribution, provisioning,
* The Communications Research Centre, a pre-competitive research agency of Canadian Department of Industry http://crc.ca, and the current employer of the author of this dissertation.

3
enforcement, and conflict resolution. It should be understood that all work related to the
policy system was developed in the course of this team project of which the author was a
contributing member.
In order to evaluate the ability of the PETE management services to support traffic
engineering in the maritime environment, the commercial discrete event simulation
(DES) tool OPNET [3] has been used to evaluate the impact of the four services on
network traffic and to compare the RRS with existing reservation mechanisms. Out
primary metric of interest is transmission delay. These simulations show the PETE
management services to be effective and appropriate for the maritime environment. In
addition to the simulation work, a prototype was used to validate the RRS model.
The primary contributions of this work are;
• A characterisation of maritime networks including an investigation into the
management requirements of this relatively unexplored environment. To the best
of our knowledge, there has been no such work reported in the literature.
• Development of a suite of Policy-Enabled Traffic Engineering (PETE)
management services that provide traffic prioritisation and resource optimisation
tailored to maritime networks.
• Based on the characterisation of maritime networks, a model of maritime
networks, including links, traffic, and mobility was developed in OPNET.
• Simulation and Evaluation of the incremental effects of the PETE services on
maritime network traffic including a comparison of the RRS with two alternative
resource reservation services.
• Validation of the RRS simulation results against results from an existing
prototype implementation.
• Several papers have been published related to this research including
o An introductory paper characterising maritime networks and outlining our
service-oriented policy-based network management architecture [4].
o A paper describing the policy representation [5].

4
o A paper that presents the implementation of the policy-based network
management prototype [6] (winner of a best paper award)
o A paper describing the operation of the RRS [7].
o A paper describing the simulation results of the PETE management
services excluding RRS [8] (winner of a best paper award)
The remainder of this document is structured as follows. In Chapter 2, we discuss
maritime networks, PBNM, and the SOA. The research related to this work is then
presented in Chapter 3. Next, Chapter 4 describes the management system including the
policy system we have used, and the suite of PETE management services developed for
the maritime environment. In Chapter 5, part one of the simulation results follows a
description of the methodology and models used to simulate policy distribution and three
of the four proposed PETE management services. Next, Chapter 6 provides an in-depth
description of RRS, the proposed flow-based resource reservation and routing service
used to provide bandwidth guarantees in this environment. The second set of results in
Chapter 8 follows the simulation setup and models used to evaluate the RRS. We
compare its operation with two alternative reservation protocols, RSVP and INSIGNIA.
The document concludes with a summary of the research contributions and suggested
further work in Chapter 9.

5
2 Background
In this chapter we provide background on three areas related to our research. The chapter
begins with a description of a type of network not often seen in the literature, the
maritime tactical network. Section 2.1 gives a characterisation of the maritime
networking environment and discusses several issues related to its management.
The limited heterogeneous communications capacity of maritime networks suggests that
Traffic Engineering (TE) would be effective in this environment. However some method
of automating the management system is also required. The Policy-Based Network
Management (PBNM) paradigm offers techniques to dynamically change the behaviour
of managed systems in response to evolving operational needs without per-device
intervention by an operator. Section 2.1.5 gives an overview of policy concepts and the
current state of policy standards.
The management architecture we have used is based on the Service Oriented Architecture
(SOA) promoted by the World Wide Web Consortium (W3C). Communications within
the policy system, between the policy system and the management services, and between
different instances of the policy system on different ships is based on this paradigm. An
overview of the SOA approach is given in Section 2.3. The chapter concludes with a
summary in Section 2.4
2.1 The Maritime Environment
For this work, the definition of maritime networks is based on a Canadian naval task
group deployment. In such deployments, a relatively small number of nodes (ships) are
dispatched as a task group of between 2 and 5 nodes [9]. In addition, one or more shore
stations provide most server-based application services and act as a satellite switching
centre. There are multiple links available including satellite and line of site (LOS) radio
links. While the description given in this section may also be applicable to a commercial
enterprise such as a shipping company or emergency operations at sea such as coast

6
guard duties, these alternatives have not been investigated. A typical maritime network is
shown in Figure 1.
Figure 1, Typical Maritime network
These networks thus consists of a Network Operation Centre (NOC) which acts as a land
based relay for all satellite communication, a limited number of mobile nodes (ships or
potentially maritime land/air units), and the bearers that connect them. A commercial
satellite ground station may also be included.
In this environment maritime units communicate over a variety of bearers. These bearers
include satellite communications and various limited-range radio technologies as outlined
in Section 2.1.1. Routing in this environment is based on OSPF as explained in Section
2.1.2. These networks support a wide range of applications with varying information
exchange requirements. This traffic has been characterised and is described in Section
2.1.3. Currently the NOC is in charge of all network management including the WAN

7
and coordinating WAN access amongst the mobile nodes. However, centralised network
management has proven to be very difficult to achieve in this environment, the reasons
for which are discussed in terms of management requirements in Section 2.1.4.
2.1.1 Communication Bearers
A maritime network is composed of a variety of strategic and tactical communications
links. The communications bearers that are available to transfer information within the
network are: commercial satellite (e.g. INMARSAT B), ship-to-shore satellite networks
(SHF SATCOM, UHF SATCOM), High Frequency (HF) extended and beyond line-of-
sight radio (HF ELOS/BLOS) and UHF/VHF line-of-sight radio. A sample of the
communications types and capabilities from [10] are given below.
Table 1, Communications Subnet Matrix SUBNET LINK
RATE USE NOTES
SHF SATCOM
Up to
512 Kbps
High capacity Data Bearer for intra task group use
IP, point-to-point satellite
Increased data rates and multiplex capability achievable with improved modems
INMARSAT B 64 Kbps Main Data Bearer for intra task group use
IP, point-to-point satellite
Increased data rates and multiplex capability achievable with improved modems
UHF/VHF LOS
Shared 64 Kbps
Main Data Bearer for ship-to-ship communication. Used over short distances
Ranges of 20-50 nautical miles (nm), multi-member subnet
Supports non-real-time data
UHF SATCOM 25Khz
Up to 48 Kbps
Email, chat, low data DCP, COP
Limited IP capability, multi-member subnet satellite
HF BLOS 4.8-9.6 Kbps
Email, chat, low data DCP, COP
HF Sky wave ranges of 2000-3000 nm
HF ELOS 4.8-9.6 Kbps
Email, chat, low data DCP, COP
HF Surface wave ranges of 200-300 nm
UHF SATCOM 5Khz
Up to 9.6 Kbps
Email, chat, COP Requires astute operation to optimise performance with multi-member subnet

8
Maritime nodes (ships) most commonly communicate using a combination of two modes.
First, ships communicate back to their strategic network (NOC) using satellite
communications (e.g. INMARSAT, SHF SATCOM). Satellite communications can also
be relayed via shore to provide indirect ship-to-ship communications. Satellite
communications provide high bandwidth but high delay and high cost communications.
Second, ships communicate directly with other ships via limited range line-of-sight
(LOS) radio (e.g. UHF/VHF LOS). Recently UHF/VHF relay technology has improved
to the point that LOS radio systems may form mobile ad-hoc networks (MANETs) [11].
These networks provide low cost, low bandwidth and low delay connectivity over a
limited distance.
In the future, ships may have access to unmanned aerial vehicles (UAVs) with radio
payloads. Unfortunately this technology is currently high cost and not readily available.
This technology was not considered for this work.
For the purposes of this dissertation, only the case of bi-directional links is considered.
The use of unidirectional links for data traffic is relatively rare in the maritime
environment but may occur when satellite is not available. For instance, HF BLOS radio
(range 2000-3000 nm) may be available in only one direction due to mechanical failure
and require an alternate route for the return path (e.g. satellite). Since this is unlikely to be
the case for extended periods of time, it does not pose a severe limitation to the proposed
system. The inclusion of unidirectional links is left for future work.
2.1.2 Routing Capabilities
Canadian maritime networks are now IP-based [10]. By default, the network topology is
maintained by standard routing protocols that are used to achieve operational
connectivity. Each network is typically divided into separate Autonomous Systems (AS).
An AS is defined as a group of mobile nodes and shore station nodes connected by the
same administratively defined collection of backbone network resources. The shore

9
stations may be gateways to a third party backbone WAN (e.g. Internet Service Provider)
or other ASs.
Routing in this environment currently relies on OSPF within an AS with the link cost
metric set to increase with decreasing bandwidth [12]. This means that the link with the
highest bandwidth is used to the exclusion of any other links that may be available. Due
to its high bandwidth, SATCOM is used predominantly. When low-bandwidth LOS links
are the only links available, they are often overloaded with high bandwidth traffic.
Between autonomous systems, BGP4 is used. We are currently assuming a single AS will
be managed by the PETE system.
As mentioned previously, technology has been developed to allow nodes to form a
MANET from their available LOS bearers [11]. The combination of dynamic low
bandwidth, high link-error rate MANET with the high bandwidth but high delay satellite
communications is a unique feature of maritime networks and informs our investigation
of mobility and application QoS requirements in terms of routing in this environment.
2.1.3 Traffic Characterisation
Typical application types in this environment are: text messaging, email, video, imagery,
web, targeting, collaborative planning†, and voice. Figure 2 provides a characterisation of
network traffic seen during a naval exercise [13]. The chart divides the incoming traffic
to a maritime node by application type, with Internet and defence network intranet web
traffic taking up a strong majority (91%) of the bandwidth. The remaining traffic was
split between network overhead (e.g. OSPF), personnel and logistics management
(PeopleSoft, MIMS, LotusNotes, SAP), email/collaboration (MS-Exchange, Outlook),
and voice calls (VOIP).
We will be using this mix of traffic as the default background traffic in the simulations of
management and policy services. Though the traffic volume may vary over time, this
† includes network awareness (who is on-line), text-chat, file cabinet, bulletin board, news groups, white board, application sharing, screen sharing, audio, knowledge engine (help desk), auditing (track all communications, be able to reverse changes) , common operational picture (COP)

10
figure provides a baseline of what can be found in maritime networks and will be used in
the simulations described in Chapters 5 and 7.
Figure 2, Traffic Breakdown for a Naval Exercise (from [13])
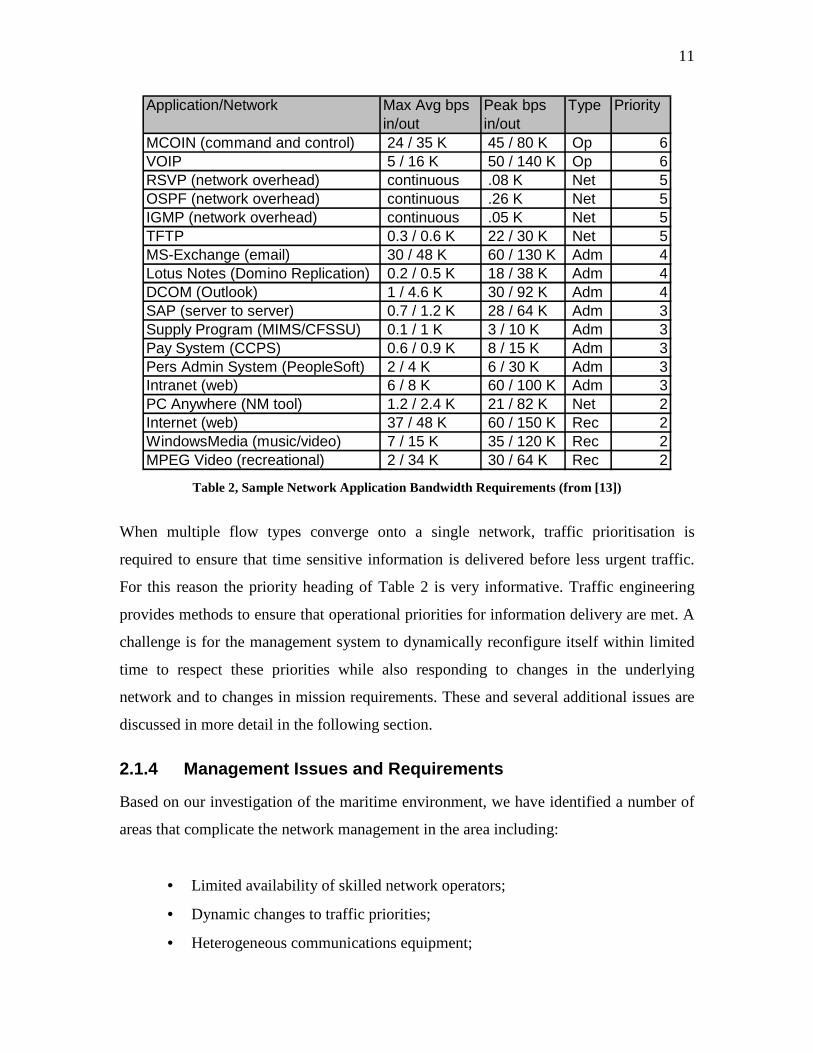
During the same naval exercise, Table 2 was developed to determine group and ship data
traffic usage and priorities. The maximum average and peak usage requirements for each
of a variety of different types of applications as they are used in the navy are also
provided. The traffic types shown are operational (Op), network overhead (Net),
administrative (Adm), and recreational (Rec). One application that may not be obvious is
Maritime Command Operational Information Network (MCOIN) [14], which is the
Canadian Navy's shore-based Command, Control, and Information System. The priorities
listed provide an idea of the importance attached to the information being carried (with
higher numbers indicating higher priority), and informs the network operator of how
different traffic classes can be constructed to give preferential treatment within the
network. Though this table provides a set priority for the various traffic types, exceptions
for particular communication flows may occur and priorities may change with time due to
operational constraints.
11
Application/Network Max Avg bps in/out
Peak bps in/out
Type Priority
MCOIN (command and control) 24 / 35 K 45 / 80 K Op 6VOIP 5 / 16 K 50 / 140 K Op 6RSVP (network overhead) continuous .08 K Net 5OSPF (network overhead) continuous .26 K Net 5IGMP (network overhead) continuous .05 K Net 5TFTP 0.3 / 0.6 K 22 / 30 K Net 5MS-Exchange (email) 30 / 48 K 60 / 130 K Adm 4Lotus Notes (Domino Replication) 0.2 / 0.5 K 18 / 38 K Adm 4DCOM (Outlook) 1 / 4.6 K 30 / 92 K Adm 4SAP (server to server) 0.7 / 1.2 K 28 / 64 K Adm 3Supply Program (MIMS/CFSSU) 0.1 / 1 K 3 / 10 K Adm 3Pay System (CCPS) 0.6 / 0.9 K 8 / 15 K Adm 3Pers Admin System (PeopleSoft) 2 / 4 K 6 / 30 K Adm 3Intranet (web) 6 / 8 K 60 / 100 K Adm 3PC Anywhere (NM tool) 1.2 / 2.4 K 21 / 82 K Net 2Internet (web) 37 / 48 K 60 / 150 K Rec 2WindowsMedia (music/video) 7 / 15 K 35 / 120 K Rec 2MPEG Video (recreational) 2 / 34 K 30 / 64 K Rec 2
Table 2, Sample Network Application Bandwidth Requirements (from [13])
When multiple flow types converge onto a single network, traffic prioritisation is
required to ensure that time sensitive information is delivered before less urgent traffic.
For this reason the priority heading of Table 2 is very informative. Traffic engineering
provides methods to ensure that operational priorities for information delivery are met. A
challenge is for the management system to dynamically reconfigure itself within limited
time to respect these priorities while also responding to changes in the underlying
network and to changes in mission requirements. These and several additional issues are
discussed in more detail in the following section.
2.1.4 Management Issues and Requirements
Based on our investigation of the maritime environment, we have identified a number of
areas that complicate the network management in the area including:
• Limited availability of skilled network operators;
• Dynamic changes to traffic priorities;
• Heterogeneous communications equipment;

12
• Low bandwidth and error-prone communications links;
• Moderate mobility speed (dynamic topology);
• Hierarchical command structure (semi-autonomous operation);
• Security considerations due to the wireless medium;
Several network management issues arise from these characteristics. These issues give
rise to a number of management-related requirements the system described in this
dissertation attempts to address. These management challenges have been investigated
before for military networks [15], and are similar to those found in Mobile Ad Hoc
Networks (MANETs) [16]. It should be noted that network management system
requirements are separate from the QoS related management service goals which we are
currently using traffic engineering (TE) techniques to solve.
Descriptions of each of these characteristics of the maritime domain are outlined below,
including the related management issues, associated system requirements, and TE
management service goals.
2.1.4.1 Limited availability of skilled network operators
A significant issue for network management local to a ship is the limited number of
skilled network operators available at sea. This scarcity implies that human intervention
may not be available when there is a change in the underlying resources on this ship or a
change in management policy. For instance, if a network link fails, the application-
resource allocations must be adjusted to minimise the impact on current operations. Also
at issue is that human intervention is notoriously error prone and slow. In maritime
networks this may be an issue if a change in network policy must be quickly re-
provisioned due to a critical change in mission or operational status.
Thus, the management system should be automated to hide network complexity and
provide ease of use. Providing the ability to carry out the control and management of
communication resources in an automated and transparent manner will minimise the
human resource burden and the skill level required from the network operation personnel.
13
2.1.4.2 Dynamic changes to traffic priorities
The importance of traffic originating from a local node will change with time. The most
common reason for such a change in requirements is that the node has entered a new
phase of a mission where particular traffic becomes more or less important. An example
of this would be to reduce the importance of discretionary Internet traffic when important
manoeuvres are being executed. Another reason to change the QoS configuration would
be if a change in communications capabilities occurred. If a satellite link became
available, you may wish to allow more discretionary Internet traffic since the bandwidth
is available to be used. Finally, traffic importance may also be determined centrally at the
NOC for strategic reasons. An example of this would be that important emails are due to
be distributed to all nodes, and for that period of time email traffic should be given a
higher priority so the recipients receive them at roughly the same time.
Thus there is a requirement that the management solution automatically adapt to
dynamic changes in application priorities. These changes should be based on both local
requirements (mission requirements and communications availability) and domain wide
requirements (strategic requirements).
2.1.4.3 Heterogeneous communications equipment
As described in the previous section, maritime networks are composed of a wide variety
of communications equipment procured from a number of commercial enterprises.
Management capabilities and configuration mechanisms differ depending not only on the
brand of device but also between device types. While specialised management products
may be developed for a particular company’s offering or a particular device, there are no
universally accepted standards for sharing management information between these
products. This leaves large gaps in integrated problem detection and problem solving.
This lack of coordination also hinders the ability of these products to automatically react
to changes either in the underlying system or the overarching management goals.
In order to address these problems, the management system needs to use abstracted
representations to handle differences in equipment capability and hide implementation

14
specific differences. Automation can then be used on the abstracted representation to
consistently configure end-to-end network capabilities, such as routing and QoS. This
aids in the rapid network reconfiguration as information exchange/management goals
change.
Another aspect of heterogeneous equipment is the wide range of capabilities between the
various communication bearers which ships are provided access to. Since the applications
used in the maritime environment require different levels of QoS, not all traffic is suitable
for all communication links. For example a VOIP call may not be able to meet its
bandwidth requirements on a LOS link. Currently only the best link (the lowest cost link)
is used at any one time as a result of OSPF routing. This means all other links are left idle
while traffic uses the preferred link. Thus, there is a TE management goal that traffic
should be adaptively routed over the appropriate type of bearer that supports it. The
collection of available bearers should be used to make best use of their combined
capacity. This is possible by balancing traffic across the bearers such that delay-sensitive
traffic is sent over low-delay bearers and bandwidth-intensive traffic is sent over the
bearers with the most available bandwidth.
2.1.4.4 Low bandwidth and error-prone communications links
The maritime tactical networks are composed of a variety of low-bandwidth links that
have different capacity and characteristics. In today’s naval IP-centric network
architecture, the individual platforms no longer have exclusive access to a link. Access to
the network is shared and nodes must compete with each other for the available
communication capacity. The situation is such that the capacity of shipboard networks
greatly exceeds that found in the wireless ship-to-ship and ship-to-shore environment. It
is important to minimise the amount of overhead that is introduced by the management
applications. Contemporary network management protocols assume links with high
capacity and low error rates. In large network deployments, management applications
often generate a large amount of traffic to continuously monitor the state of the network
and to receive notifications from devices that change state. The low bandwidth and error-
prone links thus influence the choice of mechanisms and/or protocols to use for the
various managerial tasks, such as monitoring and configuration. There is a requirement

15
for management systems in this environment to be efficient and also robust (fault
tolerant) to transmission errors.
Similarly, due to the lack of resources available for the effective exchange of information,
there is a requirement to prioritise the more important traffic flows. There are two well-
known models for providing per-packet preferential treatment to the traffic that needs
them. They are class-based QoS (DiffServ is the IETF mechanism) and flow-based QoS
(IntServ to the IETF). In class-based QoS, packets of a common traffic class (or type) are
marked according to the type of service they need. In response to these markings, routers
and switches use various queuing strategies to tailor performance to requirements of the
traffic class. Router vendors provide different capabilities for configuring this behaviour
including setting the relative priorities of queues, and bandwidth reserved for each queue.
On the other hand, flow-based QoS is concerned with requesting and reserving resources
through the network for an individual traffic flow. Before the flow is given preferential
treatment, the routers along the path that the traffic will take are contacted to identify the
flow and reserve bandwidth and potentially other resources to ensure its requirements
will be met end-to-end (all the way from source to destination). There is thus a TE
management goal is to ensure effective exchange of information by making the best use
of the available resources through traffic prioritisation and resource reservation. Of
course, the state of the network must be monitored highlighting another goal, network
visibility.
2.1.4.5 Moderate mobility speed (dynamic topology)
Mobility (the intermittent failure and re-establishment of communication links) has not
been a primary concern for network management solutions and provides further
challenges in the maritime environment. Since connectivity is based on radio links, the
network will not be fully connected at all times. This also implies that the management
systems on partitioned sub-networks down to a single node should be sufficiently
distributed that they can operate autonomously.

16
2.1.4.6 Hierarchical command structure
The management authority in maritime networks is hierarchical. The domain authority
usually rests with an individual or a team at the Network Operations Centre (NOC). The
domain authority may require that a certain management policy be respected at all nodes
in the network. However, the control must not be completely centralised. Some levels of
network control must also be available to the commander of each ship. A ship’s
Commanding Officer must have the flexibility to immediately change his resources,
communications and monitoring based upon the dynamic tactical situation.
Thus, there is a requirement that the management solution allow for a distributed (semi-
autonomous) operation. These different levels of control should follow the user’s role, or
a separate authority hierarchy (related to security).
2.1.4.7 Security considerations
As could be expected, the management system should be secure. There are complex
security issues that arise due to the distributed nature of this environment. First, the
broadcast nature of wireless links makes it easier to eavesdrop on such communications.
A second area of concern is the reliance of mobile nodes on neighbours for routing and
other critical operational information. Consequently, a compromised node may lead to a
number of security problems. To deal with the first concern, a mechanism such as
encryption to provide confidentiality is needed. To deal with the second, methods for data
integrity, authentication, and non-repudiation are required. Investigation of these security
requirements is left as future work.
Another concern in maritime networks is that there are commonly two networks
operating independently at different security levels. Red networks are used to pass
unclassified information, while black networks are used to pass classified information.
Since “red” network information requires less security precautions it can be transmitted
more easily, but at the same time efforts must be made to ensure there is no leakage of
“black” information into the “red” network. Currently the two types of information are
kept on completely separate machines and use completely separate communications
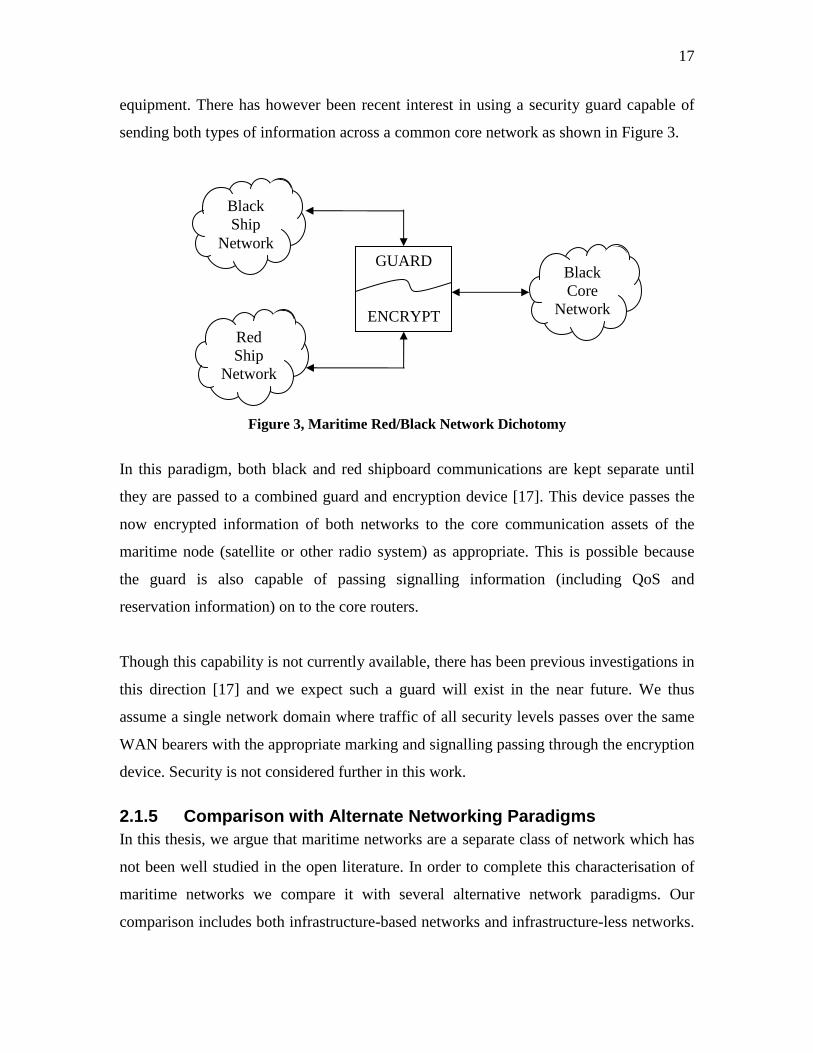
17
equipment. There has however been recent interest in using a security guard capable of
sending both types of information across a common core network as shown in Figure 3.
Figure 3, Maritime Red/Black Network Dichotomy
In this paradigm, both black and red shipboard communications are kept separate until
they are passed to a combined guard and encryption device [17]. This device passes the
now encrypted information of both networks to the core communication assets of the
maritime node (satellite or other radio system) as appropriate. This is possible because
the guard is also capable of passing signalling information (including QoS and
reservation information) on to the core routers.
Though this capability is not currently available, there has been previous investigations in
this direction [17] and we expect such a guard will exist in the near future. We thus
assume a single network domain where traffic of all security levels passes over the same
WAN bearers with the appropriate marking and signalling passing through the encryption
device. Security is not considered further in this work.
2.1.5 Comparison with Alternate Networking Paradigm s In this thesis, we argue that maritime networks are a separate class of network which has
not been well studied in the open literature. In order to complete this characterisation of
maritime networks we compare it with several alternative network paradigms. Our
comparison includes both infrastructure-based networks and infrastructure-less networks.
Black Ship
Network
Red Ship
Network
GUARD
ENCRYPT
Black Core
Network

18
Infrastructure-based networks are defined as any type of network that uses fixed-position
land-based equipment as all or a significant part of their communications. These network
paradigms are compared to provide a definitive characterisation showing where maritime
networks fit between fixed networks which have stable, high, and good QoS and
MANETs are characterised by unstable, low, and poor QoS due to the limitations of
mobility, power constraints, and wireless propagation. For this comparison we have
chosen a number of key metrics that affect networking capabilities to highlight the
differences and similarities between maritime networks and other network paradigms.
Based on our concern with network management and network QoS as outlined in the
previous section the metrics include the following;
• The availability of network operators who monitor and remotely configure
network resources to maintain network services in the face of faults and upgrades.
• The scheme for prioritising traffic, which in maritime networks involves a
matching the current the importance of traffic with the resources received. In all
non-military networks prioritisation is static and defined in advance.
• The origin of the equipment used to build the network. Having equipment from
multiple vendors or supporting multiple types of bearers increases the
management complexity
• The amount of bandwidth available in the network compared to the amount of
traffic being generated or passed through.
• The relative reliability of or error rate of the bearers used in the network.
• The network size in relation to the number of active connected nodes at any time.
• The topological connectivity in relation to the number of alternative routes
available within the network (related to network robustness).
• The availability of power to operate mobile nodes within a network is often a
critical concern.
• The amount of mobility, which can complicate both management and QoS within
a network.
• The management paradigm associated with a type of network (who is capable of
managing the nodes, etc.) has an impact on any management solution.

19
• There are different levels and types of security concerns related to the application
areas and sensitivity of the traffic carried by different network types.
• An example of where the network paradigm is used is also included in these
comparisons
Our comparison begins with infrastructure-based networks. Three alternative paradigms
have been selected chosen because of their ubiquity and similarity with maritime
networks. Typical fixed networks such as those operated by Internet service providers
provide end-to-end transit of traffic over fixed “wired” infrastructure that often includes
high speed optical backbones. A Dial-up or VPN leased-lined network was selected as
similar to maritime network since it includes smaller, well connected networks that are
connected by intermittent or on-demand point-to-point links provided by technology such
as ISDN. Finally though cellular networks include mobility, they use a high-speed
infrastructure service network after the first hop. The comparison of critical metrics is
summarised in Table 3. The metrics which overlap with maritime networks have been
highlighted.

20
Table 3, Comparison of Maritime Networks with Infrastructure-based Networks.
Issue Maritime
Network
Fixed Network Dial-up (VPN)
Network
Cellular
Network
Operators limited
availability
available available available
Prioritisation dynamic fixed fixed fixed
Equipment heterogeneous heterogeneous heterogeneous heterogeneous
Bandwidth very low to low high disconnected
to high
low
Error Rate depends very low very low low
Size small varies varies varies
Connectivity sparse dense dense dense
Power practically
unlimited
unlimited unlimited limited
Mobility moderate uncommon uncommon common
Management hierarchical centralised centralised centralised
Security complex well understood well understood well understood
Example Canadian Navy Rogers Bell Telus
The metrics for maritime networks are derived from the characterisation provided
previously in this section. There are a limited number of network operators while the
information exchange requirements (QoS) of traffic vary with the current objectives of
the mission (per ship and network wide). This means that traffic which was at one point
relatively unimportant could spontaneously or expectedly become critical at a particular
time. These two metrics do not match existing infrastructure networks which commonly
have well staffed operator support (at least compared to maritime networks that may not
have an operator available on ship), while providing a consistent and predictable
prioritisation scheme. One area where these types of networks are similar is in the use of

21
heterogeneous networking equipment. Since these networks support a wide range of
infrastructure, a wide range of equipment is required, complicating the management
process.
Bandwidth is an area with high variability between all types of networks. While maritime
has at best low-speed satellite communications (and notably extremely low-speed LOS
links), fixed networks are generally build from the highest-speed links available, dial-up
networks have access to a range of relatively high-speed links, and cellular networks
currently have low-speed links, though this is slowly changing with recent advances. In
the remaining metrics, the infrastructure-based networks are similar with a low error rate,
variable (but generally large) size, good connectivity for robustness, unlimited power
(except for cellular handsets), static devices (again except for cellular handsets),
centralised management and well understood security issues. These types of network
have been well studied during their long lifetime and are well described in the available
literature.
In the second part of our comparison we look at more recent types of networks which do
not include high-speed backbone infrastructure. Mobile Ad Hoc Networks (MANETs)
include a number of nodes using the same communication method but without any
assumptions about location or movement. The IEEE 802.11 is a widely implemented
series of standards that define wireless LAN modulation techniques (as well as physical
and MAC characteristics). IEEE 802.11 implementations are often used to demonstrate
MANET capabilities and are considered here. Vehicular ad-hoc networks (VANETs) are
another type of network closely related to MANETs with a more concrete mobility
pattern. In VANETs, the speeds are generally higher than that assumed for MANETs but
the directions are more predictable (limited to roads). VANETs also communicate with
stationary roadside equipment. Finally power is again not a major limitation. Mesh
networks are similar to MANETs in that they are composed of a single type of node in no
fixed topological arrangement. The difference is that Mesh networks are not mobile and
often do not have the same power limitations placed on true MANETs as they can be
externally powered by existing infrastructure. Sensor networks are a subtype of mesh

22
networks where smaller, more specialised (and less powerful) nodes are used,
complicating the power and communication issues. A comparison of the critical metrics
is given in Table 4.
Table 4, Comparison of Maritime Networks with Infrastructure-less Networks
Issue Maritime
Network
802.11
MANET
VANET Mesh (Sensor)
Network
Operators limited
availability
not available not available not available
Prioritisation dynamic fixed fixed fixed
Equipment heterogeneous homogeneous homogeneous homogeneous
Bandwidth very low low low very-low to low
Error Rate low to high high low to high high
Size small varies varies varies
Connectivity sparse sparse sparse dense
Power practically
unlimited
limited practically
unlimited
varies
Mobility common but
slow
common common but
constrained
usually static
Control hierarchical distributed hybrid hybrid
Security very complex complex complex complex
Example Canadian navy Disaster
Response
Collision
Avoidance
One-Laptop Per
Child‡
In comparing maritime networks with infrastructure-less networks we come across many
more similarities than our previous comparison. Because of their lack of central authority
and ad-hoc composition, these types of networks are similar in their lack of network
operations staff. Prioritisation is much more difficult because of the distribution of
‡ an American non-profit organization set up to oversee the creation and distribution of cheap, affordable educational devices for use in the developing world. See http://laptop.org/laptop/ for more details.

23
authority, meaning that a fixed scheme is required. Interoperability also requires the use
of similar equipment. Bandwidth is in general low compared to infrastructure networks
though it can be extremely low for sensor networks. In terms of error rate, the reliance on
wireless communications means that error rate is relatively high, but VANETs are similar
to maritime networks in that it is higher between vehicles than it is to the fixed roadside
nodes. In terms of network size, all infrastructure-less networks are by definition able to
operate from two nodes and up, though in practice they are in the tens to hundreds of
nodes and not beyond. Maritime networks are on average smaller with less than 10 nodes.
Connectivity however is generally sparse for most IEEE 802.11 and VANET
applications, but mesh and sensor networks rely on a higher level of connectivity. Since
IEEE 802.11 and mesh networks use batteries, the conservation of power is an issue for
them, where for VANETs this is generally not a concern. Infrastructure-less networks
vary most in their type of mobility. Maritime networks exist in an environment with few
obstructions and move slowly relative to their transmission range. For this reason, link
outages are common, but infrequent and predictable. The infrastructure-less networks on
the other hand must deal with complex and three-dimensional terrain. MANETs vary
widely in the type of mobility they use, but it is common and usually causes frequent link
outages. VANETs on the other are constrained in their area of operation (usually roads)
and are thus more predictable, even if link outages are still frequent. Network
management control is decentralised for MANETs, but the addition of static roadside
nodes for VANETs and the static nature of mesh networks suggests more hybrid schemes
to make use of these resources. Finally, due to the wireless and collaborative nature of
these networks, security is a complex concern.
One final comparison should be made in terms of the difference between land-based and
naval military networks. Some of the characteristic features of military networks include
the limited availability of network operators, dynamic traffic prioritisation, the inclusion
of very low bandwidth links, hierarchical network control, and high sensitivity to security
issues. However, land-based networks are larger, including many more mobile nodes in a
potentially denser network. Power is once again a factor for those operating dismounted,
and the mobility is much closer to a VANET than a slow changing maritime network.

24
To summarise, maritime networks can be characterised as follows;
• They have network operators, but they have limited availability (can be similar to
understaffed infrastructure-based networks)
• They support network prioritisation, but this prioritisation can change
evolutionally or suddenly (similar to army networks)
• They have heterogeneous networking equipment (similar to infrastructure-based
networks).
• They have links of extremely low to low bandwidth (similar to army networks)
• Because of their two main link types, the error rate is low for the satellite links
and high for the LOS links (similar to army networks)
• Their size is relatively small compared to all other network types.
• Connectivity is sparse (similar to MANETs and VANETs)
• Power is not a concern (similar to many other network types)
• Mobility is common, but because of the slow rate of link outages the effect is
uniquely limited.
• They have a hierarchical control model (similar to other military networks)
• Security is both extremely important and very complex (similar to army networks)
From this our complete characterisation would require a network with this combination
of traits to be termed a maritime network. The most distinguishing features are the
extremely low bandwidth links, relatively small size of the network (in the order of 10
nodes), and the unique mobility model (where link outages are relatively seldom and are
somewhat predictable).
2.2 Policy-Based Network Management (PBNM) Policy-Based Network Management (PBNM) offers techniques to automate management
across diverse and distributed organisational and environmental domains. This section
provides a brief overview of policy concepts, standards, and benefits.

25
2.2.1 Policy Concepts
Policy-Based Network Management (PBNM) [18] can be defined as a management
approach that enables network entities to respond and react to overarching policy
specifications in an integrated fashion. For instance, network operators may describe in
policy how network resources should be shared to meet the conflicting information
exchange requirements for the various applications in the network. This high-level policy
does not require details of the network topology or knowledge of how to configure
individual network devices. PBNM systems provide this abstraction by mapping high-
level rules into low-level commands, which are distributed to devices automatically. This
allows network managers to focus on end goals and not on individual technologies.
The characteristics of PBNM systems may be more easily understood by explaining the
high-level activities required to deliver such a system. These activities are defined
differently by various authors [19], but in light of the policy system architecture
described in this document, the following five main activities are defined: policy
definition, policy distribution, policy provisioning, policy enforcement, and policy
conflict resolution.
The first activity relates to the ability to define policies. This involves standardised rule
formatting and representations which the system understands and can act upon. The
PETE system uses a three-level scoped policy language tailored for the requirements of
managing maritime networks (discussed in Section 4.1.2).
The second activity is the ability to distribute the policies that have been defined by the
user to all participating parties. This distribution process takes into account the defined
scope of the policy. The distribution mechanism should be efficient, robust, and secure.
This is so it can offer some guarantee that policies reach their intended targets, in spite of
deficiencies within the network and possible intermittent failure of the devices. In our
system, policy distribution is based on three possible scopes defined as part of the policy
(Section 4.1.3.1).

26
The third activity is policy provisioning. The first part of policy provisioning is the
process by which the policy is evaluated and configuration decisions are generated. The
second part is the process by which the policy variables are extracted, grouped and then
allocated to specific enforcement points (devices) depending on their configured role in
the network (Section 4.1.3.2).
The fourth activity is the ability to enforce policies within the system. Once the
provisioned policy has been dispatched to the appropriate device, the policy must be
enforced; i.e. the policy variables must be translated into the implementation specific
configuration commands for the related device (Section 4.1.3.3).
Finally the fifth activity is the ability to detect policy conflicts and provide conflict
resolution services. When policies are entered into the system, there may be cases when
they contradict existing policy in some way. In order to deal with these conflicts,
mechanisms are needed to resolve which policy takes precedence (Section 4.1.3.4).
2.2.2 Standards
There are two main groups driving standards in the policy arena. The Distributed
Management Task Force (DMTF) and the Internet Engineering Task Force (IETF) both
have active working groups, though the lion’s share seems to be done in the IETF. It
should be noted that the TeleManagement Forum has done some related standards work.
Nevertheless, standards remain thin on the ground in the PBNM field.
The DMTF Policy Working Group [20] defines policy-based management as providing
an abstraction that enables the definition of system behaviours independent of
implementations. Policies can be used to specify resource management configuration
directives and, at a higher abstraction layer, they can be used to specify user experience
management directives. The DMTF Policy Working Group is in the process of
developing rule-based mechanisms for highly scalable management of heterogeneous
systems. Their work to date has focused on developing Common Information Model
(CIM) as a policy language [21].

27
The IETF, via its former Policy Framework Working Group [22], defined a policy
framework “to represent, manage, share, and reuse policies and policy information in a
vendor-independent, interoperable, and scalable manner”. The policy management
architecture as proposed by the IETF is shown in Figure 4. It consists of four main
components briefly described below (the definition of each component is based on RFC
3198 [23]):
Figure 4, IETF Policy Architecture
In this architecture, the Policy Management Application or Policy Console supports the
specification, editing and administration of policy through a user interface. The Policy
Repository is a specific data store (e.g. a database or directory) that holds policy rules,
their conditions and actions, and related policy data. The Policy Decision Point (PDP) is
responsible for handling events and makes decisions based on those events. It evaluates
the policy rules, and the decisions that it makes are based on the policies retrieved from
the policy repository. The Policy Enforcement Point (PEP) is the entity that enforces the
policy decisions made by the PDP.
A number of standards documents were produced as part of the IETF work on policy
management. Among the main ones are the definition of the Common Open Policy
Service Protocol (COPS) [24] and its extension, COPS Usage for Policy Provisioning
(COPS-PR) [25]. COPS describes a client-server model for policy control of QoS
signalling protocols. It is basically a protocol for sending policy requests and receiving
decisions from those requests. Nothing is said in the COPS standards about the operation

28
of policy decision points (PDPs) or the policy enforcement points (PEPs). COPS-PR
describes mechanisms that may be used to communicate policy-provisioned information
between the PDP and the PEP.
The IETF also developed an information model to support the policy framework and
extended the Common Information Model (CIM) standard to support quality-of-service
(QoS) management in fixed networks. This work produced RFC 3060 on the Policy Core
Information Model [21], and later RFC 3460, the Policy Core Information Model
Extensions [26]. Based on these two documents, RFC 3644 [27] defines an object-
oriented information model for representing Quality of Service (QoS) network
management policies. An overview of the state of IETF standardisation on QoS Policy
and how it can be related to Wireless Networks is given in [19].
2.2.3 Benefits of PBNM
The PBNM approach offers techniques to coordinate management within organisational
domains and the ability to dynamically change the behaviour of managed systems in
response to evolving operational needs [1].
The primary benefit of PBNM is the automation provided. Current deployments that do
not support a policy control framework require many highly skilled network operators to
first deploy and then continuously monitor and maintain the network infrastructure.
Because it hides the complexity of the underlying network, PBNM reduces the number of
skilled operators that are needed to perform management tasks (a requirement discussed
in Section 2.1.4.1). Automation of management tasks not only reduces the time and
effort required for configuration, but also allows configuration to be quickly and
efficiently changed when there is a change in operational traffic priorities (2.1.4.2).
Finally, as long as implementation details are abstracted, automation can be used to
ensures that all devices are configured in a coordinated and consistent manner regardless
of the equipment vendor’s implementation (2.1.4.3).

29
By defining a single policy and not a set of configurations, a PBNM system can
efficiently and robustly change the network configuration based on operational needs
(hierarchical control) with very little effort. Since there is no need to communicate with
each network entity individually, the lack of bandwidth is no longer a critical issue, and
communication errors are less likely (issues discussed in Section 2.1.4.4). Policies are
translated into a set of rules for managed services, and configuration actions are
performed locally.
The third advantage of a PBNM system in maritime networks is its ability with an
appropriate architecture to operate in a distributed manner across the network. The
problem of node mobility and potential partitioning of the network is mitigated since
individual PBNM systems can operate independently down to a single node (the problem
mentioned in Section 2.1.4.5). The main benefit in the maritime environment is that this
distribution supports the hierarchical command structure used in maritime networks to
allow for independent operation (2.1.4.6). Since nodes operate with a level of autonomy
even when they are connected to the network, the capability of PBNM systems to
interpret one policy based on its scope of applicability allows the management system to
operate differently depending on the needs of the author of the policy.
2.3 The Service Oriented Architecture
The Service-Oriented Architecture (SOA) is a software architecture in which nodes
(computer devices capable communications) organised in a network make resources
available as independent services. Any node in the same network may access in such
services, but a standardized way. The services interoperate based on formal interface
definitions that are independent from the underlying platform and programming
language, similar to previous middleware paradigms. This allows straightforward reuse of
the software components.
Web Services (WS) technology is often proposed as an implementation of the SOA and
has been gaining attention in the network management area. Though the definition of WS

30
is a topic of hot debate within the W3C, it is generally accepted that WS interfaces must
be based on Internet protocols (e.g. http) and that messages must be formatted in XML.
There are two main styles of WS messaging: RPC-based and document-based. The XML-
RPC messaging standard uses pre-specified functional interfaces and generally
implementations are bound to a particular programming language. On the other hand, the
document-style messaging standard interacts via an object-oriented approach wherein
formatted documents are accepted as a command pattern. In general, these documents are
written in XML. Our framework uses document-style messaging due to its increased
flexibility in development and operation.
Interoperability among the WS elements is defined in several standards [28]. SOAP
(Simple Object Access Protocol) is used to provide communications between WS
elements; UDDI (Universal Description, Discovery, and Integration) is a service broker
specification for registering WS providers to make them available to WS requesters; and
WSDL (Web Services Description Language) is a standard that describes a WS
provider’s operations and interfaces in XML. There have been several investigations
concerning the use of WS for network management (e.g. [29,30]).
2.4 Summary
This chapter provided a characterisation of maritime networks, a domain in which aspects
of both fixed and mobile ad-hoc networks (MANETs) can be found. While the LOS radio
communications have similar characteristics from those found in MANETs, the routing
methods and traffic characteristics are similar to those found in fixed networks. We have
described the links, routing topology, and traffic in detail. The challenge addressed in this
thesis is how such a network may be effectively managed.
In order to narrow the scope of our investigation, a particular area of network
management was chosen. Traffic engineering (TE) is of particular concern in this
environment because of the high volume of traffic combined with the low bandwidth
semi-reliable links available to connect the nodes. In order to make the best use of those

31
links, existing resources need to optimised through adaptive routing and resource
reservation and the traffic itself needs to be prioritized based on the current operational
requirements. Finally, visibility is required to monitor the state of the network. These are
the TE management service goals.
Many system requirements were also extracted from the characterisation of maritime
networks including the need for automation, efficiency, robustness, distributed
operation, and security. For example, one of the challenges in this area is that
operational requirements are different at each individual node, but must also be
coordinated with the requirements of the entire domain as well. This need for hierarchical
control leads to a management requirement of distributed operation.
Policy based network management (PBNM) provides a number of advantages in terms of
the system requirements. PBNM is a technology that allows for the specification of
management goals at a high level. This high-level policy is then translated into
configuration directives allowing changes in operational requirements to be
automatically effected. The high-level abstract view presented to the operator hides the
complexity of the underlying system, thus reducing the amount of skill needed to perform
the management tasks. Automation can also provide a number of other advantages. It can
efficiently increase network performance, availability, and reliability (robustness) as a
result of coordinated automation of tasks over abstracted resources and services. It also
reduces the time and effort needed to reconfigure the network. Finally, since PBNM can
operate independently in a distributed fashion, it matches well with the maritime
management system requirements to accommodate a hierarchical command structure
with independent operation.
In this thesis, we propose the use of policy enabled traffic engineering (PETE)
management services which incorporate the systemic advantages PBNM in order to meet
the traffic engineering management service goals of visibility, prioritisation, adaptive
routing, and resource reservation.

32
A service oriented architecture (SOA) approach was adopted in this work based on claims
of providing flexible and distributed communications amongst interchangeable service
elements (see for example [31]). Web services (WS), an implementation of SOA, was
designed to provide an implementation-independent method for exchanging information
within a system. The advantage is that communications between the policy services and
management services, on a local or a remote node (on another ship) can be standardised.

33
3 Related Work
In this chapter, we survey the relevant work related to our research. There are three
streams of relevant research to draw upon for the management of maritime networks:
military research, commercial research, and academic research. It is unfortunate that
military research is unavailable, while commercial research is proprietary, and thus also
unavailable. Some unclassified military documents such as [9,10,13] were used in this
research for the characterisation of the networks, but none were found that deal with
network management for maritime networks, especially as it relates to QoS and Traffic
Engineering. Commercial research is sometimes described in the media, for instance the
fielding of an automated QoS system for command and control applications in maritime
networks by QinetiQ [32], and research into similar systems by Broadband
Communications Inc [33] and Boeing [34]. Unfortunately in each of these cases there is
more advertising than technical content and the technologies and outcomes of their
approaches are not available. Academic research on the other hand is openly available
and peer reviewed. This section surveys three areas of research relevant to our work.
We begin in Section 3.1 with a survey of TE services applicable in fixed networks. This
is followed in Section 3.2 with a survey of the alternative TE services applicable in
mobile networks. Recent research in policy-based management of MANETs is presented
in Section 3.3 as this research is the closest to our own. Finally, the main conclusions of
this chapter summarised in Section 3.4.
3.1 Traffic Engineering in Fixed Networks
A precise description of traffic engineering can be found in [35], “Traffic Engineering
(TE) is concerned with performance optimization of operational networks. In general, it
encompasses the application of technology and scientific principles to the measurement,
modeling, characterization, and control of Internet traffic, and the application of such
knowledge and techniques to achieve specific performance objectives.”

34
Thus, TE involves the optimisation of network resources based on both traffic and
resource performance objectives. Traffic-based performance objectives revolve around
the QoS of traffic streams. Key traffic-based performance objectives may include:
maximization of throughput and minimization of packet loss, end-to-end delay, packet
loss, packet delay variation, loss ratio, and packet transfer delay. In this dissertation we
use packet delay as the primary metric of traffic performance. Resource-based
performance objectives involve the optimisation of network resources. A central function
of TE is to ensure that network resources do not become over-utilized and congested in
one part of the network while alternate feasible paths for network traffic remain
underutilized. These two objectives are commonly met through a combination of QoS
and routing mechanisms respectively. TE has been well studied in fixed networks and
many technologies are available to help in achieving its goals. This section reviews the
most critical TE standards in the area: MPLS, RSVP, RSVP-TE and OSPF-TE.
Multiprotocol Label Switch (MPLS) [36] provides mechanisms for tunnelling traffic
through the network on a particular path once it has been classified at the first/ingress
node. MPLS integrates a label swapping framework with network layer routing. Short
fixed length labels are added to packets at the ingress to an MPLS-enabled network.
Labels are assigned based on the concept of Forwarding Equivalence Classes (FEC),
which assigns the same label to traffic flows with similar forwarding requirements.
Throughout the interior of the MPLS domain, the labels attached to packets are used to
make forwarding decisions without looking at the original packet headers. MPLS can be
used to construct a virtual topology over the physical topology called virtual circuits
(VCs). This allows traffic to be sent over paths which optimise network utilisation by
balancing the load of the traffic over different links. The most important capabilities of
MPLS in maritime networks are their support for constraint-based routing (by explicitly
determining the flow’s route through the network), support of admission control
functions (by allowing admission control only on the explicit route), and the ability to
implement survivable VCs to increase fault tolerance (by supporting disjoint VCs to be
used in case the primary VC fails.)

35
The Resource Reservation Protocol (RSVP) [37] provides a mechanism to reserve
resources for unicast or multicast flows along the default path(s) from sender to
receiver(s). RSVP delivers quality-of-service (QoS) requests to all nodes along the
path(s) of the flows and establishes and maintains “soft” state related to the requested
service. This provides support for dynamic reservation membership and automatic
adaptation to routing changes. During reservation setup, RSVP transports opaque traffic
control and policy control parameters which provide further direction to nodes as to
whether the flow should be admitted. RSVP does not define how this control information
is processed, and it can be ignored. RSVP makes unidirectional reservations, and thus
only packets travelling in the reserved direction get preferential treatment. One of the
main drawbacks of RSVP in the maritime environment is its reliance on the default route.
Because of the widely varying capabilities of links, not all links are appropriate for all
types of traffic. From a TE perspective, RSVP does not support resource optimisation
because it cannot control where in the network reservations are made, potentially
overloading certain links while others remain underutilised. Resource optimisation in the
low bandwidth maritime environment is critical.
RSVP-TE [38] is an enhanced version of RSVP which provides a mechanism by which
MPLS label switched tunnels (VCs) can be configured along a predetermined (explicit)
route. Resource reservations such as are done in RSVP may be made at the same time the
VCs are established. RSVP is thus used as a signalling protocol that can create and
reroute label switched paths. Dynamic rerouting may be required to bypass networks
failures, congestion, and/or network bottlenecks. Like RSVP, the admission control and
policy control modules are not defined, meaning that pre-emption (the premature
termination of lower priority flows to make room for a higher priority flow) is optional.
Reservations are again unidirectional and are made in two phases, with an advertisement
from the initiator and reservation messages passing from node to node back along the
path from receiver to initiator. RSVP-TE also does not define the route used by the label
switched path. An external path generation algorithm (not defined in the standard) is
required, potentially making use of information from OSPF-TE as described below if

36
there are QoS requirements. Three such routing algorithms are proposed in this thesis in
Section 6.2.2.
Traffic engineering enhancements have been made to routing protocols such as OSPF by
including the reservation state as well as connectivity in each node’s Link State
Advertisement (LSA). OSPF-TE [39], for instance, includes the maximum bandwidth,
the maximum bandwidth that can be reserved, and the current unreserved bandwidth for
each advertised link. When combined, this information gives the current state of the
network which can be used by mechanisms such as RSVP-TE to build a reserved path
through the network. While this can be very useful when the network and reservations are
relatively static, the overhead introduced may be prohibitive in a dynamic network where
links and/or reservations are short lived. Such schemes also rely on all network elements
supporting the enhanced version of the routing protocol. We have achieved a similar
capability using a link cost function for OSPF which provides the nominal bandwidth of a
link without changing the OSPF protocol at all (see Section 6.2.1). Though our method
does not learn the current state of existing reservations, it probes the network only at the
time of the reservation along feasible routes thus reducing the overhead from schemes
such as OSPF-TE.
3.2 Traffic Engineering in Mobile Networks
The mobility and variable quality of the network bearers in maritime networks suggests
that TE mechanisms developed for fixed networks will not be directly applicable in this
environment. There however has been relevant research on traffic engineering in Mobile
Ad-Hoc Networks (MANETs) that address these issues. This section focuses on the
related fields of Quality of Service (QoS) provisioning (traffic prioritisation), enhanced
routing (resource optimisation), and traffic monitoring in MANETs.
To the best of our knowledge, only a single paper addresses any aspect of Traffic
Engineering or network management of any kind in the maritime environment. Recent
reserach in applying static DiffServ QoS to maritime networks is described in [40]. This
paper showed that throughput and delay guarantees were hard to achieve in this

37
environment, but queuing and dropping mechanisms, if properly tuned, could provide
limited service differentiation. This paper does not consider the dynamic nature of the
maritime environment, where the importance attached to different classes or even flows
of information vary with time. Our work investigates just such a dynamic requirement
through the use of the policy-enabled traffic prioritisation service.
It should be noted that there are some fundamental problems with prioritisation in
networks that should be considered. For example, [41] argues that there is a trade-off in
scalability and the granularity of QoS that can be provided. Considering the prioritised
nature assigned to the importance of information and the low-bandwidth nature of
maritime networks, efficiency is critical while fairness is of less importance. This
suggests that QoS can be considered for such relatively small networks where scalability
is not (currently) of great concern. Similarly, several issues in providing IntServ QoS in a
mobile environment are outlined in [42]. Though admission control has been studied
extensively for fixed and cellular networks, it becomes especially difficult in MANETs
for two reasons. First, there is no fixed path through the network along which resource
can reserved. Secondly, it is difficult even to calculate the bandwidth available from the
shared wireless medium. The capacity of the wireless medium is not fixed but can change
with the traffic generated by neighbours as well as the environment around the local
node. As a simplifying assumption in this work, considering the small number of nodes,
we assume an abundance of spectrum such that each wireless link does not interfere with
others. Thus the capacity of wireless links can be considered fixed.
The adaptation of existing fixed-network based QoS mechanisms into a dynamic
environment has been investigated from many different angles for MANETs, all of them
distributed. INSIGNIA [43] is an IntServ-based in-band signalling system to provide QoS
reservation services on top of existing MANET routing protocols. The INSIGNIA
framework supports distributed resource reservation, restoration, and end-to-end
adaptation irrespective of the underlying routing protocol. Reservations are accomplished
through the use of a specialized IP option field to be added before sending packets. When
such a packet arrives at a node, a reservation is made on the outgoing link as long the

38
reservation has been previously successful and there are sufficient resources on the local
link. End-to-end adaptation is possible through the use of user-supplied policies that
allow applications to scale their operations and network usage to the reported success of
the reservation process. INSIGNIA was simulated for comparison with RRS, our flow-
based TE mechanism proposed for maritime networks.
A DiffServ-based solution, SWAN [44], takes its acronym from Stateless Wireless Ad-
Hoc Networks. QoS is accomplished through the use of probe messages sent to the
receiver. It is up to intermediate nodes to mark the lowest currently available bandwidth.
When the probe reply is returned from the destination, a flow is admitted if the bandwidth
requested is lower than the minimum available. If accepted, the expedited traffic receives
expedited (DiffServ) service at intermediate nodes. If links become overloaded, traffic is
marked upon transmission and the receiver sends exception reports to the sender to either
drop the connection or enter a re-negotiation phase.
Finally in hybrid mechanisms such as FQMM [45], nodes may play multiple roles and
both per-flow and per-class provisioning are used. The paper suggests that neither of the
existing IntServ or DiffServ QoS methods is completely suitable for MANETs. Instead,
per-flow provisioning is used for traffic of the highest priority while per-class
provisioning is used for all other traffic. It is up to the sender to condition its own traffic
(as well as retransmitted traffic) to a relative percentage of effective link capacity – not an
absolute value. Finally, call admission control may be denied if a “QoS check” of the
discovered route does not find sufficient resources (similar to SWAN). We agree with the
authors of FQMM and our work considers both IntServ and DiffServ components of
traffic prioritisation in maritime networks, but each is supported and managed as an
independent service. Per-class DiffServ mechanisms are configured via the DiffServ-
based Traffic Prioritisation Service (Section 4.2.2), while critical flows are handled by the
IntServ-based Resource Reservation Service (Chapter 6).
Another TE-related service suitable for this environment is multi-path routing. Link and
node disjoint paths are useful in maritime networks to recover from localised problems

39
caused by mobility, satisfy multiple and perhaps conflicting constraint-based (QoS)
routing priorities, and optimise resource utilisation through load balancing. [46] provides
an overview of the problems of generating disjoint routes with QoS constraints, which
may generate loops based on inconsistent link weights (especially if they are assigned
dynamically depending on the current load). Similarly, feasible routes may not be
discovered. A low-overhead alternative to standard routing is proposed in [47]. This
paper suggests the use of fuzzy (statistics-based) logic to semi-randomly route traffic
through mobile networks. Using statistical methods, prioritised traffic is routed on
multiple (hopefully link-disjoint) paths, simultaneously increasing the probability of
meeting the traffic’s QoS requirement. In [48], a ticket-based QoS routing scheme to deal
with imprecise network state information is proposed. Tickets are used to limit the
number of parallel paths explored during an IntServ-like reservation phase. Intelligent
per-hop path selections lead to low-cost feasible paths with higher probability and lower
overhead than flooding. This particular work has informed our use of multiple paths in
the resource reservation service, though the use of tickets was considered unnecessary,
considering the small size of maritime networks compared to those evaluated in [48].
Multi-path routing is used by the probes in the Resource Reservation Service to evaluate
several potential routes in parallel to see if a policy and QoS-acceptable route can be
found.
Another TE-related service proposed in this work is traffic monitoring. Monitoring the
state of the maritime network is complicated by the low-bandwidth and unreliable state of
the connecting links. For this reason, a probe-based model such as that proposed in [49]
would be appropriate. In this two-tier model, network monitoring components called
probes are placed on each MANET node. A (possibly redundant) centralised probe
manager uses information forwarded by the probes to build the network view. A more
distributed model is used in our traffic monitoring service where pre-processing is done at
the provider node and the amount of information and frequency disseminated is set
according to the subscriber’s policy.

40
3.3 Policy Based Network Management
Policy-based network management has been around for some time. Several commercial
products for fixed networks were available in 1999 [50] though few if any of these
products exist any longer. These products provided the multi-vendor support required to
manage heterogeneous networking equipment, mostly in terms of security and QoS. One
product that does still exist, is Cisco’s QoS Policy Manager (QPM) [51], a product which
uses a policy-enabled application to consistently configure certain aspects of QoS within
a group of routers. It is not however an network management system per se. The fact that
PBNM solutions are no longer widely marketed shows that the area has matured beyond
the buzz word stage and the commercial implementation must stand on their own merit.
There has been some work recently in Policy-Based Management of MANETs. However,
to the best of our knowledge, network management generally and PBNM specifically has
not been described when applied to maritime networks.
The area of policy has been widely studied in the literature as it refers to both security
and network management. Ponder [52] is a mature example of a general-purpose policy
language that includes security (authorisation) and management (obligation) policies.
Ponder’s basic policies are concerned with the relationship between a set of subjects and
targets. The subjects are management entities which invoke methods visible on the targets
interface. Subjects can be granted or denied access to these operations by authorisation
policies, while obligation policies define what actions the subject must perform upon the
receipt of an event. We have adopted the terminology of Ponder and the IETF policy
standards for use in this thesis. An implementation has recently become available as
Ponder2 [53].
In [54], the Common Open Policy Service (COPS) protocol is extended to handle ad-hoc
environments. Clustering and redundancy mechanisms are used to improve scalability
and availability of a PBNM system in large MANETs. The outsourcing model, where a
central decision point must make policy decisions for remote enforcement points, was
found to have poorer response time in than a provisioning model where policy decisions
are made locally. The system uses service discovery to locate policy components and

41
policy negotiation to coordinate operations between nodes. An implementation of this
policy technique for QoS and routing services is presented in [55]. Here OSPF has been
modified to reduce retransmissions and handle mobility and the use of IPSec at each node
for mobile security. Qualitative results argue that policy provides a mechanism that can
quickly and efficiently provision QoS changes. For example, a video stream which was
performing poorly could be quickly prioritised so it can be seen adequately within a short
period of time. This work was designed for large homogeneous MANETs, but still
informs some of the work we have accomplished. The service discovery and inter-domain
policy negotiation are of particular interest to our policy system, the first of which has
been incorporated in our policy design while the latter remains future work.
Similar to our work, [56,57] describes a hierarchical PBNM system that was developed
for user-configurable monitoring and automated configuration of tactical MANETs, in
this case for the US army. Unlike our work, the policy system uses intelligent agents to
provide a common execution platform on the multitudinous mobile nodes. The primary
management services include monitoring, data aggregation, and reporting. An interesting
policy conflict resolution system was described that distinguishes between actual and
potential conflicts. Actual conflicts may arise in any of their services either due to a
mismatch of parameters or temporal conflicts. The architecture proposed in this work is
similar to our own except for the targeted environment, management services
implemented, and the use of intelligent agents instead of web services. While intelligent
agents provide an technology independent method for executing code, considering the
significant processing overhead required and additional security problems with executing
the agents themselves we opted for a more lightweight approach for this low bandwidth
environment.
3.4 Summary
Aspects of traffic engineering (TE) have been well studied in both fixed networks and
MANETs. The two main areas we investigate in this work are QoS and routing. Policy-
based network management (PBNM) has also been previously studied, with the most
relevant work to maritime networks being PBNM of MANETs. There has however been

42
no research to the best knowledge of the author that deals specifically with the network
management of maritime networks, an omission this dissertation hopes to remedy.
Standards for fixed networks provide mechanisms for enforcing a virtual topology on top
of the physical topology through the use of MPLS virtual circuits (VCs). VCs are a useful
concept in static networks but the mobility inherent in maritime networks calls for a more
distributed and robust scheme to enforce TE paths. Similarly, RSVP and RSVP-TE
provide mechanisms for resource reservation, but do not specify how the paths through
the network are to be chosen and reservations enforced, even given up-to-date
information on existing reservations using OSPF-TE. These mechanisms are relatively
straightforward in fixed networks but mobility again requires a scheme that can
automatically respond to a dynamic topology. In general, TE schemes for fixed networks
are simple and well understood, but are not appropriate considering the low bandwidth,
delays, and failures of the maritime environment.
This chapter has also reviewed several TE mechanisms for MANETs. Enabling QoS in
MANETs is not straightforward. Schemes such as INSIGNIA, SWAN, and FQMM
attempt to apply the DiffServ and IntServ schemes used in fixed networks. Though the
results from these efforts are promising, the resulting QoS differentiation achieved is far
less than that achieved in fixed networks. Routing schemes such as disjoint, fuzzy logic,
statistical and ticket based routing schemes can all be applied in the mobile environment
to improve the QoS of the transported traffic and provide resource optimisation through
load balancing. In general, TE schemes in MANETs are distributed, have low overhead,
and are designed to handle the channel characteristics and mobility appropriate for the
maritime environment. On the other hand, the mechanisms provide a piecemeal approach
for integrated TE and the area is not as well understood as in fixed networks.
What we are proposing in this thesis is to combine TE research from both fixed networks
and MANETs and to use a third element to enable distribution and automation, that being
PBNM. Despite failures to commercialise PBNM in commercial fixed networks, the
related work shows that policy can be applied in mobile and ad-hoc networks in support

43
of network management tasks. By policy-enabling our TE management services we can
provide fast and automated reconfiguration of the network to meet TE goals, a critical
need for maritime networks due to the lack of skilled operators.

44
4 Policy-Enabled Traffic Engineering
The two themes of this dissertation, policy-based automation and traffic engineering-
based management, are further developed in this chapter. The arguments for the use of
policy in maritime networks were previously explored in Section 2.2.3, the main
argument being that automation is required because the maritime environment is dynamic
not only in topology but in the importance placed on particular types of traffic at different
times.
This chapter begins with a high level overview of the policy system we have used to
policy-enable the management services. This system, developed at CRC, includes the
usual functionality of a policy system that includes a mechanism for the definition of high
level management goals, the interpretation of such goals into device commands, and the
distribution of those commands to network devices. There are several interesting features
that have been incorporated to handle the specific requirements of maritime networks.
These include a SOA-based architecture, a scoped policy representation with three levels
of abstraction and concurrent operational-sets of policy, and a number of policy services
including policy distribution, provisioning, enforcement and conflict resolution.
Focus of this chapter is the main contribution of this work, the four proposed policy-
enabled (PETE) management services. The motivation for using policy in maritime
networks is the need to adapt quickly in an environment where the requirements and
capabilities change. Mobility and operational imperatives change which links and routes
are available while both local and global needs change which traffic is most important to
travel over those links. The traffic engineering services described here were developed to
provide the resource optimisation and flexibility required to deal with these requirements
by using the automation provided by policy. These services include traffic monitoring,
traffic prioritisation, adaptive routing and resources reservation (which due to its
complexity is described separately in Chapter 6).
45
We begin this chapter in Section 4.1 with a description of the PBNM architecture, policy
representation and associated policy services. The PETE management services are
subsequently introduced in Section 4.2. Finally, these two pieces are brought together
with a summary in Section 4.3.
4.1 The Maritime Policy System In this section we provide details of the distributed and service-oriented maritime policy-
based traffic management (PBTM) system that was developed in joint collaboration with
colleagues at CRC. It should be clear that this section describes the results of a three year
team project funded by DND in which the author made significant but not exclusive
contributions. It has been included as background for the PETE management services
described in the following section. Interested readers are encouraged to read the project
report [2] for further details.
There are three main areas of innovation in the maritime system which are summarised
here. First, the system is based on a distributed Service Oriented Architecture (SOA)
based architecture. Second, the three-level scoped policy representation has been divided
into operational sets to facilitate fast and precise switchover of policy in times of critical
need. Second, the policy services have been designed to provide adaptable, efficient and
robust automation tailored to the requirements of the maritime network. These ideas are
described more fully below.
4.1.1 The PBNM Architecture The maritime policy system uses a distributed architecture for efficiency and resilience.
Each maritime node (ship) contains a fully functional and symmetrical copy of the policy
system. The ships operate within a policy domain where services have a common set of
policies within a single policy domain. By adopting the service oriented architecture
devices and the PETE management services can be similarly policy-enabled. Though the
system components at each node are the same, the policy on each node may differ
depending on the local operational requirements. The concept of policy scope is further
explained in Section 4.1.2.

46
To achieve our management objectives, we decided to use an architecture which
combines Service Oriented Architecture (SOA) and policy-based techniques. They both
offer critical benefits: the service-oriented approach offers flexibility and extensibility
[58] while the policy-based approach offers automation and ease of use [18].
This approach led to the definition of a PBNM architecture initially based around the
IETF policy architecture (Section 2.2.2). The architecture supports automation and
distribution (for efficiency and robustness). The system is symmetrical and thus all
components are present on each maritime node (ship). It incorporates SOA principles to
coordinate the management services in the system. The architecture is shown in Figure 5.
Figure 5, Proposed Policy Architecture for Maritime Environments
The main components of the architecture are: the policy service interface, which accepts
policy from operators while assigning roles to devices; the policy system, which
interprets high-level (HL) policy and pushes low-level (LL) commands out to policy-
enabled resources (also known as PEPs); the proxy PEP, which takes the low-level policy
and configures associated devices to conform with policy; repositories, which store lists
of high level policy, network resources and the roles of those resources; a topology
monitor, which notes changes in the operation of the devices; and finally the event
service, which helps to distribute events from the policy system and the underlying
network. A complete description of the architecture was reported in [4].

47
In this architecture, Web Services expose the traffic management services to users via the
Policy Service Interface (PSI). These management services are policy-enabled – their
operation is guided by the policies submitted by users. Other management and policy
services could also be added at a later time
The policy manager is a collection of policy services which together act as a Policy
Decision Point (PDP). The policy system receives the HL policy supplied by the user,
evaluates them, generates the appropriate policy decisions, and provisions associated
Policy Enforcement Points (PEPs) accordingly.
In order to accomplish this, the policy manager matches the incoming HL policy with the
appropriate management service. The management service then interprets the HL policy
using specification policy rules with the rule engine to generate device-independent
(capability-specific) Low Level (LL) policy decisions. The LL policies are then
distributed to the appropriate policy-enabled resources (PEPs) via the COPS protocol
[25]. Given that current network devices are not natively policy aware, a proxy PEP is
used to translate the LL policies into configuration commands.
Additional architectural components include: a repository, which stores the received HL
policy; a topology monitor, which detects changes in network connectivity; and, finally,
an event distribution service, which helps to distribute events from the policy system and
the underlying network.
The components and their relationships are described in more detail below. The
operations of the various policy services are described in Section 4.1.3 while the PETE
management services are described in Section 4.2 and Chapter 6.
4.1.2 Policy Representation The ability to capture and convey essential network management objectives in the form
of a policy is a key facet of any policy system. Because the term policy can be broadly
applied to many areas and subjects, there is a need to explain what constitutes a policy as
48
it relates to the policy services described in Section 4.1.3. We look here at three key
concepts that were developed for policy representation as part of the jointly-developed
maritime policy system. Details of the policy representation used in the policy system’s
prototype are presented in [5], and included as Appendix C.
Management goals (high level policy) are entered by the user through an interface
consists of well-known attributes such as constraints, actions and targets, but do not
currently support external events. This ensures that operators have direct control over
which policy is currently enforced. Below the high-level policy, we have included two
other levels of policy as part of a policy continuum. High-level policies are translated by
a set of specification-level meta-policies into capability-specific low-level policies. All
three levels of policy are independent of each other, but the continuum of policy within
the system is vital to the correct operation of the management services they modify as a
whole throughout the network.
The second area of policy representation was developed to deal with the problem of
hierarchical control. Since maritime nodes are given a level of autonomy regarding the
operation of their communication systems, the concept of scope has been added to the
policy representation. Policies are defined with either Local scope (policies that apply
only to the local node) or domain scope, where the domain authority mandates (Domain
Critical) or only recommends (Domain Recommended) high-level policy that applies to
all nodes in the domain. Scope is used to determine which policy applies at any given
time in order to avoid conflicts between policies, with Domain Critical policies having
the highest precedence and Domain Recommended having the lowest precedence.
Conflict resolution is further discussed in Section 4.1.3.4.
Finally, maritime nodes spend most of their time with a single operational set of
communication policies that can be seen a single set of policies. However, in times of
critical stress or due to mission requirements, the management goals can change
drastically. The concept of a ship’s operational level was introduced to allow for a
different set of policy to be active at one time. Each level corresponds to the current

49
communications status of the node. For each level, a different set of policies are specified
in advance to express networking requirements based on the available communication
capabilities. This innovative concept was added so that a ship may quickly switch from
one policy-group to another with the policy system automatically making the required
changes to network devices and services to meet the changed needs.
4.1.3 Policy Services The operation of the policy system is divided into a number of interrelated policy
services. A distribution service takes HL policy generated by the user through the PSI and
sends it to all policy systems that are affected by it (depending on scope). A provisioning
service takes the HL policy that reaches the local system, gives it to the appropriate
management service, and provisions the resulting LL policy to the proxy-PEPs registered
to receive it. A policy enforcement ensures that LL policy that reaches a PEP is enforced
on its associated device, ensuring that the goals of the initial HL policy are respected.
Working with each of these three services, a policy conflict resolution service resolves
conflicts that arise when the implementation of overlapping HL policy would result in
conflicting device commands.
4.1.3.1 Policy Distribution Based on the policy system requirements for efficient and robust operation, a policy
distribution service was developed. When the user submits a HL policy from the PSI, it is
sent to the local policy manager. The policy manager then generates LL policy that may
be distributed throughout the management domain. Finally, low level policy is translated
by the policy enforcement point (PEP) into device-specific commands and sent to the
appropriate device(s). As shown in Figure 6, the policy manager handles the HL policy
document it receives from the PSI based on the policy’s scope.

50
Figure 6, HL Policy Distribution (from [6])
Local scope policies are processed locally i.e. they are given to the local PETE service
(steps 1-3). If the HL policy document also contains domain scope policy statements
(domain critical and/or domain recommended), the policy system, in addition to
processing the domain policies locally, also re-distributes them to all ships (steps 4-6).
All nodes receiving domain-scope policies will pass them on to their local PETE service
for processing. Pseudo code outlining the policy distribution process is given in Figure 7.
Algorithm: Policy-Distribution
Input: a list L of maritime nodes
Output: none
1. Take a node’s address from L and request a lock from the node 2. Once granted a lock to that node, send the policy 3. Once the policy download is complete, release the lock and once release is
confirmed remove the current node from L. 4. Repeat steps 1-3 for the remaining nodes in L or exit if L is empty
Figure 7, Policy Distribution Algorithm Pseudo Code

51
Thus local-scope policies are immediately processed while domain-scope policies entered
locally are distributed to all nodes for processing. This implies that all ships will be
enforcing the same set of domain-critical policy, their own local policy that does not
conflict with domain-critical policy, and the domain-recommended policy that does not
conflict with other two types of policy. Thus each ship may have very different sets of
enforced policy. How conflicts are resolved is explained in Section 4.1.3.4.
A difficulty with this distribution scheme is that there may be times when a node is
disconnected when a new domain-scope policy is disseminated. In order to ensure that
policies are consistent when the node regains communications, some policy
synchronisation mechanism is required. A simple solution would be to make use of the
topology monitoring service to recognise when the local node has regained connectivity
with the domain policy authority, and then have it retrieve the latest domain scope
policies from the NOC. A related complication arises if a connection is made between
nodes which do not have connectivity to the NOC. Since there is no guarantee their
domain policy will match, they must compare their various versions. A solution would be
for all nodes in this partitioned group to distribute all their domain policy to all other
nodes. It is up to each local system to select and provision the most recent policy using a
versioning number attached to all policy. A more efficient solution would be for the
group to elect a “virtual” NOC and agree to use its version of domain policy until contact
is re-established with the real NOC. Investigation of policy synchronisation issues is left
as future work.
4.1.3.2 Policy Provisioning Policy provisioning is the process by which high-level (HL) policy is interpreted into
low-level (LL) policy appropriate for a registered PEP. When new HL policy arrives at
the local policy system, the policy is provided to the appropriate management service for
processing. It is up to the management service to produce LL policy decisions
(capability-specific commands) by associating the registered device types/roles with the
policy. PEPs must register their type and role with the local policy manager. Once
registered, the policy provisioning service will forward all relevant LL policy to that PEP.

52
In order to be able to provision the high-level policies, the system must be aware of
existing network resources and their capabilities. In a mobile network, the topology and
thus connectivity will change as nodes are removed or added, and links are temporarily
disconnected due to failure or mobility. It is crucial for the policy system to keep updated
knowledge about the current resources available to support policy provisioning. The
process of automated resource registration and discovery is illustrated in Figure 8.
Figure 8, Component Registration and Discovery Services
In this scheme, PEPs initiate policy participation through a process of registration. The
PEP registration service is first found through the WS service discovery (UDDI).
Registration provides the PEP with the address of the local policy system, and provides
the local policy system with the type and role of the PEP to be added to the PEP
repository. In the case where there are resources which are not policy aware (i.e. natively
policy aware, or previously wrapped by a policy translation service), it may be necessary
for the device or service to be discovered, and a proxy PEP of the appropriate type
created via a proxy factory to act as an intermediary. Our system currently assumes proxy
PEPs have been previously created and configured with the address of the local policy
manager.
When the proxy PEP is finished initialising, it establishes a COPS session to its
associated policy manager (specifically the policy server), which acts as its Policy
PEP Registration
Service
PEP Discovery Service
Proxy Factory
Proxy PEP Wrapper PEP
Native PEP
Device
1. Discovery
2. Create PEP
3. Register
PEP Repository
4. Add

53
Decision Point (PDP) in IETF terminology. The PEP supplies information to the PDP in
the form of a COPS configuration request. This request describes the device’s
capabilities, including the client type and role. The client type is used to specify what
types of policy (management services) the PEP understands and is interested in. The role
refers to the capabilities and function of the particular device. For example, in the
prototype a proxy PEP for an edge router controlled would use the client type “Traffic
Engineering” and the role “edge router”.
The PDP (policy server) will respond to the initial configuration request with all
provisioned (currently in force) LL policies that are relevant to the PEP device. If there is
no relevant policy returned, the PEP will take on a default behaviour (PEP dependent
default policy), and remain in a position to be provisioned at a later time.
Once the PEP is registered, when a HL policy is received from the PSI by the PDP, a
copy of the HL policy document is stored in the policy repository (for use in failure
recovery) and another passed to the associated management service and the provisioned
LL policy sent on to the appropriate PEPs. The complete policy provisioning process is
shown graphically in Figure 9.
Figure 9, Policy Provisioning Process
Once the associated management service has been identified, it begins the provisioning
process by determining which devices will be affected by the HL policy which has just
Mgmt Service
Client Type
Policy Scope
Role
PR
OV
ISIO
ININ
G
AS
SO
CIA
TIO
N
Rule Engine
HL Policy
Proxy PEP Proxy PEP (Proxy) PEP
HL POLICY SPECIFICATION POLICY
LL POLICY

54
become active. The management service uses the role and type of registered devices and
the policy scope as well as the submitted HL policy document as input to a rule engine.
The rule engine uses the set of mapping rules (specification level policy) specific to the
management service to process the information and create LL policy decisions. These
decisions are passed back to the policy provisioning service which compares the newly
generated LL policy against the currently applied set of LL policy. It extracts the
differences and produces a set of remove/install decisions. These policy decisions are
then passed to the policy server which matches the resulting policy generated with the
client types and roles that PEPs have expressed interest in. The matching LL policy
decisions are then provisioned to interested PEPs for translation into device commands to
enforce the provisioned policy.
The PEP maintains its COPS session to the PDP active at all times. This allows the PDP
to push policy decisions to the PEP when relevant policies are modified. The PEP may
transmit a new configuration (client type/role) request to the PDP at any time to report
changes in its capabilities or to simply send status information to the PDP. The use of the
persistent COPS session between the PDP and the PEP allows both devices to detect
immediately when the other device reboots or fails.
4.1.3.3 Policy Enforcement The policy system operates, in part, under a provisioning execution model§. This model
requires that devices be configured based on current (or default) policy prior to
processing events. As events occur, they utilise the provisioned policy to decide what
actions are to be performed. Once the policy has been provisioned to the device,
monitoring is required to ensure that the policy is being correctly enforced. The policy
enforcement service is tasked with the translation of provisioned LL policy into device
commands that can be enforced on the PEP’s associated device.
In the PBNM prototype system, the devices to be provisioned are Cisco routers which are
policy-enabled through the addition of a proxy PEP. The PEP maintains connection state
§ The provisioning execution model is used for all PETE services except the reservation service. Policy decisions for the reservation service are generated upon arrival at the source of a service request.
55
to reduce the complexity of the interactions with the routers. Policies come into force
when they are submitted at the PSI. Thus, once the policy server has sent the LL policy
differences (install/remove decisions), the proxy PEP must immediately translate the
policy into commands understandable by the device for which it is a proxy in order to
enforce the new policy as it is provisioned.
Two types of policy monitoring should be considered. The first type is internal policy
monitoring, which reports on the status of local policies (which policy is currently active,
pending, conflicting, etc.). This is available as part of the PSI which provides a view of
all policies (of all scopes) that have been applied on the local node. The status of policy
of other nodes must be accessed remotely by connecting to the remote policy manager.
The second type is external of policy monitoring. After policies have been deployed, it is
important to have an independent monitoring process in order to ensure that the
goals/requirements of deployed policies are being correctly enforced. This is achieved by
the traffic monitoring service (Section 4.2.1). By comparing the policy defined goals with
the actual state of the network at each node, the correct operation of the PBNM system
can be gauged.
4.1.3.4 Policy Conflict Resolution In any complex policy system it is possible that more than one policy applies given the
current set of policy, clients and roles. Which policy should have precedence depends on
a number of factors and no widely accepted solution has been found to automate this
choice [59]. While a distributed and fully automated policy resolution mechanism for the
PBNM system is left as future work, there are a few instances where conflict resolution is
required and accomplished in the current system. These include;
• Assignment conflicts that occur when contradicting priorities or routings are
assigned to the same traffic class
• Match conflicts that occur when traffic flows match multiple policies
• Temporal conflicts that occur when multiple service requests do not have enough
resources for a certain period of time,

56
A simple conflict resolution mechanism for assignment conflicts involves the use of
policy scope. Domain-recommended policies have lowest priority, local policies have
intermediate priority, and domain critical policies are of highest priority. An example of
this type of conflict can be found in the traffic prioritisation policy (described in Section
4.2.2). A typical domain-recommended policy is: “email traffic to be sent in the best
effort class”. An individual ship may decide email has medium priority and have a local
policy to that effect. This local policy takes precedence unless a domain-critical policy is
in effect specifying some other QoS treatment for email. In such a case the domain-
critical policy would take precedence over the previous two.
Match conflicts can be resolved by applying the policy with the most specific description
of the flow in question. The most specific policy includes the most descriptors including
source, destination, port number, etc. For example, if local policy A indicated that email
were to have medium priority and another local policy B indicated that email from the
commanders laptop were to have high priority, the priority of email traffic would depend
on where it originated. Since traffic from the commanders laptop matches a more specific
policy (includes a source) policy B would be applied to that traffic.
Temporal conflict resolution involves existing service request policies that match in every
aspect except their start and end times. If the policies overlap in time for the same link,
the conflict is currently resolved through priority mechanisms. The higher priority policy
will invalidate the lower priority policy, or will cause the service request to fail
depending on the order in which the policies were made (the earlier service request is
given priority).
4.2 The PETE Management Services When different network applications converge onto a single maritime WAN, traffic
prioritisation and resource optimisation becomes important to ensure that critical
information is delivered before less urgent traffic. One of the main contributions of this
work was the development of four management services to meet the traffic engineering
requirements in the maritime environment described in Section 2.1.4. These PETE

57
management services include traffic monitoring, adaptive routing, traffic prioritisation,
and resource reservation services.
The traffic monitoring service (Section 4.2.1) distributes the current state of the local
node’s traffic and communication capabilities to other connected nodes as required and as
able. The traffic prioritisation service (Section 4.2.2) matches traffic with the priority and
precedence applied by policy and matches it to a QoS class for transmission in the
network. The adaptive routing service (Section 4.2.3) concentrates on resource
availability and resource suitability. Routes are based on available bearers, and limited
by operational and application requirements. The resource reservation service provides
end-to-end QoS guarantees for critical flows and is described separately in Chapter 6.
Together these services provide a valuable traffic engineering capability in maritime
networks as described in Section 4.3 and as shown through simulation in Chapter 5.
4.2.1 The Traffic Monitoring Service In order to provide the ability to ensure that provisioned policies are achieving the desired
effect, a traffic monitoring service (TMS) was designed to measure the outgoing traffic of
a node and relay this information in summary form to applications in the maritime
network as required and as able. Timers and retransmissions of the summary data are
used for fault tolerance.
One aim is for the monitoring service to give feedback via the event service to other
management services so they can determine if their policy is being respected, and if not
how the policy has been violated (policy monitoring). The traffic monitoring service can
also be used to monitor the state of the various other nodes in the network via the PSI or
another monitoring process.
After a monitoring client has registered its interest in receiving traffic updates from a
particular node (subscribed), it will receive information periodically in one of three levels
of detail based on policy: base, enhanced, or detailed. The amount of information sent to
interested parties, most often simply the NOC, can be tuned by switching between levels

58
so that the information is delayed by a bounded amount, or generate a maximum
bandwidth overhead per unit time.
In base mode, local nodes transmit the current network topology and a summary of the
aggregate traffic going in and out of that node (as total bandwidth per traffic class).
Minimal overhead is generated, even if broadcasting to all peer nodes in network.
In enhanced mode, the links can also give similar information, as well as the bandwidth
allocations for the various priority levels and how much has been reserved by RRS flows.
More bandwidth would be required to broadcast to all peer nodes, multicasting to specific
interested nodes is recommended.
In detailed mode, traffic classes can be further subdivided into individual flows and may
include information such as delay, jitter and packet loss ratios (if available – from
protocols such as RTP). This is again link centered. Significant bandwidth would be
required to broadcast/multicast to peer nodes in network, unicast traffic to highly
interested nodes is recommended.
In order to provide improved responsiveness and avoid overloading the network with
management traffic, the TMS is policy-enabled. The target (permitted subscribers), detail
level and period between successive transmissions are influenced by policy. In extreme
cases no transmissions are made and traffic updates must be explicitly fetched using the
PSI due to the bandwidth required. Some examples of traffic monitoring policy are:
• “If the outgoing WAN links are congested, broadcast only base traffic status, with
a limit of one report per subscribed node per minute (local policy)”;
• “If the WAN links are not congested, distribute the base status to all peer traffic
monitoring service instances every hour (domain-recommended policy)”;
• “Allow detailed status to be sent to the NOC only, all other nodes may only
receive base and enhanced status and must explicitly request enhanced status
information (domain-critical policy)”.

59
Using the information generated by the TMS, network aware applications can tailor their
operation to network conditions in order to achieve a desired service level. This service is
particularly interesting for maritime networks since it would be difficult to make such
automated adjustments using existing technologies.
Existing management products which use SNMP are known to swamp the low bandwidth
links available when starting up because of the traffic generated to determine the state
and configuration of the network. The advent of distributed architectures and protocols
such as the Network Configuration Protocol (NETCONF [RFC 4741]) may improve this
somewhat but the ability to tie traffic information into applications with a policy
assignable overhead is novel. Simulations (see Figure 15) showed that in both small (four
ship) and larger (eight ship) networks, traffic data could be updated at the NOC at least
every 30 seconds by switching to lower levels of detail when the intervening network was
loaded.
4.2.2 The Traffic Prioritisation Service The second PETE service is the Traffic-Prioritisation service (TPS). In an approach
common to previous PBNM solutions, we assign traffic to different DiffServ classes to
prioritise the more important application traffic relative to traffic of lesser importance.
Effectively, the service uses weighted fair queuing (WFQ) and a traffic identification
scheme to match the policy assigned priority of traffic with a weighted proportion of the
transmission resources. This assures that relative traffic priority is maintained from
source to destination, including over the relay points.
We have defined five DiffServ classes: best effort, background, standard, excellent effort
and streaming. Each of these classes is given a policy-defined weighting. The higher the
weighting, the greater the proportional resources assigned to it. One of the best features
of weighted fair queuing is that if a class does not use all of its assigned resources, the
extra bandwidth is split between the remaining classes proportional with its weighting.
Thus higher-priority classes get a greater proportion of “free” resources to use if needed.

60
In all, this mechanism provides a guaranteed minimum level of service with the
possibility of getting more if other classes do not need their share.
The traffic prioritisation service only assigns applications to the first four of these classes.
The fifth class is used only by the resource reservation service in order to guarantee that a
certain amount of bandwidth will be available to the admitted traffic flows. This scheme
is described in more detail in Section 5.3.3.
Which traffic is assigned to which of these four DiffServ classes is determined by policy.
Traffic can be assigned from something as general as an application type, to as specific as
a particular flow between two known end points. Examples of TPS policy are:
• “all chat traffic from the local commanders laptop is to be assigned to the
excellent effort forwarding class”; (local policy)
• “all email traffic originating on the local node is best effort”; (local policy)
• “all VOIP traffic throughout the maritime domain is recommended to be assigned
to the excellent effort forwarding class”. (domain-recommended policy)
By using a policy system to dynamically alter the relationship between queuing resources
and applications, the desired service level for some traffic can be assured with a high
probability. The drawback of using traffic prioritisation on its own is that it does not
guarantee that network resource utilisation will be globally optimised. For instance, since
maritime nodes currently use a link-state routing protocol, only the highest-ranked link
for a certain destination will be chosen, leaving alternative links potentially underused.
Similarly, since traffic prioritisation is based either on a per ship view at a particular time
(is using local policy) or global traffic priorities (if using domain policy), both schemes
may lead to sub-optimal sharing of queues when attempting to meet both sets of criteria.
In order to achieve the dynamic allocation of traffic to a certain forwarding class, a
number of technologies must be used in combination. First the edge routers must be
updated with traffic mappings (assign DSCP code points to a traffic class identifier).

61
Then, routers must be updated with queue discipline (bandwidth/weightings) to meet the
information exchange requirements for that class if it does not already exist. After this,
there must be some monitoring function to measure QoS to provide feedback such as that
provided by the TMS to ensure the desired service level is being achieved. Finally there
some mechanism is required to connect these features so that individual traffic classes,
flows, and even groups of traffic and bandwidth priorities can be reallocated across a
large number of machines at the same time. All but the last of these are available in
existing network management products, and the automation provided by policy-based
network management supplies the rest. Simulations show that the TMS delay could be
significantly reduced when assigned to a high priority, and the delay could be varied by
changing the priority of the traffic. It also showed that in a small network voice calls that
had unacceptable delay without TPS could be made acceptable with TPS.
4.2.3 The Adaptive Routing Service One of the underlying goals of our approach is to have the PETE services working
together to supply an integrated end-to-end service. Mobile nodes may have multiple
WAN links of varying capacity, but applications may be able to make use of only a
subset of the available links. This may be for reasons of delay sensitivity (e.g. for VOIP
calls) or because of the error/failure rate of the link (e.g. for ftp communications). This
led to the third PETE management service, the adaptive-routing service (ARS). ARS uses
MPLS (a tunnelling technology) to divert traffic from the default route when links cannot
meet the base QoS requirements of the application or are currently overloaded.
First, the ARS matches traffic classes to WAN resources. Essentially, it indicates what
types of traffic must/should travel over a certain type of bearer. It makes use of resource
availability (e.g. does the bearer possess sufficient bandwidth to meet the requirements of
that traffic class) and resource suitability knowledge (e.g. does the bearer impose delays,
error rates, etc. that will not meet the requirements of that traffic class). The ARS service
ensures that applications are using links that can meet their underlying QoS requirements.
Secondly, the ARS avoids the use of overloaded WAN links. Based on the current
utilisation of the local links and the QoS required by new application traffic, the ARS can

62
be used to reroute traffic over underused links to take an alternate route to the destination.
This mechanism relies on a set of MPLS tunnels in the network called an MPLS overlay
that is created in the network specifically for the purpose of providing alternate routes
based on the links that are likely to become overloaded.
Examples of ARS policy are:
• “traffic exclusive to the task group SHOULD be sent via LOS links UNLESS
such traffic cannot meet its QoS requirements”; (domain required policy)
• “links with utilisation greater than 85% MUST reroute best effort traffic onto an
alternate route (if an alternate MPLS tunnel exists) or drop this traffic”; (domain-
recommended policy)
• “voice and video traffic MUST use satellite bearers only UNLESS its utilisation
is greater than 70%”. (domain-recommended policy)
The benefits of such routing flexibility are significant. Besides ensuring that traffic of a
given type of will flow over a bearer that supports it, ARS offers a solution to the well-
known load-balancing problem. Traffic from the same source and to the same destination
can now travel over different routes. Since the path selected is based on the traffic type,
as opposed to the route cost (shortest path), ARS provides a better distribution of traffic
across the WAN links and thus better utilisation of available network bandwidth. This
result was verified by simulation.
The main advantage of interfering with the default routing is that it can lead to more
optimal use of global link resources. This provides what would be unused links with
some traffic. Altering routing can also lead to better service for most traffic, but almost
certainly for traffic identified by policy as the most critical. The combination of TPS and
ARS provide a basic TE capability by prioritising traffic and optimising network resource
utilisation.
There have recently been advances in automated routing adjustments using multi-
topology routing technology. This technology allows multiple sets of default routes to be

63
created at each node, based on different routing metrics. For instance, besides minimising
the end-to-end OSPF cost, separate routings for hop count and maximum bandwidth
could be supported. While a step in the right direction, there still need to be changes
made on each router in the network to define paths, metrics, and traffic classification
schemes to match the two. This needs to be coordinated globally to ensure loop-free
connectivity (loop free). Simulations show that alternative routings could again make
voice calls with unacceptable delay characteristics acceptable. This shows that altering
the relationship between queuing resources and applications can be used to achieve a
desired service level for some traffic.
4.2.4 The Resource Reservation Service In order to meet the TE goals in the maritime environment, one additional PETE service
was developed. Though the previous three services help to achieve the traffic-oriented
performance objectives, alone they do not meet the military requirements for hard priority
and pre-emption for critical flows. Some guarantee of end-to-end QoS in the maritime
network is required for critical traffic. For this reason, the Resource Reservation Service
(RRS) was developed. For completeness we describe this service here briefly while
Chapter 6 provides a functional description of this novel service. A description has been
previously presented in [7].
The RRS uses distributed admission control to limit the number of flows that can use a
pool of bandwidth reserved on each link in the route between source and destination. The
Resource Reservation Service provides a guarantee of end-to-end QoS for admitted
application flows. This sort of protection is most commonly useful for real-time
applications (such as VOIP or video), but could also be used for critical data transfers
(such as a specific image transfer or chat session).
RRS has been designed with a number of features to deal with the requirements of
maritime environments. This includes probing multiple routes in parallel to distribute the
reservation load, a priority and pre-emption scheme to give precedence to the most
critical flows, fault tolerant features, and dynamic reconfiguration of its operational
parameters to meet changes in operational requirements.

64
Examples of RRS policy are:
• “A maximum of 50% of the available bandwidth of a link may be reserved”.
(domain-critical policy)
• “Reservations which are pre-empted or terminated due to a change in topology
(mobility) should be immediately re-attempted on a different route”. (local policy)
• “High priority reservations should have a disjoint bypass route reserved and
placed on standby”. (local policy)
The use of admission control to provide guaranteed end-to-end service has been
standardised in the fixed network for some time through the use of RSVP as introduced in
Section 3.1. While RSVP does provide a basic end-to-end service, it is unidirectional
(where most reservations are bidirectional), does not support pre-emption (in its original
form), uses the default routing (the default route is quickly saturated in maritime
networks), and does not allow for dynamic reconfiguration of its parameters. These
differences are explained in more detail in Section 6.1. RSVP-TE does support pre-
emption but is otherwise similar though it has higher overhead and is currently unused in
the maritime environment. In order to determine the value of some features of RRS in
maritime networks, the simulations compare it with both RSVP and a reservation
protocol designed for mobility and MANETs called INSIGNIA. The simulations show
that pre-emption and multi-routing both provide significant improvements over RSVP
while INSIGNIA is not well suited to the maritime environment.
4.3 Summary This chapter has introduced the main components required to support our Policy-Enabled
Traffic Engineering (PETE) services as well as the services themselves. The maritime
policy system is based on a service-oriented architecture and provides a number of policy
services to support management operations and developed in collaboration with
colleagues at CRC. The policy system provides a number of advantages in the maritime
environment.

65
The policy representation developed for the PBNM system includes the concepts of
multiple layers of abstraction, policy scope and operational levels. Three levels of policy
abstraction are used to ease the transition between operator entered high-level
“management goals” and device commands sent to networking equipment. All policies
are assigned a hierarchical scope when entered which designate whether the policy is a
global recommendation, a local policy, or an overriding globally applicable requirement.
This concept was added to deal with the distributed management authority requirement in
maritime networks. The concept of having multiple sets of policy of which only one set is
currently active was added so that when operational requirements change, a new
consistent and pre-planned set of policy is ready to be provisioned immediately.
In order to support automated, efficient, robust, distributed, and secure operation of the
PETE services, the policy system provides a number of critical services: Policy is
automatically distributed where required, though nodes can operate independently in a
hierarchical structure; policy provisioning automates the processing and distribution of
the configuration commands for a management service; enforcement of policy is
provided within the system at the local endpoints; and while new policies may conflict
with existing policy, policy resolution mechanisms mitigate several types of conflict.
These capabilities are extensible, for instance with the addition of the proposed PEP
registration and PEP discovery services, new devices may be dynamically added and
removed from the network yet still be managed through the PBNM system.
There are two main goals for the PETE management services introduced in this chapter.
The first goal is to meet the TE traffic-oriented (prioritisation) objectives in the maritime
environment. This includes the minimization of delay, packet delay variation, and the
maximization of throughput that are achieved based on the needs of the traffic involved
and the operational requirements of each individual ship and the maritime network as a
whole. The second goal is to meet the TE resource-oriented (optimisation) objectives of
the maritime environment. This includes ensuring that network resources do not become
over-utilized and congested in a subset of the network while links along alternate routes

66
remain underutilized. In order to meet the TE goals, four management services have been
developed:
• In order to ensure that policy has been successfully implemented in the network
and provide network operators with a view of the current state of traffic in the
network, a traffic monitoring service (TMS) has been developed;
• Secondly, in order to prioritise traffic based on operational need, the traffic
prioritisation service (TPS) was developed;
• In order to balance traffic load across the network and limit application traffic to
routes that satisfy their QoS requirements, the adaptive routing service (ARS)
was created;
• In order to meet the maritime requirements for hard priority and pre-emption for
critical flows, the resource reservation service (RRS) was developed to
guarantee end-to-end bandwidth.
Combined, these PETE services ensure the traffic is prioritised over the bearer (links)
most suitable for the type of communications, operation and application (supports the
traffic-oriented performance objectives), and optimises the use of scant communication
resources (supports the resource-oriented performance objectives of this environment).

67
5 Simulation Results – Part One This chapter presents the results of the simulation work used to evaluate four services,
one policy service (distribution) and three of the proposed PETE management services
(TMS, TPS and ARS). The chapter begins with a description of the methodology used for
generating the simulation results. This is followed by the simulation setup, including the
network topology, mobility model and background traffic model used for all the
measurements. There is then a description of the models used for each of the simulated
services. The results of the simulation exercises form the bulk of this chapter, which ends
with some discussion of the overall results and their support of the thesis as a whole.
5.1 Methodology
One of the common problems with MANET simulations research is the lack of credible
results [60,61,62]. This can be caused by research that is not:
• Repeatable, where experiments do not describe all configuration settings;
• Rigorous, where the model settings which are varied, and how much they are
varied, do not exercise the feature under investigation
• Complete, where the model is oversimplified (leading to ambiguous or incorrect
conclusions)
• Statistically Valid , where the method of analysis is not described or does not
follow mathematical principles; and
• Empirically Valid , where simulations are not compared with results from world
examples or prototypes (when possible).
This section attempts to address these concerns by describing the methods used to
engender credibility. To provide repeatability, the following settings were used in all
simulations except where specifically noted. OPNET version 11.0 PL1 was used with the
default node and link models configured as required. Additional models were created or
existing models were modified in some cases as noted. Simulation runs of 130 minutes
were used with measurements beginning 5 minutes into the simulation run to allow
routing protocols to settle and the initial queuing effects to be ignored. This value was

68
chosen because it is approximately three times the amount of time required for routing to
converge and applications to reach steady state. In order to remove the effects of a
particular simulation seed value, twenty runs are performed for all measurements, each
with different seeds. All network protocols were configured to operate with default
settings throughout the entire simulation timeline. Additional information on the network
configuration can be found in Section 5.2, which provides a description of the network
and traffic configuration, and Section 5.3, which provides a description of models used to
simulate policy distribution and the PETE management services.
In order to provide rigorous and complete results the following approach has been taken.
The main metric of interest in the work relates to the response time of different
applications and how that response time is affected by various TE mechanism. For that
reason, the settings varied are at the network and application level only. The simulation
setup described in Section 5.2 provides the complete set of network level configurations
that were changed to provide minimal but sufficient variability to exercise the PETE
services described here. The variability in the application performance can thus be fully
ascribed to the changes in network configuration and PETE services themselves.
To ensure the results described here are statistically valid, the following approach was
taken. Statistics are averaged over each simulation. All results are quoted with a 95%
confidence interval, which gives values within the specified range 19 times out of 20. The
mean is calculated by summing the result of each simulation or validation measurement
and dividing by the number of results. The standard deviation is calculated as the square
root of the variance of this mean. From this the standard error is calculated as the
standard deviation over the square root of the number of results. Finally the two way 95%
confidence interval is calculated as an offset (+/-) of the mean with a value 2.093 times
the standard error for 20 measurements (simulation).
For empirical validity , simulations were compared with an existing implementation
where possible. A prototype of the policy system was developed at CRC that implements
some of the behaviours described here. In Chapter 8, RRS simulation results are

69
compared with the operation of prototype. The other management services have not been
compared since they were not implemented as described in the prototype.
5.2 Simulation Setup
Based on the description of maritime networks given in Section 2.1, a network model was
developed using OPNET [3]. In order to asses the operation of the PETE management
services, several areas of the model had to be investigated. First, in order to determine the
effect of network size, two network sizes were chosen based on maritime deployments; a
small network, consisting of a NOC and a single four ship task group, and one larger
network, consisting of a NOC and two four ship task groups. Second, the mobility of
these two networks topologies was investigated. Finally, two levels of background traffic
were developed; a nominal traffic model for simulating baseline operation, and a high
traffic model for simulating periods of network overload. More description of the
network models are available in Appendix D.
5.2.1 Network Topology
Two network topologies have been used in these simulations based on the description of
current operations of naval task groups. The small network consists of a single four ship
maritime task group and a shore-based network operation centre (NOC) while the large
network has two four ship task groups and a NOC.
A search and rescue scenario was chosen, where a task group spreads out in a square to
cover a large area and yet each ship remains in contact with its two immediate
neighbours. With a nominal LOS range of 18 nautical miles (nm), the base geographical
configuration is shown in Figure 10.
Figure 10, Task Group Geometric Configuration
15 nm
15 nm
15 nm
15 nm
21 nm Ship 2
Ship 3
Ship 4
Ship 1

70
Given the limited LOS range and a satellite capability for 3 of the four ships (for node
diversity), the topology of the small network shown in Figure 11 is used. The large
network is composed of two task groups similarly configured but initially outside of LOS
communication range of each other as shown in Figure 12.
Figure 11, Small Network Topology
The connectivity of the small network model showing all the wireless links is shown in
Figure 11. The link types are as follows. Ships 1-3 have satellite communications to the
NOC with ship 2 and ship 3 using a 64kbps link while ship 1 has a 128kbps link. Each
ship also has two 64 kbps radio links which form a ring. This implies that ship 4 is only
connected via LOS links from ship 1 and ship 3. It should be noted that besides our
current assumption that each ship only keeps two LOS links active at one time, the
geometric configuration described in Section 5.2.2 limits the LOS connectivity to that
shown. This configuration is typical of a single naval task group [10].
Figure 12, Large Network Topology
Ship 2 Ship 4
Ship 1
Ship 3
Ship 8
Ship 7
NOC
Ship 5
Ship 6
64 kbps LOS
64 kbps satellite
128 kbps satellite
Ship 2 Ship 4
NOC
Ship 1
Ship 3 Four Ship Maritime Task group
64 kbps LOS
64 kbps satellite
128 kbps satellite

71
The configuration of the large network model is shown in Figure 12. In this network
ships 1-3 and 5-7 have satellite links to the NOC with ships 2, 3, and 7 at 64 kbps and
ships 1, 5 and 6 at 128 kbps. The LOS links have been configured similarly for both four
ship tasks groups. The large network configuration provides the opportunity to
investigate more complex interactions between two task groups initially at some distance
to each other. The mobility model described in Section 5.2.2 has the two task groups
travel within LOS range of each other causing new connectivity, interference and
bandwidth sharing.
In order to realise these network models in OPNET, the base Cisco 7204 model was used
for simulating the routing capability of the NOC. Ships use a custom-built node model
that includes capabilities for both point-to-point and wireless IEEE 802.11 links. The
point-to-point link model was used for satellite links as this most closely follows the
leased bandwidth operation of satellite communications. The IEEE 802.11 link model
was used for the LOS wireless links because it provides a wireless MAC that can
simulate features such as fading and interference. The IEEE 802.11 model was modified
to operate at the 64kbps LOS bandwidth rate and simulations indicate an operational
throughput of 42 kbps. One drawback of this approach is that while IEEE 802.11 uses
CDMA, maritime LOS is most often TDMA. More work is required to validate our
assumption that this difference is not significant.
5.2.2 Mobility Model
In order to model the interaction of the LOS links, a mobility model was developed in
two parts. Intra-task group mobility is based on the Nomadic Community model [63].
Using this model, the individual nodes of each task group move randomly within 3 nm of
their “base” position (a new position within that radius and within a 1 nm radius of the
old position is chosen with even distribution every 2 minutes). Links fail when they
exceed 18 nm and recover when they are at most 18 nm apart. Analysis suggests that
LOS links in this model have a mean time between failures (MTBF) of about 5.5 hours
and a mean time to recovery (MTTR) of 12.5 minutes. Note that since the NOC is

72
connected to mobile nodes by satellite, such links are available at all times to the nodes at
which such links are operational. Since modern satellite systems can achieve MTBF rates
of > 5,000 hours with MTTR of < 1.0 hour [64], the failure of satellite links has not been
modeled.
To give an idea of the impact of this type of mobility, the preferred gateway to the NOC
of ship 4 in the small network was analysed. In this model, ship 4 is connected via LOS
links only. The preferred gateway is ship 1 96.2% of the time, ship 3 3.7% of the time,
and ship 4 is disconnected from the network 0.1 % of the time. Note that since ship 1 has
a higher speed satellite link, it is preferred over ship 3 (based on OSPF cost). Note ship 2
is never the gateway, as ship 1 is always in range when ship 2 is in range, as is ship 3.
The method by which links are established initially and after a link failure are provided in
detail at the end of this section.
The second part of maritime mobility is inter-task group mobility, which applies only to
the large network which consists of two task groups. In this model, the two task groups
begin 20 nm away from each other (at the closest point) and at a random angle (from 0 to
360°). The first task group then approaches the other steadily at relative speed of 30 knots
(nm/hour) on a set heading evenly distributed from this angle -45° to +45° with 0° being
directly towards the centre of the other task group. In combination with intra-task group
mobility, there will be link failures and recoveries based on the 18 nm range of the LOS
links. This mobility model is outlined graphically in Figure 13.
Figure 13, Inter-task group mobility
A - Angle of arrival T - Angle of trajectory
Task group #1
18 nm initial distance
Trajectory
A
T
Task group #2

73
For the results described in this thesis, a single set of angles was used to simplify the
model. The angle of arrival was set to 45° and the angle of trajectory was likewise set to
30° giving a trajectory similar to that shown in Figure 13. To give an idea of the impact
of this aspect of the model, we discuss here the connectivity of ships 4 and 8. During the
simulation, ship 4 is within range of ships 6 and 7 for an average of 66 minutes over the
130 minute run. Similarly, ship 8 comes within range of ship 1 for an average of 45
minutes during the simulation run. Since these ships do not have satellite communications
and they come within range of ships with high speed satellite (ships 1 and 6), this causes
the network topology to change as described below. Note that the 130 minute simulation
time was chosen since it is also the time in this model during which ships from one task
group are within LOS range of each other.
Since each maritime node can support a maximum of two simultaneous LOS connections
[10], the following algorithm was developed for link establishment. This algorithm
prioritises connections from nodes with higher-speed satellite connections, especially
when a node has no satellite connection itself. Once a new connection is established, the
connection is maintained until a better one is available. There are three rounds to
establishing a link that are performed in order. It is assumed that each ship-to-ship LOS
link is assigned its own frequency with only two links available per ship. Note that the
method by which links are physically established (i.e. choice of frequency and alignment
of antenna) is beyond the scope of this work.
In phase 1, ships with a satellite connection will attempt to link with ships without
satellite. Such ships will prefer connections to ships with the highest-speed connections.
This is meant to ensure such ships do not become disconnected. In phase 2, ships will
connect with a node in range with a high speed connection. Nodes will prefer ships in
their own task group (neighbours) over ships in another task group (peers). Finally in
phase 3, ships will connect with any other available ship, preferring peers over
neighbours. An example of this network formation using the static large network case is
given in Figure 14.

74
Figure 14, Network Formation (LOS links) of Large Network (Static)
This diagram shows the order in which the LOS links are formed, starting at phase 1 and
ending at phase 3. The figure also shows which node initiated the link with the arrow
pointing towards the ship connected to. Note that in two cases the link could be initiated
from either end (ships 3-4 and ships 5-6).
During periods of mobility, links may also be lost or gained from ships going in and out
of the 18 nm range. This is primarily the case in the large network as the two task groups
pass each other. When a ship comes within range, the new ship becomes connected if it is
using less than the two links allowed, or if the new ship is preferred over the ships
currently used (with the least preferred ship being dropped). If a ship has a link it will
attempt to connect that link using the same algorithm as before.
5.2.3 Background Traffic Model
Two different traffic loads were developed, nominal and high, with traffic distributions as
given below. The resulting bandwidth usage, base OPNET traffic model, and application
priority are given in Table 5.
Table 5, Simulated Baseline Traffic
Application Avg Bandwidth (kbps) Nominal
Avg Bandwidth (kbps) High
Opnet Model
Priority
Voice Call 1.82 +/- .17 in 1.84 +/- .19 out
1.79 +/- .15 in 1.88 +/- .17 out
G.729A <=5
MCOIN .27 +/- .04 in .18 +/- .03 out
2.95 +/- .09 in 2.18 +/- .09 out
FTP 4
Phase 1 (preferred)
Phase 1 (preferred) Phase 2
Phase 1
Phase 2
Phase 3
Phase 2 Phase 1
Node with high speed satellite
Node with low speed satellite
Node without satellite
1
2
3
4
5
6
7
8
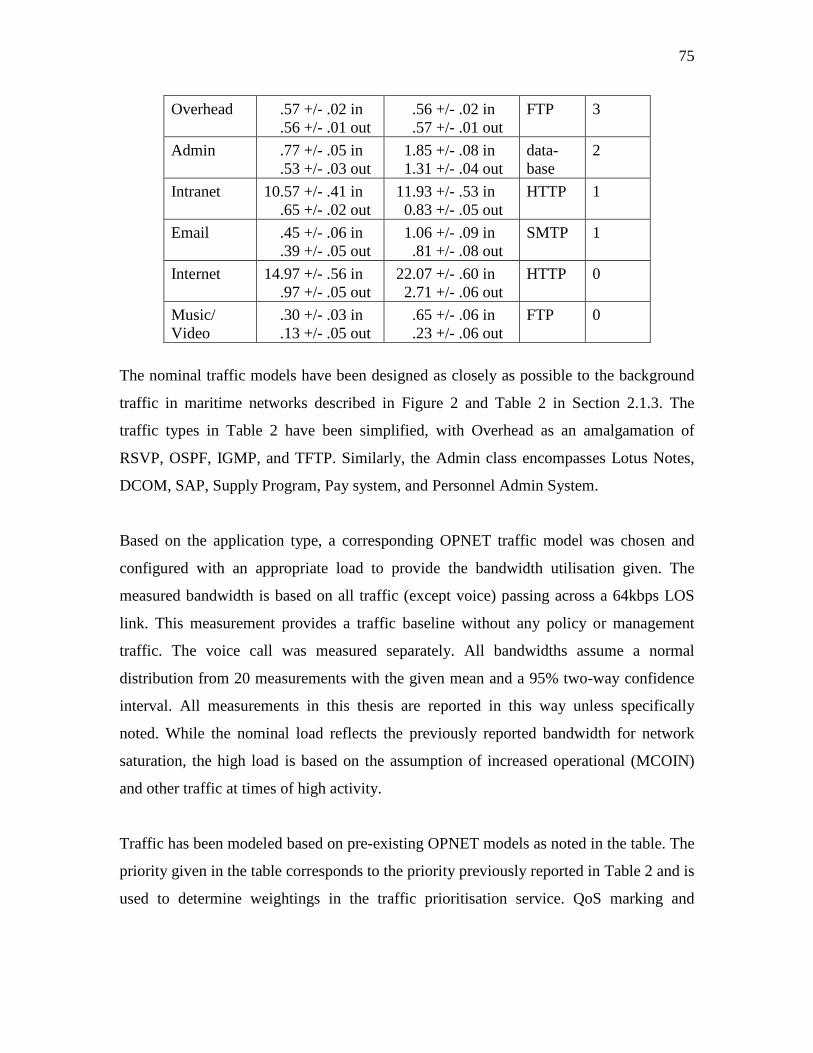
75
Overhead .57 +/- .02 in .56 +/- .01 out
.56 +/- .02 in
.57 +/- .01 out FTP 3
Admin .77 +/- .05 in .53 +/- .03 out
1.85 +/- .08 in 1.31 +/- .04 out
data-base
2
Intranet 10.57 +/- .41 in .65 +/- .02 out
11.93 +/- .53 in 0.83 +/- .05 out
HTTP 1
Email .45 +/- .06 in .39 +/- .05 out
1.06 +/- .09 in .81 +/- .08 out
SMTP 1
Internet 14.97 +/- .56 in .97 +/- .05 out
22.07 +/- .60 in 2.71 +/- .06 out
HTTP 0
Music/ Video
.30 +/- .03 in
.13 +/- .05 out .65 +/- .06 in .23 +/- .06 out
FTP 0
The nominal traffic models have been designed as closely as possible to the background
traffic in maritime networks described in Figure 2 and Table 2 in Section 2.1.3. The
traffic types in Table 2 have been simplified, with Overhead as an amalgamation of
RSVP, OSPF, IGMP, and TFTP. Similarly, the Admin class encompasses Lotus Notes,
DCOM, SAP, Supply Program, Pay system, and Personnel Admin System.
Based on the application type, a corresponding OPNET traffic model was chosen and
configured with an appropriate load to provide the bandwidth utilisation given. The
measured bandwidth is based on all traffic (except voice) passing across a 64kbps LOS
link. This measurement provides a traffic baseline without any policy or management
traffic. The voice call was measured separately. All bandwidths assume a normal
distribution from 20 measurements with the given mean and a 95% two-way confidence
interval. All measurements in this thesis are reported in this way unless specifically
noted. While the nominal load reflects the previously reported bandwidth for network
saturation, the high load is based on the assumption of increased operational (MCOIN)
and other traffic at times of high activity.
Traffic has been modeled based on pre-existing OPNET models as noted in the table. The
priority given in the table corresponds to the priority previously reported in Table 2 and is
used to determine weightings in the traffic prioritisation service. QoS marking and

76
associated WFQ weights are given in the Traffic Prioritisation Service, described in
Section 5.3.3 below.
In both network topologies, application servers are on the NOC. This affects all traffic
except for network overhead and voice calls. Overhead traffic is evenly spread between
all nodes (including nodes in the other task group for the large network). Voice traffic is
point-to-point and used only as noted for particular measurements and is not part of the
baseline background traffic.
5.3 Models of the Services
5.3.1 Policy Distribution Service
In order for domain policy to apply consistently across the entire network, a method for
distributing changes in policy is required. Based on the policy system described earlier, a
simple method would be for policy to be sent to each node in the domain in sequence
until all ships have received and acknowledged the receipt of the new domain-wide
policy. The policy distribution service (PDS) was designed in this manner.
In order to model this service, a custom application model was created in OPNET. Based
on the naïve distribution method where the policy is distributed in three steps (one to
lock, one to update policy, one to unlock), three packets are sent to each ship in series,
waiting for the previous ship to be updated before sending the domain policy to the next
ship in the currently connected network as outlined in Figure 7. A 64 byte lock, followed
by a 10 kbyte policy, followed by a 64 byte release sent via acknowledged UDP was
used. This method mirrors the initial implementation of policy distribution in the testbed.
The delay to send policy to individual ships is included in these results to give an idea of
the impact of the PETE services on per ship delay.
5.3.2 Traffic Monitoring Service
The traffic monitoring service (TMS) provides summarised traffic information to all
interested (subscribed) nodes at a policy-defined interval. Three levels of information
detail may be provided; base, enhanced and detailed. Since each level of increased detail

77
requires increased bandwidth consumption and longer delay for information to be sent,
the level of detail used is tailored to the (subscribers) locally perceived load of the
network. It is expected that base-level detail can be sent periodically without problem.
Enhanced and detailed information can be sent periodically, but at a very low rate. The
rate at which different levels of detail are sent are defined by policy either to have a set
interval, or be based on external network conditions such as delay and link loadings (or
simply respond upon request from the subscriber). Timers and retransmissions of the
summary data are used for fault tolerance.
In our simulations, we defined the subscriber as the NOC who requests information from
all other nodes in the network on average every 120 seconds. In order to model this
service, three custom application models were created in OPNET, one for each level of
detail. Loadings were based on aggregated SNMP-style communications extrapolated
from the amount of detail required. The impact of the different levels of traffic on the
network and the delay and bandwidth requirements of each could then be studied. In this
chapter we discuss the delay of the service and use the changes in the services delay to
illustrate the utility of the traffic prioritisation and adaptive routing services described
below. We also discuss the utility of switching between different levels of detail based on
the current load on the underlying network.
5.3.3 Traffic Prioritisation Service
The traffic prioritisation service (TPS) provides a mechanism to rank traffic by
importance and prioritise resource allocation accordingly. It associates traffic to different
classes of service (CoS) that have relative priority between each other, also with different
handling specifications. Effectively, the service provides end-to-end (network-wide as
opposed to a point-to-point) preferential treatment for certain applications, i.e. relative
traffic priority is maintained from source to destination, including over the relay points.
This preferential treatment is also known as DiffServ or soft QoS. Our interpretation of
the priorities given to different types of traffic (see Table 5) implies that there are six
classes of service: priority 0 (Best Effort), priority 1 (Background), priority 2 (Standard),
and priority 3 (Excellent Effort), priority 4 (Streaming), and priority 5 (reserved). In our

78
model, WFQ was used with WRED in the priority 0 (Best Effort) class. Resource
allocations are given in Table 6 below.
Table 6, WFQ Weightings Used for TPS Priority Class Name Weight Notes 0 Best Effort 6 Recreational traffic 1 Background 6 Low priority applications 2 Standard 8 Operational applications 3 Excellent Effort 12 Routing and Management traffic 4 Streaming 18 Multimedia applications 5 Reserved 50 Up to 50% of bandwidth can be
reserved for RSS flows.
In WFQ the relative weights correspond to the relative percentage of bandwidth that is
assigned to each class of traffic. Since the weights assigned were engineered to add to
100, the assigned weight is the percentage of available bandwidth for each class if the
link is fully loaded. Note that this means that if, for example, only one flow is in the
standard class and there are three flows in the excellent effort class, the standard class
flow will get at most 8% of the available bandwidth while each excellent effort flow will
get an average of 4%. Thus bandwidth is assigned per class and not per flow. One of the
most useful aspects of this scheme is what happens when one class is not fully saturated.
Any bandwidth not used by a certain class is divided between the remaining classes,
again in weighted order. Thus the reserved class would gain 50% of any bandwidth not
used by any of the other classes (if needed).
This service was one of the simplest to model in OPNET as it simply requires interfacing
with existing QoS features. Note that as such TPS does not implement any new capability
on the router; its value comes in the ability to quickly change traffic prioritisation in
response to changes in policy. One of the interesting issues with OPNET was applying
DiffServ to wireless models as this requires some understanding of the operational
bandwidth in order for weights to be allocated correctly to the link. Since the bandwidth
available on the link changes depending on environmental conditions and the number of
other nodes transmitting on the same frequency, calculating the operational bandwidth

79
requires extensive knowledge of the current state of the network. The LOS model used
here has a nominal bandwidth of 64 kbps over a two-user link.
5.3.4 Adaptive Routing Service
The Adaptive Routing Service (ARS) matches traffic classes to WAN resources.
Essentially, it indicates what types of traffic must/should travel over a certain type of
bearer. It makes use of resource availability (e.g. does the bearer possess sufficient
bandwidth to meet the requirements of that traffic class) and resource suitability
knowledge (e.g. does the bearer impose delays, error rates, etc. that will not meet the
requirements of that traffic class). Besides ensuring that traffic of a given type will flow
over a bearer that supports it, ARS offers a solution to the well-known load balancing
problem. This was verified in the simulations.
The ARS was modeled through the use of MPLS tunnels. An MPLS overlay for each
network was created specifically for VOIP calls. Based on the loading of the links in the
network, VOIP are routed over the least loaded links. In an actual implementation,
multiple MPLS overlays could be operator assigned to make best use of under-loaded
links, or avoid links that can not support the QoS of the application as required by policy.
5.4 Results
This section outlines the results of the simulation work for the various services.
5.4.1 Policy Distribution Service
The policy distribution service described in Section 5.3.1 was simulated with the
following results. All domain policies were deployed by the node representing the NOC.
Table 7, Policy Distribution Delay in Seconds, Small Network Mobility Nom. Load Delay (s) High Load Delay (s)
Static 2.5 +/- 0.4 6.5 +/- 0.6 Delay to ship 1 Mobile 2.1 +/- 0.4 4.5 +/- 0.5 Static 5.0 +/- 0.9 10.7 +/- 1.0 Delay to ship 2 Mobile 5.4 +/- 0.7 11.0 +/- 1.0 Static 4.7 +/- 0.6 10.0 +/- 1.0 Delay to ship 3 Mobile 6.0 +/- 1.1 14.4 +/- 1.5

80
Static 8.8 +/- 1.2 21.3 +/- 1.2 Delay to ship 4 Mobile 8.9 +/- 1.4 21.6 +/- 1.8 Static 20.9 +/- 1.9 48.5 +/- 2.0 Total Delay for
all ships Mobile 22.4 +/- 2.4 51.5 +/- 3.2
As would be expected, in the small network the delay to ship 1 which has the higher
speed 128 kbps satellite link is significantly less than distributing policies to the other
ships. The delay to ship 4 is especially long since it must also pass over the LOS link via
ship 1. It is interesting to note that the addition of mobility does not change the total
amount of time significantly, but does reduce the load on ship 1 by shifting its use to ship
3. Looking at the network topology this implies that the link between ship 1 and ship 4
failed on a regular basis in order to cause this shift.
Table 8, Policy Distribution Delay in Seconds, Large Network Mobility Nom. Load Delay (s) High Load Delay (s)
Static 2.2 +/- 0.3 6.1 +/- 0.7 Delay to ship 1 Mobile 2.2 +/- 0.3 6.6 +/- 0.6 Static 4.7 +/- 0.8 10.5 +/- 1.0 Delay to ship 2 Mobile 4.5 +/- 0.9 11.1 +/- 0.9 Static 4.5 +/- 0.9 10.7 +/- 1.1 Delay to ship 3 Mobile 4.8 +/- 0.9 11.0 +/- 1.0 Static 8.3 +/- 1.0 22.2 +/- 2.2 Delay to ship 4 Mobile 8.2 +/- 1.4 21.6 +/- 2.1 Static 2.2 +/- 0.4 6.5 +/- 0.7 Delay to ship 5 Mobile 2.5 +/- 0.5 6.1 +/- 0.7 Static 1.5 +/- 0.4 3.6 +/- 0.5 Delay to ship 6 Mobile 1.5 +/- 0.3 3.3 +/- 0.4 Static 4.2 +/- 0.8 10.9 +/- 0.7 Delay to ship 7 Mobile 4.6 +/- 1.1 10.8 +/- 1.0 Static 8.8 +/- 1.0 23.8 +/- 1.8 Delay to ship 8 Mobile 9.1 +/- 1.5 22.8 +/- 1.9 Static 36.4 +/- 1.8 94.5 +/- 3.2 Total Delay for
all ships Mobile 37.5 +/- 2.9 93.5 +/- 4.7 The delays for individual ships in the large network show a similar trend to that in the
small static network with delays to ships of similar connectivity comparable. An
exception is ship 6 which has a 128 kbps link but does not have to forward the traffic
from another ship via its LOS link. For this reason the delay is much shorter. Considering
the mobile case, it can be seen that unlike the small network all values are within the 95%
confidence interval of their static counterparts. This indicates that mobility is not having a

81
statistically significant effect on the traffic. To explain this, consider that during mobility
there are alternate ships through which transmissions can be forwarded, and thus
disconnection from the network is negligible, at 0.1% in the small mobile network. In the
large network, the disconnection rate is even less since ship 4 is within range of ships 6
and 7 for an average of 66 minutes over the 130 minute simulation and ship 8 comes
within range of ship 1 for an average of 45 minutes during the simulation run. The policy
distribution delay results indicate that the lack of disconnections and use of satellite have
negated the impact of mobility on application delay in these scenarios.
Looking at these results qualitatively, we would argue that delays for policy distribution
of up to a minute are long but acceptable in this environment. Since connectivity changes
in the worse case (large mobile network model) on the order of tens of minutes, a
similarly long delay would be excessive. However delays an order of magnitude slower
even in the worse case is much better than current reconfiguration delays when done by
hand. Based on this analysis, only the large high-load policy distribution delay is not
acceptable.
From both series of results it is evident that sending policy updates in series is seriously
impacting the distribution delay. If updates were sent in parallel, a speedup of a factor of
approximately 2 to 4 could be accomplished based on minima of these results.
5.4.2 Traffic Monitoring Service
The traffic monitoring service (TMS) described in Section 5.3.2 was simulated with the
following results. Table 9 shows the monitoring service delay in seconds for the small
network while Table 10 shows the delay in the large network.
Table 9, Traffic Monitoring Delay in Seconds, Small Network Mobility Nom. Load Delay (s) High Load Delay (s)
Static 3.8 +/- 0.2 7.0 +/- 0.4 Base Monitoring Mobile 3.8 +/- 0.5 6.9 +/- 0.7 Static 13.1 +/- 0.8 24.1 +/- 0.8 Enhanced Monitoring Mobile 13.2 +/- 0.9 23.6 +/- 1.2 Static 29.7 +/- 1.6 58.4 +/- 2.0 Detailed Monitoring Mobile 28.7 +/- 2.2 57.5 +/- 2.5

82
Table 10, Traffic Monitoring Delay in Seconds, Large Network
Mobility Nom. Load Delay (s) High Load Delay (s) Static 4.6 +/- 0.3 7.8 +/- 0.3 Base Monitoring Mobile 4.3 +/- 0.3 7.2 +/- 0.6 Static 16.1 +/- 0.8 29.1 +/- 1.5 Enhanced Monitoring Mobile 15.6 +/- 0.9 28.2 +/- 2.2 Static 34.5 +/- 1.6 67.1 +/- 2.4 Detailed Monitoring Mobile 35.2 +/- 1.8 68.5 +/- 3.2
As can be seen, the effect of increased load is readily apparent in maritime networks, with
the TMS delay almost doubling from nominal to high background traffic. For both the
small and large network, the base mode delay during nominal load is approximately four
seconds, which for a non-critical informative service is most likely acceptable. However,
the enhanced and detailed modes have a much longer delay. This may be acceptable if the
information is not being used interactively, but is unlikely to be sufficient for interactive
trouble-shooting purposes. Note that delays are similar if slightly longer in the large
network. This is expected since the large network is in effect a mirror image of the small
network with traffic generated asynchronously in parallel.
In order to investigate the impact of adding a network-adaptable policy, the service was
configured to switch between detail modes to achieve a maximum delay while delivering
the most information possible. The following graph (Figure 15) shows the effect of
adaptability on the operation of the TMS. Note that for this experiment the TPS service
described in Section 5.3.3 was also active.

83
Figure 15, Adaptive Traffic Monitoring In a Small Network with Dynamic Load
In this simulation, the NOC is attempting to ensure that the TMS response time is at most
30s. This is done not by a change of policy, but by the NOC notifying the ships of the
current delay in its acknowledgement of receiving the data. TMS begins in detailed mode.
The policy is to reduce the mode to base if the response time at the NOC exceeds 60s and
to enhanced if it exceeds 30s. Similarly, from base or enhanced mode it will increase the
monitoring to enhanced or detailed mode (resp.) if the response time is less than 3s. In
Figure 15 the small network begins with no background traffic. At 20 minutes, high
background traffic is added. Nominal background traffic began at forty minutes. The
figure shows clearly the switch from detailed to base mode after a 98 second TMS delay
after 20 minutes and from base to enhanced mode after a 2 second TMS delay after 40
minutes. Different policies of when and what should cause the switch between detail
Detailed Monitoring Base Monitoring Enhanced Monitoring
Simulation Time (seconds)
Tra
ffic
Mon
itorin
g D
elay
(se
cond
s)

84
modes could also be used as defined by policy. This result shows that the causes and
results of such policy can be modeled in OPNET and evaluated.
5.4.3 Traffic Prioritisation Service
The traffic prioritisation service (TPS) described in Section 5.3.3 was enabled, and the
policy distribution and network monitoring experiments were rerun with delays reported
in Table 11, Table 12, Table 13, and Table 14.
Table 11, Policy Distribution Delay in Seconds, Small Network with TPS Mobility Nom. Load Delay (s) High Load Delay (s)
Static 1.3 +/- 0.1 1.5 +/- 0.1 Delay to ship 1 Mobile 1.2 +/- 0.1 1.3 +/- 0.1 Static 2.7 +/- 0.2 2.6 +/- 0.2 Delay to ship 2 Mobile 3.0 +/- 0.2 3.3 +/- 0.2 Static 2.5 +/- 0.2 2.7 +/- 0.2 Delay to ship 3 Mobile 2.8 +/- 0.2 3.3 +/- 0.2 Static 7.3 +/- 0.9 18.7 +/- 1.4 Delay to ship 4 Mobile 7.2 +/- 1.1 19.0 +/- 3.8 Static 13.8 +/- 0.9 25.6 +/- 1.5 Total Delay for
all ships Mobile 14.1 +/- 1.3 26.9 +/- 3.8
Table 11 shows that, at nominal load, policy distribution to most ships was around 2s
except ship 4 at about double this value (because it is two hops away). This agrees with
the policy distribution delay of the testbed previously reported in [6]. Because each ship
is contacted in series, the total time to distribute policy is about 14s. Under heavy
congestion, the policy distribution doubles to an average of about 26-27s. QoS has thus
improved the distribution delay by about 37% in the saturated case and 52% in the
overloaded case.

85
Table 12, Policy Distribution Delay in Seconds, Large Network with TPS Mobility Nom. Load Delay (s) High Load Delay (s)
Static 1.3 +/- 0.1 1.9 +/- 0.1 Delay to ship 1 Mobile 1.2 +/- 0.1 1.8 +/- 0.1 Static 2.7 +/- 0.2 4.0 +/- 0.2 Delay to ship 2 Mobile 2.9 +/- 0.2 4.0 +/- 0.1 Static 2.7 +/- 0.2 4.0 +/- 0.2 Delay to ship 3 Mobile 2.9 +/- 0.2 4.3 +/- 0.2 Static 7.1 +/- 1.0 13.6 +/- 1.6 Delay to ship 4 Mobile 6.9 +/- 1.1 12.9 +/- 2.6 Static 1.5 +/- 0.1 2.1 +/- 0.1 Delay to ship 5 Mobile 1.4 +/- 0.1 2.0 +/- 0.1 Static 1.2 +/- 0.1 1.8 +/- 0.1 Delay to ship 6 Mobile 1.2 +/- 0.1 1.7 +/- 0.1 Static 2.8 +/- 0.2 4.1 +/- 0.2 Delay to ship 7 Mobile 2.7 +/- 0.2 4.1 +/- 0.2 Static 6.6 +/- 1.0 14.8 +/- 1.7 Delay to ship 8 Mobile 6.5 +/- 1.2 15.6 +/- 2.3 Static 25.8 +/- 1.3 46.5 +/- 2.5 Total Delay for
all ships Mobile 24.5 +/- 2.1 46.4 +/- 3.6
Table 12 reports similar results with an improved total distribution delay by about 35% in
the nominal load case and 50% in the high load case. Note that with TPS the ships still
report delays within their 95% confidence interval with and without mobility.
Table 13, Traffic Monitoring Delay in Seconds, Small Network with TPS Mobility Nom. Load Delay (s) High Load Delay (s)
Static 2.6 +/- 0.3 5.0 +/- 0.4 Base monitoring Mobile 2.3 +/- 0.3 4.6 +/- 0.5 Static 10.8 +/- 0.8 19.6 +/- 1.2 Enhanced monitoring Mobile 10.4 +/- 1.3 15.0 +/- 1.4 Static 24.3 +/- 1.7 48.8 +/- 2.1 Detailed monitoring Mobile 22.2 +/- 2.1 47.5 +/- 2.5
Table 14, Traffic Monitoring Delay in Seconds, Large Network with TPS Mobility Nom. Load Delay (s) High Load Delay (s)
Static 3.2 +/- 0.3 5.7 +/- 0.5 Base monitoring Mobile 3.4 +/- 0.3 5.7 +/- 0.7 Static 12.2 +/- 0.8 20.0 +/- 1.1 Enhanced monitoring Mobile 12.3 +/- 1.1 20.3 +/- 2.3 Static 26.7 +/- 1.2 45.1 +/- 2.0 Detailed monitoring Mobile 26.8 +/- 2.0 45.2 +/- 3.2

86
A comparison of Table 9 and Table 10 with Table 13 and Table 14 respectively shows a
significant improvement of between 17-40% in the TMS delay with TPS enabled. This
confirms that DiffServ-style QoS can make a significant improvement to prioritized flows
in the Maritime environment. OPNET could be used to determine the impact of
alternative WFQ weightings and other QoS parameters.
In another test to gauge the effect of TPS on different types of traffic, the delay of a voice
call between ship 1 and ship 4 in the small network was measured with and without TPS
enabled. The default route for such traffic is to relay through ship 1. At nominal load, one
call was made with priority 4 and the delay measured was .67 +/- .12 seconds without
TPS and .13 +/- .01 with TPS. At high load, two identical calls were made; one at priority
2 and the other at priority 4. Without TPS, the end-to-end packet delay was the same for
both calls at 1.4 +/- 0.3 seconds. With TPS, the high-priority call had a delay of 0.7 +/-
0.2 seconds while the low-priority flow’s delay was 1.4 +/- 0.4 seconds. Since an
acceptable voice delay is approximately 500ms, TPS enables a single acceptable voice
call at nominal load, but at high load two voice calls are not possible even with TPS. Note
however that since background traffic from ship 4 to the NOC uses the default route via
ship 1, the other LOS links are almost unloaded.
In order to determine the effect of a policy change of the TPS on operational traffic, the
policy distribution service was assigned three different priorities at different times in the
large mobile network with high traffic. Up until 1200s, the traffic was assigned to its
usual default routing class (priority 3). At that point, a policy change was made to assign
the traffic to the background class (priority 1). Finally, at 2200s, the traffic a policy
change placed policy distribution in the reserved class (priority 5). The results of four
different simulation runs are shown in Figure 16.
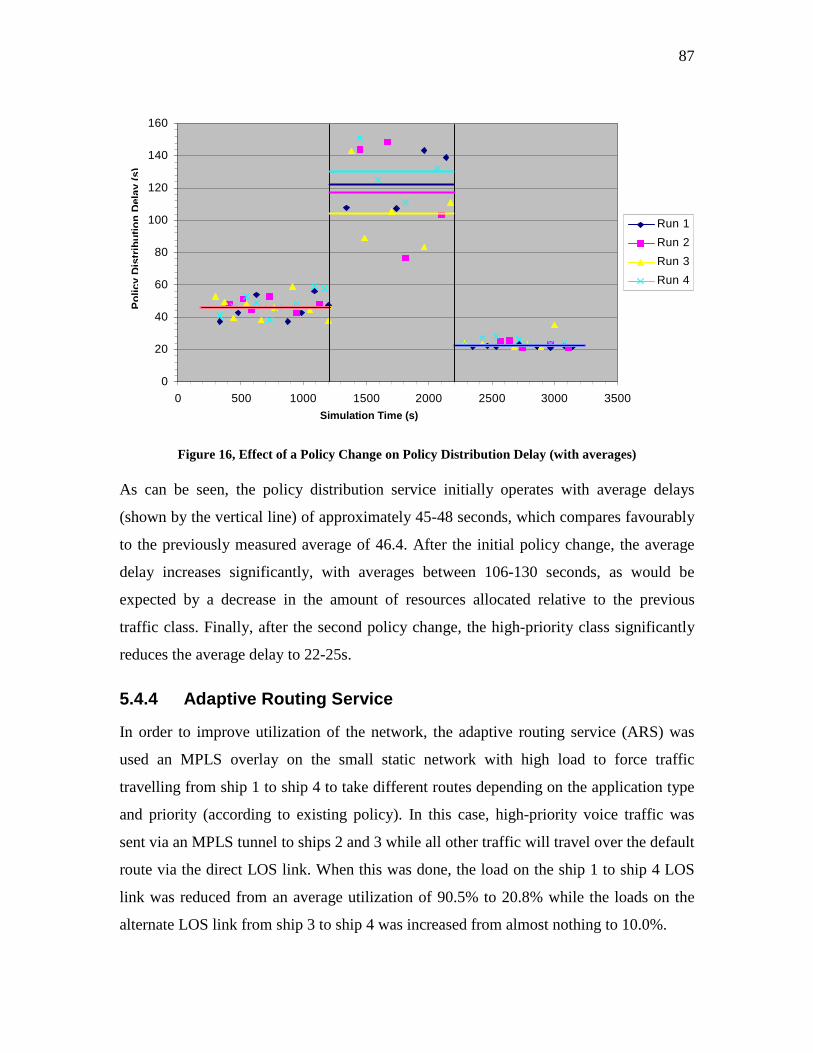
87
Figure 16, Effect of a Policy Change on Policy Distribution Delay (with averages)
As can be seen, the policy distribution service initially operates with average delays
(shown by the vertical line) of approximately 45-48 seconds, which compares favourably
to the previously measured average of 46.4. After the initial policy change, the average
delay increases significantly, with averages between 106-130 seconds, as would be
expected by a decrease in the amount of resources allocated relative to the previous
traffic class. Finally, after the second policy change, the high-priority class significantly
reduces the average delay to 22-25s.
5.4.4 Adaptive Routing Service
In order to improve utilization of the network, the adaptive routing service (ARS) was
used an MPLS overlay on the small static network with high load to force traffic
travelling from ship 1 to ship 4 to take different routes depending on the application type
and priority (according to existing policy). In this case, high-priority voice traffic was
sent via an MPLS tunnel to ships 2 and 3 while all other traffic will travel over the default
route via the direct LOS link. When this was done, the load on the ship 1 to ship 4 LOS
link was reduced from an average utilization of 90.5% to 20.8% while the loads on the
alternate LOS link from ship 3 to ship 4 was increased from almost nothing to 10.0%.
0
20
40
60
80
100
120
140
160
0 500 1000 1500 2000 2500 3000 3500
Run 1
Run 2
Run 3
Run 4
Simulation Time (s)
Pol
icy
Dis
tribu
tion
Del
ay (
s)

88
With the combination of TPS and ARS, the impact on the delay of voice packets is
significant. The high-priority voice call, which is taking the alternate lightly loaded route
via ship 3, has a delay of 0.19 +/- 0.03 seconds while the lower priority voice call which
uses the default route has a delay of 0.43 +/- 0.10 seconds. This arrangement, using a
combination of ARS and TPS, made the high priority flow of acceptable quality and the
low priority flow at least marginal. These results are summarized in Table 15 below.
Table 15, Effect of TPS and ARS on Voice Call Delay
Delay Delay with TPS Delay with TPS+ARS
Voice Call 1 (priority 4)
1.4 +/- 0.3 s 0.7 +/- 0.2 s 0.19 +/- 0.03 s
Voice Call 2 (priority 2)
1.4 +/- 0.3 s 1.4 +/- 0.4 s 0.43 +/- 0.10 s
These results imply that alternate routing can lead to more optimal use of link bandwidth
even beyond the expected additional capacity available through load balancing. By
ensuring a link does not become overloaded, additional retransmission traffic is avoided,
which can reduce the load throughout the network, not just on the overloaded link. More
evenly-loaded links can lead to better QoS for traffic, sometimes all traffic, and almost
certainly for critical traffic.
5.5 Summary
From our simulation results we determined several interesting characteristics of maritime
networks. In terms of the policy system, policy distribution is slow in networking terms
with delays of up to a minute and a half in the large overloaded network. However, with
the traffic prioritisation (TPS) this can be brought down to approximately 46 seconds on
average with even greater improvements if policy were distributed in parallel. For the
timescales involved in maritime networks, this is acceptable and provides a great
improvement over existing methods of network reconfiguration which can be labour
intensive and error prone.

89
In terms of network management, traffic monitoring can provide timely information on
network usage on average within 50 seconds with TPS even at the highest detail level.
The true advantage of TMS however is that it can adapt to existing network conditions to
provide at least some information with a policy-defined delay (such as a 30 seconds
maximum). Further investigation of the TMS would provide more details of where these
boundaries could best be drawn.
As mentioned above, the TPS makes a significant difference in application delay. For
both policy distribution and TMS an improvement in delay of approximately 17-52% was
achieved.
One important result from the simulations is that maritime mobility does impact traffic,
but only to a significant extent in the small network. In the large network the effect is
within the 95% confidence interval and thus not statistically significant. The additional
connectivity provided by inter-task group mobility provides the redundancy required to
avoid ships from becoming disconnected and also provides satellite-deficient ships with
alternate and potentially higher bandwidth paths to the application servers at the NOC.
Finally the alternative routing and load balancing provided by the ARS can greatly
improve the QoS achieved by critical traffic by sending it over under-used links. This can
also improve the QoS of all other traffic by spreading the load over multiple links.
These services provide several elements of traffic engineering appropriate to the maritime
environment. However, both the prioritisation and resource optimisation that they offer
are inherently class-based and cannot support per-flow end-to-end services since all
traffic within a class is treated similarly. In the maritime environment, critical
communications must be provided with some guaranteed level of service. For this reason,
a flow-based end-to-end PETE management service was developed, the resource
reservation service described in the next chapter.

90
6 The Resource Reservation Service
Using the TPS and ARS services described in the previous chapter allows traffic to be
treated preferentially based on class of application. This provides a soft (relative) quality
of service between types of application. However, within a class all traffic flows are
treated alike. In maritime networks the network operator may wish to provide more firm
guarantees for mission-critical traffic.
The Resource Reservation Service (RRS) uses distributed admission control to limit the
number of flows that can use a pool of bandwidth reserved on each link in the route
between source and destination. The goal of the RRS is to provide a guarantee of end-to-
end QoS for a particular application flow. This sort of protection is most commonly
useful for real-time applications (such as VOIP or video), but could also be used for
critical data transfers (such as a specific image transfer or chat session). RRS was
designed for the unique features of maritime environment and include features such as
multi-route probing, simultaneous bi-directional admission, priority and pre-emption, and
policy control. This section provides a formal description of the RRS based on [65].
6.1 Overview Resource reservations requests consist of a source S, destination D, resource requirements
Q and policy requirement P. The admission control algorithm that has been developed to
support the RRS uses this quadruple to determine if the network has sufficient resources
to meet the resource requirements. If the flow can be routed from S to D along route R
while meeting all requirements Q and P at each intermediate link, the algorithm will
admit the flow and make the appropriate resource reservations along R. If no route R is
found, the flow is rejected. Typical desirable attributes of such an algorithm include
efficient signalling, load balancing, secure access, and in the case of a maritime network,
fault tolerance.
The mechanisms developed to provide admission control are based on a reactive as
opposed to pro-active model that takes the view that while routing and QoS signalling
should be separate, they can work together. Pro-active models that maintain reservations,

91
ready for use in advance, would have a high overhead and are not suited for this
environment.
The main admission control algorithm is divided into four phases. Phase one of the
algorithm is described in Section 6.2. In order to support policy based routing, the
topology of the network is discovered using information already available on the access
router. The OSPF routing protocol provides information on what links are currently
available in the network which can be used to determine connectivity and link type. This
topology information is used to generate potential reservation routes dynamically. The
routing algorithms will ignore links that violate trunk utilization policies and/or do not
offer sufficient bandwidth. The algorithm then generates a number of routes for load
balancing and greater chance of call acceptance.
A proprietary robust signalling protocol designed for the maritime environment has been
developed. Admission Control decisions are performed at each hop along the selected
route(s). Resource request handling is done locally at each node in the route by the local
resource reservation service, a service within the policy system co-located with the WAN
router of the node. No admission or policy information is maintained at the router level.
A novel capability of this algorithm is that a reservation in the reverse direction
(destination to source) can be made at the same time as the forward direction (source to
destination). Bidirectional reservations can be especially useful when the application has
significant traffic in the reverse direction that needs protecting at the same time, such as
VOIP or ftp downloads. Making reservations in both directions at once reduces overhead
and latency while ensuring that the reservation is symmetric (it reserves at the same
nodes for use in both directions). This second phase of the protocol is outlined in Section
6.3.
The third phase of the protocol is provided in Section 6.4. Once one or more reservation
probes have reached the destination, the selection of the best route is done according to
the following criteria: number of flows that would be pre-empted by taking the route,
priority of flows pre-empted on the route, minimum bandwidth available on the route,

92
and the number of hops on the route. When the destination has decided upon a route, a
confirmation message is sent back along that route with each RRS updating the
configuration of the router so that the flow is treated in the reserved class. In order to
determine if a new request should be committed, the system keeps track of which
reservations are using which local links. Each link has a pool of bandwidth available for
reservation. Currently up to 50% of a link bandwidth may be reserved, but this value is
configurable by policy. It is important to mention, here, that this bandwidth is available
for other traffic if it is not being used by the reserved flows.
When a confirmation message reaches the source, the resource reservation enters its
active maintenance phase (phase four) as outlined in Section 6.5. A reservation
maintenance algorithm is used to keep the resource allocation active until the request
times out or is cancelled. The protocol supports priority, pre-emption, and fault-
management. Priority based pre-emption is supported by allowing users to assign priority
to service request. Lower priority calls will be pre-empted only if insufficient reserve-
able bandwidth is available. Fault management is achieved by reacting to topology
changes (e.g. link failures) by pre-empting reservations that use the failed link. All nodes
along the route are then notified.
The main algorithm is presented in flow diagram format in Figure 17 and in pseudo code
in Figure 18 below.

93
Figure 17, Distributed Admission Control Algorithm
yes no
no
Destin-ation?
Accept or reject as did the previous probe –probe the next node
Wait time T or for all reservations to arrive
yes Already Visited?
no
no
Evaluate request and generate route(s)
For each route send probe to first node
Note potential reserve-ation at current node – probe the next node
yes Accept-able?
no
yes
yes With pre-
empt?
no
yes Any
route?
Send route unavailable to destination.
Reserve/Pre-empt at nodes on “best” route
Send error to sender Inform Sender of best route and start traffic
PHASE 3
PHASE 2
PHASE 1
PHASE 4
Refreshed in time?
Release the reservation

94
Algorithm: AdmissionControl
Input: a graph G with link descriptors Li, source S, destination D, routing policies (including priority) P, and resource requirements RR (may be bidirectional).
Output: reserved route R (and alternate routes R’)
1. from RR and P determine priority number of resource routes K to establish 2. using one of the Path Generation algorithms (Section 4.2 generate the K
best policy acceptable routes (routeset) 3. probe the K routes from S to D in parallel determining if RR can be
satisfied on the links at that particular time. At each node N in route R element of routeset
4. if another probe by this reservation has made a partial reservation at this node on the same link proceed to the next node in route R
5. if the new flow can be accepted at N** make a partial reservation, note residual bandwidth†† in probe, and proceed to the next node in route R
6. if the new flow can be accepted at N but only by pre-empting existing lower priority reservation(s) make partial reservation, but record details of pre-emptable flows in probe, and proceed to the next node in route R
7. if the flow cannot be accepted, the probe should be marked unsuccessful and sent directly to D.
8. once K probes have arrived at D‡‡ or timeout has occurred at D: 9. if at least one successful probe has reached the destination, use the Route
Selection algorithm (Section 6.1) to decide which reverse path should be confirmed by a probe sent node by node in the reverse direction to S.
10. if only unsuccessful probes, send error to sender. 11. once S receives notification from D, return reserved route R. Optionally,
alternate successful routes R’ can be returned if noted at D. 12. send maintenance messages along reserved route R at policy-defined
interval so that each node that does not receive the probe in three times the interval will release the associated completed reservation.
Figure 18, AdmissionControl Algorithm Pseudo-Code
Note that the AdmissionControl algorithm uses a two-phase commit mechanism where a
route is first probed (phase 2) and then confirmed (phase 3). Another possibility
especially useful in unidirectional networks would be to assume reservations will be
successful and make the required changes to the router when the network is first probed. ** There is also a case here where there may be a partial reservation by a lower priority flow that must be
pre-empted. This could be included in this case, but more though should be put into the order in which it would be counted (for instance compared to an actual reservation on even lower priority…)
†† Residual bandwidth is recorded in % bandwidth available and will overwrite a higher remaining bandwidth in the probe.
‡‡ The number of probes sent for a reservation (K) is included in each probe so that the receiver will realise when all probes have arrived.

95
In this “single-phase commit” scheme reservations must have short time outs and
frequent refresh/maintenance probes to ensure good utilization. The drawback is the
increased overhead and router configuration activity when a reservation is not successful.
This mechanism is used by INSIGNIA [43] as described in Section 7.2.2.
6.2 Route Generation (Phase One) To support policy based routing, the topology of the network is discovered using
information already available on the access router. The OSPF routing protocol provides
information on what links are currently available in the network. This can be used to
determine connectivity and link type. The network topology is generated from this
information as described in Section 6.2.1.
Using this database, a route may be found from source to destination using standard
routing algorithms such as the Dijkstra algorithm [66]. Two modifications are proposed
here. First, before a route is generated all links that are not policy acceptable or do not
have sufficient raw bandwidth for the request are marked to be ignored. Thus links that
cannot handle the reservation will not be probed. Second, multiple routes are generated
and probed in parallel. Since the route with the most residual bandwidth is often chosen
from amongst the multiple routes probed the reservation load will be balanced amongst
the links in the network. The three routing algorithms used are described in Section 6.2.2.
6.2.1 Topology Discovery The network resource parameter that is currently reserved for service requests is the
residual bandwidth. When the link is dedicated and provides stable bandwidth (either on
or off at a certain rate) the residual bandwidth can be calculated by looking at the nominal
bandwidth of the link and subtracting the amount currently reserved. This is applicable in
the mobile maritime environment for most satellite links and BLOS HF links where the
media is not shared and can be characterised as either available at full capacity or not
available (binary). The reservation protocol assumes nodes are aware of the residual
bandwidth on all outgoing links.

96
LOS (UHF/VHF) links on the other hand are a shared media and as such residual
bandwidth cannot be reliably determined. Also, there are currently no standards for QoS
support in the MAC of these links. Attempts to introduce QoS in these environments
include probing (to determine available bandwidth), and cross-layer communication
(assuming the MAC layer is instrumented to report QoS information using a method such
as a proprietary SNMP MIB). These methods have achieved little success. For these
reasons, LOS is considered unsuitable for reservations and LOS links are currently not
included for route generation. Although LOS links are ignored when hard QoS is
considered, they may be used when soft QoS (preferential treatment) is enforced.
Topology information is extracted from the domain routing protocol OSPF. OSPF
regularly sends Link State Advertisements (LSAs) to distribute knowledge of the
domain’s connectivity information. Each router stores a complete set of the most recent
LSAs in a Link State Database (LSDB). This list is dynamic. As links fail or become
active new LSAs are distributed. From the standard OSPF LSDB, the topology discovery
module can obtain the following info:
• all links in the domain with their associated cost metric.
• node connectivity (which links go with which nodes)
By setting the OSPF link costs according to the type of link, the characteristics of the
links can be determined directly as shown in Table 16. This includes the nominal
bandwidth of the link, and some of the OSPF configuration parameters including the dead
time, hello time and retransmit time. This method has been used before in the military
context [10].
Table 16, Equating OSPF Cost to Link Type OSPF Cost Link type Bandwidth
(kbps) Dead time (s)
Hello (s) Retx (s)
750 Inmarsat 64.0 40 10 5 800 SHF satcom 128.0 40 10 5 1150 UHF LOS 64.0 40 10 5 1300 UHF satcom 32.0 120 30 10 1900 HF BLOS 9.6 120 30 10

97
In order to determine the bandwidth available for resource reservations on a link, the
following method is used. The available bandwidth on each link is first determined based
on the policy defined percentage of nominal bandwidth assigned for reservations. While
this class of traffic requires admission control, the remaining bandwidth is set aside for
the five WFQ classes used by TPS (see Section 4.2.2). The size of this reserved pool was
set to 50% of the nominal bandwidth in our simulations. Note that thanks to DiffServ, the
reserved pool of bandwidth is available for other traffic if not used by reserved traffic.
Using this information, each node creates a network topology “database” that includes the
following information:
• a list of all currently connected nodes and links in the network (populated from
the OSPF LSDB of the local router)
• the baseline bandwidth of each link (populated from the OSPF cost-metric vs.
bandwidth chart)
• the current pool size (a percentage) for the “reservable” class (defined by policy);
• the current amount of bandwidth reserved locally per link (populated by the local
policy system itself as flows are admitted, released, pre-empted, etc.)
This information is used for route generation and resource allocation as explained in the
following sections.
6.2.2 Route Generation
Three different route generation algorithms are proposed here as part of the admission
control service. The three algorithms can be summarised as;
1. Use the best route or none at all.
2. Repeatedly remove the best route from the graph and next try the best route
from the remaining graph (completely disjoint)
3. Iteratively remove one or more of the “poorest” links of the best route from the
graph and next try the best route from the remaining graph (partially disjoint)

98
The main advantage of probing multiple paths is to discover the “best” current reserved
path available. Hopefully several paths will be discovered and the receiver will have a
choice of selecting the path such that the reservation can be made with minimal impact on
the existing flows. Another advantage is that probing multiple paths promotes load
balancing. Where default routing forces all traffic over the “best” link, multiple routes are
considered hopefully identifying the least loaded links to be reserved. This allows the
load to be balanced both at individual nodes and throughout the network.
One of the potential advantages of probing (partially) disjoint routes is that alternate
acceptable routes could be maintained for later use. If one or more of the usually un-
reserved alternate acceptable paths were also reserved and maintained from the source
through the use of maintenance messages it would be possible to immediately redirect
reservations that have been impacted by pre-emption or link failures. Alternately only the
acceptable routes could be communicated with the source which upon failure could
attempt to reserve on another route before redirecting traffic. Such mechanisms are left
for future investigations.
Note that in the proposed admission control algorithm alternate routes are tried in parallel
and thus no feedback on overloaded links found in the process is given. A possible
alternative, not investigated here, is to try the routes in series removing offending links
one at a time as they appear in the attempt to make the reservation. This method was
rejected as adding greatly to the overhead and delay in reservation setup. On the other
hand it would eventually find an acceptable path (if one exists). Due to mobility no
optimal paths exist forever and this is the reason this method is not recommended.
6.2.2.1 Best-Path Routing Algorithm The routing algorithms take three main data points as input. They take the network graph
and link descriptions from the routing protocol (likely to be OSPF), the destination node
from the reservation, and the routing policies from the policy system. The Best-Path

99
algorithm (Figure 19) returns a single one policy acceptable route, which is likely to be
all that is needed for most reservations. This algorithm however does not allow for load
balancing and does not optimise the route path.
Algorithm: Best-Path
Input: a graph G with link descriptors Li, source S, destination D, and flow descriptor F with routing policies P
Output: a path from S to D that traverses only policy acceptable links in the least hops with greatest available bandwidth if such a path exists
5. remove from graph G all links Li that do not meet the resource requirements of F or policy requirements P
6. attempt to find a route R from S to D in G with least number of hops and using links with the highest bandwidth when there is a choice
7. if no such path exists, return an error otherwise return R.
Figure 19, Best-Path Algorithm Pseudo Code
Figure 20, Best-Path Example
For example in Figure 20 there is a single path chosen with the least number of hops for
source to destination. This path is the result returned.
6.2.2.2 Multiple-Disjoint-Path Routing Algorithm The Multiple-Disjoint-Path algorithm and the Multiple-Partially-Disjoint-Path algorithm
provide load balancing by probing multiple routes at once and choosing the optimal path
(most residual bandwidth). The main difference between the two is that the former
provides paths that are completely disjoint in that no links in one path are present in any
other path generated by the algorithm. The pseudo code is given in Figure 21 and
example in Figure 22.
Destination
Source
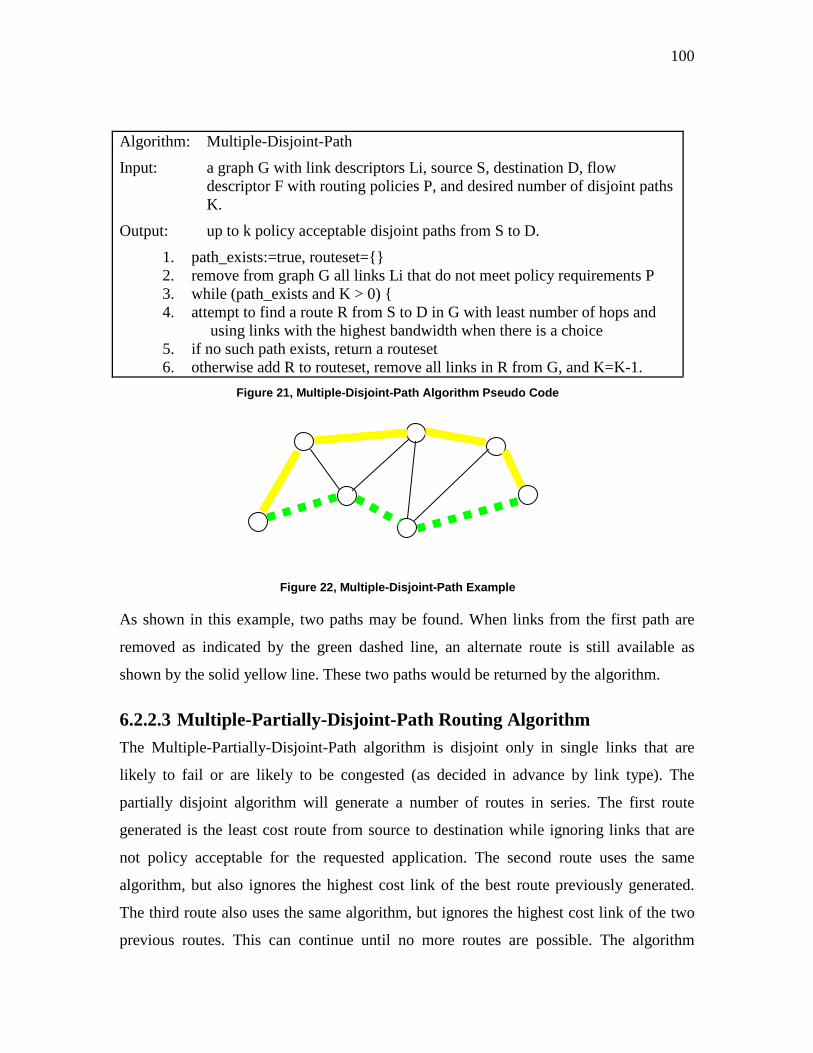
100
Algorithm: Multiple-Disjoint-Path
Input: a graph G with link descriptors Li, source S, destination D, flow descriptor F with routing policies P, and desired number of disjoint paths K.
Output: up to k policy acceptable disjoint paths from S to D.
1. path_exists:=true, routeset={} 2. remove from graph G all links Li that do not meet policy requirements P 3. while (path_exists and K > 0) { 4. attempt to find a route R from S to D in G with least number of hops and
using links with the highest bandwidth when there is a choice 5. if no such path exists, return a routeset 6. otherwise add R to routeset, remove all links in R from G, and K=K-1.
Figure 21, Multiple-Disjoint-Path Algorithm Pseudo Code
Figure 22, Multiple-Disjoint-Path Example
As shown in this example, two paths may be found. When links from the first path are
removed as indicated by the green dashed line, an alternate route is still available as
shown by the solid yellow line. These two paths would be returned by the algorithm.
6.2.2.3 Multiple-Partially-Disjoint-Path Routing Algorithm The Multiple-Partially-Disjoint-Path algorithm is disjoint only in single links that are
likely to fail or are likely to be congested (as decided in advance by link type). The
partially disjoint algorithm will generate a number of routes in series. The first route
generated is the least cost route from source to destination while ignoring links that are
not policy acceptable for the requested application. The second route uses the same
algorithm, but also ignores the highest cost link of the best route previously generated.
The third route also uses the same algorithm, but ignores the highest cost link of the two
previous routes. This can continue until no more routes are possible. The algorithm

101
pseudo code is presented in Figure 23. Examples of this algorithm are given in Figure 24,
and Figure 25.
Algorithm: Multiple-Partially-Disjoint-Path Input: a graph G with link descriptors Li, source S, destination D, flow
descriptor F with routing policies P, and desired number of different paths K with at least L different links.
Output: up to k policy acceptable partially disjoint paths from S to D. 1. path_exists:=true, routeset={} 2. remove from graph G all links Li that do not meet policy requirements P 3. while (path_exists and K > 0) { 4. attempt to find a route R from S to D in G with least number of hops and
using links with the highest bandwidth when there is a choice 5. if no such path exists, return routeset
otherwise add R to routeset, remove the L links with lowest bandwidth in R from G, and K=K-1. }
Figure 23, Multiple-Partially-Disjoint-Path Algorithm Pseudo Code
Figure 24, Multiple-Partially-Disjoint-Path Example with L=1
In the example above four different paths could be found. When the first path (green) has
the dashed link removed, the orange path may be found and so on. Thus up to four paths
may be returned by this instantiation of the algorithm where single links are removed.
Note that the exact link removed will depend on some metric not shown in the diagram
and many different possible combinations of paths are thus possible.

102
Figure 25, Multiple-Partially-Disjoint-Path Example with L=2
In Figure 25 two links are removed from each previously discovered path. The graph has
been displayed in the case where three routes are discovered, though again the exact links
removed will depend on information not shown here. Note that for both of the disjoint
algorithms a poor choice of the first or subsequent path and/or which links are removed
may mean that less disjoint routes are discovered that could potentially exist. More
complex algorithms for discovering such routes exist but these simple algorithms are
suggested for initial investigations. More complex algorithms may be investigated as
future work.
6.3 Admission Control Probing (Phase Two) The admission control protocol in this work is similar to RSVP [4] but modified for the
maritime environment. RSVP was found to be unsuitable for three reasons. First, RSVP
assumes unidirectional reservations where in the maritime environment most reservations
are bidirectional. Second, RSVP uses the default routing to attempt reservations and does
not probe multiple routes in parallel. In the low bandwidth maritime environment the
default route would be quickly overloaded and attempting alternate routes will increase
the call acceptance rate. Finally, although the RSVP standard has provisions for carrying
policy control information, most implementations do not support this capability§§. This is
required for communication with the RRS at each hop in the reservation to determine
whether the flow should be admitted or not (depending on both local policy and the
policy carried by the resource request). Instead a proprietary robust signalling protocol
designed for the maritime environment has been developed as described in Section 6.3.1.
Reservations in the proposed scheme may be unidirectional (reserved only from source to
destination) or bidirectional (reserved from the source to destination and destination to
the source at the same time). Since most applications usually send traffic in both an
upstream and downstream directions it makes sense for reservations be made in both
directions at the same time. This avoids the problem of different routing of traffic in
§§ It is the case for the RSVP implementation in Cisco routers.

103
opposite directions or that reservations can be made in only one direction due to limited
resources. Bidirectional reservations may be explicitly requested or handled transparently
by the reservation system based on the traffic type. Bidirectional admission control is
described in Section 6.3.2.
6.3.1 Route Probing Admission Control decisions are performed at each hop along the selected route(s).
Probes travel on their assigned route from the source to destination one node at a time.
The network resources along a path are evaluated at each node along the route. Currently
the only resource that is considered is bandwidth. Each link has a pool of bandwidth
available for reservation. A policy configurable percentage of the total bandwidth
(currently set at 50%) of a link may be reserved. If sufficient resources exist to meet the
reservation request stored in the probe for the desired link at the current node, the residual
bandwidth of the link is noted in the probe and forwarded to the next node.
If insufficient resources are found at a node, the current reservations are examined to see
if pre-emption of lower priority flows would free enough resources to meet the needs of
the current request. If sufficient resources are still not available, a failure message is sent
to the destination (the destination makes the final decision of which route to reserve). If
sufficient resources would be made available, the request is forwarded to the next node in
the route including information on the flows that would be pre-empted if this route were
used. The pre-emption algorithm is given in Section 6.4.3.
It is important to realise that no change is made to active reservations or the router during
route probing. The purpose of route probing is simply to determine if a reservation is
possible along any of the generated routes. This may lead to the case where reservations
are tentatively admitted but the resources are not available when the commit packet
returns because another reservation has committed first. We argue that these false
admissions, as they are called in [44], are preferable to the alternative of reserving during
the initial probing. It is more likely that bandwidth reserved during probing will be
wasted because downstream nodes are not able to handle the request rather than routes
that have been probed to have another reservation probe and then admitted on the same

104
link before the original request has a chance to return and commit its bandwidth. If
multiple probes for the same reservation for the same link arrive at a node the same
accept/reject actions are taken as before. This may happen when the multiple partially
disjoint routing algorithm is used.
A copy of every resource request is stored at each node in the hope that a confirmation
will eventually arrive. At that point low-level (configuration) policy will be generated. If
the confirmation has not arrived in a preset amount of time*** the “pending resource
request” record is purged.
Finally, this method assumes nodes are contacted in series. This has the advantage of
limiting protocol overhead to approximately (P+1)*R inter-node messages per route
where P is the number of probes and R is the average number of intermediate nodes
between the source and the destination where reservations must be made. Since no nodes
are contacted beyond a choke point where a link did not have the required bandwidth, this
method may have an even lower overhead. Another advantage is that each hop can ensure
that the next router is connected as expected by the route in the service request. If it is not
connected or the resources required are not available the protocol will abort and send a
deny message to the destination indicating failure of this route. A probe taking some
other route will hopefully succeed. Alternate methods where nodes are contacted in
parallel with O(PR2) messages have not been investigated
6.3.2 Bidirectional Reservations Depending on the application type, it may be desirable to reserve resources in both
directions at the same time. Reservation may be needed in both directions (source to
destination as well as destination to source) when application traffic involves closely
coupled interaction between the two participants, such as for VOIP (interactive voice),
VTC (interactive video) and chat (interactive text) applications.
*** This policy defined value was set to 60 seconds in our simulations.

105
In such cases, it is important that the reverse reservation be handled transparently by the
reservation system (this can be done based on the traffic type). An inefficient way to do
this would be to perform two consecutive reservations, one from each direction. This
two-step process is simple but not attractive since it generates twice the signalling
overhead and results in a long time to establish the reservation. Also, the route taken by
the forward direction may not be reservable in the reverse direction at the same time,
forcing reservations to be asymmetrical. Asymmetrical routing can cause problems by
having different delay, jitter and other QoS parameters in each direction.
Assuming the bi-directionality of the links (already currently assumed by the OSPF
protocol), a more efficient way to address the issue is to perform the reverse reservation
at the same time as the forward reservation. In other words, as the service request
progresses from the source to the destination, each intermediate node will proceed with
the admission control decision algorithm in both directions at the same time. It should be
noted here that if more than one link exist between two nodes, when performing the
admission control for the reverse reservation, an intermediate node may choose a link that
differs from the link chosen in the forward direction. The reverse link selection will
choose the best link (i.e. link with the least number of pre-emptions or greater residual
bandwidth) before the probe is sent to the next node. Each intermediate node will update
the probe with information on the reverse link i.e. the number of pre-empted flows will be
the sum of the two directions while the residual bandwidth will be the least of the two
directions. An example of how bidirectional reservations work is given in Appendix B.
An enhancement to bidirectional flows is the ability to specify different resource
requirements in each direction. For instance, if a video were to be downloaded from a
central server it would be useful to reserve a large amount of bandwidth in the reverse
direction (from the server) and only a small amount in the forward direction (to the
server).
6.4 Route Selection and Enforcement (Phase Three) The final decision of which of the successful probe’s routes to commit is up to the
destination. The route selection algorithm waits until all reservation probes from the

106
sender have been received or a time out has occurred indicating the remaining probes
should be considered lost. The selection of the best route is done according to the
following criteria: number of flows interrupted (lower total number preferred), priority of
flows interrupted (lower maximum priority preferred), residual bandwidth available
(minimum of remaining bandwidth after reservation would be made at each hop with a
higher total value preferred for data-base applications), and number of hops in the route
(lower value preferred for real-time applications). The detailed algorithm for determining
which route to choose is further explained in the Section 6.4.1.
When the destination has decided upon a route, a confirmation message is sent back
along that route with each RRS updating the configuration of the router so that the flow is
treated in the reserved class. In order to determine if a new request should be committed,
the system again examines the other reservations that are using the local links. If enough
unallocated resources remain in the pool, the resource allocation is enforced on the router.
If insufficient resources are available, pre-emption is attempted as in phase two and if
successful the reservation is enforced. Otherwise a failure message is sent to the source
and no changes are made at the router. Resource allocation is described in Section 6.4.2.
The pre-emption algorithm is thus considered at two different points during admission
control. First, when a service request first reaches a node, and second when a reservation
confirmation arrives. Only in the case of the reservation confirmation are reservations
actually pre-empted. For requests, the list of reservations that would currently have to be
pre-empted to admit the flow are added to the probe to aid the destination in deciding on
the best route to be confirmed. For confirmations, if the link does not have sufficient
“reservable” resources to meet the request the only alternative to rejecting the reservation
is to pre-empt lower priority flows. This is only done if such pre-emptions would free
sufficient resources, otherwise the request is rejected. The pre-emption algorithm used in
both cases is presented in Section 6.4.3.
6.4.1 Route Selection Algorithm If no successful probes reach the destination, a reservation failure message is sent to the
source so the user can be notified. If only one route is successful, that route is used by the

107
reservation and must be confirmed in the resource allocation and enforcement phase.
When multiple successful probes reach the destination, a single route must be chosen.
Several factors may influence the choice of route. The following factors are taken into
account: the number of flows that would be pre-empted along with their priority, the
minimal residual bandwidth, and the distance (hop count). The route selection algorithm
that has been developed is as shown in Figure 26 and is depicted graphically in Figure 27.
Algorithm: Route-Select Input: the acceptable routes, minimum residual bandwidth of each route and
pre-empted reservations associated with each routing (including bandwidth and priority of each reservation)
Output: the selected route 1. Pick the route with no pre-emptions, If more than one select the flow with
the 2. Least number of pre-empted flows. If equal then select the flow with the 3. Lowest maximum priority flow pre-empted. If there is a tie, look at the
application type; 4. For UDP-based applications, use least number of hops. If there is a tie, use
the greatest amount of residual bandwidth; 5. For TCP-based applications, use the greatest amount of residual bandwidth.
If there is a tie, use the least number of hops; 6. Use the Probe that was first to arrive if a tie still exists
Figure 26, Route-Select Algorithm Pseudo Code
Figure 27, Route Selection Algorithm
The rational behind this algorithm is that real-time applications are more delay sensitive
than they are bandwidth sensitive. Placing them on routes that are close to saturation may
be advisable if the delay is reduced. Since delay is most often a factor of hop-count, the
lower hop count is favoured for these applications. On the other hand, applications with
heavy bandwidth requirements are usually TCP-based. Since such applications are more

108
concerned with total data transmitted, a longer delay may be tolerated and thus routes
with greater residual bandwidth are preferred.
Once a route is selected, a confirmation message is sent in the reverse direction along the
route. At each node resource allocation and enforcement is done as described below.
6.4.2 Resource Allocation and Enforcement When a confirmation message arrives at a node, the local policy system checks the
available resources on the link(s) where the reservation is to take place. If enough
unallocated resources remain in the reservable pool, the resource allocation is enforced on
the router. If insufficient resources are available, pre-emption (see the following section)
is attempted and, if successful, the reservation is enforced. Otherwise a failure message is
sent to the source and no changes are made at the router. Once the resource reservation is
successfully enforced at the source, the route of subsequent packets must be enforced.
When a confirm message reaches the source, an MPLS tunnel is created from the source
to the destination using the explicit route option. Each local policy system on the route
will treat this tunnel using the RRS class (assigned to the reserved bandwidth pool).
6.4.3 Pre-emption Algorithm The pre-emption scheme that was implemented is based on strict priority where lower
priority flows may always be interrupted by higher priority flows. A list of flows that
would have to be pre-empted to make room for the new reservation (if possible) is
provided as output. For a resource request, it confirms whether a reservation would be
able to reserve sufficient bandwidth were the reservation to be committed immediately.
No committed reservations are affected at this point, the sole purpose being to fail a
service request if insufficient resources can be found. On the other hand when the pre-
emption algorithm is used for a resource commit the service will tear down the less
important reservations to free up the bandwidth and commit the new reservation. The
algorithm pseudo code is presented in Figure 28.

109
Algorithm: Preempt
Input: the current residual bandwidth of the link, the bandwidth required for the new reservation and the list of lower priority reservations already using that link.
Output: a list of flows to be pre-empted (empty if fail)
1. The largest (in terms of reserved bandwidth), lowest priority flow is pre-empted first.
2. If insufficient bandwidth has been released, the next largest flow at the same priority is pre-empted.
3. If the current priority level has no more reservations, the next lowest priority level is similarly emptied one reservation at a time from largest to smallest
4. Once sufficient bandwidth has been made available (residual + pre-empted bandwidth >= requested bandwidth), no more pre-emptions are made.
5. If insufficient bandwidth has been released with all lower priority flows pre-empted, return an empty set to signal pre-emption failure.
Figure 28, Pre-emption Algorithm Pseudo Code
A possible improvement to this algorithm would be at line 4. When it is found that the
current reservation being considered at line 1 or 3 for pre-emption would free more than
enough bandwidth for the new reservation, look for the smallest reservation at the same
priority level that would satisfy the bandwidth requirement and pre-empt it instead. This
improvement would slightly lessen the prejudice of the pre-emption algorithm against
large reservations while maintaining the same total number of flows pre-empted. An
idealised backpack style optimisation of this part of the algorithm is left as future work.
Second, a possible improvement to the main admission control algorithm would be to
attempt to use potential pre-emptions during phase two to proactively reroute low priority
reservations. Again looking at the characteristics of the environment, there are likely to
be critical links that are likely to become overburdened. If a high priority reservation is
exploring such a link and must pre-empt the lowest flow, the low priority flow could
make an immediate “route update” attempt that ignores its existing reservation on the
contested link. With the higher priority reservation blocking that link it will (hopefully)
find an alternative routing before the high priority reservation forces it to remove itself.
The route update mechanism is presented in the following section.

110
6.5 Reservation Maintenance (Phase Four) When a confirmation message reaches the source, the resource reservation enters its
active maintenance phase. A reservation maintenance algorithm is used to keep the
resource allocation active until the request times out or is cancelled. Requests can be
terminated by a number of events including termination by the user, end of the reserved
period, pre-emption by a higher priority flow, or failure of a link on the reserved route.
During the maintenance phase, keep-alive messages are sent along the reserved path at a
policy-defined interval. Each RRS on the path must receive one of these messages within
another policy-defined interval or the reservation is considered to have terminated. This
“natural” termination causes the RRS to simply remove the reservation from its list
freeing the associated bandwidth and reversing any router configuration that has been
made. The reservation maintenance algorithm is given in Section 6.5.1.
It may happen that existing reservations are interrupted and do not terminate naturally
from user intervention or expiry of the request. This may be due to pre-emption by the
confirmation of a higher priority request (as outlined in Section 6.5.2) or by failure of a
link on the reserved path (as outlined in Section 6.5.3).
The protocol has been made reliable through the inclusion hop-by-hop acknowledgments
with timed retransmissions. The following messages are acknowledged: the fail message,
the service request, the service commit and the release messages. This is required since
links are wireless and error-prone. These mechanisms are discussed in more detail in
Section 6.5.4.
6.5.1 Route Maintenance and Termination The Maintenance algorithm maintains the resource reservations over time. It is geared to
refresh the confirmed reservations until they reach a set expiry time. At a policy-defined
time interval, refresh messages are sent by the source node of an active reservation along
the route selected by the AdmissionControl algorithm. Each node in the path resets the
maintenance timeout counter when it receives an appropriate refresh message. If the
maintenance timer were to expire (it is set to a policy-defined multiple N of the

111
maintenance refresh interval in order to allow for temporary failure of the link) the
reservation is released. The algorithm is given in Figure 29.
Algorithm: Maintenance
Input: list of reservations, and reservation id from the maintenance probe.
Output: a maintenance message, a release message, or nothing.
1. locate the local reference for the reservation identified in the maintenance probe
2. If the reservation is found, restart its associate maintenance timer and forward the probe to the next node on the reservation’s route, or if this is the hop before the destination it can be discarded.
3. If the reservation is not found send a release message is sent to the source identified in the maintenance message. All nodes on the path will release the associated reservation. If the reservation is bidirectional, the release message is also sent down the path to the destination.
Figure 29, Maintenance Algorithm Pseudo Code
If a node no longer has an associated reservation, a release message is sent along the path
to the source (and destination in the case of bidirectional reservations). All nodes along
the path will release the associated reservation. This may occur when a reservation was
previously released due to pre-emption by a higher priority reservation or a link failure.
When the reservation is released and the message does not reach the source this will leave
many nodes with the incorrect assumption that the reservation is still active. Reservation
maintenance thus provides an additional mechanism to clean up orphaned reservations
where the resources are no longer available end-to-end.
In a maritime network the maintenance of existing reservations could be seen as an
inherently impossible task. Since link outages and bandwidth fluctuations are to be
expected, guarantees cannot be rigidly interpreted and a more statistical model must be
used. The approach taken here is twofold. First to periodically update reservations (which
will otherwise release the resources they are holding for a particular flow) and second to
actively repair routes which may have been invalidated by a change in routing (currently
unimplemented). In the simplest case a probe is sent from source to destination along the
agreed upon path refreshing timers at each node.
112
With slow mobility the period between maintenance updates can be relatively long (tens
of seconds or minutes) but an appropriate value should be determined empirically and set
by policy. It is likely that the tempo of the operation will change the rate at which links
will fail and reform and thus influence the appropriate maintenance period.
In a more general sense appropriate values for all timeouts in the system will need to be
investigated. This would include the time to hold a partial reservation, the time to hold a
locally confirmed reservation, the time at a receiver to wait for other routes that are being
probed in parallel, and the time for the sender to wait before giving up on a reservation
response from the networks before re-trying or giving up. There are also timers for the
acknowledgement for the reliable messages. The timeout values are be critical in
establishing viable load balancing. The current values being used are given in Appendix
A.
An alternative to the use of keep-alive messages for determining when a reservation has
terminated is the use of explicit signalling. In this case when a reservation completes a
message is sent from the source down the reserved route releasing the reservation at each
node until it reaches the destination. This method would reduce the number of control
messages but increase the chance of orphaned reservations (that have terminated but
block resources at some node(s) on the route.) This method has not been investigated.
Note that both mechanisms could be used. That would allow the refresh timeout to be set
for a relatively long period of time.
6.5.2 On Pre-emption When a reservation has been pre-empted during the commit phase of the main algorithm
(phase three), a release message is sent to the source of the reservation. The source will
release the reservation by refraining from sending further keep alive messages. All
remaining nodes on the pre-empted reservation’s path will eventually release their
associated bandwidth when they do not receive a keep-alive message.

113
The current implementation of this final phase has release messages sent in series to both
source and destination following the reserved route releasing the reservation as it is sent.
This takes more bandwidth but increases call acceptance for the period of time it takes for
reservations to time out since the reserved bandwidth would be made available earlier.
Both of these alternatives to pre-emption termination are being investigated.
Currently when a flow is pre-empted, notifications are sent to all nodes on the route. This
is accomplished by sending a release message in each direction: one towards the sender
and one towards the destination. All nodes which receive the message release the
corresponding reservation.
This method is robust to failure since even if the release message is lost, a refresh
message from the sender will find no matching reservation on the local node which will
send a release message back to the sender. This will cause no more refresh messages to
be sent to the other nodes on the route and they will eventually time out and release the
reservation.
The treatment of pre-empted flows is similar to the case of link failures. The difference is
that in the case of a link failure, the event is given time to possibly fix itself whereas in
the case of pre-emption, the event must be treated immediately (irreversible).
If not treated appropriately, pre-emptions may lead to inefficient resource utilization.
Therefore another signalling message, the “Reservation Release” message has been added
in the protocol.
Depending on the situation, the issuing of the message will be handled as follows:
• The reservation refresh messages need to be frequent enough (typically every 5-
10s). The nodes would timeout after X*Refresh period.
• If a node times out after missing X number of refresh messages, the node simply
releases the resources locally (deletes the reservation). If later, the node receives
a Refresh message for a non-existing reservation, the node issues a “Reservation

114
Release” (or Tear Down) message up the path (i.e. each node relays towards the
source) and if the reservation was bidirectional, it also issues it down the path (i.e.
each node relays towards the destination).
• If a (committed or partially committed) reservation is pre-empted (because of the
commit of another reservation), the node issues a Reservation Release message
down the path as well as up the path (each node relays the message in the
appropriate direction until it reaches the ends, both source and destination).
• If a node receives a Commit message and its’ processing fails i.e. the associated
reservation does not exists anymore (pre-empted or timed out) or it cannot be
admitted anymore (resources have changed while waiting for the commit to come
back), the node drops the commit and issues a Reservation Release message down
the path as well as up the path (each node relay the message in the appropriate
direction until it reaches the ends, both source and destination).
6.5.3 On Link Failure A failure may occur to a link with active reservations. When a fault/restoration of a link
modifies available resources, the topology monitor/event service (parts of the policy
system) will notify the RRS of the changes. When a link is flagged as no longer in the
topology, the RRS will recalculate whether admitted flows can still receive the QoS
asked for. All reservations that are currently using a failed link will be released after a
preset amount of time as if they had been pre-empted (see above). At this time no
automatic healing of failed reservations is attempted.
Detection of link failure is done via the topology monitor. The topology monitor polls
the router for the OSPF LSA information every “x” seconds (see Appendix A for current
protocol parameters.) As outlined in [1], the policy system at each node updates the
network graph out of the retrieved information.
Although all nodes in the network are eventually notified of link failures via the flooding
of the OSPF LSAs, it was decided that only nodes that are adjacent to the failure take
action. When a local link failure is detected, the node starts a timer to give a chance to the

115
link to come back (avoid flapping links). If the link comes back before timer expiry, the
node takes no further action. However, upon timer expiry, the node verifies which local
reservations are affected by the failure. It removes the affected reservations as well as the
associated router configuration (if applicable i.e. if the reservation had started) and issues
a “Reservation Release” signalling message up the path (i.e. each node relays towards the
source) and if the reservation was bidirectional, it also issues it down the path (i.e. each
node relays towards the destination).
The obvious alternative is that when a link failure is detected by a source node that has a
reservation through the failed link it acts just as outlined above for nodes on either side of
the link. It will wait for x seconds and then immediately remove its local reservation. All
other nodes on the path can do the same since they carry the full route of each
reservation.
There is another alternative to dealing with link failure that has not been investigated and
that is local healing. In this case the nodes at either end of the link failure attempt to route
around the failure by creating a new reservation between them. However, local healing
doesn’t make much sense in the maritime environment where there are a limited number
of bearers at each node (sparse connectivity) and the bandwidth for signalling is at a
premium.
6.5.4 Fault-Tolerance: Timeouts and Acknowledgement s Included in the admission control algorithms are a number of timeout mechanisms to
ensure that resources that are no longer required are released for use by future
reservations.
First, partial reservations are given a relatively short timeout period. Since these
reservations are only placeholders and do not provide utility for resources held it is
important that they timeout as soon as possible but not before a reservation would be
confirmed. A possible initial value, that needs to be verified, is twice the transit time of
the width of the network plus the worst case decision time on all nodes to the receiver and

116
reservation time on the return path. This is likely to be in the order of single digit seconds
(due to satellite delay).
Confirmed reservations may also time out. This may happen because the maintenance
algorithm has found a better route and this particular node is no longer needed, or the
reservation window or application may have finished. There is a trade-off here in network
load vs. over-reservation of the link. Since reservations can still be pre-empted by higher
priority flows it is proposed that the balance on reduced link load be followed and thus
timeouts be longer. Contributing factors will also be the level of mobility, the average
length of reservations and average available bandwidth. Initial values are included in
Appendix A.
There are currently acknowledgement messages for service request, commit, and release
messages. They have been added to deal with the inherently unreliable nature of the
wireless medium. Other types of messages have been left un-acknowledged since the
timeout mechanism described above will have the desired effect in these cases.
6.6 Summary The RRS provides several novel features to improve resource reservations in the
maritime environment. This includes probing multiple routes in parallel to increase the
probability of acceptance and to distribute the load, a priority and pre-emption scheme to
identify the most critical flows, the support of bi-directional reservations, fault tolerance
mechanisms and dynamic reconfiguration of its operational parameters to meet changes
in operational policy.
Considering the management requirements of the maritime environment, the RRS
provides a number of advantages including:
• Since the RRS makes use of topology information available at every edge router
to determine link types and connectivity, no additional overhead is required to
generate routes from source to destination, increasing its efficiency. (phase 1)

117
• Policy control (via ARS) ensures that only appropriate routes are generated that
traverse links with sufficient raw bandwidth and have delay and error
characteristics acceptable for the traffic type, improving efficiency. (phase 1)
• These routes are probed in parallel to increase the chance that an acceptable route
will be found. (phase 2)
• The ability to make reservations for traffic in both directions at the same time is
an advantage in efficiency both to ensure bandwidth is simultaneously available
and reduce the time and overhead compared to sequential reservations. (phase 2)
• When multiple acceptable routes are found, the route reserved is chosen to have
the least impact on existing traffic, causing reservations to be load balanced across
the network to optimise resource utilisation. (phase 3)
• A priority and pre-emption scheme prioritises the most critical flows ensuring that
they get preferential access to the resource being reserved. (phase 3)
• The use of acknowledgements, timers, and a retransmission scheme are used to
mitigate the dynamic and error prone environment and provide robustness.
(phases 2-4)
In order to evaluate this protocol, we performed a second set of simulations to measure its
success at reserving resources per request, known as the acceptance rate, and also the rate
at which reservations that obtain their resources keep them until termination, known as
the success rate. Based on these metrics, RRS was compared with two similar protocols,
RSVP which is the standard protocol currently used in fixed networks, and INSIGNIA, a
well documented protocol designed for MANETs. The results of these simulations are
described in the following chapter.

118
7 Simulation Results – Part Two This chapter presents the simulation results for the Resource Reservation Service (RRS)
proposed in the preceding chapter. The simulations are described here along the same
lines as the other management services described previously in Chapter 5. However, the
RRS is also a more complex service and thus a more in-depth investigation is performed.
This involves comparing the RRS, which was designed for the maritime environment,
with two other resource reservation protocols, RSVP and INSIGNIA. RSVP is a well-
known standard and widely used unicast and multicast reservation protocol used in fixed
networks and thus a good benchmark for RRS. INSIGNIA is one of many reservation
protocols proposed for MANETs. It was chosen for comparison since its single phase
commit strategy makes it well suited for dealing with network mobility and it is well
described in both the literature [43] and an expired IETF internet draft [67].
This chapter begins with a description of the simulation setup and OPNET models used
to simulate RRS. The RSVP and INSIGNIA models used to evaluate its operation are
then described. The results of the simulation exercises form the bulk of this chapter which
then ends with a discussion of the results and their support of the thesis as a whole.
7.1 Simulation Setup
The simulation setup used for the RRS simulation is the same as used previously for the
other management services, including the network topology (Section 5.2.1) and the
mobility model (Section 5.2.2). Differences in background traffic were not investigated.
Nominal background traffic is assumed in all measurements.
In order to asses the operation of the RRS, two addition variables were investigated. First,
the impact of the source of requests was investigated with two different models. Second,
in order to determine the effect of network loading, two network reservation request
arrival rates were chosen based on maritime deployments. Because of the differences of
operation between RRS, RSVP, and INSIGNIA, additional protocol configuration notes
have been included in this section. These differences are detailed and the relevant
protocol parameters are enumerated.

119
7.1.1 Request Source Model
The source of reservations arriving in the network was varied to investigate the impact of
the multi-routing aspect of the RRS. Reservations may either originate uniformly from all
nodes in the network (uniform model), or originate only from a single node (single source
model). In the uniform model, the request generation process was activated on all nodes,
while in the single source model the request generation process was activated only on a
single node chosen randomly at the beginning of each simulation run.
7.1.2 Request Load Model
Considering the effect of different request source models, four reservation inter-arrival
rates were used to simulate reservation saturation (nominal loading) and reservation
overload (high loading). The inter-arrival time for reservations using the uniform model
were exponentially distributed and centered on 60 seconds for nominal request load and
30 seconds for high load. These rates were chosen to saturate and overload the network
with reservations respectively. For the single source model, the inter-arrival time was set
to 30 seconds for nominal load and 15 seconds for high load for the same reasons. Note
that since the request loads are not the same for uniform and single source request
models, the results of these two source models should not be directly compared.
7.1.3 Protocol Configuration Notes
There are significant differences in the operation of the three reservation protocols
simulated. The largest difference is that RRS includes two main features not included in
the others; multi-routing and pre-emption. In RRS, each reservation was made with up to
3 parallel probes to exercise the partially disjoint multi-routing aspect of the protocol.
The priority mechanism of the service was also exercised by assigning each new
reservation one of three priority levels (low, medium, and high) with equal probability.
Requests of lower priority may be pre-empted (dropped) in order to admit a higher-
priority flow. High-priority flows are not pre-empted, and may only be blocked from
being accepted by other high priority flows. Pre-empted flows are called admitted (they
were initially accepted), but unsuccessful (they terminated before their scheduled end

120
time). If a request is not initially admitted, it is also unsuccessful and no additional
attempts are made to establish a reservation.
The standard RSVP protocol was used, which is very similar to RRS without multi-
routing or prioritisation. For this reason all admitted flows are successful unless dropped
due to a link failure.
INSIGNIA is quite different from RRS and RSVP as it uses a single-phase commit. As
long as previous nodes have been able to secure or hold resources for a reservation,
further nodes on the path of the INSIGNIA probe will also attempt to secure resources
regardless of whether an end-to-end reservation path is ultimately available. This leads to
orphaned reservations which hold resources but do not have resources end-to-end. Instead
of attempting to make reservations once, INSIGNIA continuously probes the route to
maintain existing resource reservations, but also attempts to gain resources on links
where it was previously unsuccessful. A reservation may later lose end-to-end resources
through link failures, termed a reservation downgrade. On the other hand, end-to-end
resources may be made available when a link becomes available, or a reservation
terminates, termed a reservation upgrade. Reservations which have been upgraded or
downgraded are called partially successful, though by the strict definition used for RRS
and RSVP they would be termed unsuccessful.
For all protocols, the total time a reservation remained active was based on an
exponential distribution with mean 270 seconds. All reservations were for 8 kbps, with a
maximum of 50% of each link’s bandwidth available to be reserved.
7.2 Models of the Reservation Protocols
Additional models were developed to simulate RRS, RSVP and INSIGNIA. Each of
these reservations protocols was implemented as a separate process model.

121
7.2.1 RRS Model
In order to implement RRS as described in Chapter 6, a number of models had to be
modified and a few new ones created. The general approach was to use the existing IP
networking models and simply add RRS packet processing capability on top, so RRS
messages could be processed and forwarded as required.
First, a significant change was required to the OSPF model in the ship’s routers. In order
to capture changes in network topology and determine the type and nominal bandwidth of
the link from the OSPF cost, a software tap was added to the existing OPNET model.
This tap forwarded all link state database (LSDB) changes to the local RRS model, which
maintained its own internal representation of the network connectivity.
The network node included two additions for simulating RRS. The first was a simple
process for generating reservations that submitted new request interrupts at a configurable
rate to the RRS process. The second was the RRS process itself, which included all the
logic described in the RRS section for forwarding packets and reserving resources. The
complete process model is shown in Figure 30.

122
Figure 30, The RRS process model
The RRS process model includes 14 states, five of which are for handling internal timers,
six are for handling RRS messages, and the remaining three are for model initialisation,
handling new request interrupts, and for handling OSPF graph updates. Appendices A
and B provide more detail on packet configurations and packet handling.
7.2.2 RSVP Model
The RSVP model was derived from [37] by deactivating certain features in the RRS
model. The main differences from a functional standpoint is the lack of multi-routing
(only the default route is probed), and of pre-emption (no prioritisation method is
included in RSVP). There are also no fault tolerant (retransmission) features.

123
7.2.3 INSIGNIA Model
The INSIGNIA model was also derived from the RRS model, though in this case
significant changes were required. The request generation and OSPF update handling
functions were retained, but new packet and timer handling functions were required.
Unlike RRS and RSVP, INSIGNIA is a single-phase commit protocol which reserves
resources with the probe that travels from source to destination. If resources are not
available on some hop, no resources are reserved further in the route and a report is sent
from the destination notifying the sender that the request was not successful. If resources
are reserved all the way to the destination, the report indicates success. The complete
INSIGNIA process model is shown in Figure 31.
Figure 31, INSIGNIA process model
The INSIGNIA process model consists of 8 states, three of which are for handling
internal timers, two are for handling INSIGNIA messages, and the remaining three are for
model initialisation, handling new request interrupts, and for handling OSPF graph
updates.

124
7.3 Results
Simulation results for RSVP and INSIGNIA are included for comparison and used to
evaluate RRS in the maritime environment. First, the acceptance rates of RRS and RSVP
are compared. Second, the different nature of maintaining reservations in INSIGNIA
leads to a more in-depth comparison. Finally some conclusions on the performance of
RRS and its suitability are given.
7.3.1 RRS vs. RSVP, Static Network Model
Our evaluation begins with the acceptance rates in RRS and RSVP. Using the methods
described in Section 7.1 the following tables were generated. Table 17 provides the
percentage of the requests that were able to reserve resources from source to destination
at the time of the request. A margin of error is given at the 95% confidence interval.
Table 17, Acceptance Rates, Static Network
Network Load Source RRS RSVP Small Nominal Uniform 93.1 +/- 0.6 78.1 +/- 1.0 Single 91.2 +/- 0.7 64.9 +/- 1.2 High Uniform 75.3 +/- 1.0 57.3 +/- 0.7 Single 67.6 +/- 1.1 40.2 +/- 0.8 Large Nominal Uniform 88.8 +/- 0.5 67.8 +/- 0.8 Single 88.4 +/- 1.1 58.4 +/- 1.5 High Uniform 68.6 +/- 0.7 48.6 +/- 0.5 Single 65.2 +/- 1.0 37.3 +/- 0.7
The most immediate conclusion that can be drawn from Table 17 is that RRS provides
superior acceptance rates to RSVP in all scenarios. An improvement of 19-41% over
RSVP is achieved when the source of requests is uniformly distributed, and an
improvement of 41-75% with a unique source of reservations. However, the reservation
success rate, defined as a reservation which gains end-to-end resources from the
beginning to the end of its request, should also be considered. In this case the reservations
lost to pre-emption in RRS reported in Table 20 must be included. Since these protocols
use the same two-phase commit strategy for reserving resources, the improvement by
RRS can be attributed primarily to two factors: the use of pre-emption to admit higher
priority flows; and the use of multi-routing to route around congested links. These effects
are discussed in more detail in Section 7.3.3.

125
7.3.2 Effect of Mobility on RRS and RSVP
The acceptance rates of RRS and RSVP were also simulated using the mobile network
model, with results shown in Table 18.
Table 18, Acceptance Rates, Mobile Network
Network Load Source RRS RSVP Small Nominal Uniform 91.6 +/- 0.7 77.0 +/- 0.9 Single 90.5 +/- 1.0 63.5 +/- 1.7 High Uniform 74.1 +/- 0.8 56.5 +/- 0.9 Single 67.2 +/- 1.4 40.1 +/- 0.7 Large Nominal Uniform 88.1 +/- 1.1 64.7 +/- 1.0 Single 91.7 +/- 1.1 57.5 +/- 1.3 High Uniform 67.5 +/- 0.5 48.3 +/- 0.6 Single 66.5 +/- 1.4 37.7 +/- 1.0
A comparison of Table 17 and Table 18 shows that the mean acceptance rates of the
mobile network are generally lower than in the static case, i.e. within or below the 95%
confidence interval of each other in all but two cases. In the large network at nominal
load, the single source model of RRS has a mean in the mobile case 3.3% above the mean
of the static network while at high load RRS similarly has a mean 1.3% above the mean
of the static network using the single source reservation model. This would suggest that
mobility has a small negative effect on raw acceptance rate in the small network, with a
more variable effect in the large network.
Direct comparison with Table 17 does not, however, take into account the reservations
later lost to the link failures associated with mobility. Mobility can cause existing
successful reservations to be lost when links fail within the network, thus increasing the
number of subsequent reservations admitted. The effect of link failures on active
reservations is related in Table 19 with the given percentage of accepted flows having
lost their resources at some point along their route.

126
Table 19, Reservation Failure Rates (due to mobility) Network Load Source RRS RSVP Small Nominal Uniform 2.0 +/- 0.6 1.7 +/- 0.6 Single 1.5 +/- 0.7 1.7 +/- 0.8 High Uniform 1.3 +/- 0.6 1.6 +/- 0.5 Single 1.0 +/- 0.3 1.0 +/- 0.7 Large Nominal Uniform 4.3 +/- 0.3 4.3 +/- 0.3 Single 4.8 +/- 0.9 4.2 +/- 0.9 High Uniform 3.6 +/- 0.3 3.8 +/- 0.4 Single 3.7 +/- 0.9 4.4 +/- 0.8
The mean failure rates for RRS and RSVP can be seen to fall within the 95% confidence
interval of each other in all cases. This is as expected, since they are based on the same
underlying mobility model and a similar reservation release mechanism. Reservation
recovery mechanisms were not included in the RRS and RSVP model. Considering the
relatively low number of failed flows relative to the number of accepted flows, it is
unlikely that such features would be worth the additional overhead in this low bandwidth
environment.
Considering the link failure rate, the total number of successful reservations can be
calculated to determine the effect of mobility on RRS and RSVP individually. A
successful reservation is defined as a reservation that maintains their resources end-to-end
without loss due to a link failure or pre-emption. In this section we look only at link
failures. In RRS, the effect of mobility (failure rate) with the single source reservation
model has very little effect, with only 1.2-2.3%††† fewer successful reservations with
mobility when compared to the static case. The effect is slightly larger in the uniform
source model with 2.9-5.1% fewer successful reservations overall. RSVP shows a similar
trend, though with a slightly larger effect. Compared with the static model, 1.2-5.7%
fewer reservations were successful in the mobile network for single sourced reservations,
while the uniform model had 3.0-8.7% fewer with mobility. The difference between
single source and uniform models is explained by the fact that the uniform model
saturates the links more evenly, while the single source model suffers from bottlenecks
††† for e.g. to calculate the difference in the small network, high load scenario the effect can be calculated as (67.2 (mobile case) -1.0 (link failure rate) *0.672 (acceptance) ) / 67.6 (static case) = 2.3%. Note that failed flows must first have been successful and therefore have a proportionally smaller amount on acceptance

127
around the reservation source. This leads to more reservations on average being lost for a
particular link failure in the uniform model. From this we conclude that there is a slight
(single digit percent) negative effect from mobility on reservation success, with uniform
reservations experiencing approximately double the effect found using the single source
request generation model. In order to properly compare RRS and RSVP using the idea of
successful reservations, we look in the following section at the other cause of reservation
failures, pre-emption.
7.3.3 Effect of Pre-Emption
By investigating the effect of pre-emption rates in RRS, we gain a better understanding of
the difference in reservation success between RRS and RSVP. The percentage of
accepted flows which lost their resources due to pre-emption is given in Table 20.
Table 20, Pre-emption Rates (RRS only)
Network Load Source RRS (static) RRS (mobile) Small Nominal Uniform 8.3 +/- 0.5 8.2 +/- 0.7 Single 15.0 +/- 1.1 15.8 +/- 1.3 High Uniform 21.7 +/- 0.7 21.0 +/- 1.2 Single 35.8 +/- 0.9 35.7 +/- 1.2 Large Nominal Uniform 8.9 +/- 0.5 8.7 +/- 0.4 Single 18.1 +/- 1.1 17.1 +/- 1.0 High Uniform 19.2 +/- 0.5 18.9 +/- 0.5 Single 34.4 +/- 0.8 34.2 +/- 1.0
From this table we can see that pre-emption is significantly impacting existing RRS
flows, particularly in the high load scenarios. In the maritime environment, this level of
loss may be acceptable considering that no high-priority flows are affected, only low
priority and to a lesser extent medium priority flows. This ensures the acceptance of high-
priority reservations, except in extreme cases, where they may be blocked by other high-
priority reservations. This is unlikely to occur in even the high-load models simulated
here given the relatively low pre-emption rates and an even distribution of requests
between the three priority classes.
Comparing the static and mobile network model results, the pre-emption rates are within
the 95% confidence interval of each other in both the static and mobile scenarios. This is
128
to be expected, since with similar reservation rates in both mobile and static case, the mix
of reservations in the network is similar. With similar network priorities and similar
number of reservations, the pre-emption rate should also be similar. Though within error
bounds, a slightly higher pre-emption rate in the static case can be seen. Since there are
slightly more reservations made in this case, additional pre-emption can be expected.
In order to quantify the effect of priority on acceptance and pre-emption rates in RRS, we
investigated the large static network scenario with uniform high traffic. Priority was
found to have a significant impact on acceptance rate, with high priority traffic having an
acceptance rate of 87.9 +/- 0.7 percent while medium and low-priority flows had an
acceptance rate of 64.7 +/- 0.9 and 49.7 +/- 0.9 percent respectively, for an acceptance
rate of 68.6 +/- 0.7 percent overall. Similarly, while high-priority flows were not pre-
empted, medium-priority flows had a pre-emption rate of 25.4 +/- 0.7 percent and low-
priority flows had a pre-emption rate of 42.8 +/- 1.6 percent, for a pre-emption rate of
19.2 +/- 0.5 percent overall. This shows that priority has a significant impact on both
acceptance and pre-emption rates, with high-priority flows gaining service similar to
RSVP (i.e. no pre-emptions) but with an improvement of 80.9 percent in mean
acceptance rate over RSVP for the large static network scenario with high traffic.
The amount of pre-emption measured, especially at high load, gives rise to the question
of whether RRS is in fact an improvement on RSVP in terms of successful reservations.
Simple subtraction of the pre-emption rate from acceptance rate is however not
appropriate, as reservations must have achieved their resources for at least some period of
time in order to be pre-empted. Based on the percentage of accepted flows that were not
pre-empted (or lost due to link failures) the reservation success (completion) rate
improvement of RRS over RSVP can be measured. Analysis shows there is a large
difference in mean improvement rates in high vs. nominal load scenarios. At high load,
an improvement of only 3-8% more successful reservations over RSVP can be achieved
in the small network and 14-17% in the large network, regardless of mobility or traffic
source model. At nominal load, a greater improvement is possible, in the small network
9% and 20% for uniform and single source models respectively. In the large network at

129
nominal load there are some mobility effects. The static network gains 19% and 24% for
uniform and single source models respectively, and the large mobile network RRS
reservations gain 24% and 31% for uniform and single source models respectively. This
shows that at nominal load the multi-routing effect is especially effective for single
sourced requests while at high load there is little difference between the two request
models.
It should be noted that though RRS does pre-empt low-priority flows, these flows gain
some advantage from the use of reserved resources for the period of time before they are
pre-empted. Investigating the effect of priority level on resource hold times (reservation
success) we again looked at the large static scenario with uniform high traffic. In this
scenario we found that high-priority flows were not pre-empted (as expected), but both
medium and low-priority flows which were accepted had on average a significant period
in which they did gain their required resources. Medium-priority flows that were
eventually pre-empted kept their reserved resources for 65.2 +/- 4.2 percent of their
allocated time period on average. Similarly, low-priority flows maintained their reserved
resources for 36.6 +/- 2.7 percent of their allocated time. Thus, though pre-empted flows
do not gain full advantage of reserved resources throughout their lifetime, RRS does
provide them with significant periods of advantage based on their priority.
7.3.4 RRS vs. INSIGNIA
In order to compare RRS with INSIGNIA, it is important to remember that in INSIGNIA
flows are granted resources per-hop for as far along their current route as is available
instead of end-to-end. This means that if a link does not have resources, later links in the
flow will not reserve resources. The unfortunate consequence seen in these simulations is
that resources are kept by flows on the first part of their path, and yet flows still fail to
achieve end-to-end reservations. As shown in Figure 32, this reduces the total number of
successful end-to-end reservations in the network because resources are wasted on non-
viable reservations.

130
Figure 32, Example of Network-Wide Reserved Bandwidth in INSIGNIA
Figure 32 shows the total amount of reserved bandwidth on all links in the network at a
particular time in one simulation run of the large network with no mobility, nominal
request load, and with the uniform reservation arrival model. It shows that at the
beginning of the simulation, from about 5 minutes to 25 minutes, a large number of
reservations are successful and the total amount of end-to-end reserved bandwidth in the
network peaks around 1800 – 1900 kbps (out of a theoretical maximum of 2176 kbps
“reservable”). After this, the total amount of reserved bandwidth decreases until a steady
state is achieved at about 40 minutes. From this point on, successful reservations hold
approximately 1250 kbps of network bandwidth. The remaining reservable bandwidth at
this point is tied up by reservations which do not have end-to-end resources but are still
holding resources on the beginning of their route, blocking other reservations from
getting sufficient resources to be successful themselves.
In Table 21 and Table 22 below, the acceptance rate given is the percentage of new flows
which gain resources on all links in their route on the first try. Upgrades are the
percentage of flows which at some point did not have end-to-end resources then gain
Total Reserved Bandwidth (kbps)

131
such resources. Downgrades are the percentage of accepted or upgraded flows which at
some point had end-to-end resources and then lose the resources on any link. Since there
is no pre-emption in INSIGNIA this can only happen because of mobility.
Table 21, INSIGNIA Results (Static Network)
Network Load Source Acceptance Upgrade Small Nominal Uniform 20.8 +/- 1.2 16.3 +/- 1.1 Single 14.4 +/- 0.6 17.7 +/- 1.0 High Uniform 6.7 +/- 0.3 14.8 +/- 0.6 Single 6.6 +/- 0.7 10.1 +/- 0.7 Large Nominal Uniform 22.7 +/- 0.9 6.9 +/- 0.5 Single 47.5 +/- 2.1 5.3 +/- 0.8 High Uniform 9.7 +/- 0.4 8.7 +/- 0.4 Single 27.9 +/- 0.8 4.7 +/- 0.5
Table 22, INSIGNIA Results (Mobile Network)
Network Load Source Acceptance Upgrade Downgrade Small Nominal Uniform 18.1 +/- 0.9 18.5 +/- 0.9 4.9 +/- 1.0 Single 14.6 +/- 1.7 20.6 +/- 1.8 5.1 +/- 2.3 High Uniform 6.2 +/- 0.3 14.7 +/- 0.7 3.5 +/- 1.2 Single 7.1 +/- 0.6 12.2 +/- 1.4 4.3 +/- 1.6 Large Nominal Uniform 19.7 +/- 0.8 10.4 +/- 0.6 8.8 +/- 1.1 Single 45.1 +/- 1.6 11.5 +/- 1.6 4.4 +/- 1.2 High Uniform 8.5 +/- 0.3 9.3 +/- 0.5 11.3 +/- 1.1 Single 27.3 +/- 1.0 9.7 +/- 0.8 7.5 +/- 0.8
Considering the results of these two tables, it can be seen that INSIGNIA performs very
poorly in the maritime environment with low acceptance rates (most below 30%). These
results would not be acceptable in a maritime environment, especially considering the
lack of priority mechanisms for critical flows.
Comparing these two tables to determine the effect of mobility, it can be seen that the
static network model provides a slightly higher initial acceptance rate, which is to be
expected when links may be down due to mobility when new requests arrive. Comparison
of the acceptance rates show the static results are within 13 percent of the mobile results
in all cases respectively. Conversely, upgrades are higher in the mobile network. This is
due to the fact that when links become available due to mobility there is a greater chance
for existing reservations to gain end-to-end resources using the newly available link.
When both upgrades and downgrades are taken into account, the static and mobile results
132
for partially successful reservations are similar and within +/- 17%. Partially successful
reservations are defined as reservations which achieve end-to-end reservations at some
point in their lifetime. Interestingly, the uniform source distribution resulted in 7-17%
more partially successful reservation in the static network model (compared to the mobile
model) while the single source distribution resulted in 2-10% less. Because fewer links
become fully subscribed in the single source distribution due to the bottleneck around the
source, it does not suffer as many lost reservation when a link fails as on average there
are less reservations in the network. Uniformly distributed requests are conversely more
sensitive to link outages since all links are more likely to have a high number of
reservations.
7.4 Policy-Based Control of RRS
One of the unique properties of RRS is its ability to dynamically change its operational
parameters through the policy system. The simplest way to demonstrate this is with a
change in the percentage of link bandwidth that can be used by RRS for reserved flows.
In previous simulations, all reservation protocols could reserve up to 50 percent of the
bandwidth on each network link. Changing this value would traditionally require
reconfiguring every link on every router in the network. As illustrated in Figure 33, RRS
can make this change throughout the network in a very short amount of time.

133
Figure 33, Effect of Policy Change on Network-Wide Reserved Bandwidth in RRS
Figure 33 shows the total amount of reserved bandwidth on all links in the network at a
particular time in one simulation run of the large network with mobility, high request
load, and with the uniform reservation arrival model. There are two policy changes made
in the middle of the simulation, one at 3000 seconds to switch the allowable link
reservation bandwidth from 50 percent to 25 percent, and a second at 5000 seconds to
change the bandwidth to 75%. As can be seen, initially the network is quickly loaded to
approximately 1750 kbps out of a theoretical maximum of 2176 kbps “reservable”
bandwidth tallied over all links in the network. At 3000 seconds, the total amount of
bandwidth reserved in the network drops within approximately 10 seconds below the new
theoretical maximum of 1088 kbps as reservations are dropped until sufficient bandwidth
is available. At this time, the observed acceptance rate dropped and pre-emption rate
increased significantly for a short period before evening out at a new rate after
approximately 600 seconds. Then at 5000 seconds, the amount of reserved bandwidth
increased quickly before reaching a steady state of about 2300 kbps out of a theoretical
maximum of 3264 kbps. At this time, the observed acceptance rate was 100% for a short
time without pre-emptions before dropping to a new improved rate after approximately
Total Reserved Bandwidth (kbps)

134
600 seconds. This shows that automation through policy control can provide very quick
response times to changing needs, a requirement of maritime networks.
7.5 Summary
Looking at these results in terms of the operational requirements for maritime networks,
the overall RRS acceptance rate of 88-93% on average for nominal loadings is
acceptable. In the critical high load case, the RRS acceptance rate of 65-75% on average
may seem low but it should be noted that the pre-emption mechanism used in RRS
ensures that high-priority flows are accepted at the cost of lower-priority flows losing
their resources. For example, in the heavily loaded large static network with uniform
requests, 87.9% of high priority traffic was accepted on average, while low-priority
traffic was accepted only 49.7% of the time on average.
To evaluate the effectiveness of RRS in a maritime environment it was compared with
the archetypical fixed network reservation protocol RSVP and a MANET reservation
protocol INSIGNIA. With mean acceptance rates of 57-78% on average at nominal load
and 37-57% at high load it is unlikely that RSVP would be acceptable in this
environment, especially considering its lack of special treatment for critical flows.
INSIGNIA’s performance was even worse with mean acceptance rates of 14-48% on
average at nominal load and 6-28% at high load.
From these results, it can be seen that the multi-routing and pre-emption features of RRS
provide a higher acceptance rate compared with RSVP, with similar loss rates during link
failures. This improved acceptance rate does however come at the cost of pre-empted
lower-priority flows. In order to determine the impact of pre-emption, RRS and RSVP
were compared in terms of successful reservations, which maintain their resources end-
to-end throughout their lifetime. In this case it was found that at high load RRS still
outperformed RSVP by 3-8% in the small network and 14-17% in the large network. At
nominal load, RRS performed especially well, with the single source request model,
outperforming RSVP by 19-31%, while the uniform request model achieved a 9-24%

135
improvement. These numbers highlight that probing multiple routes makes a significant
difference only when the network is not already saturated with requests.
Another interesting conclusion from these simulations is that the mobility models used
here have a marginal negative effect on both acceptance rates and reservation success.
Comparing the results for the different mobility models, the acceptance rates for RRS and
RSVP with mobility are within or slightly below the 95% confidence interval of the static
model in most cases. In RRS, 1.1-2.1% fewer successful reservations are made with
mobility using the single source request model. The effect is slightly larger with the
uniform request model with 2.2-4.5% fewer successful reservations. RSVP shows a
similar trend, though with a slightly larger effect. With the single source model, 0.5-3.3%
fewer reservations were successful in the mobile network, while the uniform model had
1.7-5.9% fewer reservations.

136
8 Validation Results This chapter presents the results of the validation exercise for the proposed resource
reservation service (RRS). Since a prototype implementation of the RRS exists, results
using the simulation model were compared to measurements of a running test-bed to
increase confidence that the simulation results are empirically valid.
This chapter begins with the methodology used to configure the validation test-bed and
simulation environment. Second, a description of the setup used for the test-bed
measurements is given. Third, the corresponding simulation setup is described. Finally
the measurement and simulation results are compared.
8.1 Methodology
The simulation setup used for the RRS validation is the same as used previously for the
RRS simulation results (Section 7.1) with some specific differences to account for the
limitations of the prototype test-bed. First, validation runs of 1800 seconds (a half hour)
were used for all measurements instead of 130 minutes. This value was chosen because of
limited time available on the test-bed. Second, only eight individual runs of one half hour
each were performed for the test-bed measurements while 20 runs were used for the
simulations. Fewer runs were made on the test-bed due to the significant time required
per run on the prototype system. Additional runs were made for the simulations to have
tighter error bounds. Finally, because of the fewer number of runs, the two-way
confidence interval of 95% was calculated as an offset (+/-) of the mean with of 2.365
times the standard error for the 8 validation measurements.
8.2 Test-bed Setup
Validation of the RRS simulation involved measurements of an existing prototype
implemented as part of ongoing work in enhanced communications capabilities in
maritime tactical networks [6]. The configuration of the RRS test-bed used for validation
is shown in Figure 34.

137
Figure 34, Validation Configuration for the Test-bed
The test-bed is composed of four nodes. Each node consists of an edge router (Cisco
7204 router) and a single 100baseT Ethernet LAN on which resides various application
workstations. All workstations have Intel P4 2.2 GHz CPUs with 1 GB of RAM. The
workstation hosting the prototype system ran Linux (Fedora Core 3) while the application
workstations ran Windows XP with SP2. The link types in the test-bed are as follows:
links between Ships 1-2, 2-3, and 1-3 are all 64kbps LOS links, ship 1-NOC link is
128kbps satellite and link 3-NOC is 32 kbps satellite. LOS links were emulated using
back to back serial connections between routers while satellite links were hardware-based
point-to-point channel emulators. These links have been assigned the appropriate OSPF
link costs as described in Section 6.2.1. This configuration was chosen due to limitations
with the size of test-bed, while closely mirroring what networking assets a small (3 node)
task group at sea would have available to it.
8.3 Simulation Setup
The OPNET simulation setup shown in Figure 35 was used to duplicate the topology and
link configuration of the test-bed.
Ship 2 NOC
Ship 1
Ship 3 Four Node Maritime Task Force
64 kbps LOS
32 kbps satellite
128 kbps satellite

138
Figure 35, Validation Configuration in OPNET The routers use OPNET’s base Cisco 7204 model with a modified OSPF stack that
forwards the LSA graph to the appropriate RRS process in its associated workstation. The
workstations use the base Intel advanced model with the addition of a RRS process and
packet generation process (used to initiate new requests locally). The routers are
connected to their associated workstation with 100BaseT Ethernet and to each other by
point-to-point links (a serial-like link model) with bandwidths between 32 and 128 kbps
and OSPF costs as were configured in the test-bed.
8.4 Results
Table 23 presents the results of varying both the reservation source (arriving at nodes
uniformly across the network or from a single source) as well the reservation request load
(either nominal or high). The simulation results and test-bed measurements are compared
side by side for each variable.
128 KBPS
32 KBPS
64 KBPS
64 KBPS
64 KBPS

139
Table 23, RRS Simulation Results with Distributed Requests Source Model
Load Test-bed or Simulation
Call Accep-tance Rate (%)
Call Pre- emption Rate (%)
Test-bed 90.2 +/- 1.6 8.9 +/- 2.1 Nominal Load Simulation 91.2 +/- 1.1 9.5 +/- 1.2
Test-bed 74.3 +/- 4.4 23.0 +/- 7.3
Uniform
High Load Simulation 75.4 +/- 1.9 22.2 +/- 1.4
Test-bed 84.7 +/- 3.5 25.5 +/- 5.8 Nominal Load Simulation 83.7 +/- 2.5 26.5 +/- 2.3
Test-bed 57.5 +/- 3.7 38.5 +/- 6.9
Single Source
High Load Simulation 57.1 +/- 2.3 37.8 +/- 1.7
As can be seen, in each category the mean simulation and measurement results fall within
the 95% confidence interval of each other, indicating that the differences in results
between simulation and validation are not statistically significant. This increases our trust
that the RRS simulation does in fact reflect the implementation of a real test-bed.

140
9 Conclusion and Future Work We conclude this dissertation by summarising our research contributions and providing
directions for future work.
9.1 Summary Maritime networks are a relatively unexplored domain that includes elements of both
fixed and ad-hoc networking. The various constraints imposed by this environment make
Quality of Service (QoS) provisioning and resource optimisation critical to their
successful operation. The term traffic engineering (TE) is used to combine these concepts
and this is the management area of primary interest for us. While some research exists on
QoS provisioning in this area, a comprehensive characterisation of maritime networks
and their management requirements has not been attempted and forms the focus of our
work.
We have identified policy-based network management (PBNM) as a promising approach
for managing maritime networks through automation and distributed operation. We have
used a service-oriented PBNM system to support a set of policy-enabled traffic
engineering (PETE) management services. Four PETE services are proposed and we
show through simulation and validation with a prototype that they provide both
prioritisation, and resource optimisation in this area. While TE is the only management
area explored, the concept may be extended as required into other management areas.
Though these services were designed for the maritime environment, there would be some
benefit to applying them for use in other types of network as well. The automation
provided by the policy system would be an advantage to all network types in order to
reduce the management burden on the network operators. How much it would be of value
would depend both on the cost/complexity of developing the system and the expected
savings and efficiencies. The TMS service’s publish and subscribe model is well suited
for small networks but would not scale well to large networks without some kind of
clustering and data aggregation. The ability to adjust the amount of traffic to current
network conditions is also not very relevant in the currently undersubscribed fixed

141
networks. However, Bell is on record of saying that it needs to do traffic shaping since
P2P traffic is interfering with their other traffic [68] so this type of adaptive services may
become important in the future. The TPS would be a valuable service for any type of
network. The problem for fixed networks would be the scalability of the policy system
itself and the fact that it is unlikely that any other type of network (other than army
networks) would wish to change their traffic prioritisation in the short term. In the case of
ISPs, extensive modeling and simulation precedes all such changes to active routing
equipment to avoid service outages. In any case, undersubscribed fixed networks are
unlikely to require QoS mechanisms in the first place. The ARS is similar to the previous
two services in that they could be applied to fixed networks, but there are concerns. The
scalability is not such an issue assuming that MPLS tunnels are configured in advance,
however dynamic rerouting in fixed networks is likely to complicate their provisioning
simulations. In wireless networks, the greater mobility precludes the use of semi-static
MPLS tunnels, but other mechanisms (multi-routing) could be used instead. While the
RRS was designed specifically for the maritime environment, the novel mechanisms
developed here are equally applicable to fixed networks. Since such networks provide
more dense connectivity and longer routes, it may in fact operate better than in maritime
networks. The fault tolerance aspects add additional overhead, but in such a high
bandwidth this would not be critical. RRS would not unfortunately be well suited for
wireless networks. Due to the high mobility the use of explicit routes is not desirable.
The main contributions of this dissertation are summarised below.
• Characterisation of Maritime Networks
The thesis began with an investigation of the maritime environment and the issues
involved in managing maritime networks. The communication assets, routing capabilities
and traffic composition are described. Based on the salient features of maritime networks,
we outlined the key management requirements that should comprise a network
management system for provisioning such networks. No such comprehensive
characterisation of the maritime environment has been described in the literature and is
thus one of the contributions of this work.

142
• Adoption of A Policy-Based Management Architecture for Maritime Networks
From a review of the related work it was determined that policy-based network
management approach would satisfy many of the critical requirements for network
management in maritime networks. A distributed service-oriented policy-based network
management system developed in collaboration with colleagues at CRC has been used for
policy-enabling the PETE management services. It is argued that PBNM can provide the
automation required to reduce the need for operator intervention and the distributed
operation needed to deal with mobility and hierarchical authority.
• Development of Four Policy-Enabled Traffic Engineering Management Services
While the policy-based paradigm provides many attractive characteristics, the main
objective of this dissertation is the provisioning of QoS. Traffic engineering has been
identified as a mechanism that provides both optimisation of resources and effective
exchange of information. In order to meet the QoS requirements in this environment, a
suite of Policy-Enabled Traffic Engineering (PETE) management services were
developed to provide visibility, prioritisation, resource optimisation and resource
reservation. The four services are:
o Traffic Monitoring Service (TMS)
Our proposed TMS provides visibility by distributing the current state of network
traffic seen at a particular node. The level of detail distributed is adjustable and can be
chosen to reduce network overhead and/or delay by the subscriber (as dictated by
policy). TMS data can be used by operators to evaluate the current state of a node or
the global network. It can also be used to measure the impact of the other PETE
services which may need this information to ensure that their goals (policy) are being
met.
o Traffic Prioritisation Service (TPS)
The TPS on the other hand is more directly concerned with QoS by using DiffServ
techniques to prioritise traffic depending on the currently defined policy. This allows

143
the operator to choose the relative level of service between different classes of traffic.
By associating TMS and TPS together, traffic which is not achieving its information
exchange requirements can be given improved prioritisation. Though this changes
only the relative level of resources assigned to it, and does not guarantee its
transmission requirements will be met, TPS provides the QoS provisioning necessary
for the effective exchange of information in TE.
o Adaptive Routing Service (ARS)
We proposed the ARS for two reasons. The first is to ensure that application traffic
does not attempt to use a communication link that does not support its information
exchange requirements. Secondly, the ARS will, according to policy, reroute traffic
from one link to another when the former link becomes overloaded through the use of
MPLS overlays. Both provide load balancing and together this serves the resource
optimisation goal of TE.
o Resource Reservation Service (RRS)
The RRS is our primary contribution to TE in maritime networks. There are several
novel features which make this end-to-end guaranteed resource reservation service
particularly well suited to the maritime environment. The RRS probes multiple routes
from source to destination in parallel, increasing the chance that a route will be found.
When multiple acceptable routes are found, the route is chosen to balance
reservations across the network. The use of acknowledgements, timers, and a
retransmission scheme provides robustness. RRS thus provides both the TE goals of
prioritisation and traffic optimisation, but also the military requirement of guarantees
for critical traffic.
• A Simulation Study of PETE
The motivation for conducting a simulation study was to understand the behaviour of
maritime network traffic and the impact of the PETE services under different conditions.
While OPNET supported the basic networking and traffic models, new models had to be
created for the LOS links and PETE services. Additional functions such as policy-control,

144
routing-table monitoring and RSS packet handing were added as well. Our simulation
models and results for the PETE services are a significant contribution of this research.
The PETE services improved QoS (delay) for prioritised traffic and guaranteed QoS for
critical traffic. While the combination of TPS and ARS provided improved delay for
designated traffic classes, in order to guarantee end-to-end QoS, the RRS was used. For
critical application flows in times of high contention, congestion, and low connectivity
from mobility, the novel RRS service was shown to outperform two similar protocols:
RSVP and INSIGNIA.
• Validation of the RRS model
A final contribution of this dissertation is the validation work undertaken to improve
confidence in the RRS simulation model. Since much of the work in the area of wireless
simulation lacks credibility (as discussed in Section 5.1) the techniques proposed and
used in this dissertation offers a solution. By following a methodology that is repeatable
rigorous complete statistically valid, and empirically valid there can be increased
confidence in the simulated results.
9.2 Directions for Future Work To our knowledge, this is the first work to study network management for, apply the
concept of policy-based network management to, and study traffic engineering in
maritime networks. There is thus considerable scope to advance this research.
• Improved characterisation and modeling of maritime networks
Though this dissertation provides a characterisation of the maritime environment, there is
scope for refinement and further details of its operations and traffic, especially as
technologies develop in the future. With further investigation of the links available on
different platforms, more precise description of operational traffic, and more realistic
mobility scenarios, more precise simulation results would be achievable.
• Extensions to the policy system
There are two areas of the policy system which could be improved for more appropriate
application of PETE to maritime networks: extension of the policy domain, and dynamic

145
service discovery. While the policy system is currently designed for a single management
domain, further investigations are required to see how policy could be extended for use in
a coalition, or multi-security domain, environment. Policy negotiation and resolution
issues are likely to arise on a per-service basis. The use of Service Level Agreement
(SLA) between various network domains could be combined to provide end-to-end TE
across network boundaries such as proposed in [69]. Alternately a fixed network
boundary could provide a gateway for management services such as the QoS gateway
investigated in [70]. Dynamic discovery of network and policy services was not
investigated in depth in this dissertation. Currently, it is assumed network devices, their
related proxy PEP, and the policy server are given globally known addresses. A service
directory could be used to both discover the location, type, and role of devices.
Alternatively, the policy enabled applications, devices, or services could use the directory
to locate the local policy system. The investigation of service discovery mechanisms and
their suitability to tactical networks could be further pursued.
• Improvements to the RRS
There remain several avenues of investigation in regards to the RRS, including how to
handle unidirectional links, how a multicast resource reservation request may be created
and merged if RSVP mechanisms were used to merge multiple reservations, and how
MPLS protection mechanisms could be used to allow alternate reserved routes for very
high priority flows. Alternate algorithms for both multi-path generation and pre-emption
could also be investigated.
• Additional simulation studies
The focus of the simulation studies in this dissertation have been around the traffic
engineering metric of transmission delay. While this metric provides insight into the
relative impact of the various traffic engineering services proposed, there are alternate
metrics that could be used. For instance, the throughput of traffic types could be used to
gauge the impact of priority level. The simulation studies also looked at only two
mobility scenario and two traffic models. Additional scenarios and traffic models could
be used to determine the impact of management services in such different situations.

146
With the addition or modification of management and/or policy services there is also a
need to model the interaction of the services. Modeling of the policy system could also be
extended to automate other areas of network operations in maritime networks, or other
policy services could themselves be investigated through simulation.
• Application of approach to other target areas
The PETE management services were designed specifically for the maritime
environment, but the concept of using policy-enabled management services in bandwidth
constrained environments can be investigated for many difference areas. The most
obvious would be coast guard, search and rescue, and commercial maritime applications.
We are currently investigating the use of similar services for use in the Canadian army. In
this case, bandwidth is even more constrained and contains a greater number of mobile
nodes. This leads to a greater emphasis on efficiency and may limit the applicability of
reservation services to point of only allowing one or two flows on a link at a time.
• Application of approach to other management areas
Currently four traffic engineering services have been designed for the PETE system.
Additional management services could be developed to investigate improvements in
other network management areas. Network management can relate to any other of the
FACPS functional areas as defined by the International Standardisation Organisation
(ISO) [71]. FCAPS is an acronym for Fault, Configuration, Accounting, Performance,
and Security, the categories into which the ISO model defines network management
tasks. Particularly interesting areas for maritime networks include root cause fault
determination, node health monitoring, and security of both the management system and
the network as a whole.

147
Appendix A: RRS Protocol Details This appendix provides details of the proposed protocol for policy-based admission control taken from [65]. It includes packet formats, timers and a flowchart outlining the operation of a node upon receipt of a signalling packet Service requests include source address/port, destination address/port, the amount of bandwidth requested and the priority of the request. In the simulation, the destination address/port and priority are determined randomly at the initiating node. In a real implementation, the request can be made automatically by an application when it is about to start sending traffic (assuming it is RRS aware) or a request can be made through an appropriately programmed user interface.
A.1 Packet Formats This section provides information on the packet formats. Each packet contains a number of fields of given size and description. Additional notes on some fields are provided in the next section.
A.1.1 Request Packet The Request packet is used to forward reservation information on to the next node in the included Route. It includes sufficient information for the receiving node to determine if the reservation can be accepted or not. Field Size (bits) Description Message type 8 Protocol message type. Type = 1 Reservation ID 128 Unique reservation identifier. Reservation number 16 Probe number Reservation total 16 Total number of probe sent for this
reservation. Service Request variable
(~7500) Original service request submitted by user.
Number of nodes 16 Number of nodes along the reserved path. Route 32 * Number
of nodes. List of the IP Addresses for the reserved path.
Forward interface id 32 * Number of nodes.
List of interface number/IP Address.
Reverse interface id 32 * Number of nodes.
List of interface number/IP Address. Only used for full duplex reservations.
Residual Bandwidth 16 Minimum remaining bandwidth on a link after reservation (bottle neck).
Number of pre-empted flows N.
16
Pre-empted Reservation ID
128*N List of pre-empted Reservation ID.
Bandwidth 16*N List of bandwidth of the pre-empted flows.

148
A.1.2 Refresh Packet The Refresh packet is used to confirm the continuation of an existing reservation. If a committed request does not receive a refresh within the inter-refresh timeout period, the reservation is considered to have ended and the reservation’s resources are released. Field Size (bits) Description Message Type 8 Protocol message type = 2. Reservation ID 128 Reservation ID of the one to refresh. Number of nodes 16 Number of nodes along the reserved path. Route 32 * Number
of nodes. List of IP Addresses (router ids) for the reserved path.
A.1.3 Commit Packet The Commit message is sent from the destination to the source through all the nodes along the reserved path in order to commit the reservation at each node. It is upon receipt of this packet that resources are set aside for the associated reservation. Field Size (bits) Description Message Type 8 Protocol message type = 4. Reservation ID 128 Reservation ID of the one to commit resources. Probe Number 16 Probe number of reservation to commit. Number of nodes 16 Number of nodes along the reserved path. Route 32 * Number
of nodes. List of IP Addresses (router ids) for the reserved path.
“Remote” Forward Interface ids
32 * Number of nodes.
List of interface number/IP addresses of the remote end of the reserved forward interface ids. Built during the commit so the sender can set up the forward tunnel.
A.1.4 Failed Packet The Failed message is sent to the source node from the destination node (or an intermediate note in unicast requests) when there is no path available for the reservation. Field Size (bits) Description Message Type 8 Protocol message type = 8. Reservation ID 128 Reservation ID that was unsuccessful.

149
A.1.5 Denied Packet Message sent from a node to destination when the reservation cannot be made along a particular probe’s path. Field Size (bits) Description Message Type 8 Protocol message type = 16. Reservation ID 128 Reservation ID that was denied. Reservation number
16 Probe number
Reservation total 16 Total number of probe sent for this reservation. Source IP Address 32 Source IP address for this reservation.
A.1.6 Release Packet Message sent from a node to inform that the given reservation is no longer valid and resources should be released. Field Size (bits) Description Message Type 8 Protocol message type = 32. Reservation ID 128 Reservation ID that was released. Route 32 * Number
of nodes. List of IP Addresses for the reserved path.
A.1.7 ACK Packets This protocol will run on top of UDP/IP. Because UDP offers no guarantee of delivery, some reliability via an acknowledgement-retransmission mechanism is added to the Request, Commit, and Release messages. Field Size (bits) Description Message Type 8 Protocol message type = 64. Reservation ID 128 Reservation ID that ACK belongs to Reservation number
16 Probe number
Message type 8 Message type for which we send this ACK.

150
A.2 Packet Fields The protocol runs on top of UDP/IP‡‡‡. The following table shows the message type used in the header of each message. Message Type Value Resource Reservation (Partial) 1 Reservation Refresh (Keep Alive) 2 Reservation Commit 4 Reservation Failed 8 Reservation Denied 16 Tear Down 32 Acknowledge 64
A.3 Timers A set of timeouts at each node allow maintaining a consistent state of the system. For instance, if we expect to receive 5 reservation probes, and only 4 have arrived successfully, the system will not block forever waiting for the missing probe. Timer Length
(s) When Description
Maximum waiting time for reservation probes.
60 The node receives a resource reservation message and is the destination node.
This is the time to wait after the destination receives the first probe for the remaining probes (if applicable).
Send periodically refresh messages.
15 The node is the source node for an active reservation.
The timer must periodically trigger the sending of a reservation refresh message to keep it alive.
Inter-refresh arrival monitoring.
30 The node is a node part of an active reservation path.
This timer is used to make sure we receive periodically refresh messages for a reservation. If we don’t receive the message within the given period, the reservation is torn down.
Maximum time for partial reservation commit
80 The node receives a resource reservation message and is not the destination node.
This is the maximum time to wait for a commit message before cancelling a partial reservation.
ACK receive timer
3 A reliable message is sent.
This timer is used for the guaranteed delivery of messages. If an ACK is not received for the configured maximum wait time, the message is considered lost.
‡‡‡ UDP port number is configurable. Currently it is configured as port 7227 in the prototype.

151
These different timers currently used along with the protocol messages. The timers are configurable and should be tuned to the environment in which the RRS will be used. For instance, the maximum wait time could be lower if the network were known to be quite small or larger if delays are expected to be very long. The inter-refresh interval should be set to at least twice the refresh period (to allow for lost packets). Investigation of the effect of timers on the protocol was left as future work.
A.4 Flowchart The following diagram (Figure A-1) shows the processing that is done by the system to handle the arrival of a protocol message.
Figure A - 1, RSS Packet Processing Flowchart
Check Message Type
Message Type?
Process Resource Reservation
Resource Reservation
Process Reservation
Commit
Process Reservation
Refresh
Process Reservation
Denied
Process Reservation Failed
Refresh
Commit
Failed
Denied
Destination node?
Make partial reservation
yesno
Send reservation probe to next BB
Wait for more probes?
Is timer started?
Start probe timer
Send Reservation Commit message
to next node
no
yes
Put probe in reservation map
no
Choose best reservation route.
yes
Send config to router
Found a route?
Send Reservation Failed message to
source
yes
no
Start refresh timer
Source node?
no
Notify client of successful reservation
yes
Notify client of failed reservation.
Wait for more probes?
no
yes
Destination node?
Reset timer for reservation
no
Send Reservation Refresh to next
node
yes
Success?
Send Reservation Denied message
to destination
yes
no
Start commit timer

152
Appendix B: Bidirectional Routing Example This appendix taken from [65] explains the route information that is build up and carried
by the RRS messages as the request and confirmation progresses from source to
destination and back again. This information is used to set up tunnels for the defined
traffic.
The general format to specify the path is:
{Router node ID/forward path interface}
If the service request is bi-directional, the path information needs to be augmented by the
reverse path interface which will be selected at each node as the reservation progresses.
The general format for bidirectional reservations becomes:
{Router node ID/forward path interface/reverse path interface}
To test both forward and reverse path simultaneously for sufficient bandwidth, it is
important to know at each hop which reverse interface will be used for routing the
reserved traffic (in order to maintain the reserved bandwidth pool on that interface). The
reverse path interface is used to set up the MPLS tunnels. This reverse path information is
carried as part of the request and confirm protocol messages so that both endpoints can
build the MPLS tunnels as required (since they are built in the reverse direction from
which they are sent).
To illustrate how the route is generated, consider the following network connectivity
diagram.

153
Figure B - 1, Network Connectivity Diagram Example
Let us assume the following:
• A service request has been made from LAN1/wkst1 to LAN2/wkst2
• The best route algorithm has selected the following path: {R1/A - R2/C - R3/G - R4/0} (Note that an interface value of 0 implies that no interface is currently specified)
• The service request is bi-directional
As the probe (reservation request message) is sent from source to destination, each node
along the selected route updates the information carried by the probe in order to include
the reverse tunnel interface while performing access control in both upstream and
downstream directions.
At R1:
• The probe is initialized with the selected route: {R1/A/0 - R2/C/0 - R3/G/0 - R4/0/0}
• As router 1 is the first hop along the path, it does not include a reserve interface. It sends the probe to R2.
• The local policy system keeps the following knowledge for this request:
Forward path local interface: A
Reverse path local interface: 0 (N/A since it is a local connection)

154
At R2:
• R2 receives the probe containing the route: {R1/A/0 - R2/C/0 -R3/G/0 -R4/0/0}
• Since the reservation request is bidirectional, it finds which interface (in the reverse direction) can best accommodate the request at the same time. In this case, only interface B is a possible pick. Let us assume that enough bandwidth is available via interfaces C and B. It finds that A is the corresponding “next hop” interface to B and updates the message with appropriate path info: {R1/A/0 - R2/C/A - R3/G/0 - R4/0/0} and sends it to R3
• The local policy system keeps the following knowledge for this request:
Forward path local interface: C
Reverse path local interface: B
At R3:
• R3 receives the probe containing the route: {R1/A/0 - R2/C/A - R3/G/0 - R4/0/0}
• Since the reservation request is bidirectional, it then finds which interface can best accommodate the request. In this case, two interfaces are possible. Let us assume that the best pick is via interface F (refer to Section 7.5 for the route selection criteria). It finds that E is the corresponding “next hop” interface to F and updates the message with: {R1/A/0 - R2/C/A - R3/G/E - R4/0/0} and sends it to R4
• The local policy system keeps the following knowledge for this request:
Forward path local interface: G
Reverse path local interface: F
At R4:
• R4 receives the probe containing the route: {R1/A/0 - R2/C/A - R3/G/E - R4/0/0}
• Since the reservation request is bidirectional, it needs to find which interface can best accommodate the request. In this case, interface H is the only possible pick. Let us assume that enough bandwidth is available at interface H. It finds that G is the corresponding next hop interface to H and updates the path info: {R1/A/0 - R2/C/A - R3/G/E - R4/0/G}.
• The local policy system keeps the following knowledge for this request:
Forward path local interface: 0 (N/A since it is a local connection)
Reverse path local interface: H

155
• Since it is the last node, it is the one that needs to create the reverse tunnel. The node extracts the information from the corresponding fields of the probe to form the reverse tunnel {R4/G – R3/E – R2/A} (last hop) and will create the reverse tunnel (from destination to source) once confirmed by the source.
• Because it is the last node, R4 will issue the commit message. It copies the forward path info in the commit message (no need to send back the reverse path info as it is of no use to the other nodes) and sends it backward towards the source to R3. The commit message thus contains the following route: {R1/A - R2/C - R3/G - R4/0}
• As the commit message is sent from destination back to source, each node along the selected route replaces the local forward interface by the forward tunnel interface (which needs to be expressed by the corresponding next hop interface of the other end of the link to build the tunnel):
At R3:
• R3 receives the commit containing the route: {R1/A - R2/C - R3/G - R4/0}
• R3 finds that H is the corresponding next hop interface to G. It updates the path info of the message to: {R1/A - R2/C - R3/H - R4/0} and sends it to R2
At R2:
• R2 receives the commit containing the route: {R1/A - R2/C - R3/H - R4/0}
• R2 finds that D is the corresponding next hop interface to C. It updates the path info of the message to: {R1/A - R2/D - R3/H - R4/0} and sends it to R1
At R1:
• R1 receives the commit containing the route: {R1/A - R2/D - R3/H - R4/0}
• R1 finds that B is the corresponding next hop interface to A. Given that it is the first hop, it now has the information to create the forward tunnel. By extracting the information from the corresponding fields of the message, the forward tunnel is created: {R1/B – R2/D – R3/H} (last hop).
Once the tunnels are created and access control has been completed, the flow will be
recognized at each hop and forwarded to the next hop defined by the tunnel. This
mechanism is especially useful in maritime environments for its promotion of load
balancing when multiple links exist between the same two nodes.

156
Appendix C: Policy Language Details This appendix provides an overview of the policy representation required for the PETE
management services described in this thesis. It is based on the policy representation
paper [5] given at the 2007 IEEE Workshop on Policies for Distributed Systems and
Networks in Bologna, Italy, June 2007. This paper described the policy representation of
the policy management system developed at CRC§§§. This policy system was developed
before any open-source policy system and associated representation was available. Since
that time, the Ponder2 project has made available a general-purpose object management
system with a Domain Service, Obligation Policy Interpreter, Command Interpreter and
Authorisation Enforcement [53]. Had this code base had been available at the time it
would have been investigated as an alternative.
C.1 Policy Representation Overview Policies can exist at different levels of abstraction depending on the context. DEN-ng
[18] defines a policy continuum that is composed of five views. Within the policy
architecture, a similar but simplified policy continuum has been adopted where policies
are expressed at three different levels of abstraction:
• HL Policies: Specifies traffic management objectives via high-level policy
authorizations (what operations a subject is authorized to do on target objects) and
high-level policy obligations (rules that require some action to be performed on a
target);
• Specification Policies: Expresses management-service-specific rules to derive LL
policies from a given HL policy;
• LL Policies: Expresses technology/capability-specific goals.
High- and low-level policies are represented using XML. This language was found to
offer flexibility for expressing policies as well as to ease document manipulation. There
are a number of advantages of using XML to encode policies. As outlined in [72], the
§§§ The Communications Research Centre, a pre-competitive research agency of Canadian Department of Industry http://crc.ca, and the current employer of the author of this dissertation.

157
ubiquity of XML parsers ensures that XML can be easily interpreted across
heterogeneous systems. XML can also be validated based on an XML schema to ensure
that the policy syntax is correct. This in turn facilitates the rule-based policy processing
approach used in this work.
The HL policy XML schemas have been tailored for the management objectives they
support while the LL policy schemas were designed to be generic in the domain of traffic
management. A benefit of using a multi-level policy representation is that each level can
be implemented independently as long as the interfaces are respected. This makes the
architecture more resilient to changes.
In order to relate these two levels of policy, a level of goal refinement [73] was
developed. Specification policies are concerned with the automatic translation from an
abstract management HL policy into a set of LL policies. This third level of policies is
rule-based and is implemented using the commercial ILOG JRules [74] engine.
The following sections describe these policies in more detail and describe our experience
with their implementation in the policy prototype.
C.2 High level (HL) Policies The policy system currently defines three separate types of HL obligation policies (three
types of traffic management policies) and one type of authorization policy (a user-
management policy). The three obligation policies dictate how information exchanges are
supported within the network while the authorization policy associates users with
management roles in the system.
The HL obligation policies are expressed in XML and reuse some concepts defined in
Ponder [52]. Obligation policies in Ponder define “the actions that policy subjects must
perform on target entities when specific relevant events occur”. Similarly, we define our
obligation policies as the actions that a traffic management device must perform on target
applications under specific constraints.

158
Our policy language makes use of a series of generic types that are reused throughout the
different policy documents. This approach provides the framework the flexibility to
easily define and integrate new policy documents. A description of the current policy
representations is given in the following sub-sections.
C.2.1 Traffic Management (TM) Policy The HL Traffic Management (TM) policy was developed in support of the monitoring
service to give feedback via the event service to other management services. They can
thus determine if their policy is being respected, and if not how the policy has been
violated (policy monitoring). The traffic monitoring service can also be used to monitor
the state of the various other nodes in the network. Its representation is shown in UML
format in Figure C-1.
Figure C - 1, HL TM Policy Representation
The action defines the operation to be performed on the target, in this case, whether the
monitoring services is required or denied sending status updates at a certain detail level.
The policy includes three constraints that represent the set of conditions under which the
policy is valid. These three constraints are: the validity, the scope and the network status.
The validity is a standard time constraint to indicate the period of applicability of the
policy. The scope is used to define the policy applicability (where the policy is enforced).
Scope is explained in Section 4.1.2 of the thesis. The network status determines whether
the WAN links towards the destination (defined in the target) are overloaded, congested
or free. Finally, the target determines the source, destination, and periodicity of the traffic
management updates. If source is not defined, the local node is assumed. If destination is
not defined all nodes are assumed.

159
Examples of TM policies are:
If the WAN links are not congested, distribute the base status to all peer traffic
monitoring service instances every hour (this policy is described in XML format below)
If the WAN links are congested, broadcast only base traffic status, with a limit of one
report per subscribed node per minute
Allow detailed status to be sent to the NOC only, all other nodes may only receive use
and enhanced status and must explicitly request enhanced status information
XML Example 1 Action: send summary status if links are not congested.
Target: all nodes, every hour
Constraints: WAN uncongested, valid between 9:00 and 11:00 am on May 10th 2007
and scope is Domain Recommended.
Figure C - 2, Sample TM Policy in XML
C.2.2 Traffic Prioritization (TP) Policy The HL Traffic Prioritization (TP) policy was developed in support of the traffic
prioritization service. The TP policy allows traffic to be ranked by relative importance. Its
representation is shown in Figure C - 3.
<TMPolicy …"> <constraints>
<scope>DomainRecommended</scope> <validity>
<starttime>2007-05-10T9:00:00-05:00</starttime> <endtime>2007-05-10T11:00:00-05:00</endtime>
</validity> <status>LT 70%</status>
</constraints> <actions> <base>allow</base> </actions> <target>
<period>3600s</period> </target>
</TMPolicy>

160
Figure C - 3, HL TP Policy Representation
The target refers to the application flows which are specified using their type (e.g. ftp,
chat, email) and optionally using the source and/or destination parameters. In this case,
the action is the assignment to a pre-defined class of service (CoS). The CoS defines the
target’s (application’s) relative priority. Five CoSs are currently supported in the policy
system: Best Effort, Background, Standard, Excellent Effort,
Streaming and Reserved . The policy includes two constraints: a time constraint
and a scope constraint.
Examples of TP policies are: • all domain’s VOIP traffic should be streaming ;
• chat traffic from the commander’s computer (on ship XX) is excellent
effort ;
• file transfers between ship 1 and NOC are standard .
XML Example 2 Action: set priority to standard
Target: all email traffic to 10.10.0.18
Constraint: Valid for the whole month of June 2007 and scope is Domain Critical.

161
Figure C - 4, Sample TP Policy in XML
C.2.3 Adaptive Routing (AR) Policy The HL adaptive routing (AR) policy specifies which bearer / MPLS tunnel traffic is to
travel over, depending on its type and current traffic conditions. Its representation is
shown in Figure C-5.
Figure C - 5, HL AR Policy Representation
As for the previous policy type, the targets are applications. For each target object
(application), the action specifies the possible link types (or MPLS tunnels) which are
considered acceptable to carry the target traffic. Four constraints are defined; the first
three applying to policy enforcement time, scope, and network conditions constraints.
The fourth constraint is that the policy must or should restrict the action. The “should”
constraint implies that the target application can default to the default route if there is no
<TPPolicy …> <constraints>
<scope>DomainCritical</scope> <validity>
<starttime>2007-06-01T0:00:00-05:00</starttime> <endtime>2007-06-30T23:59:59-05:00</endtime>
</validity> </constraints> <actions>
<priority>STANDARD</priority> </actions> <targets>
<name>EMAIL</name> <destination>
<ipAddress>10.10.0.18</ipAddress> </destination>
</targets> </TPPolicy>

162
route to destination using the specified constraints. On the other hand, the “must”
constraint forces the traffic to only use the specified MPLS tunnel.
Examples of AR policies are:
traffic exclusive to the task group SHOULD be sent via LOS links UNLESS such traffic
cannot meet its QoS requirements
links with utilisation greater than 85% MUST reroute best effort traffic onto an alternate
route (if an alternate MPLS tunnel exists) or drop this traffic
voice and video traffic MUST use satellite bearers UNLESS utilisation is greater than
70%
XML Example 3 Action: set trunk type to be any SATELLITE
Target: all VOIP sessions
Constraints: Scope is Domain Recommended, Valid between 9:00 and 11:00 am from
May to July 2007, and utilisation is less than 70%.
Figure C - 6, Sample AR Policy in XML
<ARPolicy …> <constraints>
<scope>DomainRecommended</scope> <validity>
<starttime>2007-05-01T9:00:00-05:00</starttime> <endtime>2007-07-31T11:00:00-05:00</endtime>
</validity> <status>
<satellite>LT70</satellite> </status>
</constraints> <actions>
<must>SATELITE</must> </actions> <targets>
<name>VOIP</name> </targets>
</ARPolicy>

163
C.2.4 Resource Reservation (RR) Policy The final type of HL policy is the Resource Reservation (RR) policy. RR policy is
significantly different from the previous types of policy as it refers not to class-based
traffic, but to individual flows. For this reason the policy refers not the traffic (no targets)
but to the operation of the RRS itself (many different actions). Its representation is shown
in Figure C-7.
Figure C - 7, HL RR Policy Representation
RR policies do not include a target as they apply to all RRS operations on the local node.
It has similar constraints to previous types of policy including scope and validity. Unlike
previous policies, there are a number of actions which can be applied in the same RR
policy which influence its operation at the local node.
Examples of RR policies are:
A maximum of 50% of the available bandwidth of a link may be reserved
Reservations which are pre-empted or terminated due to a change in topology (mobility)
should be immediately re-attempted on a different route
High priority reservations should have a disjoint bypass route reserved and placed on
standby
XML Example 4 Action: enforce all three example policies
Constraints: Valid between 9:00 and 11:00 am from May to July 2007 and scope is
Domain Critical.

164
Figure C - 8, Sample RR Policy in XML
C.3 Specification Policy Specification-level policies define the relationship between HL policy and LL policy.
Specification policies encode an understanding of the concrete capabilities available in
the system and the HL policies objectives.
The policy system currently uses a Java-based commercial rule engine, ILOG JRules
[74], to express specification-level policies (derivation rules). Although targeted to
business rules management, JRules offers the flexibility and functionality that was
required for the interpretation and manipulation of XML policy documents. Both
specification and element specific policy transformation rules are written using the ILOG
rule language.
The refinement from HL policy to one or more LL policy documents requires element by
element comparison in order to detect possible differences from previous versions of the
HL policy. In order to perform these comparisons, the rule engine needs access to a
variety of external data sources including Java objects and property files.
Since the translation logic needs to be updated in parallel with changes to HL policies, it
is important to have a simple way to perform these updates. The rule engine allows to
keep a clean separation between the management system and the XML policy processing
<RRPolicy …> <constraints>
<scope>DomainCritical</scope> <validity>
<starttime>2007-05-01T9:00:00-05:00</starttime> <endtime>2007-07-31T11:00:00-05:00</endtime>
</validity> </constraints> <actions>
<maxreserve>50</maxreserve> <retryonfail>True</retryonfail> <bypassonlinkfail>HIGH</bypassonlinkfail>
</actions> </RRPolicy>

165
logic and it is flexible enough to allow implementation of new functionalities. The main
components of the JRules engine are shown in Figure C - 9.
Figure C - 9, JRules Engine Components
The rule engine is initialized by loading the XML schemas and a set of rules. Schemas
are automatically transformed to a class model. These classes become our Business
Object Model (BOM). It represents the objects that may be manipulated by the rules.
When an XML document is loaded by the engine, it is dynamically converted to the
corresponding objects from the available class definition. Once the objects have been
loaded in the working memory, the rule execution is initiated. As shown in Figure 10,
rules in JRules are expressed using an If-Then- (optional)Else structure (using the
keyword “when” instead of “if”). The “If” part is evaluated on all objects in working
memory. The execution of the “then part” may add, remove or modify objects in the
working memory.
Rules are evaluated in a specific order as indicated by the ruleflow. The action part of a
rule is written in the text-based ILOG rule language (IRL) which is very similar to Java.
An example is given below:
Example 4
This rule derives the LL TP policy from a HL TP policy which contains an action to set
the priority level to real-time . As shown in Figure C-10, when it find intances of
“Realtime” in HL policy it executes actions in the then section of example.

166
Figure C - 10, JRules example
Figure C - 11, presents the main steps for policy manipulation and processing, and the
order that they are applied.
Figure C - 11, Specification policy rules
First, the LL XML elements are populated with values from the HL policy and the
configuration file. The complete LL XML documents are then generated.
Second, the rules compare the new policy objects with previous objects. A rule is defined
for each possible change that can occur in the policy document. The condition part of the
rule detects these changes. For instance, if the priority a video flow was changed from
routine to real-time , a first rule will detect that the video flow is not part of the
routine class anymore. A second rule will detect that a new flow (video) is now part of
the real-time class.
Finally, a policy decision is generated and it consists of a provisioning instance identifier
(PRID) and an encoded provisioning instance data (EPD) [25]. The PRID corresponds to
an XPATH expression that points to the changed element in the policy document. The
when { hlPolicy: TEPolicy.TPPolicy(type=”Realtime”) llPolicy: TPPolicy(pmapList: policyMapList) policyMap: TPPolicy.PolicyMap() in pmapList } then { classMap classMap = new ClassMap(); classMap.name = "REALTIME"; classMap.marking.content = rulesProperties.getProperty("dscp.marking.realtime"); policyMap.classMapList.add(classMap); }

167
EPD contains an XML fragment that represents the new policy object. If a policy entry
has been removed, the decision consists only of the PRID with the XPATH expression
pointing to the removed element.
If this is the first document to be submitted, all low-level XML documents are fully
submitted to the PEP. If not, only the policy decisions (updates) are pushed to the PEP.
C.4 Low Level Policy All LL policies are expressed in XML and represent concrete achievable goals for
specific device (client) types. Examples of client types are firewalls, routers, and IPsec
devices. In the current system, only one client type, the WAN router, is policy-enabled.
The LL XML policies were derived from the traffic management capabilities of a router,
and greatly depend on the technology (in this case, access control, QoS, and routing
mechanisms) used to enforce the HL policy directives.
LL policies are refined from HL policies and sent to the appropriate network element
(PEP), where they are interpreted and translated into device-specific commands
(configuration information). LL policies are generic in that they are vendor-independent
and capability-specific rather than device specific. This promotes modularity and
prevents the policy system from being bound to specific vendor equipment. As a result,
configuration devices can be easily interchanged (e.g. a Cisco router can be replaced by a
Linux router), the only requirement being that the selected equipment supports the
specified capability.
The representation of the LL TP policy as defined in the policy system prototype is
included here as an example as shown in Figure C - 12 and Figure C - 13. Note that the
simulations did not include low level XML policy but instead integrated policy
enforcement directly into the service models.

168
Figure C - 12, LL TP Policy XML Representation
This diagram (output from XMLSpy [75], an XML authoring application) shows the
structure of the LL TP policy representation that is used by the proxy-PEP to enforce the
TP service. The policy is made up of an optional authorisation element used for security,
and a set of policy maps which match TP class identifiers (HL policy identifier of the
type of traffic) with the class of service (classMap) to be provided on the router. The
classMap element of the LL XML representation (expanded in Figure C - 13) defines the
DiffServ WFQ parameters including the DSCP code point marking, weighting etc. as
required.

169
Figure C - 13, LL TP XML Policy Class-map Sub-Elements
The TP LL policy was derived from the router’s QoS capabilities and in particular from
DiffServ [76]. The traffic prioritization policy specifies a traffic class set with elements to
express QoS parameters. In particular, it can be seen from that a class-map includes
notably the following three variables: a marking element that allows specification of a
DSCP code, a policing scheme that restricts the maximum bandwidth that can be used,
and a WFQ weight. The latter represents the relative weight of the class-maps between
one another. The greater the relative weight the greater fraction of the link will be used by
traffic assigned to this class.

170
Example 5
A traffic class of priority Excellent-Effort with scope Domain Critical is
assigned to an input policy-map (ingress). All traffic attached to this class is marked with
DSCP af11 . The policy also defines a traffic class of priority Mission-Essential
assigned to an output policy-map (egress). Traffic attached to this class is guaranteed a
minimum of 20% of the link capacity.
Figure C - 14, LL TP Policy Example
At the router level, TP LL policies are enforced using various QoS mechanisms such as
Class-Based Weighted Fair Queuing (CBWFQ) and Weighted Random Early Detection
(WRED).
C.5 Conclusions This appendix presented the features of a multi-level XML-based policy representation
for Policy-Enabled Traffic Engineering (PETE) management services in a maritime
environment. A multi-level XML policy representation was adopted because it provides
different levels of abstractions and makes the system easier to adapt to changes.
The high level policy is entered by the user through an interface and consists of well-
known attributes such as constraints, actions and targets but does not currently support
<TPPolicy …> … <policyMap name="INPUT_POLICY” direction="input"> <interfaceName>FastEthernet0/0 </interfaceName> <classMap name=" DomainCriticalExcellentEffort”>
<marking>af11</marking> </classMap> </policyMap> <policyMap name="Multilink1_POLICY” direction="output"> <interfaceName>Multilink1 </interfaceName> <classMap name=" ExcellentEffort”>
<weight unit="percent" type="bandwidth"><value>12</value></weight>
</classMap> </policyMap> …
</TPPolicy>

171
external events. This ensures that operators have direct control over which policy is
currently enforced. Since maritime nodes are given a dynamic level of autonomy
regarding the management services, the policy contains the concept of hierarchical scope
where the domain authority mandates or only recommends high level policy. Finally,
some conflict resolution mechanisms have been described based on the ideas of scope,
specificity, and user-based priority.
The rule-based approach was used to interpret HL policy into capability specific LL
policy variables. The complexity of the translation rules in the Policy Manager was
greatly minimized by using the ILOG rule language for the specification level policy.
This solution made the refinement from HL into capability-specific LL policies as well as
LL policies into device commands both extensible and simple to maintain. The logic is
clearly expressed in the form of if-then-else statements which makes each rule self-
contained and thus modifiable independently from one another.

172
Appendix D: Network Model Description This appendix provides a formal description of the network models developed for use in
this thesis, primarily the topology, mobility, and traffic models. This includes discussion
of the modelling choices made while implementing our OPNET simulation. In order to
explain the modelling choices, it is necessary to explain the process by which models are
created in OPNET.
In this appendix we begin with a brief introduction to the OPNET simulation
environment. This is followed by a description of the base scenario. Finally we describe
the configuration of individual simulation scenarios.
D.1 Introduction to OPNET OPNET is an object-oriented discrete event simulator (DES). As such, models of
individual network elements are defined and instrumented for statistic gathering
separately. This includes primarily node models (e.g. ship or a router) and link models
(e.g. 100M Ethernet or 802.11). Models are configurable through attributes that are
attached to individual instances of the models. It is unfortunate that the main interface
through which these attributes are defined is WYSIWYG as a complete description of all
portions of the simulation would require screen shots showing all attributes of all
elements, most of which were not altered in out simulations. Due to space limitations, we
have provided here a representative collection of the OPNET simulation levels and
provide additional material in text to provide the needed formalism.
The most fundamental element of an OPNET simulation is a scenario. In a scenario you
must completely described the network elements, their relative position and connectivity,
their trajectory (mobility), their traffic patterns and the statistical metrics to be collected
during a simulation run. Related scenarios are collected into a project. Each element in a
scenario is represented by an icon on the scenario screen. Configuration elements (such
as those defining the traffic or other global information to be used by all other elements in
the scenario) contain only attributes, while the main elements (such as nodes representing
routers, ships or workstations) also have a related model (significantly node or link

173
models) that can itself has elements that can configured and connected. These elements
are process models that contain finite state automata which encapsulate the logic and
processing of the higher level models. How such process models interact is dictated by
both the higher level node/link model and likewise the scenario configuration itself. In
our simulations, we were concerned mainly with the effect of our PETE services on
application delay. For that reason, we made few changes to the underlying process
models except at the network layer. The main exception to this was the modification to
the 802.11 model to transmit at lower speeds. For this reason our formal description here
involves mostly the configuration of existing models to simulate the maritime
environment and the PETE services.
In its simplest sense, a scenario consists of number of node models connected via link
models. All nodes must be sufficiently configured to accomplish the desired network
activity. In order to ease this burden, attributes can be configured is a special global
attribute definition node accessible by all models in the scenario. We use this to define
traffic and the QoS settings used by the TPS in order to avoid repeating the definitions in
all nodes.
As we discussed in the thesis, a number of variables were used to test the effect of the
PETE services including the network size, background traffic, and use of mobility. To
ease the modeling burden we created a base scenario for both the small and large network
capable of mobility, both traffic patterns and the use of the various PETE services. We
then simply created duplicates of the base scenario and configured the nodes in each to
make use of these variables as appropriate. For that reason we ended up with a large
number of almost identical-looking scenarios (in terms of its look on the WYSIWIG
interface), but because of the underlying changes to attributes on the nodes they
simulated the desired effects. The scenario screen for one instance of our simulation (the
small network without mobility, low background traffic, and no TPS, ARS or RRS) is
shown in Figure D - 1. We will briefly introduce these elements here and provide more
formal descriptions in the following sections.

174
Figure D - 1, Scenario for the Small Static Network with Low Background Traffic
We have chosen to show the small static network with low background traffic for
simplicity. In this configuration the network topology has been set as described in the
thesis with ships near the limit of their LOS communications range (described below with
mobility), but the three satellite capable ships connecting back to the NOC and the NOC
Network server.
Also to be seen in this scenario is the traffic profile definition, application definition,
traffic monitoring definition, policy distribute definition, and QoS configuration
definition. Each scenario must define the traffic used, while the QoS configuration is an
aid so that QoS configuration need not be entered individually on all nodes. While QoS
configuration is dealt with in the following section, a separation section deals with the
definition of traffic in our simulations.

175
In terms of network elements (node and link models), OPNET provides a wide range of
standard networking computational equipment (routers and workstations) and from this
we selected equipment that would be comparable to that available at a NOC. This
includes at high-end 7200 series Cisco router and a workstation representing the servers
and network behind the router. In order to model the ships, however, it was necessary to
create a new node model that included multiple wireless interfaces (two for LOS links).
The ships were also created with mobility, and the trajectory was defined per simulation
run. In terms of traffic applications, the background traffic was created and tuned through
configuration of existing traffic models (by changing the attributes). Two of the PETE
services, the policy distribution services and the traffic monitoring service, were modeled
as custom applications as described in the following section. These applications are then
combined into a traffic profile which defines when different application models are
active, for how long they are active, and the pattern in which they repeat over the life of
the simulation run (OPNET calls this a traffic profile). Finally, in terms of connectivity,
maritime networks are relatively straightforward since they use wireless links for their
connections. By arranging the nodes as described in the thesis and setting the distances
and transmission power levels appropriately the mobility pattern could be achieved by
adding pre-calculated trajectories appropriate for the mobility models described in the
thesis.
D.2 The Base Scenario OPNET comes with a number of models available from an object palette as shown in
Figure D-2. These include node models for traffic sources and sinks, link models for
communication links, path models for mobility, etc.

176
Figure D - 2, Object Palette
In order to model a maritime network, we decided to use standard models available in the
library as much as possible, modify models that were close to what we wanted, and to
create the models that did not previously exist. Once added these models can be edited to
add new capabilities as described in the following section.
D.2.1 NOC Node Model In Figure D-3 we show the workstation model used in our simulation. The node model is
based on the advanced ethernet workstation but has been modified to support the PETE
services. It is organised along the protocol levels with the capabilities for IP, RSVP,
applications, etc. Into this model, we added the RRS process as a client of the UDP
process which itself has a request generation client whose only purpose is to generate
requests according to the appropriate request model as described in the thesis and
configured for each scenario.

177
Figure D - 3, Workstation Node Model with RRS Capability
Each of these processes is controlled by attributes which can be edited from the scenario
interface as defined in the configuration section below.
D.2.2 Ship Node Model From this object palette you can also create custom models, which is the source of our
ship_client_adv model used in our simulations as shown in Figure D-4. Note that this
model is more complex as it includes all routing functionality as well as application
support unlike the NOC in which the functionality is split between the router and the
workstation (network).

178
Figure D - 4, The Custom ship_client_adv Node Model
This model contains 2 wireless LAN interfaces supporting the modified 802.11 process
model. The model supports the usual application and IP communication layers, supports
QoS including WFQ, and MPLS as required for the PETE services. The model also has
the modifications required to support the PETE services themselves. The OSPF process
has been modified to forward the all LSDB updates to the RRS process so that it can
detect changes in topology and update its routing and react to link failures.
D.2.3 Link Models We used two types of link model. The link between the NOC router and NOC network
router is a PPP link DS3 model with a nominal 44 Mbps throughput. This model comes
from the OPNET library and was set to operate without errors or background load other
than that being simulated. It was chosen for simplicity and since in maritime networks
this link is much faster than the long haul wireless links.
The 802.11 WLAN used between the ships and from the NOC to the ships also comes
from the OPNET library, but was modified to handle lower transmission speeds. Instead
of the standard transmission data rates, the model was set to transmit at a maximum of
either 64 kbps or 128 kbps.

179
D.3 Configuring the Scenarios In our modeling, modification of the node attributes for each duplicate scenario was
required to simulate the maritime environment. The main configuration tasks included
some static configuration that did not change between scenarios:
• initial base position of the network nodes
• configuration of OSPF (routing protocol)
and some that did change between scenarios:
• configuration of the ships’ mobility (trajectory per simulation run)
• configuration of the application traffic (background and policy distribution traffic)
Based on these parameters, a number of scenarios were created. To investigate the impact
of TMS and TPS, the mobility, traffic level, and network size were changed. ARS was
investigated as a special case of the small static network with high traffic, TMS and TPS
active at the same time. RRS was investigated for different network sizes, mobility levels
and also by varying the source of requests (either spreading requests evenly through the
network or originating from a single random source) and the request load model (the
number of requests were varied). These were controlled by the request generation
processes in the ships and NOC workstation’s load model.
In this section we describe as formally as possible the configuration of the models chosen
with some discussion as to its relevance to maritime networks in general. This includes
the base static configuration, and the per scenario configuration respectively.
D.3.1 Static Configuration The first factor to be considered for the static configuration once the models have been
developed and chosen is their orientation. Since the wireless network we are simulating is
sensitive to distances, their position is critical. As mentioned previously in the thesis, one
of the complicating factors of using OPNET to model maritime networks was the lack of
appropriate wireless link models. In order to overcome this shortfall, the 802.11 link

180
model available with OPNET on which the wireless LAN parameters are based was
modified to operate the same way but with a maximum transmission rate of 64 kbps for
LOS links. Non-overlapping frequencies were used to avoid interference between links. It
is possible to set the maximum transmission rate to any rate desired and thus could be
used for other types of network as required, though the changes here were made for the
maritime environment.
Since OPNET does not by default support the scale of maritime networks (which is
measured in nautical miles(nm)), we instead scaled our simulations to a featureless plane
approximately 2km by 2km with the small static task force centered on the exact middle,
1km from each side at reference position (0,0) using the Cartesian coordinate system. By
choosing a power setting of .001 W in the 802.11 WLAN interface, a reception range of
405m was achieved for the LOS links. In order to scale the simulation properly, it thus
required 22.5m in the simulation to 1 nm. Based on this conversion, we placed the ships
in the small network at the positions (0, 239), (239, 0), (0, -239), and (-239,0) as
measured in meters for ships 1-4 respectively. Resulting in an inter-ship distance of 338m
(15nm) as required for our simulations.
For the large network scenario, the second task group was placed a distance of 20nm
(450m) from the small network at the closest point. Since the scenario has this task group
at a 45’ angle in the 1st quadrant, the centre of the formation is at (557, 557) placing the
ships in the locations (557, 796), (796, 557), (557, 318), and (318, 557) for ships 5-8
respectively.
The second factor to be considered for the static configuration are the nodes themselves.
In order to give an idea of the range of attributes that can be changed on a node, the
categories of configurable attributes of ship 4 is shown in Figure D-5.

181
Figure D - 5, Configurable Attributes of Ship 4 (ship_client_adv node model)
In this figure, we show the node’s name, its trajectory (single instance of its mobility),
and its address directly. There are however a wide range of both software and hardware
configuration options that can be changed. For instance, ship 4 has two active wireless
LAN links (corresponding to the LOS links) that require configuration. In this case we
have configured the first LOS link to use BSS 0 without access point functionality (ship
1, the corresponding LOS end of the link, takes on this function) as shown in Figure D-6.
Physical characteristics and data rate are meaningless here as we have overridden them
with our model changes that provide a maximum 64kbps. The channel is set to 36 and the
transmit power to .001W which provides a 405m range as explained below. The
remaining attributes were left at their default value.

182
Figure D - 6, Configuration of 1st Wireless LAN interface on Ship 4
In order to activate OSPF-based routing and ensure that the RRS process received the
proper link costs for the different type of links, the various interfaces of each ship had to
be separately configured as described in the thesis. Using ship 4 again as an example, we
can see in Figure D-7 that the OSPF cost has been set to 1150 as needed.

183
Figure D - 7, OSPF configuration on ship 4
The link and networking parameters in both the small and large network have been
configured likewise for all nodes, including the NOC router.
D.3.2 Mobility Model For mobility, we generated 20 ship trajectories based on the mobility models described in
the thesis. We generate a random motion vector (x,y) for relative motion, limiting the
maximum distance traveled in the 2 minute update period to 22.5m and the maximum
total distance from the current default position to be 67.5m. The algorithm shown in
Figure D-8 was used to configure a node’s initial position and subsequent motion;

184
1. select an initial current position within 67.5m of the nodes base position (0,0)
2. for every two minute time interval t: randomly generate an angle 0-360’ and a
distance 0-22.5m (uniform distribution).
3. convert from the polar-coordinate vector to a final Cartesian (x,y) random vector.
4. repeat steps 2-3 if the current position plus the movement vector (for the moving
task force in the large network) plus the random vector is outside 67.5m from
expected location (initial position plus t*motion vector) at this time.
5. otherwise write current position plus the movement vector plus the random vector
into the trajectory file.
6. repeat steps 2-5 until t*2 (minutes) is greater than 130 (minutes), the time it takes
for two task groups in the large scenario to pass out of communications range.
Figure D - 8, Trajectory Generation Algorithm An example of the beginning on one of these trajectories for ship 4 (which has no motion
vector) is shown in Figure D-9. Note that statistics are not gathered in the first 5 minutes
of all simulations. The initial position in this case is (12.2, -5.52) relative to its initial
location, which for ship 4 is (-239, 0) giving an absolute position of (-226.8, -5.52).

185
Figure D - 9, The 19th Trajectory Generated For Ship4 In The Small Network
A similar method was used for the large network with pre-computed trajectories,
computed using a movement vector as an additional motion vector for all four moving
nodes of the second task force in the large network. The vector based in this scenario was
(-19.5m, -11.5m). This vector relates to a 2 minute time period. The advantage of using
pre-generated trajectories and initial positions is that the same mobility pattern can be
used for all simulations and will not be a variable compared to the introduced variability
being studied.
D.3.3 Traffic Configuration Once the network topology configuration was completed, the network must be loaded
with traffic. OPNET comes with a wide range of traffic models that must be configured.
Custom traffic models can also be defined. For background traffic, we defined traffic
globally using the application definition object (shown in Figure D-1) to define the
characteristics of both high and low traffic conditions for the various traffic types as
defined in the thesis. This includes the low traffic condition for email as shown as an
example in Figure D-10.

186
Figure D - 10, Background Traffic Definitions
The configuration required inter-arrival distributions, the size and sequence of packets
sent, the destination of traffic (as mentioned in the previous section, traffic profiles as
assigned to individual nodes so the traffic destinations must be matched). The traffic
generated by each of these background traffic definitions was measured as described in
Section 5.2.3 of the thesis. A formal description of the traffic models is provided in Table
D-1. Each metric followed by (E) uses an exponential distribution while metrics followed
by an (U) follow a uniform distribution
Table D - 1, Traffic Models
Traffic Type Description
Voice Call Voice calls using the G.729A encoder with 1 voice frame per packet
were used as described in the ARS simulation section
MCOIN –low Every 195s (E) receive or get (60%get) a 10kbyte file from the NOC
with priority 4 using ftp

187
MCOIN –high Every 10s (E) receive or get (60%get) a 6kbyte file from the NOC
with priority 4 using ftp
Overhead Every 13s (E) receive or get (50%get) a 1.4kbyte file from the NOC
with priority 3 using ftp
Email –low Every 270s (E) send 3 emails (4 kbytes) and receive 3 emails every
220s (E) from the NOC with priority 2
Email – high Every 120s (E) send 3 emails (4 kbytes) and receive 3 emails every
90s (E) from the NOC with priority 2
Admin –low Every 50s (E) make a 7.7 kbyte database query to the NOC with
priority 2
Admin –high Every 20s (E) make a 7.7 kbyte database query to the NOC with
priority 2
Intranet -low Every 45s (E) get a 10 kbyte page with 10 2-10 kbyte (U) images
from the NOC using http 1.1 with priority 1
Intranet –high Every 30s (E) get a 10 kbyte page with 10 2-10 kbyte (U) images
from the NOC using http 1.1 with priority 1
Internet – low Every 29s (E) get a 10 kbyte page with 10 2-10 kbyte (U) images
from the NOC using http 1.1 with priority 0
Internet – high Every 6s (E) get a 10 kbyte page with 10 2-10 kbyte (U) images from
the NOC using http 1.1 with priority 0
Music –low Every 200s (E) receive or get (75%get) a 10kbyte file from the NOC
with priority 0using ftp
Music -high Every 100s (E) receive or get (75%get) a 10kbyte file from the NOC
with priority 0using ftp

188
D.4 Conclusion In this appendix we have formally described the models used to simulate a maritime at
sea environment. The OPNET simulation environment provides a wide range of existing
models upon which we built our network topology, mobility model and traffic models.
The two topological configurations we used in the thesis (the large and the small) are
only two of any number of possible topologies of nodes on a two dimensional plane, the
outstanding characteristics of maritime networks being the almost featureless two-
dimensional plane (a lack of obstructions or three-dimensional effects), the long range of
the nodes (LOS transmission range of 18), and the relatively slow rate of movement
amongst the nodes (up to 30 nautical miles per hour). The traffic model in itself is
relatively unremarkable. The link models used are remarkable for their low bandwidth
(64kbps). This combination of a slow rate of truly constraint-free 2D mobility along with
nominal traffic and low link rates are some of the important characteristics of the
maritime environment.

189
References
[1] M. Sloman, “Policy Driven Management for Distributed Systems”, Journal of Network and Systems Management, vol. 2, no. 4, 1994, pp. 333-360.
[2] I. Labbé, F. St-Onge, D. Kidston, and J-F. Roy “A Policy System for Traffic Management in Maritime Tactical Networks”, DRDC Technical Report TR-2007-005, Jan. 2007.
[3] OPNET web site, last accessed Jun. 5, 2008, http://www.opnet.com/
[4] D. Kidston and I. Labbé, “A Service oriented Framework for Policy-Based Management of Maritime Mobile Networks”, MILCOM 2006, Washington, D.C., USA, Oct. 2006.
[5] F. St-Onge, D. Kidston, I. Labbe, “A Multi-Level Policy Representation for Management Services in Maritime Networks”, Proc Policy 2007, Bologna, Italy, Jun. 2007.
[6] I. Labbé, F. St-Onge, D. Kidston, and J-F. Roy , “Experience Applying Policy-Based Techniques to Traffic Management in Low-Bandwidth Heterogeneous Networks”, ICNSC 2007, Cap Esterel, France, Aug. 2007.
[7] D. Kidston et al, “A Policy-Based Resource Reservation Service for Maritime Tactical Networks”, MMNS, San José, California, USA Oct-Nov. 2007.
[8] D. Kidston and T. Kunz, “Using Simulation to Evaluate Traffic Engineering Management Services in Maritime Networks”, MMS 2008, Ottawa, Canada, Apr. 2008.
[9] AUSCANZUKUS Naval C4 JWID Adhoc Working Group “Multi-National Naval Task Group (MNTG) Final Report”, JWID99-R, Sep. 1999.
[10] AUSCANZUKUS “Maritime Tactical Wide Area Networking (MTWAN)”, ACP 200 (Unclassified), Washington, DC, Jul. 2003.
[11] M. Jorgenson, C. Reichelt, and T. Johnson, “Operation of the Dynamic TDMA Subnet Relay System with HF Bearers”, MILCOM 2005, Atlantic City, NJ, USA, Oct. 2005
[12] P. Holliday, “Techniques for Efficient Network Layer Failover in Maritime Tactical Wide Area Networks (MTWAN)”, MILCOM 2005, Atlantic City, NJ, USA, Oct. 2005.
[13] LCdr Sibbald, “MARPAC PacketShaper Trial Hot Wash-Up”, MARPACHQ N60 Presentation, Nov. 2004.
[14] Maritime Command Operational Information Network (MCOIN) web site, last accessed Jun. 5, 2008, http://halifax.mda.ca/projects/mcoinpage.asp
[15] R. Sanchez, J. Evans, G. Minden “Networking on the Battlefield: Challenges in Highly Dynamic Multi-Hop Wireless Networks”, MILCOM 1999, Atlantic City, NJ, USA, vol. 2, Oct-Nov 1999, pp. 751-755.
[16] M Ulema, J.M. Nogueira, and B. Kozbe, “Management of Wireless Ad Hoc Networks and Wireless Sensor Networks”, Journal of Network and Systems Management, vol. 14, no.3, Sep. 2006.
[17] R. Goode, P Guivarch, and M Stell, “Quality of Service in and IP Crypto Partitioned Network”, MILCOM 2002, Anaheim, CA, USA, Oct. 2002.
[18] J. C. Strassner, “Policy-Based Network Management: Solutions for the Next Generation”, Morgan Kaufmann Publishers, ISBN: 1-55860-859-1, Elsevier, 2004.

190
[19] H. Zhieng and M. Greis, “Ongoing Research on QoS Policy Control Schemes in Mobile
Networks”, Kluwer Press, Mobile Networks and Applications, vol. 9, p235-241, 2004.
[20] DMTF Policy Working Group charter, last accessed Jul. 11, 2006, http://www.dmtf.org/about/committees/slaWGCharter.pdf
[21] B. Moore et al, “Policy Core Information Model (PCIM) -- Version 1 Specification”, IETF RFC 3060, Feb. 2001.
[22] IETF Policy Framework Working Group web site, last accessed Jun. 5, 2008, http://www.ietf.org/html.charters/OLD/policy-charter.html
[23] A. Westerinen et al., “Terminology for Policy-Based Management”, IETF RFC 3198, Nov. 2001.
[24] D. Durham et al., “The COPS (Common Open Policy Service) Protocol”, IETF RFC 2748, Jan. 2000.
[25] K. Chan et al., “COPS Usage for Policy Provisioning (COPS-PR)”, IETF RFC 3084, Mar. 2001.
[26] B. Moore, “Policy Core Information Model (PCIM) Extensions", IETF RFC 3460, Jan. 2003.
[27] Y. Snir et al., “Policy Quality of Service (QoS) Information Model”, IETF RFC 3644, Nov. 2003.
[28] R. Neisse et al, “Unraveling the Web Services Web: and introduction to SOAP, WSDL and UDDI”, IEEE Internet Computing, vol. 4, no. 2, pp. 86-93, Mar-Apr. 2002.
[29] T. Sterkel, “Interoperability on the Pointy End of the GIG: Web Services for Tactical Battlespace Netops”, MILCOM 2005, Atlantic City, USA, Oct. 2005.
[30] M. Chamoun, R. Kilany and A. Serhrouchni, “A Semantic Active Policy-Based Management Architecture”, IP Operations and Management, Beijing, China, Oct. 2004.
[31] T. Fioreze et al. “Comparing Web Services with SNMP in a Management by Delegation Environment”, Symposium on Integrated Network Management, Nice, France, May 2005.
[32] G. Ebbut, “QinetiQ tests Maritime Tactical Network”, Jane’s Defence Weekly Magazine, vol. 41, no. 28, July 14, 2004, pp. 29
[33] M. Kazantzidis, “Mobile RF IP Network Optimizing Accelerator”, web document last accessed Sep. 12, 2008, www.virtualacquisitionshowcase.com/docs/2008/Broadata-Brief.pdf
[34] T. Henderson, “Integrated Autonomous Network Management (IANM) Multi-Topology Route Manager and Analyzer”, Office of Naval Research (ONR) Project N00014-05-C-0012 Final Report, Feb 2008, available at http://stinet.dtic.mil/cgi-bin/GetTRDoc?AD=ADA476874&Location=U2&doc=GetTRDoc.pdf
[35] D. Awduche et al., “Requirements for Traffic Engineering Over MPLS”, IETF RFC 2702, Sep. 1999.
[36] E. Rosen, A. Viswanathan, and R. Callon, “Multiprotocol Label Switching Architecture”, IETF RFC 3031, Jan. 2001.
[37] R. Braden et al., “Resource ReSerVation Protocol (RSVP) -- Version 1 Functional Specification”, IETF RFC 2205, Sep. 1997.
[38] D. Awduche et al., “RSVP-TE: Extensions to RSVP for LSP Tunnels”, ITEF RFC 3209, Dec. 2001.

191
[39] D. Katz, K. Kompella, and D. Yeung, “Traffic Engineering (TE) Extentions to OSPF”,
IETF RFC 3630, Sep. 2003.
[40] D. Barsaleau and M. Tummala, “Testing of DiffServ Performance over a U.S. Navy Satellite Communication Network”, MILCOM 2004, Monterey, CA, Oct-Nov. 2004.
[41] M. Welzl, L. Franzens, and M. Muelhaeuser, “Scalability and Quality of Service: A Trade-Off?”, IEEE Communications Magazine, Jun. 2003, pp. 32-36.
[42] Y. Dong, D. Makrakis and T. Sullivan, “Effective Admission Control In Multihop Mobile Ad Hoc Networks”, ICCT 2003, Beijing, China, Apr. 2003
[43] S-B. Lee, G-S. Ahn, and A. Campbell, “Improving UDP and TCP Performance in Mobile Ad Hoc Networks with INSIGNIA”, IEEE Communications Magazine, Jun. 2001, pp. 156-165.
[44] G-S. Anh et al. “Supporting Service Differentiation for Real-Time and Best Effort Traffic in Stateless Wireless Ad Hoc Networks (SWAN)”, IEEE Transactions on Mobile Computing, vol. 1, no. 3, Jul-Sep. 2002.
[45] H. Xiao et al. “A Flexible Quality of Service Model for Mobile Ad hoc Networks” VTC 2000, Tokyo Japan, vol 1, May 2000, pp. 445-449.
[46] Y. Guo, F, Kuipers and P. Mieghem, “Link-Disjoint Paths for Reliable QoS Routing”, International Journal of Communication Systems 2003, vol. 16, pp. 779-798.
[47] G. Alandjani and E. Johnson, “Fuzzy Routing in Ad Hoc Networks”, IEEE Conference on Performance Computing and Communications, Apr. 2003.
[48] S. Chen and K. Nahrstedt, “Distributed Quality of Service Routing in Ad Hoc Networks”, IEEE Journal on Sleected Areas oin Communications, vol.17, no.8, Aug. 1999, pp. 1488-1505.
[49] R. Badonnel, R. State, and O. Festor, “Management of Mobile Ad Hoc Networks: Information and Probe-based Architecture”, International Journal of Network Management 2005, vol. 15, pp 335-347.
[50] J. Conover, “Policy-Based Network Management”, Network Computing, Nov. 1999. available at http://www.networkcomputing.com/1024/1024f1.html
[51] CiscoWorks QoS Policy Manager web site, last accessed Jun. 5, 2008, http://www.cisco.com/en/US/products/sw/cscowork/ps2064/index.html
[52] N. Dulay, E. Lupu, M Sloman, N. Damianou, “A Policy Deployment Model for the Ponder Language”, IM’2001, Seattle, May 2001.
[53] Ponder2 web site, last accessed Jun. 5, 2008, http://ponder2.net/ [54] K. Phanse, L. DeSilva, “Protocol Support for Policy-Based Management of Mobile Ad-
Hoc Networks”, Proc. NOMS 2004, Seoul, Korea, Apr. 2004.
[55] L. DaSilva et al, “Network Mobility and Protocol Interoperability in Ad Hoc Networks”, IEEE Communications Magazine, vol. 42, no. 11, Nov. 2004, p88-96.
[56] R. Chadha et al, “Policy Based Mobile Ad Hoc Network Management”, Proc. POLICY 2004, Jun. 2004.
[57] R. Chadha et al. “Scalable Policy Management for Ad hoc Networks”, Proc. MILCOM 2005, Atlantic City, NJ, Oct. 2005.

192
[58] R. Neisse et al, “Unraveling the Web Services Web: and introduction to SOAP, WSDL and
UDDI”, IEEE Internet Computing, vol. 4, no. 2, pp. 86-93, Mar-Apr. 2002.
[59] R. Chadha, “A Cautionary Note About Policy Conflict Resolution”, MILCOM 2006, Washington, D.C., USA, Oct. 2006.
[60] T.R. Andel and A. Yasinsac, “On the Credibility of MANET Simulations”, IEEE Computer Magazine, vol. 39, no. 7, Jul. 2006, pp. 48-54
[61] S. Kurkowski, T. Camp, and M. Colagrosso, “MANET Simulation Studies: The Incredibles,” SIGMobile Mobile Comm. Rev., vol. 9, no. 4, 2005, pp. 50-61.
[62] L. Felipe-Perrone, D.M. Nicol, and Y. Yuan, “Modeling and Simulation Best Practices for Wireless Ad Hoc Networks”, Winter Simulation Conference 2003, New Orleans, USA, Dec. 2003.
[63] M. Sanchez and P. Manzoni “ANEJOS: A Java-based simulator for ad-hoc networks”, Future Generation Computer Systems Magazine, vol. 17, no. 5, Mar. 2001, pp. 573 - 583.
[64] Office of Naval Research, “Consolidated Satellite Communications Apertures”, ONR Broad Agency Announcement ONR 07-018, available at http://www.onr.navy.mil/02/baa/docs/baa_07_018.pdf
[65] D. Kidston, “A Policy-Based Resource Reservation Service for Maritime Tactical Networks”, CRC Report CRC-RP-2006-03, Dec. 2006.
[66] E. W. Dijkstra, “A note on two problems in connexion with graphs” In: Numerische Mathematik. vol. 1, 1959, pgs 269-271.
[67] G-S. Ahn, A. T. Cambell, S-B Lee, X. Zhang, “INSIGNIA”, IETF internet draft (expired) draft-ietf-manet-insignia-01, Oct. 1999.
[68] M.Hartley, “Bell irks ISPs with new throttling policy”, Globe and Mail Newspaper, March 25, 2008 available at http://www.theglobeandmail.com/servlet/story/RTGAM.20080325.wgtinternet26/BNStory/Technology/home
[69] B. Doshi et al. “Cooperative Service Level Agreement”, MILCOM 2006, Washington D.C., Oct. 2006.
[70] Y. Morgan and T. Kunz, “A Proposal for an Ad-hoc Network QoS Gateway”, WiMob 2005, Montreal, Canada, Aug. 2005, pp. 221-228.
[71] ITU-T, "M.3400 TMN management functions", 1997.
[72] H. Mungla and F. Krief, “Conflict Detection and Resolution in QoS Policy Based Management”, PIMRC 2005, Berlin, Germany, Sep. 2005.
[73] J. Moffett and M Sloman, “Policy Hierarchies for Distributed Systems Management”, IEEE JSAC Special Issues on Network Management, vol. 11, no. 9, Dec. 1993.
[74] ILOG JRules Web Site, last accessed Jul. 11, 2006, http://www.ilog.com/products/jrules/
[75] Altova XMLSpy Web Site, last accessed Aug. 20, 2008. http://www.altova.com/products/xmlspy/xml_editor.html
[76] K. Nichols et al. “Definition of the Differentiated Services Field (DS Field) in the IPv4 and IPv6 Headers”, RFC 2474, Dec. 1998.