policy framework for greening transportation in georgia jen jungeun oh september 28, 2012 world bank...
TRANSCRIPT

Policy Framework for Greening Transportation in Georgia
Jen JungEun OhSeptember 28, 2012
World BankSustainable Development Department

1. Framing the Policy Questions
2. Defining Goal, Principle, and Instruments
5. Road Map for Framework Implementation
3. Policy Framework for Greening Transportation
4. Economic, Environmental Benefits of Green Transport Framework

Defining green transportation in Georgian context
Reduced Fossil Fuel
Consumption
Minimized Impacts on the Global and Local
Environment (GHG, local emissions)
Increased Reliance on Indigenous,
Clean Energy Sources
Green Transportation in Georgian Context
Reduced Road
Congestion
Improved Balance of Trade and
Energy Security
Co-benefits

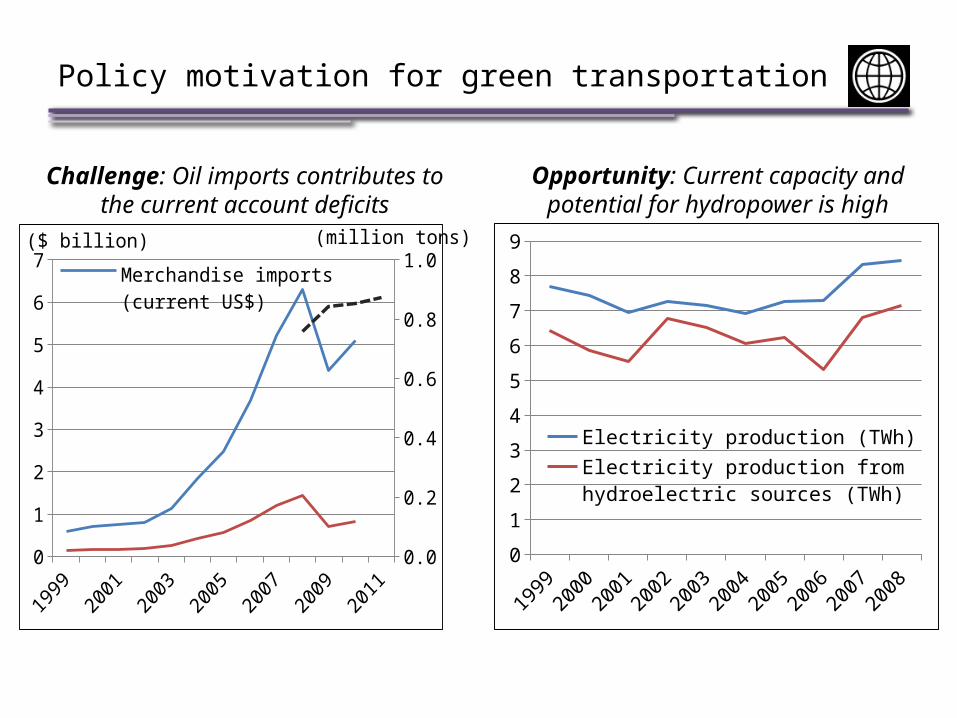
Policy motivation for green transportation
• Transport sector’s contribution to economic growth– Export competitiveness– Lower prices of goods for Georgian customers– Competitive position in international transshipment– Attraction to tourist destinations– Improved regional integration– Improved access to market and services of rural communities– Catalysis for service sector development
Good connectivity and low cost transportation brings economic benefits
Policy motivation for green transportation
0
1
2
3
4
5
6
7
0.0
0.2
0.4
0.6
0.8
1.0Merchandise imports (current US$)Fuel imports (current US$)
(million tons)($ billion)
19992000
20012002
20032004
20052006
20072008
0
1
2
3
4
5
6
7
8
9
Electricity production (TWh)Electricity production from hydroelectric sources (TWh)
Challenge: Oil imports contributes to the current account deficits
Opportunity: Current capacity and potential for hydropower is high

Policy motivation for green transportation
• Road transport accounts for major share of emissions
SO2 Emissions by Sector
CO Emissions by Sector NO Emissions by Sector
PM10 Emissions by Sector
Road Transport
Industry
Energy

Rationale for Government involvement
Vehicle ownership growth trajectories vary greatly at same income level
20102012
20142016
20182020
20222024
20260
50
100
150
200
250
300Private Car ownership per 1000 persons
High (>250)
Medium (≈220)
Low(<200)
Possible trajectories of motorization rate growth in Georgia

Rationale for Government involvement
• Lock-in effect of infrastructure investments– Transport infrastructure determines long-term trajectory of
travel and land-use patterns and transportation costs
• Market failure exists in transport sector– External costs: congestion, local emissions, GHG emissions– Appropriate intervention by Government can correct the
distortion

1. Framing the Policy Questions
2. Defining Goal, Principle, and Instruments
5. Road Map for Framework Implementation
3. Policy Framework for Greening Transportation
4. Economic, Environmental Benefits of Green Transport Framework

Goal and Principle
• Goal: “to reduce the total cost of transportation including all direct and indirect costs, while maintaining total social welfare benefits”
Influencing ChoicesMaking green transport
attractive to users (demand side)
Improving ChoicesMaking green transport
available to users (supply side)
• Principle: Influence and improve choices (without undermining the market economy)

Instruments: how to influence/improve
Institutions and Planning
High-level policy
integration
Spatial planning
Strategic transport planning
Regulations
Fuel quality standards
Vehicle technical standards
Enforcement
Fiscal Policy and Pricing
Taxes and subsidies
Explicit pricing of externalities
Technology and Infrastructure
Greener modes of transport
Infrastructure network and connectivity
Advanced vehicle
technologies

1. Framing the Policy Questions
2. Defining Goal, Principle, and Instruments
3. Policy Framework for Greening Transportation
A. Integrate Environmental Concerns into Transport Policies
5. Road Map for Framework Implementation
4. Economic, Environmental Benefits of Green Transport Framework

Why this measure?
• No environmental objectives in transport policies
• A regulatory framework is not being enforced
• Local emissions vary by fuel quality and vehicle standards
• Environmental policies should aim to curtail emissions at source
Euro 1 Euro 2 Euro 3 Euro 4 Euro 5 Euro 60
0.2
0.4
0.6
0.8
1
1.2
1.4
1.6PC Diesel
PC Gasoline
LCV Diesel
LCV Gasoline
HC
+ N
Ox
Emis
sion
(g/k
m)
European Union Vehicle Emission Standards for HC and NOx

How can this be done?
Institutions and Planning Regulations and Enforcement
Fiscal Policy and Pricing
Integrate transport policy and environmental monitoring
Reinstate fuel quality inspection
Revise taxes on motor fuels to be differentiated by quality as incentives for cleaner fuel choices
Maintain high fuel prices relative to income levels as a long-term policy

1. Framing the Policy Questions
2. Defining Goal, Principle, and Instruments
5. Road Map for Framework Implementation
3. Policy Framework for Greening Transportation
B. Achieve and Maintain a Greener Vehicle Fleet
4. Economic, Environmental Benefits of Green Transport Framework

Why this measure?
• Dominance of second-hand vehicles and lack of vehicle standards enforcement
Vehicle fleet age is significantly higher in Georgia than in EU-27
All ve-hicles
Cars Buses Trucks0
5
10
15
20
25
30
35
Georgia EU-27
Vehicle fleet ownership will grow much faster as income grows

How can this be done?
Institutions and Planning
Regulations and Enforcement
Fiscal Policy and Pricing
Investments
Strengthen institutions for effective enforcement
Expand vehicle inspection requirements to include all commercial and non-commercial vehicles
Scrap and recycle the old and polluting vehicle fleet
Tax credits and other financial incentives for higher fuel-efficiency and technological improvements of vehicles
Subsidize the scrapping and recycling of old and polluting vehicles

1. Framing the Policy Questions
2. Defining Goal, Principle, and Instruments
3. Policy Framework for Greening Transportation
C. Promote Low Emission Freight Transport Modes
5. Road Map for Framework Implementation
4. Economic, Environmental Benefits of Green Transport Framework

Why this measure?
• Transit traffic is increasing; share of rail transit decreasing
Growing share of transit cargo of total international road transport
Decreasing share of rail transport of total transit cargo
2006 2007 2008 2009 20100
1
2
3
4
0%
10%
20%
30%
40%
50%
60%
0.8 1.1 1.4 1.5Transit
1.7
0.91.1
1.2 1.2
Import1.3
0.2
0.20.2 0.2
Export 0.142%44%
50% 51%54%Share of transit cargo
Cargo Transport by Road (million tons)
Rail
Road Ra
il
Road Ra
il
Road Ra
il
Road Ra
il
Road
2006 2007 2008 2009 2010
0
2
4
6
8
10
0%
10%
20%
30%
40%
50%
60%
70%
80%
90%
Transit
Import
Export
81% 78% 78%
65% 64%
Cargo Transport (million tons)
Share of rail of total transit

Why this measure?
Vehicle Emission Class
Truck charges per kilometer (in EURO)Austria Switzerland Georgia
2-axle 3-axle 4+ axle 2-axle 3-axle 4+ axle No classification
EURO 0–II 0.187 0.262 0.393 0.460 0.767 1.022
0.188EURO III 0.399 0.664 0.886EURO IV–V 0.165 0.231 0.347
0.339 0.564 0.752EURO EEV 0.150 0.210 0.315EURO VI 0.145 0.203 0.305
2004 2005 2006 2007 2008 2009 201002468
101214161820
0
50
100
150
200
250
300
Dry cargo
Liquid cargo
Container cargo
(thousand TEU)
(million tons)
Containerized cargo volume handled in Georgian seaports has increased rapidly

How can this be done?
Institutions and Planning
Regulations and Enforcement
Fiscal Policy and Pricing
Investments
Develop a coherent transport policy that focuses on intermodality and international collaboration with key trading partners and neighboring countries
Apply vehicle inspection regime to domestically registered trucks and to Georgian transport companies
Introduce and enforce regulations on vehicle emissions and axle loads for foreign registered transit vehicles
Differentiate charges on transit trucks according to vehicle emission class and axle loads
Allocate revenues to the maintenance of road network assets and green transport investments
Develop multimodal, green transit corridors by improving intermodal connectivity, eliminating bottlenecks and supporting containerization

1. Framing the Policy Questions
2. Defining Goal, Principle, and Instruments
3. Policy Framework for Greening Transportation
D. Support Commercial Development of Intercity Passenger Transport
5. Road Map for Framework Implementation
4. Economic, Environmental Benefits of Green Transport Framework

Why this measure?
• Under-regulated/underdeveloped intercity passenger transport market offers inferior service quality (lack of safety, environmental damage)
• Lack of intercity transportation options hinder future tourism potential
• Foreign transport services companies reaping benefits from the increasing number of visitors
• Clean and high-quality intercity bus services can compete with private road transport

How can this be done?
Institutions and Planning Regulations and Enforcement
Investments
Improve the convenience of and access to intercity bus services through coordinated marketing strategy and passenger information services
Control market entry through regulations and enforcement of vehicle and emission standards
Introduce competitive tendering for strategic intercity routes and manage service quality
Improve quality of infrastructure and consumer amenities through public and private investments

1. Framing the Policy Questions
2. Defining Goal, Principle, and Instruments
3. Policy Framework for Greening Transportation
E. Transform Minibuses, Taxis into Modern Urban Transport Modes
5. Road Map for Framework Implementation
4. Economic, Environmental Benefits of Green Transport Framework

Why this measure?
• Minibuses generate local emissions, congestion
• Contractual arrangement is not conducive to competition and long-term sustainability
• Unregulated taxi market contributes to negative externalities
• These modes need to be integrated into coherent public transport services
Minibuses fleet in Georgia is old and getting older over time
<5 5-10 11-15 16-20 >200%5%
10%15%20%25%30%35%40%45%
20052010

How can this be done?
Institutions and Planning Regulations and Enforcement
Investments
Develop a strategic vision and strengthen market competition for minibuses and taxis
Develop a strategy for coherent multimodal public transport system
Minibus market: introduce competitive tendering and gross-cost based contracting
Taxi market: introduce partial regulations that control fare and quality but allow free market-entry
Refrain from direct budgetary support for vehicle improvement
Oblige commercial entities to maintain their vehicle fleet quality

1. Framing the Policy Questions
2. Defining Goal, Principle, and Instruments
3. Policy Framework for Greening Transportation
F. Support Sustainable Development of Urban Transport
5. Road Map for Framework Implementation
4. Economic, Environmental Benefits of Green Transport Framework

Why this measure?
• High energy consumption of Tbilisi transport sector

Why this measure?
Very low charges or other restriction on parking in Tbilisi city center
Inverse correlation between energy consumption and density
0
1
2
3
4
5€/hr

How can this be done?
Institutions and Planning
Regulations and Enforcement
Fiscal Policy and Pricing
Investments
Develop a national-level urban transport policy framework
Institute integrated city development and transport planning
Make private car use less convenient by introducing parking restrictions in urban centers
Make private car use more expensive through appropriate forms of road user charges
Invest in high-quality and competitive alternatives to private transport
Introduce intelligent transportation systems for efficient traffic management and better user services in urban areas

1. Framing the Policy Questions
2. Defining Goal, Principle, and Instruments
4. Economic, Environmental Benefits of Green Transport Framework
3. Policy Framework for Greening Transportation
5. Road Map for Framework Implementation

Business-as-usual vs. Green Transportation
Indicators Business-as-usual
Green Transportation
Moderate Aggressive
Total vehicle-km on road (million) 258,235 249,319 (-4%) 244,075 (-6%)Total fuel consumption (thousand tons) 23,492 21,746 (-7%) 21,667 (-8%)Total fuel costs, excluding electricity (million GEL)a 96,226 87,434 (-9%) 87,331 (-9%)
Total electricity use (GWh) 46,249 63,255 (+37%) 75,992 (+64%)Total passenger-km by road (million) 730,502 664,955 (-9%) 689,451 (-6%)Total passenger-km by rail and electric public transport (million) 30,490 62,600 (+105%) 77,633 (+155%)
Total ton-km by road (million) 524,924 489,010 (-7%) 453,096 (-14%)Total ton-km by rail (million) 154,504 190,420 (+23%) 226,335 (+47%)Total CO2 emissions (thousand tons) 71,793 68,996 (-4%) 66,455 (-7%)Total CO emissions (thousand tons) 1,200 392 (-67%) 941 (-22%)Total VOC emissions (thousand tons) 178 82 (-54%) 131 (-26%)Total NOx emissions (thousand tons) 458 351 (-23%) 406 (-11%)

Business-as-usual vs. Green Transportation
• Motor fuel consumptions
0.0
0.2
0.4
0.6
0.8
1.0
1.2
1.4
1.6
1.8
2.0
2.2HCV LCV PC
3W 2W
million tons / year
0.0
0.2
0.4
0.6
0.8
1.0
1.2
1.4
1.6
1.8
2.0
2.2HCV LCV PC
3W 2W
million tons / year
Business-as-usual Green Transportation

Business-as-usual vs. Green Transportation
• CO2 EmissionsBusiness-as-usual Green Transportation
0.0
1.0
2.0
3.0
4.0
5.0
6.0
7.0HCV LCV PC3W 2W
million tons / year
0.0
1.0
2.0
3.0
4.0
5.0
6.0
7.0HCV LCV PC3W 2W
million tons / year

Fiscal implications
• Reduction in fuel imports would lead to reduction of the current account deficits
• Can be designed not to undermine the small government philosophy– Income (households) and cost (firms) effects of fiscal measures
can partly be compensated– Revenues can be allocated for development of green transport
modes– Compensated by reducing taxes that have negative effects on
economic growth

1. Framing the Policy Questions
2. Defining Goal, Principle, and Instruments
4. Economic, Environmental Benefits of Green Transport Framework
3. Policy Framework for Greening Transportation
5. Road Map for Framework Implementation
Phased implementation of priority actions (1)
• Short-Term (2012-2014): Institutional Capacity and Preparatory Tasks– Strengthen the institutions and policies at national and
municipal level– Carry out preparatory work and studies for medium-term
actions, including• Assessment of appropriate levels of transit truck charges• Green logistics study: feasibility of transshipment facilities• Strategy for intercity passenger transport• Strategy for minibus reform, taxi regulations• Urban transport strategic plans in cities other than Tbilisi• Alternative analysis / feasibility studies for public transport modes
in Georgian cities, including trams, ropeways, LRT, BRT

Phased implementation of priority actions (2)
• Medium-Term (2015-2020): Enforcement, Market Reforms, and Infrastructure– Implement the improved regulatory framework– Promote market competition through key sub-sector reforms– Develop infrastructure for lasting transformation
• Long-Term (2020 and after): Transformation– Transform mobility using advanced technologies– Shape green mobility patterns

THANK YOU