policy information report how teachers … · 2016-05-09 · degrees, archie lapointe and i express...
TRANSCRIPT

How Teachers Compare:The Prose, Document, and Quantitative Skills of America’s Teachers
POLICY INFORMATION REPORT
POLICY INFORMATION CENTERResearch Division
Educational Testing ServicePrinceton, New Jersey 08541-0001

1
CONTENTS
Preface . . . . . . . . . . . . . . . . . . . . . . . . . . . . . . . . . . . . . . . . 2
Acknowledgments . . . . . . . . . . . . . . . . . . . . . . . . . . . . . . . . 2
Summary and Highlights . . . . . . . . . . . . . . . . . . . . . . . . . . . 3
Introduction . . . . . . . . . . . . . . . . . . . . . . . . . . . . . . . . . . . . 4
Measuring Literacy . . . . . . . . . . . . . . . . . . . . . . . . . . . . . . . 6
Evaluating the Literacy of America’s Teachers . . . . . . . . . . . . 14
Comparing Teachers to the General Population . . . . . . . . 14
Comparing Teachers to Other College-Educated Adults . . 16
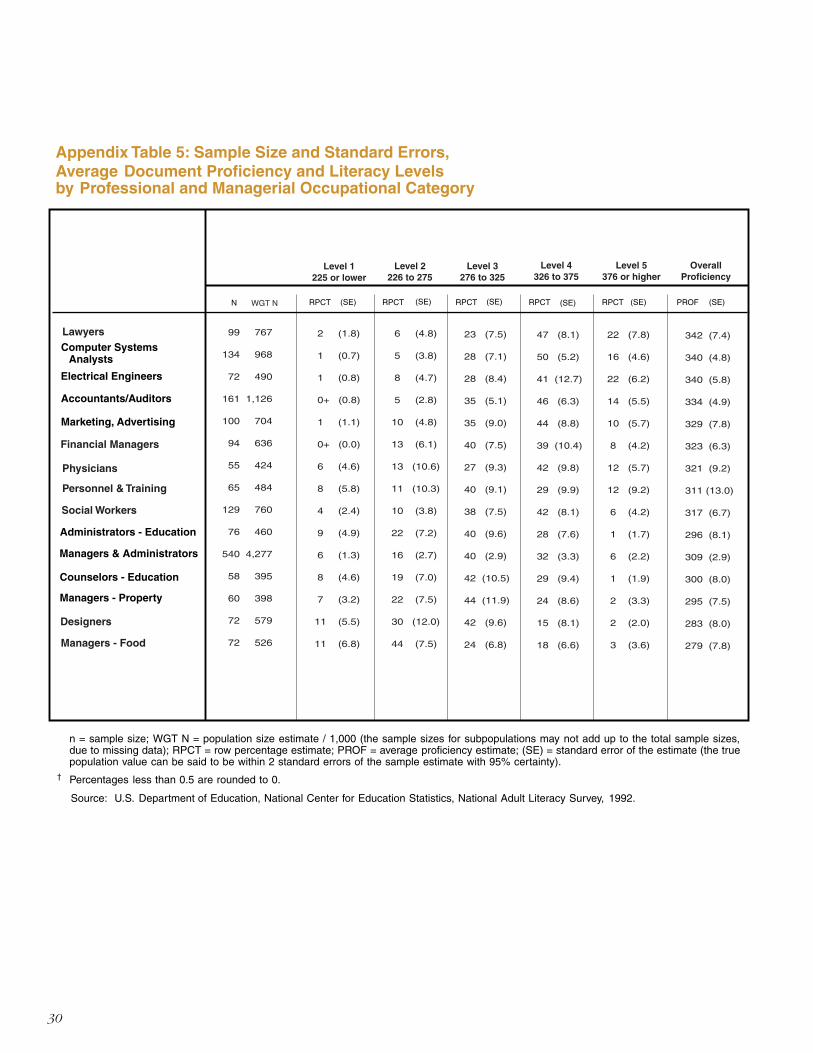
Comparing Teachers to Other Professional and Managerial Occupations . . . . . . . . . . . . . . . . . . . . . . . . . 18
The Relationship Between Literacy and Income. . . . . . . . . . 22
Conclusion . . . . . . . . . . . . . . . . . . . . . . . . . . . . . . . . . . . . . 25
Appendix Tables . . . . . . . . . . . . . . . . . . . . . . . . . . . . . . . . . . 26
This report was written by:
Barbara A. BruschiRichard J. ColeyEducational Testing Service
The views expressed inthis report are those of theauthors and do not necessar-ily reflect the views of theofficers and trusteesof Educational TestingService.
Additional copies of thisreport can be ordered for $10.50(prepaid) from:
Policy Information CenterMailstop 04-REducational Testing ServiceRosedale RoadPrinceton, NJ 08541-0001(609) 734-5694Internet - [email protected]
Copies can also be downloadedfrom www.ets.org/research/pic
Copyright © 1999 by Educa-tional Testing Service. All rightsreserved. Educational TestingService is an Affirmative Action/Equal Opportunity Employer.The ETS logo is a registeredtrademark of Educational TestingService. The modernized ETSlogo is a trademark of Educa-tional Testing Service.
February 1999

2
PREFACE ACKNOWLEDGMENTS
The data in this report arefrom the National AdultLiteracy Survey (NALS)conducted by the NationalCenter for EducationStatistics of the U.S.Department of Education.
The authors thankJoan Baratz-Snowdenof the American Federa-tion of Teachers; RonaldD. Henderson of theNational EducationAssociation; MaryRollefson of the U.S.Department of Educa-tion; and Drew Gitomer,Howard Wainer, HaroldWenglinsky, and KentaroYamamoto of EducationalTesting Service for theirthoughtful reviews. Thesereviewers may not agreewith all of the views andinterpretations containedin this report.
The authors also thankNorma Norris for expertlyanalyzing NALS data,Carla Cooper for doingthe desktop publishing,Janet Spiegel for editing,Ricardo Bruce for design-ing the report’s cover, andJim Chewning for coordi-nating production.
As education becomesever more important tothe American public,teachers become evermore scrutinized — atbest they have been castas reticent participants ineducation reform efforts.More recently, however,teachers are being viewedas key to any effort ateducation reform.
SAT scores of college-bound seniors who indi-cate that they intend tomajor in teacher educationare found to be lower, onaverage, than their class-mates’ scores — but theacademic abilities of thosewho actually make it intothe classroom are nottracked. Controversialresults from a teacherlicensing test in Massachu-setts have added fuel to thefire, creating disturbingnational headlines andincreasing the level ofteacher scrutiny.
Valid data about howteachers compare topeople in other occupa-tions are hard to come by.Indeed, how do wecompare the quality ofnurses, social workers,dentists, and lawyers?Their capability is thesum of their personalqualities, education,experience, and motiva-tion, to name just a fewfactors. No single measureof one dimension can
possibly be adequate forsuch a judgment.
That said, a nationalsurvey is available thattells us how “literate” —using a broad definition— the nation’s adults are.The National AdultLiteracy Survey (NALS) isdescribed in this report byauthors Bruschi andColey. By paring downthe critical question tohow well teachers candeal with prose, docu-ment, and quantitativeproblems that are regu-larly encountered in theworkplace and daily life,we can see how teacherscompare with otheradults, to adults withcomparable educationlevels, and to otherprofessionals and manag-ers, as well as how muchpeople at different levelsof literacy are paid.
In How TeachersCompare, Bruschi andColey analyze the NALSdata to describe the prose,document, and quantita-tive literacy of America’steachers and comparethem to the literacy ofother adults. One willlearn from this reportthat teachers comparewell, although they dovary considerably — asdo individuals in alloccupations, professionaland otherwise.
The reader may notalways be impressed withthe overall level of theliteracy skills displayedby adults, or collegegraduates, or teachers,or people in other profes-sions. In a report issued afew years ago, Learning byDegrees, Archie Lapointeand I express concernabout the frequentlymodest performance ofmany college graduates inNALS. Of course, we alsorecognize that manypeople do not put forththeir best efforts on theassessments in these kindsof studies, since nothing isat stake. It is more likelythat comparative perfor-mance — of the kindpresented in this report —tells us more than abso-lute performance.
How Teachers Com-pare has no pretension ofsettling the debate overthe quality of America’steaching force; but it doespresent carefully collectedinformation that permitsaddressing some impor-tant questions. And thedata presented compareexceedingly well to thatwhich have been care-lessly used in a greatmany stories aboutteachers’ capabilities.
Paul E. Barton, DirectorETS Policy InformationCenter

3
SUMMARY AND HIGHLIGHTS
Education reform iscurrently unfolding acrossthe nation, and teachersand teaching are in thespotlight. Concerns aboutteacher quality abound,fed most recently byresults from the Massachu-setts teacher licensing test.
While many haveblamed teachers for whatthey consider low achieve-ment among Americanstudents, people aresteadily realizing that,because of student demo-graphics and teacherretirements, schools willhave to hire some 2million new teachers overthe next decade or so.On top of that, there ismomentum in many statesto reduce class size, and atthe same time, apply morerigorous standards tothose entering the teach-ing profession.
There is simply noescaping the fact thatteachers will play a majorpart in solving the nation’seducation problems.Capable teachers produceachieving students, so it isimportant to know howcapable our teachers are.One source of suchinformation is theNational Adult LiteracySurvey (NALS), whichprovides measures ofliteracy — across prose,document, and quantita-tive scales — and allowsus to compare literacylevels of teachers with
those of other adults.This report presentsresults from thesecomparisons:
● As a group, teachersscore relatively highin prose, document,and quantitativeliteracy; there are nosignificant differencesin scores betweenmale and femaleteachers or betweenelementary andsecondary teachers.
● About half of teachersscore at Levels 4 and5 (the two highestlevels) on the threeliteracy scales, com-pared to about 20percent of otheradults nationwide.
● On average, teachersperform as well asother college-educatedadults across all threeliteracy scales. Teacherswith four-year degreesperform similarly toothers with four-yeardegrees, and teacherswith graduate studiesor degrees performat a comparable levelto other adults withgraduate studiesor degrees.
● In prose literacy,teachers score higher,on average, thanmanagers andadministrators, real
estate and food servicemanagers, and design-ers. They perform ata similar level withlawyers, electricalengineers, accountantsand auditors, market-ing professionals,financial managers,physicians, personneland training profes-sionals, social workers,and education adminis-trators and counselors.Only computer systemsanalysts score signifi-cantly higher in proseliteracy than teachers.
● In document literacy,teachers performabout the same asin prose literacy,except that they alsoscore lower thanelectrical engineers.
● In quantitative literacy,teachers are outper-formed by electricalengineers, lawyers,accountants andauditors, and computersystems analysts — allpeople who representquantitative andanalytic occupations.They perform compa-rably to other managersand professionals, andoutscore real estate andfood service managersand designers.
● Overall, weekly wagesincrease with the levelof literacy for both
teachers and othercollege-educatedadults. However, thereare differences inearnings betweenteachers and othercollege graduates ateach level of literacy.For example, teachersscoring at Level 5 onthe prose scale earn$574 a week, com-pared to $796 a weekearned by other collegegraduates at that level.
● There are large differ-ences in earningsbetween teachers andother managerial andprofessional workers.Teachers rank near thebottom of the list.
The NALS datapresent teachers as a labormarket bargain, compar-ing favorably with otherprofessionals in theirliteracy skills, yet earningless. We need to abandonstereotypes about teachersthat have gained cur-rency, such as thatteachers are less ablethan others who go intoprofessions commonlyregarded as more presti-gious. And we needto recognize that we payteachers considerably lessthan other professionalswith comparable capaci-ties for dealing withprose, document, andquantitative literacy tasks.

4
INTRODUCTION
1 Recruiting New Teachers Inc., The Essential Profession: A National Survey of Public Attitudes Toward Teaching, Educational Opportunity and SchoolReform, Belmont, MA: 1998. (http://www.rnt.org/tep.html).
2 National Commission on Teaching and America’s Future, What Matters Most: Teaching for America’s Future, September 1996 and The EducationTrust, Good Teaching Matters: How Well-Qualified Teachers Can Close the Gap, Education Trust, Summer 1998.
3 Jeff Archer, “States Raising Bar for Teachers Despite Pending Shortage,” Education Week, March 25, 1998.4 For a review, see Mary R. Rollefson and Thomas M. Smith, “Do Low Salaries Really Draw the Least Able Into the Teaching Profession?,” in D.M.
Byrd and D.J. McIntyre (eds.), Research on the Education of Our Nation’s Teachers: Teacher Education Yearbook V, Corwin Press, 1997.5 Kerry A. White, “Massachusetts Reacts to More Test Data; Teacher Proposal Outlined,” Education Week, August 5, 1998.
Nine out of 10 Americansbelieve that the best way toimprove student achieve-ment is to have a qualifiedteacher in every classroom.Results from a landmarkpublic-opinion poll,conducted by RecruitingNew Teachers Inc. (RNT)and public opinion analystLouis Harris, support thegrowing sentiment amongeducators and policy-makers that the quality ofAmerica’s teaching force iskey to its meeting the goalsof educational reform.1
Once the issue ofstudent safety is addressed,the public believes thatensuring teacher quality isthe most important way toimprove education today— more important thanstandards, tests, vouchers,privatization, or schooluniforms. And this per-ception is supported byrecent research showingthat teachers’ expertise isindeed linked to higherstudent achievement.2 Soteachers are being viewedas part of the solution tothe nation’s educationalproblems, rather than asa cause of them.
This recognitioncomes at an especiallyimportant time inour history. The U.S.Department of Educa-tion estimates that wewill need some 2 millionnew teachers over thenext decade as schoolenrollment increases andmany of our currentteachers retire. There arealready some problemsfinding qualified teachersin bilingual education,special education, math-ematics, and science.And some school dis-tricts, particularly thosethat enroll students withthe most educationalneed, have problemsattracting teachers.
Against this back-drop, states and teachercertification bodies areraising the bar forteacher quality to newheights, in a flurry ofteacher testing activity.Most states now requirepotential teachers to passa test before beingadmitted into a teachereducation program and/or before being certifiedto teach. States such as
Georgia, Ohio, andPennsylvania are in theprocess of raising cutoffscores on their certifica-tion tests. New Hamp-shire is beginning to testpotential teachers for thefirst time, while Virginiarecently set the highestcutoff in the country forentry into teaching.3
As the nation movesto increase the quality ofthe teaching force, theconventional wisdom isthat many of our teachersare drawn from thebottom of their highschool and college classes.New opportunities inother fields for minorityand female collegegraduates have contrib-uted to cutting off amajor pipeline of teach-ing talent. Research fromthe 1980s suggests thatindividuals with lessacademic ability enterand continue through theteacher education pipe-line and remain inteaching. According tothis research, at eachstage — from selectingeducation as a collegemajor, to enrolling
in teacher education,to applying for andaccepting a teaching job,to deciding to maketeaching a career —those with higher testedabilities leave or decidenot to enter teaching.4
Much of the negativeevidence about teacherquality is based on therelatively low averageSAT scores of college-bound seniors who saythey will major ineducation. Of course, wedo not know what majorthese students actuallyend up pursuing incollege, if they did entera teacher educationprogram, or whetherthose who do pursueteaching ever becometeachers. More recent,negative evidence comesfrom states like Massa-chusetts, where highfailure rates at most ofthe state’s collegesand universities on anew exam for teacherlicensing has ruffled thefeathers of state policy-makers and madenational headlines.5

5
Other research hasfound only small differ-ences in ability scoreswhen comparing formerteachers to those whoremained in teaching.6
This research did find thatthose who entered teach-ing, but not immediatelyafter college, and thosewho left teaching butreturned later, had higherscores. Additionally, thereis increasing evidence thatsome new teachers comefrom supply sources otherthan traditional teachereducation programs andthat these other sourcesmay bring individuals ofhigher ability levels intothe classroom.7
Recent research paintsa somewhat differentpicture. Rather thanteachers in general beingviewed as mediocre, thepublic, including teachers,has been recognizing thatthere are merely a fewineffective teachers whoshould be removed. In fact,one study found that 85percent of the public truststeachers to make soundeducational decisions.8
The RNT and Harrispoll cited earlier providessupport for this perspec-tive. It found that about70 percent of respondentsconsidered their com-munity’s teachers either“highly qualified” or“well qualified.” And ina recent survey by theAmerican Federation ofTeachers, teachers indi-cated that only 5 percentof their colleagues arepoor teachers.9
Whatever evidence ordata people examine, theycan reasonably concludethat there is room forimprovement and moreaccountability in teaching.Many initiatives are beingdeveloped and continue atthe federal, state, andinstitutional levels toaddress teacher qualityissues at each stage of theteacher education, certifi-cation, and professionaldevelopment process.
Why all thismatters, of course, isbecause we believe themore academicallytalented a teacher is, themore his or her students
will learn. What we havelacked is a uniformmeasure of academicability for the nation’steachers. The 1992National Adult LiteracySurvey (NALS) providessuch a measure and allowsus to compare teacherswith other occupations.Prose literacy is providedby NALS and is one ofthe best available mea-sures of verbal ability, afactor identified byresearch as being associ-ated with teacher qual-ity.10 NALS also allows usto examine the earningsof teachers compared toother workers withsimilar occupationsand levels of education.
* * * *The purpose of this
report is to:
● describe the prose,document, and quanti-tative literacy of thenation’s teachers
● compare the literacylevels of teachers withthose of other adults
6 Barbara Heyns, “Educational Defectors: A First Look at Teacher Attrition in NLS-72,” Educational Researcher, 17(3), 24-32, 1988.7 An example of a nontraditional program is Troops to Teachers, launched by the U.S. Department of Defense in 1994, which helps people who
leave military service to secure teaching jobs. In the past four years, some 3,000 people from all branches of the armed services and the CoastGuard have found jobs as teachers, primarily in the 20 states with the most military bases. Districts in California, Florida, Georgia, Texas, andVirginia have hired hundreds of veterans for their classrooms. The recruits are much more likely than traditional applicants to be male, members ofminority groups, willing to work in hard-to-staff urban and rural schools, and qualified to teach mathematics, science, and special education(“Expiring ‘Troops to Teachers’ Project Outfits Classrooms with Professionals in Demand”, Education Week, October 14, 1998).
8 J. Johnson and J. Immerwahr, First Things First: What Americans Expect from Public Schools, Public Agenda Foundation, 1994.9 American Federation of Teachers, Teacher Quality and Tenure: AFT Teachers’ Views — 1997.10 Linda Darling-Hammond and L. Hudson, Indicators of Teacher and Teaching Quality, RAND, 1986.
and with other adultswho have similar levelsof education
● compare the literacylevels of teacherswith those of people inother managerial andprofessional occupations
● compare the wagesof teachers with thoseof people in othermanagerial and profes-sional occupations
Before turning to theresults, we provide a briefdescription of the NationalAdult Literacy Survey.

6
MEASURING
LITERACY
11 NALS was funded by the U.S. Department of Education and administered by Educational Testing Service,in collaboration with Westat Inc. The first volume in the series offers an overview of the results. See IrwinS. Kirsch, Ann Jungeblut, Lynn Jenkins, and Andrew Kolstad, Adult Literacy in America: A First Look at theResults of the National Adult Literacy Survey, prepared by Educational Testing Service for the NationalCenter for Education Statistics, U.S. Department of Education, September 1993. Additional NALSreports offer a more detailed look at particular issues, including literacy in the workforce, literacy andeducation, literacy among older adults, literacy in the prison population, literacy and cultural diversity, andliteracy practices.
This section of thereport describes NALSand its definition ofliteracy. NALS providesthe most detailed portraitthat has ever been avail-able on the conditions ofliteracy in the UnitedStates — and on theunrealized potential ofthe nation’s citizens.11
For the 1992 survey,trained staff interviewednearly 13,600 individualsage 16 and older, whowere randomly selected torepresent the U.S. adultpopulation; state samplesand a sample of federaland state prison inmatespushed the final numberof individuals surveyed tomore than 26,000. Eachparticipant was asked tospend about an hourresponding to a series ofdiverse literacy tasks, aswell as to questions abouthis or her demographiccharacteristics, educa-tional background,reading practices, andother areas relatedto literacy.
To analyze theliteracy skills of teachers,
or of any other group,it is first necessary todefine what is meant by“literacy.” The term isoften used as the oppo-site of “illiteracy,” whichis typically interpretedto mean not being ableto read at all, decode theprinted word, or com-prehend what is written.But literacy has a muchricher and deepermeaning than that. Itsdictionary definitionsrange from being able toread and write, to beinga well-informed, edu-cated person, to beingfamiliar with literature.
NALS was guidedby the following defini-tion of literacy, adoptedby a broadly representa-tive group of experts:
Using printed andwritten information tofunction in society, toachieve one’s goals, andto develop one’s knowl-edge and potential.
NALS focusedon three areas of lit-eracy proficiency —
prose, document,and quantitative.
Prose literacy — theknowledge and skillsneeded to understandand use informationfrom texts that includeeditorials, news stories,poems, and fiction; forexample, finding a pieceof information in anewspaper article,interpreting instructionsfor a warranty, inferringa theme from a poem,or contrasting viewsexpressed in an editorial.
Document literacy —the knowledge and skillsrequired to locate anduse information con-tained in everydaymaterials such as jobapplications, payrollforms, transportationschedules, maps, tables,and graphs; for example,locating a particularintersection on a streetmap, using a scheduleto choose the appro-priate bus, or enteringinformation on anapplication form.

7
Quantitative literacy —the knowledge and skillsrequired to apply arith-metic operations, eitheralone or sequentially,using numbers embeddedin printed materials; forexample, balancing acheckbook, figuring out atip, completing an orderform, or determining anamount of interest froma loan advertisement.
Based on their perfor-mance on the literacytasks, respondents wereassigned scores on thethree proficiency scales,each ranging from 0 to500. While most previousstudies of literacy haveattempted to identify thenumber of “illiterates,”the goal of NALS wasdifferent — to profile thenation’s literacy skills.Thus, there is no singlepoint on the literacy scalethat separates illiteratesfrom literates, per se.Rather, each scale isdivided into five levelsof proficiency, eachencompassing a rangeof scores.
Level 1 - scores from 0 to 225
Level 2 -scores from 226 to 275
Level 3 -scores from 276 to 325
Level 4 -scores from 326 to 375
Level 5 -scores from 376 to 500
Individuals scoringwithin one of these scalelevels have a high prob-ability of performing thetasks at that level suc-cessfully.12 Those whoperformed at Level 1demonstrated the lowestliteracy proficiencies,while those at Level 5displayed the highestproficiencies. Similarly,the tasks that character-ized Level 1 were theleast challenging in theassessment, while thoseassociated with Level 5were the most difficult.
Sample tasks areprovided here to illus-trate the types of literacyskills exhibited by thosewho performed at eachlevel. To avoid excessivedetail, we have onlyprovided example tasksfor prose literacy.Readers who would like
to know more about thetasks or see additionalexamples should refer toother NALS reports.13
LEVEL 1Prose. What does it
mean to score at Level 1?Some individuals scoringat this level on the prosescale demonstrate theability to read relativelyshort pieces of text, suchas a brief newspaperarticle, to find a pieceof information that isidentical to or synony-mous with informationgiven in a directive.Typically, little or nodistracting information(information that seemsplausible but is incorrect)is present in such tasks.Individuals who performat Level 1 may succeedin prose tasks that askthem to:
● identify a countrymentioned in a shortarticle (score of 149)
● locate a piece ofinformation in a sportsarticle (score of 210)
● underline a sentenceexplaining the action
stated in a short article(score of 225)
Document. Someindividuals who score atLevel 1 are able to locatea piece of informationbased on a literal matchbetween the directiveand the document, aslong as little, if any,distracting informationis present. Some adultsat this level also displaythe ability to enter basicinformation aboutthemselves onto anapplication form orother type of document.Specifically, individuals atLevel 1 may be able to:
● sign their name on abrief form (score of 60)
● locate a meetingtime on a form(score of 180)
● use a pie chart tolocate a type of vehiclethat had a givennumber of sales(score of 214)
Quantitative. Someindividuals who score atLevel 1 demonstrate theability to perform single,
12 A high probability is defined as at least 80 percent of the time. Individuals would have a small chance of performing tasks at a higher level.13 See the original NALS report cited in footnote 11. A summary is also provided in Paul E. Barton, Becoming Literate About Literacy, Policy
Information Report, ETS Policy Information Center, 1994.

8
relatively simple arith-metic operations, such asaddition. The numbers tobe used in such tasks areprovided, and the opera-tion to be performed isspecified. Those scoring atthe lowest level on thequantitative scale may beable to:
● total a bank depositentry (score of 191)
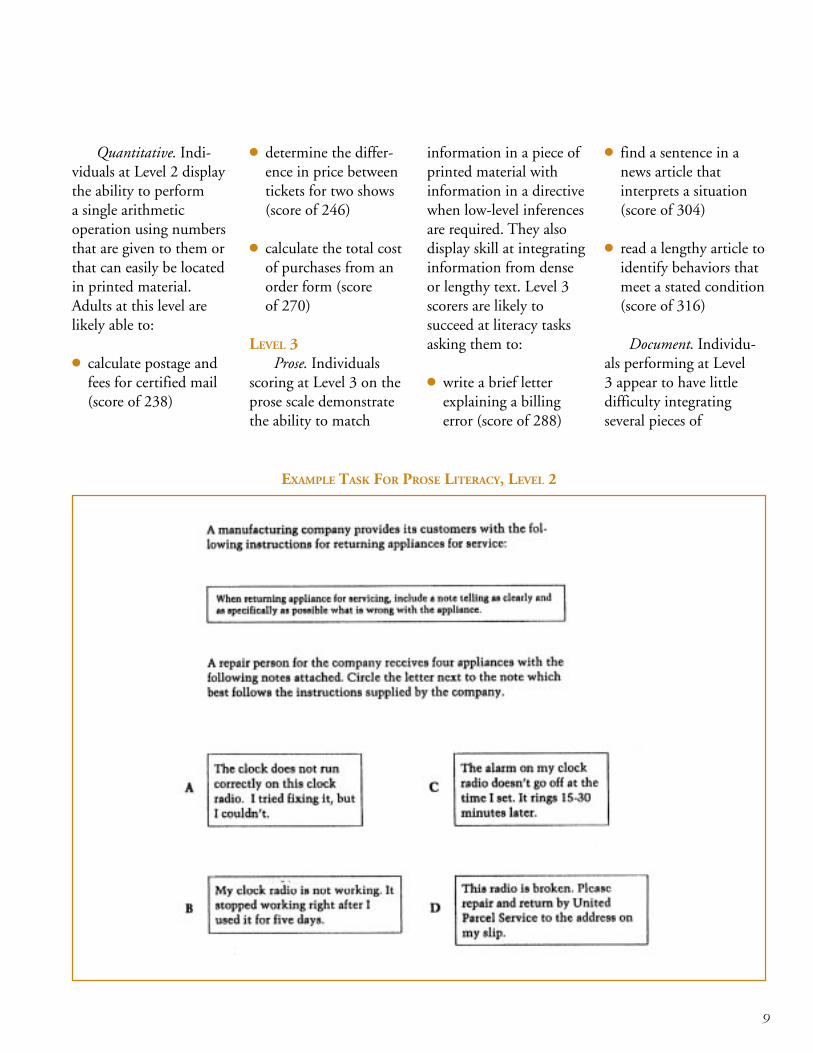
LEVEL 2Prose. Individuals
scoring at this level on theprose scale demonstratethe ability to locate apiece of information in a
piece of text even whendistracting informationis present. They alsoappear to have littledifficulty integrating,comparing, and con-trasting two or morepieces of informationfound in printed mate-rial. Individuals at thislevel are likely to besuccessful on literacytasks that ask them to:
● underline the mean-ing of a term in abrochure on govern-ment benefits (scoreof 226)
● locate two types ofinformation in a sportsarticle (score of 250)
● interpret instructionsfrom an appliancewarranty (score of275)
Document. Thosescoring at Level 2 on thedocument scale displayskill at matching a pieceof information in a formor other type of docu-ment with information ina directive, even whendistracting informationis present. Low-level
inferences are sometimesrequired in performingsuch tasks. In addition,individuals at Level 2 arelikely able to:
● locate an intersectionon a street map (scoreof 230)
● locate eligibilityinformation in a tableof employee benefits(score of 246)
● identify and enterbackground informa-tion on a SocialSecurity card applica-tion (score of 259)
Underline the sentence that tells what Ms. Chanin ate during the swim.
EXAMPLE TASK FOR PROSE LITERACY, LEVEL 1
9
Quantitative. Indi-viduals at Level 2 displaythe ability to performa single arithmeticoperation using numbersthat are given to them orthat can easily be locatedin printed material.Adults at this level arelikely able to:
● calculate postage andfees for certified mail(score of 238)
● determine the differ-ence in price betweentickets for two shows(score of 246)
● calculate the total costof purchases from anorder form (scoreof 270)
LEVEL 3Prose. Individuals
scoring at Level 3 on theprose scale demonstratethe ability to match
information in a piece ofprinted material withinformation in a directivewhen low-level inferencesare required. They alsodisplay skill at integratinginformation from denseor lengthy text. Level 3scorers are likely tosucceed at literacy tasksasking them to:
● write a brief letterexplaining a billingerror (score of 288)
● find a sentence in anews article thatinterprets a situation(score of 304)
● read a lengthy article toidentify behaviors thatmeet a stated condition(score of 316)
Document. Individu-als performing at Level3 appear to have littledifficulty integratingseveral pieces of
EXAMPLE TASK FOR PROSE LITERACY, LEVEL 2

10
information from one ormore documents. Theyalso display skill at usingand interpreting rathercomplex tables andgraphs containinginformation that is eitherirrelevant or inappropri-ate to the task. Adults atthis level can:
● identify informationin a bar chart show-ing energy sourcesfor various years(score of 277)
● enter informationinto an automobilemaintenance recordform (score of 323)
Quantitative. Indi-viduals at Level 3 dem-onstrate skill at perform-ing tasks in which twoor more numbers mustbe found in a piece ofprinted material to solvean arithmetic problem.The mathematicaloperation(s) to beperformed can bedetermined from theterms used in the direc-tive. Some of the tasks inthis level involve the useof a calculator. Adults atLevel 3 are likely able to:
List two things that Chen became involved in or has done to help resolve conflictsdue to discrimination.
EXAMPLE TASK FOR PROSE LITERACY, LEVEL 3

11
● calculate the differencebetween the regularand sale prices of anitem in an advertise-ment (score of 278)
● determine the discountfrom an oil bill if paidwithin 10 days (scoreof 308)
● calculate miles pergallon using informa-tion from a mileagerecord chart (scoreof 321)
LEVEL 4Prose. Individuals
scoring at this leveldisplay the ability tomatch multiple piecesof information in a pieceof writing. Further, theyappear to be able tointegrate or synthesizeinformation from com-plex or lengthy pieces oftext and to make complexinferences about whatthey read. They are likelyto succeed at tasks thatask them to:
● state in writing anargument made in alengthy newspaperarticle (score of 328)
● contrast viewsexpressed in twoeditorials on fuel-efficient cars (scoreof 359)
● compare two meta-phors used in a poem(score of 374)
Document. Individu-als at Level 4 are able tomake high-level infer-ences to interpret varioustypes of documents. Theyalso appear to have littledifficulty performingtasks that involve the useof conditional informa-tion. They are likelyable to:
● use a table to identifythe percentage of casesthat meet specifiedconditions (scoreof 342)
Contrast Dewey’s and Hanna’s views about the existence of technologies that can be used to produce morefuel-efficient cars while maintaining the size of the car.
EXAMPLE TASK FOR PROSE LITERACY, LEVEL 4

12
● use a schedule todetermine which bus totake in a given situation(score of 352)
● use a table to identify apattern of oil exportsover time (score of 352)
Quantitative. Indi-viduals at this level havelittle difficulty performingtwo or more arithmeticoperations in a sequence.They can also performsingle arithmeticoperations in which thequantities are found indifferent types of displays,or in which the operationsmust be inferred from theinformation given or fromprior knowledge. Theseindividuals are likely tosucceed when asked to:
● use information in anews article to calculatehow much moneyshould go to raising achild (score of 350)
● use an eligibilitypamphlet to calculatehow much money acouple would receivefor basic supplementalsecurity income in oneyear (score of 368)
Identify and summarize the two kinds of challenges that attorneys use whileselecting members of a jury.
EXAMPLE TASK FOR PROSE LITERACY, LEVEL 5

13
LEVEL 5Prose. Individuals
at this level have littledifficulty finding infor-mation in dense text thatcontains a considerableamount of distractinginformation. They canalso make high-levelinferences and use special-ized background knowl-edge to help them under-stand what they read.Level 5 scorers cansucceed at tasks askingthem to:
● compare theapproaches stated in anarrative on growingup (score of 382)
● summarize two ways inwhich lawyers maychallenge prospectivejurors (score of 410)
● interpret a brief phrasefrom a lengthy newsarticle (score of 423)
Document. Theseindividuals have theability to search throughcomplex displays thatcontain several piecesof distracting informa-tion. They also havelittle difficulty makinghigh-level inferences andusing specialized back-ground knowledge tointerpret information
in documents. They arelikely able to:
● use information in atable to complete agraph, includinglabeling the axes(score of 378)
● use a table to comparecredit cards, identifytwo categories ofcomparison, and writeabout the differences(score of 387)
● use information from atable to write a para-graph about a schoolsurvey (score of 395)
Quantitative. Indi-viduals at this level canperform multiple arith-metic operations sequen-tially. They are also ableto find the features ofproblems in a piece ofprinted material and touse their backgroundknowledge to determinethe quantities or opera-tions needed. People atthis literacy level are likelyto succeed with tasksthat ask them to:
● use an order form tocalculate the shippingcosts and total costs ofitems (score of 382)
● use information from anews article to calculatethe difference in timesfor completing a race(score of 405)
● use a calculator tofigure the total costof carpet for a room(score of 421)

14
As seen in the previoussection of this report,NALS collected informa-tion on multiple dimen-sions of literacy. Like-wise, there are multipleways to view thesurvey’s results.
What measure ofliteracy should be used?Average or mean literacyscores are useful mea-sures that can quicklyconvey an overall senseof how one groupperforms compared toanother. But whileuseful, averages or meansprovide an incompletepicture of the distribu-tion, or range, ofachievement acrossdifferent groups ofpeople, and can maskimportant differences.
To illustrate thisrange, we also presentdata on the percentagesof adults who performedat each of the five lit-eracy-scale levels. First,we examine the literacylevels of teachers along-side those of the entireadult population.
COMPARING TEACHERS
TO THE GENERAL
POPULATION
Like any large groupof people measured ona broad scale, teachersexhibit a considerablerange of performance onthe three literacy scales.The largest group ofteachers (about 40percent) scores at Level 4on all three scales. Thenext largest group (about34 percent) scores atLevel 3. Somewherearound 10 percent scoresat Level 5, and a minutepercentage (about 1percent) scores at Level1.14 These data can beseen in Figure 1.
Fortunately, NALShas a large enoughsample of teachers toallow us to examine theliteracy levels of differentgroups of teachers. Figure1 compares male andfemale teachers andelementary and second-ary teachers, showingthat there are no statisti-cally significant scoredifferences between thosein either grouping.For this reason, in the
rest of this report’s com-parisons, we present datafor teachers as a whole.15
Figure 2 comparesthe average scores ofteachers to those of thetotal population acrossall three literacy scalesand shows teachers’scores as significantlyhigher. For example, theaverage prose literacyscore for teachers was330 — 58 points higherthan the average score forthe total population(more than a standarddeviation). Although thismarked the largestdifference in scores,teachers also performedsignificantly better onthe document andquantitative scales.
Teachers also weremore likely to score atthe highest levels on eachof the literacy scales. Forexample, while onlyabout 3 percent of thepopulation scored atLevel 5, about 10 percentof teachers scored at thatlevel. About half of U.S.teachers scored at Levels4 and 5, compared toabout 20 percent of the
EVALUATING THE
LITERACY OF
AMERICA’STEACHERS
14 Standard errors and sample sizes are provided in the appendix.15 Teachers were defined as Pre-K, K, elementary, secondary, and special education teachers.

15
Figure 1: Distribution of Prose, Document, and Quantitative Literacy of Teachers,by Category
Source: U.S. Department of Education, National Center for Education Statistics, National Adult LiteracySurvey, 1992

16
total population. At theother end of the scale,about 22 percent of thepopulation scored at Level1, the lowest level ofliteracy, while only 1percent to 2 percent ofteachers performed at thislevel. Teachers did best onthe prose literacy scale,with 57 percent scoring atLevels 4 and 5. These dataare shown in Figure 3.
COMPARING TEACHERS
TO OTHER COLLEGE-EDUCATED ADULTS
We might expectteachers to perform betteron literacy tasks than thetotal adult population,because teachers havemore education — andwe know that educationis related to literacy. Buthow do teachers compareto adults with similarlevels of education?Figure 4 compares theaverage prose, document,
Figure 2: Average Prose, Document, andQuantitative Literacy Scores of TeachersCompared to Those of the Total AdultPopulation
Figure 3: Literacy Levels of TeachersCompared to Those of the Total AdultPopulation
Source: U.S. Department of Education, National Centerfor Education Statistics, National Adult Literacy Survey,1992
Source: U.S. Department of Education, National Centerfor Education Statistics, National Adult Literacy Survey,1992

17
and quantitative literacyscores of teachers with afour-year college degreebut no graduate studies(about one-quarter of theteachers in the NALSsample) to the scores ofU.S. adults with the sameeducational level. Therewere no statisticallysignificant differences inperformance between thetwo populations.
We can also look atFigure 5 and examine thedistribution across literacy
levels for both groups.For teachers and otheradults with a four-yearcollege degree, about 75percent scored at Levels 3and 4, and about 10percent scored at Level 5.Overall, in fact, thedistribution acrossliteracy levels was quitesimilar for both groups.
How do teachers withgraduate studies orgraduate degrees compareto adults with similarlevels of education? As
Figure 4: Average Prose, Document, andQuantitative Literacy Scores of TeachersWith a Four-Year Degree Compared toThose of All Adults With a Four-Year Degree
Source: U.S. Department of Education, National Centerfor Education Statistics, National Adult Literacy Survey,1992
Figure 5: Literacy Levels of TeachersWith a Four-Year Degree Compared toThose of All Adults With a Four-Year Degree
Source: U.S. Department of Education, National Centerfor Education Statistics, National Adult Literacy Survey,1992

18
Figure 6: Average Prose, Document, andQuantitative Literacy Scores of TeachersWith Graduate Studies or Degree Com-pared to Those of the Total Adult Popula-tion With Graduate Studies or Degree
Source: U.S. Department of Education, National Centerfor Education Statistics, National Adult Literacy Survey,1992
shown in Figure 6,teachers with graduateeducation had averagescores across all threeliteracy scales that werebasically the same asthose of other adultswith graduate education.Almost two-thirds ofthe NALS sample ofteachers reported havingeither graduate studies ora graduate degree.
Looking at Figure 7,we can compare the
distributions of these twogroups across literacylevels and see that theyare quite similar. Morethan half of both groupsscored at Levels 4 and 5.
COMPARING TEACHERS
TO OTHER PROFESSIONAL
AND MANAGERIAL
OCCUPATIONS
NALS askedrespondents to indicatetheir current or mostrecent job and sorted the
Figure 7: Literacy Levels of TeachersWith Graduate Studies or Degree Com-pared to Those of All Adults With GraduateStudies or Degree
Source: U.S. Department of Education, National Centerfor Education Statistics, National Adult Literacy Survey,1992

19
resulting informationinto occupationalcategories, using theCensus Classification forIndustries and Occupa-tions. These categorieswere then combinedinto four occupationalgroupings, one of whichwas termed “managerial,professional, or techni-cal.” This categorycontained teachers,computer systemsanalysts, lawyers, etc.,and scored highestamong the occupationalcategories across allthree literacy scales.We now compare theperformance of U.S.teachers to that ofother professionals.
Figure 8 shows thecomparison for proseliteracy. The blackhorizontal bars representthe confidence intervalsaround the averagescores for each occupa-tion; the shaded verticalarea represents theconfidence band forteachers’ scores, allowingthem to be easily com-pared to those of otherprofessionals. Only thehorizontal bars that donot touch the verticalshaded area representsignificantly differentscores from teachers,from a statistical per-spective.
Note: Occupations in bold type have average scores that are statistically signifi-cantly different from teachers. While other score differences may appear large, theyare not statistically significant. Bars represent the confidence intervals around theaverage scores. The vertical shaded area represents the confidence band forteachers’ average score and is intended to facilitate comparisons.
Source: U.S. Department of Education, National Center for Education Statistics,National Adult Literacy Survey, 1992
Figure 8: Average Prose Literacy Scores of Teachers Comparedto Other Managers and Professionals
20
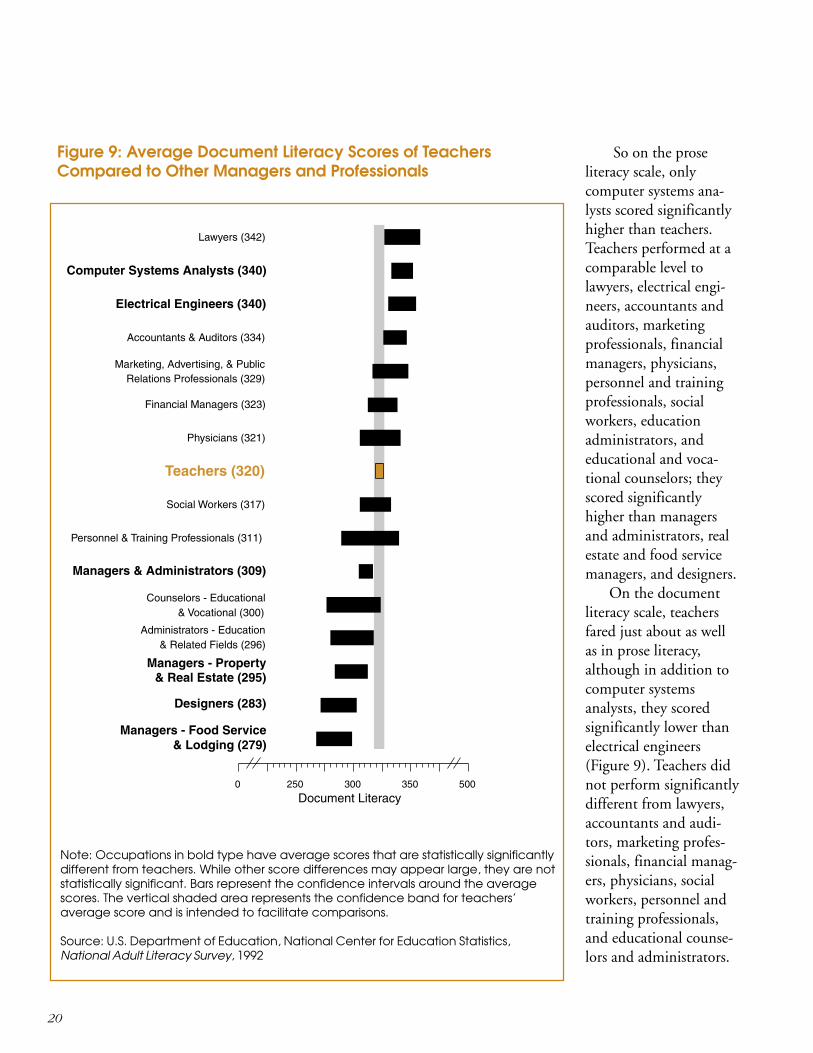
So on the proseliteracy scale, onlycomputer systems ana-lysts scored significantlyhigher than teachers.Teachers performed at acomparable level tolawyers, electrical engi-neers, accountants andauditors, marketingprofessionals, financialmanagers, physicians,personnel and trainingprofessionals, socialworkers, educationadministrators, andeducational and voca-tional counselors; theyscored significantlyhigher than managersand administrators, realestate and food servicemanagers, and designers.
On the documentliteracy scale, teachersfared just about as wellas in prose literacy,although in addition tocomputer systemsanalysts, they scoredsignificantly lower thanelectrical engineers(Figure 9). Teachers didnot perform significantlydifferent from lawyers,accountants and audi-tors, marketing profes-sionals, financial manag-ers, physicians, socialworkers, personnel andtraining professionals,and educational counse-lors and administrators.
Note: Occupations in bold type have average scores that are statistically significantlydifferent from teachers. While other score differences may appear large, they are notstatistically significant. Bars represent the confidence intervals around the averagescores. The vertical shaded area represents the confidence band for teachers’average score and is intended to facilitate comparisons.
Source: U.S. Department of Education, National Center for Education Statistics,National Adult Literacy Survey, 1992
Figure 9: Average Document Literacy Scores of TeachersCompared to Other Managers and Professionals

21
On the other hand, theysignificantly outper-formed managers andadministrators, real estateand food service manag-ers, and designers.
Teachers scored leastwell in the quantitativearea, significantly belowelectrical engineers,lawyers, accountants andauditors, and computersystems analysts (peoplein highly quantitative andanalytic fields). Much liketheir performance on theprose and documentscales, however, teachersperformed comparably tothe other managers andprofessionals in thiscategory and outscoreddesigners and real estateand food service manag-ers. These comparisonsare shown in Figure 10.
Figure 10: Average Quantitative Literacy Scores of TeachersCompared to Other Managers and Professionals
Note: Occupations in bold type have average scores that are statistically significantlydifferent from teachers. While other score differences may appear large, they are notstatistically significant. Bars represent the confidence intervals around the averagescores. The vertical shaded area represents the confidence band for teachers’average score and is intended to facilitate comparisons.
Source: U.S. Department of Education, National Center for Education Statistics,National Adult Literacy Survey, 1992

22
THE
RELATIONSHIP
BETWEEN
LITERACY AND
INCOME
NALS found a strongrelationship betweenliteracy and earnings. Onaverage, individuals withhigher levels of literacywere more likely thanothers to earn higherwages, to be employedmore weeks per year, andto be employed inmanagerial and profes-sional occupations.
Here we examinehow teachers’ wagescompare to those ofother college-educatedadults at each level ofliteracy. We also comparethe median weekly wagesof teachers to the wagesof other occupationswithin the managerial/professional category.
Figure 11 shows themedian weekly wagesearned by teachers andother college-educatedadults at each of the fiveliteracy levels. Level 1data have not beenincluded, since samplesizes are too small topermit reliable estimates.
In general, for bothgroups, earnings increasewith the level of literacy.What the bars also show,however, is that there aredifferences in earningsbetween teachers andother college graduates ateach literacy level. Forexample, teachers scoring
Figure 11: Median Weekly Wages forTeachers and Other College Graduates,by Literacy Level
N/A - insufficient sample sizes to permit reliable estimates.Note: * indicates a statistically significant difference inwages at that level. While other differences may appearlarge, they are not considered statistically significantbecause of small cell sizes and large standard errors.
Source: U.S. Department of Education, National Centerfor Education Statistics, National Adult Literacy Survey,1992

23
at Level 5 on the prosescale earned $574 a week,compared to $796 a weekearned by other collegegraduates, a statisticallysignificant difference.
Finally, there aredifferences in averageearnings between teachersand other managerial andprofessional workers.Median weekly wages areshown in Figure 12.Teachers appear near thevery bottom of the list,earning a median wage ofabout $500 a week.16 Sowhile teachers’ averageliteracy compares favor-ably with the averageliteracy of most otherprofessional and manage-rial occupations, theircompensation fallsfar short.
A 1998 report bythe Organization forEconomic Cooperationand Development(OECD) supports thisobservation and providesmore current data. Thereport discloses that theUnited States devotes asmaller percentage of itsnational income to
Source: U.S. Department of Education, National Center for Education Statistics,National Adult Literacy Survey, 1992
Figure 12: Median Weekly Wages of Teachers Comparedto Other Managers and Professionals
16 We recognize that higher-salary occupations, like lawyers and physicians, require professional degrees and advanced training. Teachers also workfewer weeks per year than other professionals. On average, teachers in the NALS study reported working 45 weeks per year, compared to 49 to 50for most other professionals.

24
teachers’ salaries thanother countries. Anexperienced high schoolteacher in the UnitedStates earns 1.2 times thegross domestic product(GDP) per capita. Amongthe 29 OECD members,only the Czech Republic,Hungary, and Norwaypay their high schoolteachers less when mea-sured as a percentage oftheir GDPs. In Germany,Ireland, South Korea, andSwitzerland, amongothers, teachers earn atleast twice the GDP percapita. Moreover, theaverage teacher salary inthe United States issignificantly below that ofother university gradu-ates. In many othercountries — such asAustralia, France, andBritain — teacher salariesare actually higher thanthe salaries of otheruniversity graduates.Making matters worse,demands on teachers’time in the United Statesare extremely high. Infact, the OECD report
states, the amount oftime a typical U.S.middle school teacherspends in front of aclassroom per year is 964hours, among the highestin OECD countries.17
17 Ethan Bronner, “Other Countries Catching up to U.S. in Education, Study Finds,” The New York Times, November 24, 1998.

25
CONCLUSION This analysis has providedinformation that can beused to make somejudgments about thecapabilities of teachers indealing with prose,document, and quantita-tive problems. Whileteachers display a consid-erable range of such skills(as all groups do), on thewhole they perform verywell. And contrary topopular media accounts,teachers perform about aswell as other adults withsimilar levels of educa-tion. Across all threeliteracy scales — prose,document, and quantita-tive — teachers performsignificantly higher thanthe general adult popula-tion and score at similarlevels to other college-educated adults.
Teachers also performwell compared to otheradults employed inprofessional and manage-rial jobs. The NationalAdult Literacy Surveyshowed that, in prose anddocument literacy, teach-ers scored significantlyhigher than professionalsin several occupations andwere outperformed onlyby computer systemsanalysts in prose literacy
and by electrical engineersand computer systemsanalysts in documentliteracy. Teachers per-formed least well onthe quantitative scale;however, most of whomthey scored below wereprofessionals employedin quantitativelyoriented fields.
Finally, teachers earnless than other profession-als, on average, even whenthe number of weeksworked per year is takeninto account. A recentanalysis by the Organiza-tion for Economic Coop-eration and Developmentsupports this finding andalso concludes that teach-ers’ salaries in the UnitedStates lag behind those inother countries, while U.S.teachers’ workloads areoften greater.
The National AdultLiteracy Survey providesthe first opportunity toanswer several importantquestions: How literateare America’s teachers?How do teachers compareto others with comparableeducation levels? How doteachers compare withother professionals?
While the NALSstudy is not necessarily
the best measure ofteachers’ professionalabilities, it does measureteachers’ skills in handlingprose and documents of awide variety, as well asquantitative problemsencountered in daily life.What we can take awayfrom this analysis is theassurance that our teach-ers measure up well withthose in other professionsand those with similarlevels of education.This is contrary to thenational view that hasdeveloped, proving thatwe need to abandon thecurrently prevalent,negative stereotypes.
This analysis alsoshows we employ teachersfor pay that is well belowthe market rate for theirlevels of prose, document,and quantitative problemsolving. With theimpending shortage ofteachers and the apparentcompetitiveness of theirskills, we need to givemore attention to whatwe pay them, and torecognize the manyoptions these capablepeople have in the Ameri-can marketplace.
26

27
28

29
30

31

32

04202-15972 • S39M7 • Printed in U.S.A.I.N.204911